Article

Poultry Litter Biochar as a Gentle Soil Amendment in Multi-Contaminated Soil: Quality Evaluation on Nutrient Preservation and Contaminant Immobilization

Department of Forestry and Natural Resources, National Ilan University, Ilan 26047, Taiwan
*
Author to whom correspondence should be addressed.
Agronomy 2022, 12(2), 405; https://doi.org/10.3390/agronomy12020405
Submission received: 7 January 2022 / Revised: 4 February 2022 / Accepted: 4 February 2022 / Published: 6 February 2022
(This article belongs to the Special Issue Environmental Ecological Remediation and Farming Sustainability)

Abstract

:
Poultry litter biochar (PLB) has great potential for carbon (C) sequestration, which has been confirmed in the previous study. The promising potential of PLB for nutrient preservation and contaminant immobilization, however, has not been well studied. A multi-contaminated soil, mainly contaminated by chrome (Cr), copper (Cu), nickel (Ni), and zinc (Zn) was selected for this short-term incubation study. The purpose of this study was to evaluate the effects of PLB after incubation on the release of available nutrients (phosphorus, P; potassium, K; calcium, Ca; magnesium, Mg) and on the solubility of Cr, Cu, Ni, and Zn. The results of 56-day incubation indicated that high-temperature pyrolysis PLB (>400 °C) has great potential to raise soil pH, electrical conductivity (EC), and concentrations of P, K, and Mg; however, maintenance of lower Cr and Cu concentrations and a decline in Ni and Zn concentrations were also observed. The solubility of Cr, Cu, and Ni increased with dissolved organic carbon (DOC) increased, suggesting co-mobilization occurred. The solubility of Zn decreased with increased pH, suggesting adsorption by PLB and/or soil. We recommend the use of 5% high temperature pyrolysis PLB (500 and 600 °C) as a gentle soil amendment to achieve C sequestration, provide available nutrients, maintain low available concentrations of Cr/Cu, and reduce Ni/Zn availability.

1. Introduction

The high concentration and excessive accumulation of heavy metals (HMs) in agricultural soil have a negative impact on plants, human health, and environmental quality, resulting in increased absorption of metals by crops, thereby affecting food quality and safety and having a major impact on public health [1,2,3,4]. Many ex situ remediation options can be used for contaminated soil, including soil washing, excavation, and electrokinetic [5,6,7,8], but these remediation options are expensive and damage the soil quality [9,10,11]. In addition to the role of biochar in increasing carbon storage and influencing carbon dioxide emissions, biochar has been shown to improve the soil quality and stabilize HMs [12,13]. Many research reports on the use of various organic and inorganic additives to fix HMs have been proposed, including plant- and animal-derived biochars and lime-based materials [14,15,16,17,18]. Due to the low content of extractable nutrients, plant-based biochar is considered a soil conditioner rather than a fertilizer [16]; in contrast, biochar from manure can release its P, K, and N (nitrogen) content and function as a soil fertilizer and conditioner. Biochar derived from plant residues has been applied to soil to fix heavy metal (HM) pollutants [14,19]. In addition, P-rich biochar has shown great potential to reduce the mobility and availability of metals in water and soil contaminated by HMs [16,20]. Therefore, biochar derived from animal wastes has become a HM stabilizer in contaminated soils [21,22,23]. Two functions could be postulated for biochar [24]: as a soil conditioner by increasing cation exchange capacity (CEC), pH, and water retention; and as soil fertilizer by sequestering toxic HMs and gradually releasing limiting nutrients. In addition to high pH and CEC, the microporous structure and active functional groups of biochar are also important characteristics for immobilizing HMs [25,26,27].
In the alkaline soil without broiler litter-derived biochar, most of the lead (Pb) (II) is retained, more than half of the added cadmium (Cd) (II) and Ni (II) are still soluble, and it is observed that the concentration of soluble Cd (II) and Ni (II) decreases with an increasing dose of broiler litter biochar from 5% to 20%, which proves that adding broiler litter biochar to the soil can enhance the fixation of HMs [28]. Comis [29] reported that PLB binds certain toxic chemicals such as copper, cadmium, and zinc from water. The release of nutrients and metal ions from poultry litter-derived carbon does not pose a risk of secondary water pollution [30]. Biochars can immobilize HMs, such as Zn, Pb, and Cd, thereby reducing their phytoavailability and toxicity to plants by increasing soil pH [31] and CEC [32]. Choppala et al. [33] reported that the addition of chicken manure biochar can effectively reduce the bioavailability of Cr because it reduces Cr mobility (immobilizes Cr (III)) and speciation from Cr (VI) into Cr (III). Regarding the results of sequential fractionation schemes, bioavailability extraction, and leaching procedures, pyrolysis at 500 °C is recommended as a means to reduce Cu/Zn instability, and poultry manure is more suitable for pyrolysis treatment [34]. The study results of Sehrish et al. [35] showed a significant decline in the bioavailable Cr concentration (diethylenetriaminepentaacetic acid, DTPA-extraction) with an increasing PLB concentration, especially at a 5% application rate in soil. In another study, the application of PLB reduced the mobility of Cu, Cd, Pb, and Zn, and as the application rate of PLB increased in the HM-contaminated soil, a decrease was observed in mobility [32]. Regardless of the feedstock (switchgrass and poultry litter), both soil organic carbon (SOC or OC) and pH increased as the rates (from 0% to 4%, w/w) of biochar increased, which significantly decreased the HMs’ (Zn, Pb, and Cd) bioavailability (p < 0.01) [4]. However, before large-scale application, the efficiency of biochar from different feedstocks in immobilizing soil HMs must be carefully evaluated [36,37], because an increased amount of biochar may either significantly reduce the availability of HMs or make no difference, depending on the type of biochar and the type of HM [37,38,39,40,41].
In the previous study [42], we concluded that PLB pyrolyzed at more than 400 °C can be considered a mature substrate and has a higher potential to sequestrate C in acidic soil. We further suggested that a low pyrolysis temperature PLB, within 400–600 °C, with a 1–5% rate would be appropriate to sequestrate soil C and to reduce soil salinization. However, except for increasing the carbon sequestration as a gentle soil amendment, PLB should have potential for providing essential nutrients and reducing the available concentrations of HMs in multi-contaminated soil. Therefore, a laboratory incubation experiment using PLB was performed in this study. This study mainly focused on the effect of PLB on available nutrients and available HMs, rather than total concentrations. The objectives of this work were (1) to investigate the effects of increased rate (1%, 5%, and 10%) applications of PLBs pyrolyzed at different temperatures (200, 300, 400, 500, and 600 °C) on the available nutrients and available HMs release, and (2) to evaluate the impacts of these PLBs on HM solubility in multi-contaminated soil. The data obtained in the present study were then used to estimate the potential of such combinations of the PLB type and rate in order to improve/supply the soil’s available nutrient content and maintain/reduce the soil’s HM solubility relative to the control. We hypothesized that the addition of PLB to multi-contaminated soil could be achieved as a gentle soil amendment for assisting sustainable soil management, aiding in the achievement of multiple Sustainable Development Goals (SDGs), maximizing the benefits of PLB applications, and minimizing the potential environmental risk. Most importantly, it could help in recovering soil functions and reusing soil for agricultural purposes.

2. Materials and Methods

2.1. Studied Soil and Analyses

The studied soil was a multi-contaminated rural soil in the Changhua prefecture of central Taiwan, which is heavily polluted by HMs due to factories illegally draining waste water, and the major contaminants include chromium (Cr), copper (Cu), nickel (Ni), and zinc (Zn). The surface soil samples (0–15 cm depth) were collected from a paddy field. The detailed soil characteristics, including soil pH (by soil-to-deionized water ratio of 1:1 (g mL−1)), soil texture (by the pipette method), electrical conductivity (EC) (by the saturation extract of the soil sample), and exchangeable bases (by the ammonium acetate method at pH 7), were determined in a previous study [42]. Briefly, the studied soil was an acidic (pH 5.96), clay loam-textured, and nutrient-poor soil. However, for examining the associated HM concentration, the additional arsenic (As), cadmium (Cd), and lead (Pb) concentrations in the studied soil were also determined. The total and extractable contents of As, Cd, Cr, Cu, Ni, Pb, and Zn in the studied soil were determined respectively by aqua regia digestion [43] and by 0.1 N HCl extraction [44]. The concentrations of As, Cd, Cr, Cu, Ni, Pb, and Zn were determined by inductively coupled plasma optical emission spectrometry (ICP-OES) (PerkinElmer, Inc., Optima 2100DV, Waltham, MA, USA).

2.2. Studied Poultry Litter Biochars (PLBs) and Analyses

The feedstock of PLB was broiler litter manure with rice husk bedding. After pelleting, the poultry liters were slowly pyrolyzed at 200, 300, 400, 500, and 600 °C, namely, P2, P3, P4, P5, and P6. These PLBs were not pre-washed to remove soluble salts, but were homogenized and ground to <2 mm for analysis and used for the experiment. The production, product yields, and some characteristics of the studied PLBs were described and determined in a previous study [42] (Table S1). In addition, two extraction solutions were used, 0.1 N HCl [44] and 0.01 M CaCl2 [45], for extracting the available contents of Cd, Cr, Cu, Ni, Pb, and Zn, and the contents were determined by ICP-OES. The 0.1 N HCl extraction was performed to determine the total potentially labile soil HM concentration, while the 0.01 M CaCl2 selective extraction was performed to assess the soil HM bioavailability [46,47]. In addition, the five PLBs were digested using a H2O2/H2SO4 mixture [48], and the total contents of Cd, Cr, Cu, Ni, Pb, and Zn were determined using ICP-OES. Additionally, for examining the structure of the biochar materials, thermogravimetric analysis was used, the preferred method suggested by several studies [49,50,51,52]. Thermal analysis of the five PLBs was performed using a TG–FTIR instrument consisting of a thermogravimetric analyzer (NETZSCH TG 209F3, NETZSCH-Gerätebau GmbH, Selb, Germany) and a Fourier-transform infrared spectrometer (Bruker Tensor Ⅱ, Bruker Corporation, MA, USA). A sample mass of 3.5–7 mg was used in this study. The sample was heated from 30 to 700 °C at a nitrogen flowing rate of 20 mL min−1 and a heating rate of 10 °C min−1. The stainless steel transfer pipe and the gas cell in the FTIR were both heated at a constant temperature of 200 °C to minimize any secondary reactions. The volatiles released during the pyrolysis of poultry litter and their blends were detected online by FTIR, in which the IR spectra were recorded at 4000–400 cm−1 with a resolution of 1 cm–1. The experimental results of TG and FTIR were recorded automatically by a computer (Supplementary Materials, Figure S1).

2.3. Incubation Experiment

The growing period of short-term crops is about two months in Taiwan; therefore, we selected a duration of 56 days for incubation to study the short-term effects of adding PLB. The detailed 56-day incubation experiment was reported in the previous study [42]. The 16 treatments for the studied soil included: (1) Natural soil + 0% biochar (control); (2) soil + 1% biochar (P2-1, P3-1, P4-1, P5-1, and P6-1); (3) soil + 5% biochar (P2-5, P3-5, P4-5, P5-5, and P6-5); and (4) soil + 10% biochar (P2-10, P3-10, P4-10, P5-10, and P6-10). The 10% application rate was chosen to help identify an upper level of soil detriment by biochar application. For each treatment, the incubation test was conducted with three replicates per treatment (n = 48). Next, 25 g of the mixed soil sample was incubated in a 30 mL plastic container inside a 500 mL plastic jar, sealed with a rubber bung, and incubated in a randomized block design at 25–27 °C for 56 days. The soil moisture content was adjusted to 60% of the field capacity before incubation and was maintained throughout the experiment using repeated weightings. The field capacity was estimated by soil maximum water holding capacity (saturated soil paste). At the end of incubation, soils including the control and PLB-amended were air-dried and ground (< 2 mm). Soil samples were extracted by water extraction (soil/deionized water = 1:2.5) for extracting available nutrients and available HMs. After shaking 16 hr (oscillation amplitude: 8.0 cm, frequency: 120 cycles min−1), the mixtures were centrifuged for 15 min at 3000 revolution per minutes (rpm) and filtered through a 0.45 μm cellulose acetate membrane filter. All soil extracts were stored at 4 °C prior to analysis. Each treatment was performed in triplicate. pH, EC, P, K, Ca, Mg, DOC, and available Cr, Cu, Ni, and Zn were determined at the same extraction so as to evaluate the effects of PLBs on nutrient preservation and contaminant immobilization, and to investigate the interactions between soil parameters. The content of DOC was determined using an Analytical Aurora Model 1030W (O·I· Corporation/Xylem, Inc., College Station, TX, USA). The contents of P, K, Ca, Mg, Cr, Cu, Ni, and Zn were determined using ICP-OES.

2.4. Statistical Analysis

Statistical analyses (calculation of means and standard deviations and differences of means), Pearson’s correlation coefficient (r), canonical discriminant analysis (CDA), and principal component analysis (PCA) were performed using the Statistical Analysis System (SAS) 9.4 package (SAS Institute Inc., SAS Campus Drive, Cary, NC, USA). CDA and PCA both were used for factor extraction to determine the associations between the measured parameters and to identify complex cause-and-effect interrelationships. The results of normal distribution tests of all datasets are listed in Table S2. The percentages of pH, EC, P, K, Ca, Mg, DOC, Cr, Cu, Ni, and Zn that decreased or increased due to PLB addition were calculated by the difference between the PLB-amended treatments and the un-amended control [53]. The arithmetic mean of the water extraction properties was calculated. Results were analyzed by one-way analysis of variance (ANOVA) to test the effect of each treatment. Means that were significantly different were compared by least significant difference (LSD) based on the t-test at the 5% probability level. Two-way ANOVA using the general linear model (GLM) procedure was used to test the biochar pyrolysis temperature, addition rate, and their effects on pH, EC, P, K, Ca, Mg, DOC, Cr, Cu, Ni, and Zn. Values shown in graphs and text are mean ± 1 standard deviation (SD).

3. Results

3.1. Heavy Metal Concentration of the Initial Soil and PLBs

The contaminated HMs mainly included Cr, Cu, Ni, and Zn, with total concentrations of 1017, 488, 901, and 824 mg kg−1, respectively (Table 1). According to the regulations of the Soil and Groundwater Pollution Remediation Act of the Environmental Protection Administration (EPA) of the Executive Yuan, R.O.C. (Taiwan), the “Soil Pollution Control Standards” (https://law.moj.gov.tw/LawClass/LawAll.aspx?pcode=O0110005) (in Chinese) (accessed on 24 November 2021) suggest that the thresholds of Cr, Cu, Ni, and Zn are 250, 200 (food crop farmland), 200, and 600 (food crop farmland) mg kg−1, respectively.
The amount of the total potentially labile HM concentration, determined by 0.1 N HCl, indicated that the contents of HCl-Cr, Cu, Ni, and Zn were the highest in P2 (Table 1). In addition, the content of all elements evidently decreased with the pyrolyzed temperature increased. The soil HM bioavailability, determined by CaCl2 0.01 M selective extraction, indicated that the contents of CaCl2-Cr, Cu, and Zn were the highest in P2, and similarly tothe change of 0.1 N HCl extraction, all elements evidently decreased as the pyrolyzed temperature increased. The total content of the elements showed an increasing trend with increasing pyrolyzed temperature. The total content ranged from 271 to 672 mg Cr kg−1, from 57 to 143 mg Cu kg−1, 3.18 to 7.17 mg Ni kg−1, and 304 to 752 mg Zn kg−1, respectively.

3.2. Results of the two-way ANOVA and CDA

At the end of the incubation, the results of the two-way ANOVA indicated that the pH, EC, DOC, and concentrations of K, Ca, Cr, Cu, Ni, and Zn by water extraction were significantly affected by rate and treatment (p < 0.0001), and by the interaction of rate × treatment (p < 0.001–0.0001) (Table 2). However, the P and Mg concentrations were only significantly affected by the rate (p < 0.0001).
Furthermore, the significance test of the mean values between the control and the three rates indicated that, in general, pH, EC, DOC values, and the concentrations of P, K, Ca, Mg, Cr, and Cu significantly increased with an increasing addition rate (Table 3).
On the contrary, the Zn concentration decreased significantly with the increase in the PLB rate. However, compared to the control, the addition of 1% has no significant effect on the P concentration. The Ni concentration showed a significant decrease in the order: 10% > control > 1% > 5%. The Ca concentration showed no significant difference between 5% and 10%. In addition, compared to the control, the five PLBs studied showed a significant increase in all soil parameters except Ni and Zn (Table 3). The Zn concentration of the five PLBs and the Ni concentration of P4, P5, and P6 were significantly lower than those of the control. Comparing the five PLBs, the average of the three rates indicates that the pH and EC values and P and Mg concentrations did not increase significantly with the increase in pyrolysis temperature. The K concentration showed a significant increase with the increasing pyrolysis temperature. On the contrary, the concentration of Ca, Cr, Cu, Ni, and Zn significantly decreased as the pyrolysis temperature increased, but differences between P5 and P6 for Ca, Cr, Ni, and Zn were insignificant.
Figure 1 shows that the chemical behavior of the soils studied can be distinguished from one another. The canonical discriminant function 1 (Can1) explained 82.5% of the variability in chemical behavior across the 16 treatments, Can2 explained 11.4%, and the two functions together explained 93.9%. Can1 discriminated the treatments into four groups: The P5-10 and P6-10; P2-10, P3-10, P4-10, P5-5, and P6-5; P2-5, P3-5, and P4-5; control, P2-1, P3-1, P4-1, P5-1, and P6-1 (Figure 1). The pH, P, K, and Zn were most important for the discrimination of the soils based on Can1 (Table S3). For the discrimination of the soils based on Can 2, the DOC, Ca, Cr, and Cu were the main parameters responsible. In this study, PCA was performed to investigate the important components in the large data set, and the different parameters at the end (day 56) of the incubation were introduced as the analysis variables in the PCA, including cumulative CO2-C release [42]. The results are shown in Table 4 and Figure S2. From the PCA, the PC1 and PC2 explained 64.2% and 30.1% of the total variance, respectively. The PC1 had significantly positive correlations with the contents of all parameters (p < 0.0001), except for no significant correlation with Ni (p = 0.0049) and significantly negative correlation with Zn; cumulative CO2-C, Cr, Cu, Ni, and Zn content were significantly positively correlated with PC2, but K had significantly negative correlation with PC2. PCA revealed three groupings: Group 1 (Zn), Group 2 (Ni, Cr, Cu, cumulative CO2-C, DOC, and Ca, and Group 3 (P, Mg, pH, EC, and K). The control and the 1% addition of P2-P6 were clustered near Group 1, the 5% and 10% additions of P2 and P3 near to Group 2, and the 5% and 10% additions of P4-P6 near to Group 3.

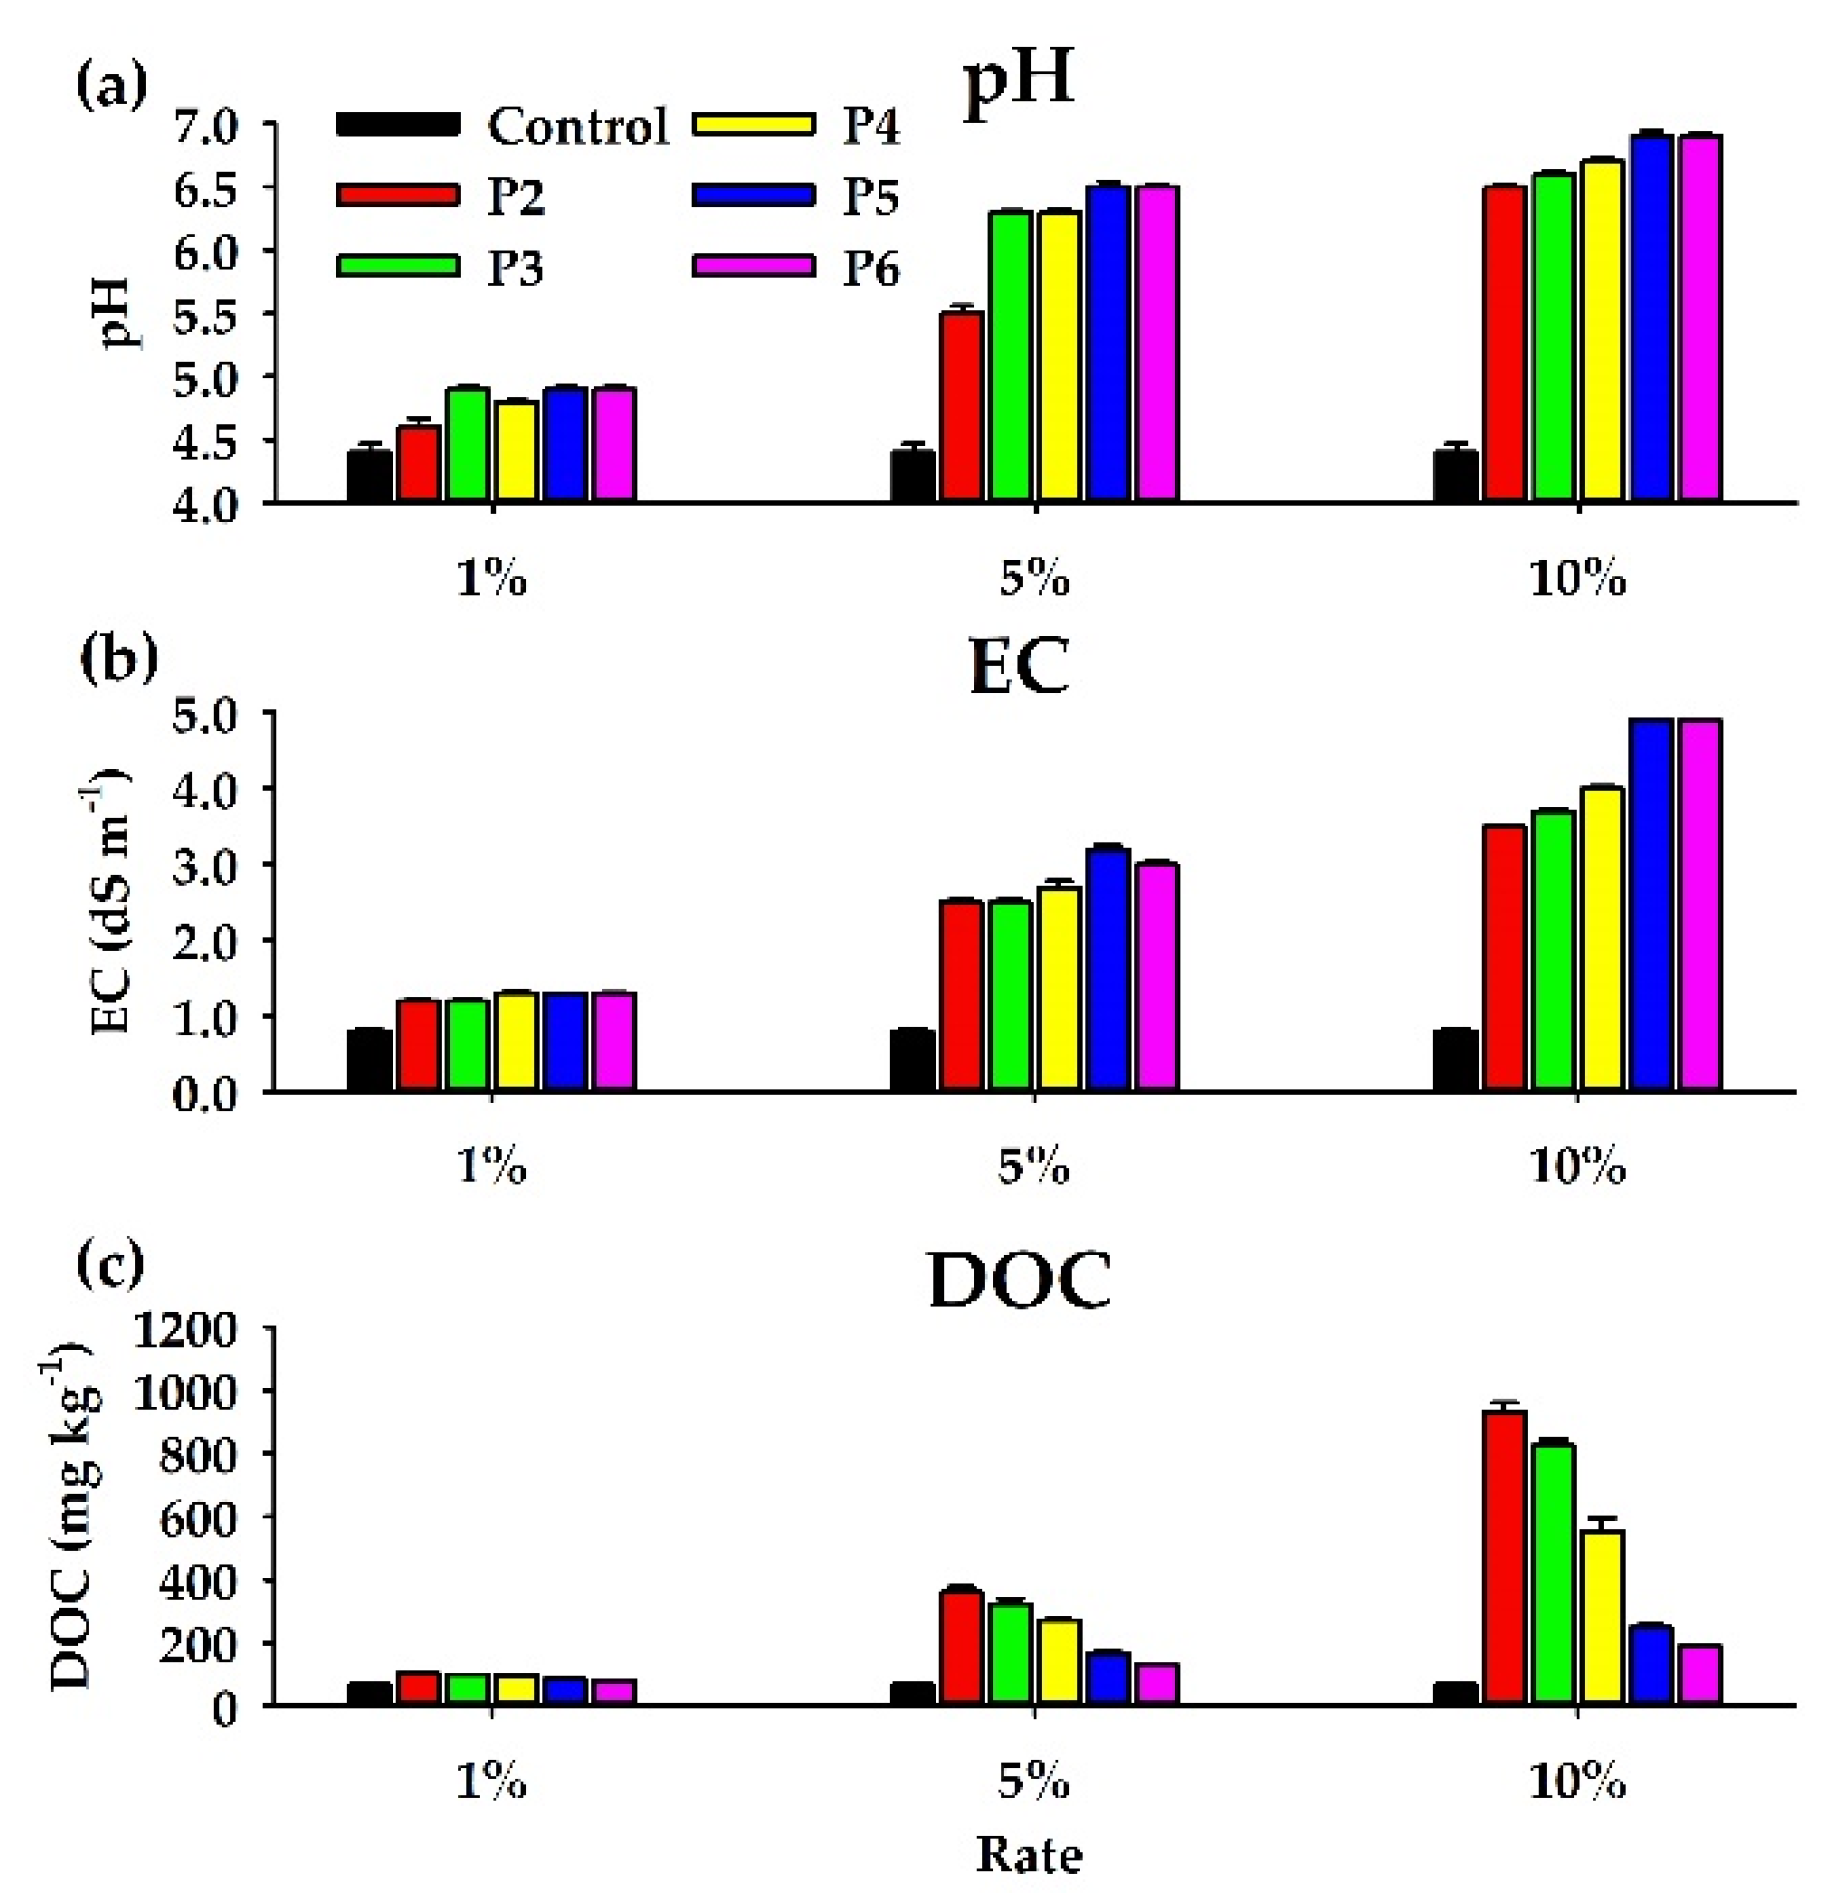
3.3. pH, EC, and DOC

Both the P5-10 and P6-10 treatments had the highest pH (pH 6.9), increasing pH 2.5 units compared to the control (Figure 2a and Table S4), followed by P4-10, P3-10, and P2-10. In general, the pH increased 0.4, 1.7, and 2.3 pH units on average for additions of 1%, 5%, and 10%, respectively, compared to the control (Table 3). In addition, the pH values of the P2, P3, P4, P5, and P6 treatments increased by 1.1, 1.5, 1.5, 1.4, and 1.7 pH units on average, respectively, indicating that high-temperature pyrolysis PLB has higher lime potential and can increase soil pH.
The PLBs studied contained higher nutrients (bases) and the addition of those PLBs would result in a significant increase in EC. The increase in the extraction solution EC value was much higher than the pH, which significantly increased with the addition rate, being the highest in the P5-10 and P6-10 treatments (Figure 2b and Table S4). Both the higher pH and EC suggest the potential for soil nutrient enrichment of the treatment. Therefore, this combination of PLB and addition rate can be used as a suitable gentle soil amendment to provide some of the nutrients in contaminated soil. Moreover, the DOC value of 1% PLB treatment showed significant increase compared to the control. It was very significantly higher than the control after addition of 5% and 10% PLB treatment, and decreased very significantly with increasing pyrolysis temperature (Figure 2c and Table S3).

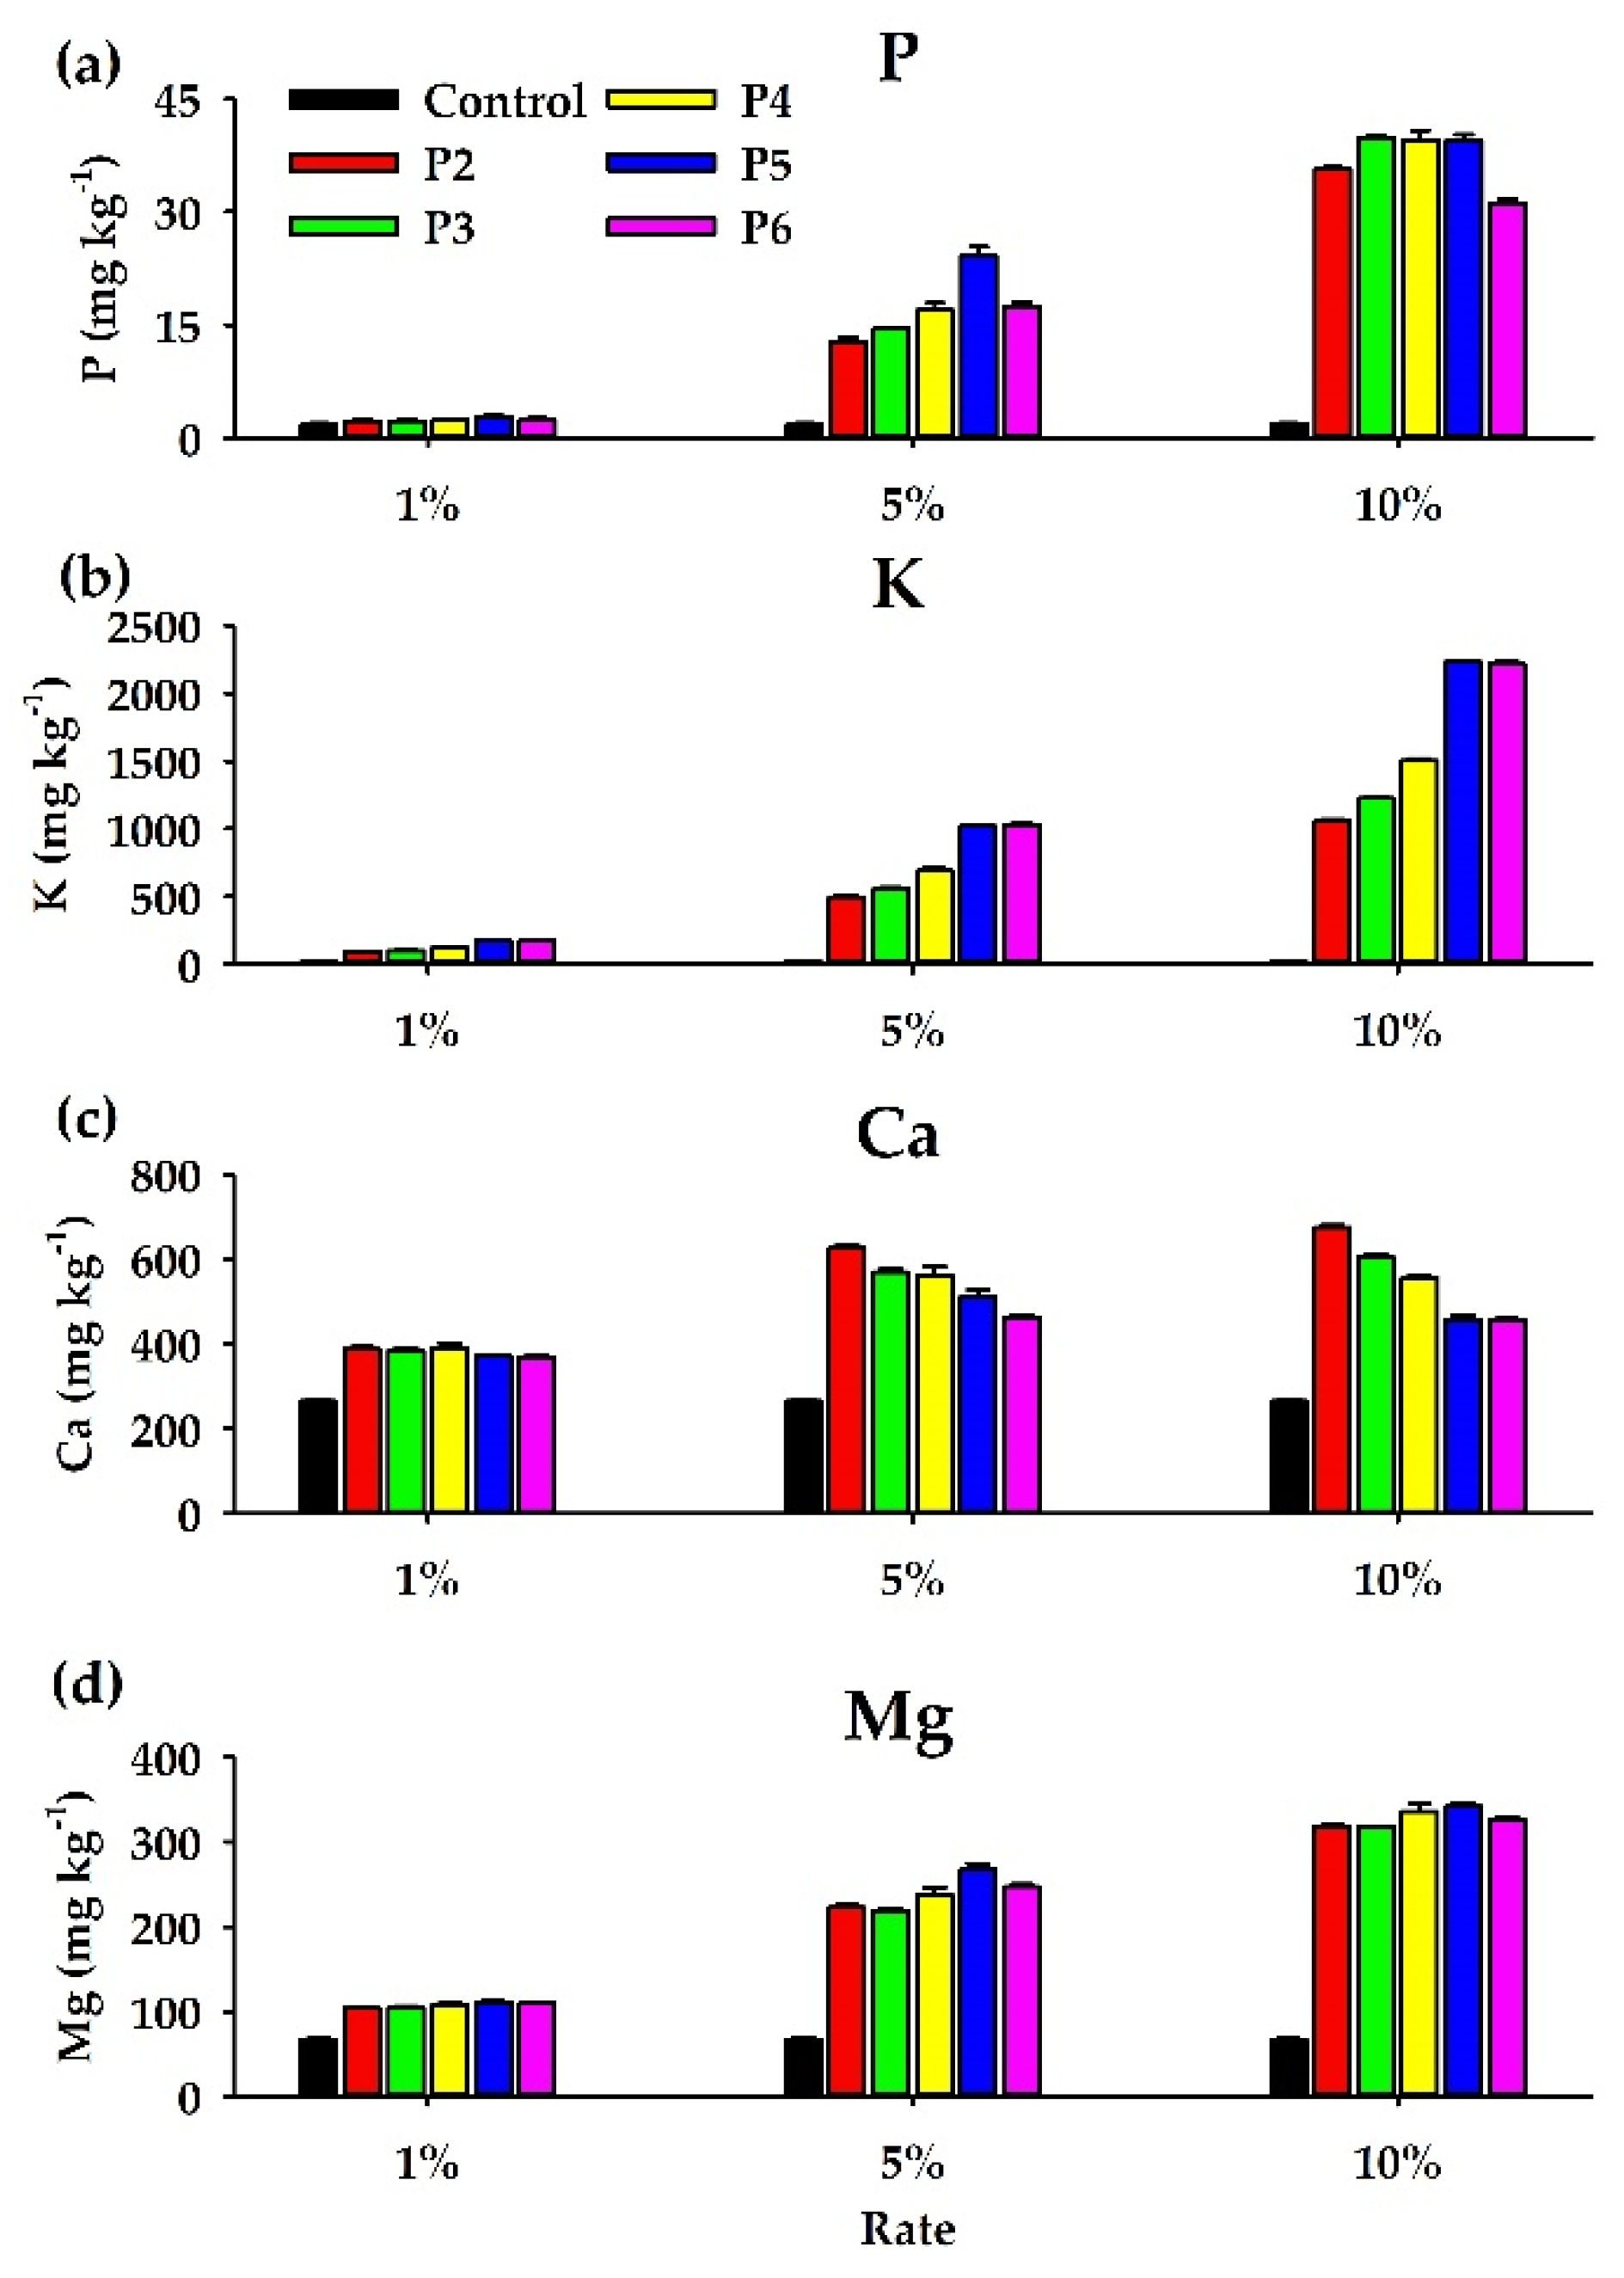
3.4. Available Nutrients (P, K, Ca, and Mg)

A large amount of available P, Ca, Mg, and especially K were added with the PLBs, and significantly increased as the addition rate increased (Figure 3 and Table S5). The values of P for a 1% addition of the five PLBs showed no significant difference to the control, but increased 27–56% (Figure 3a and Table S5). When adding 5%, the P concentration increased significantly from P2 to P5, but the P6 treatment showed a significantly lower level than P5. When adding 10% PLB, the P concentration showed no significant difference between the P3, P4, and P5 treatments, while the value of P6 treatment was significantly lower than P2~P5. The increase in the K concentration was very considerable: at least 3.9 times higher than that of the control (Figure 3b and Table S5). The K concentration at additions of 1%, 5%, and 10% all showed very significant increases with an increase in the pyrolysis temperature, but no significant difference between P5 and P6. Significant increases in the Ca and Mg concentrations could also be found for the three addition rates of the PLBs compared to the control. However, when comparing the five PLBs, the Ca concentration was not much different when 1% was added, but when 5% and 10% were added, it decreased significantly with the increase in pyrolysis temperature (Figure 3c and Table S5). There was no significant difference in the Mg concentration among the five PLBs upon addition of 1% (Figure 3d and Table S5). After 5% and 10% were added, the Mg concentration increased significantly from P2 to P5, but the concentration in P6 was significantly lower than that in P5.

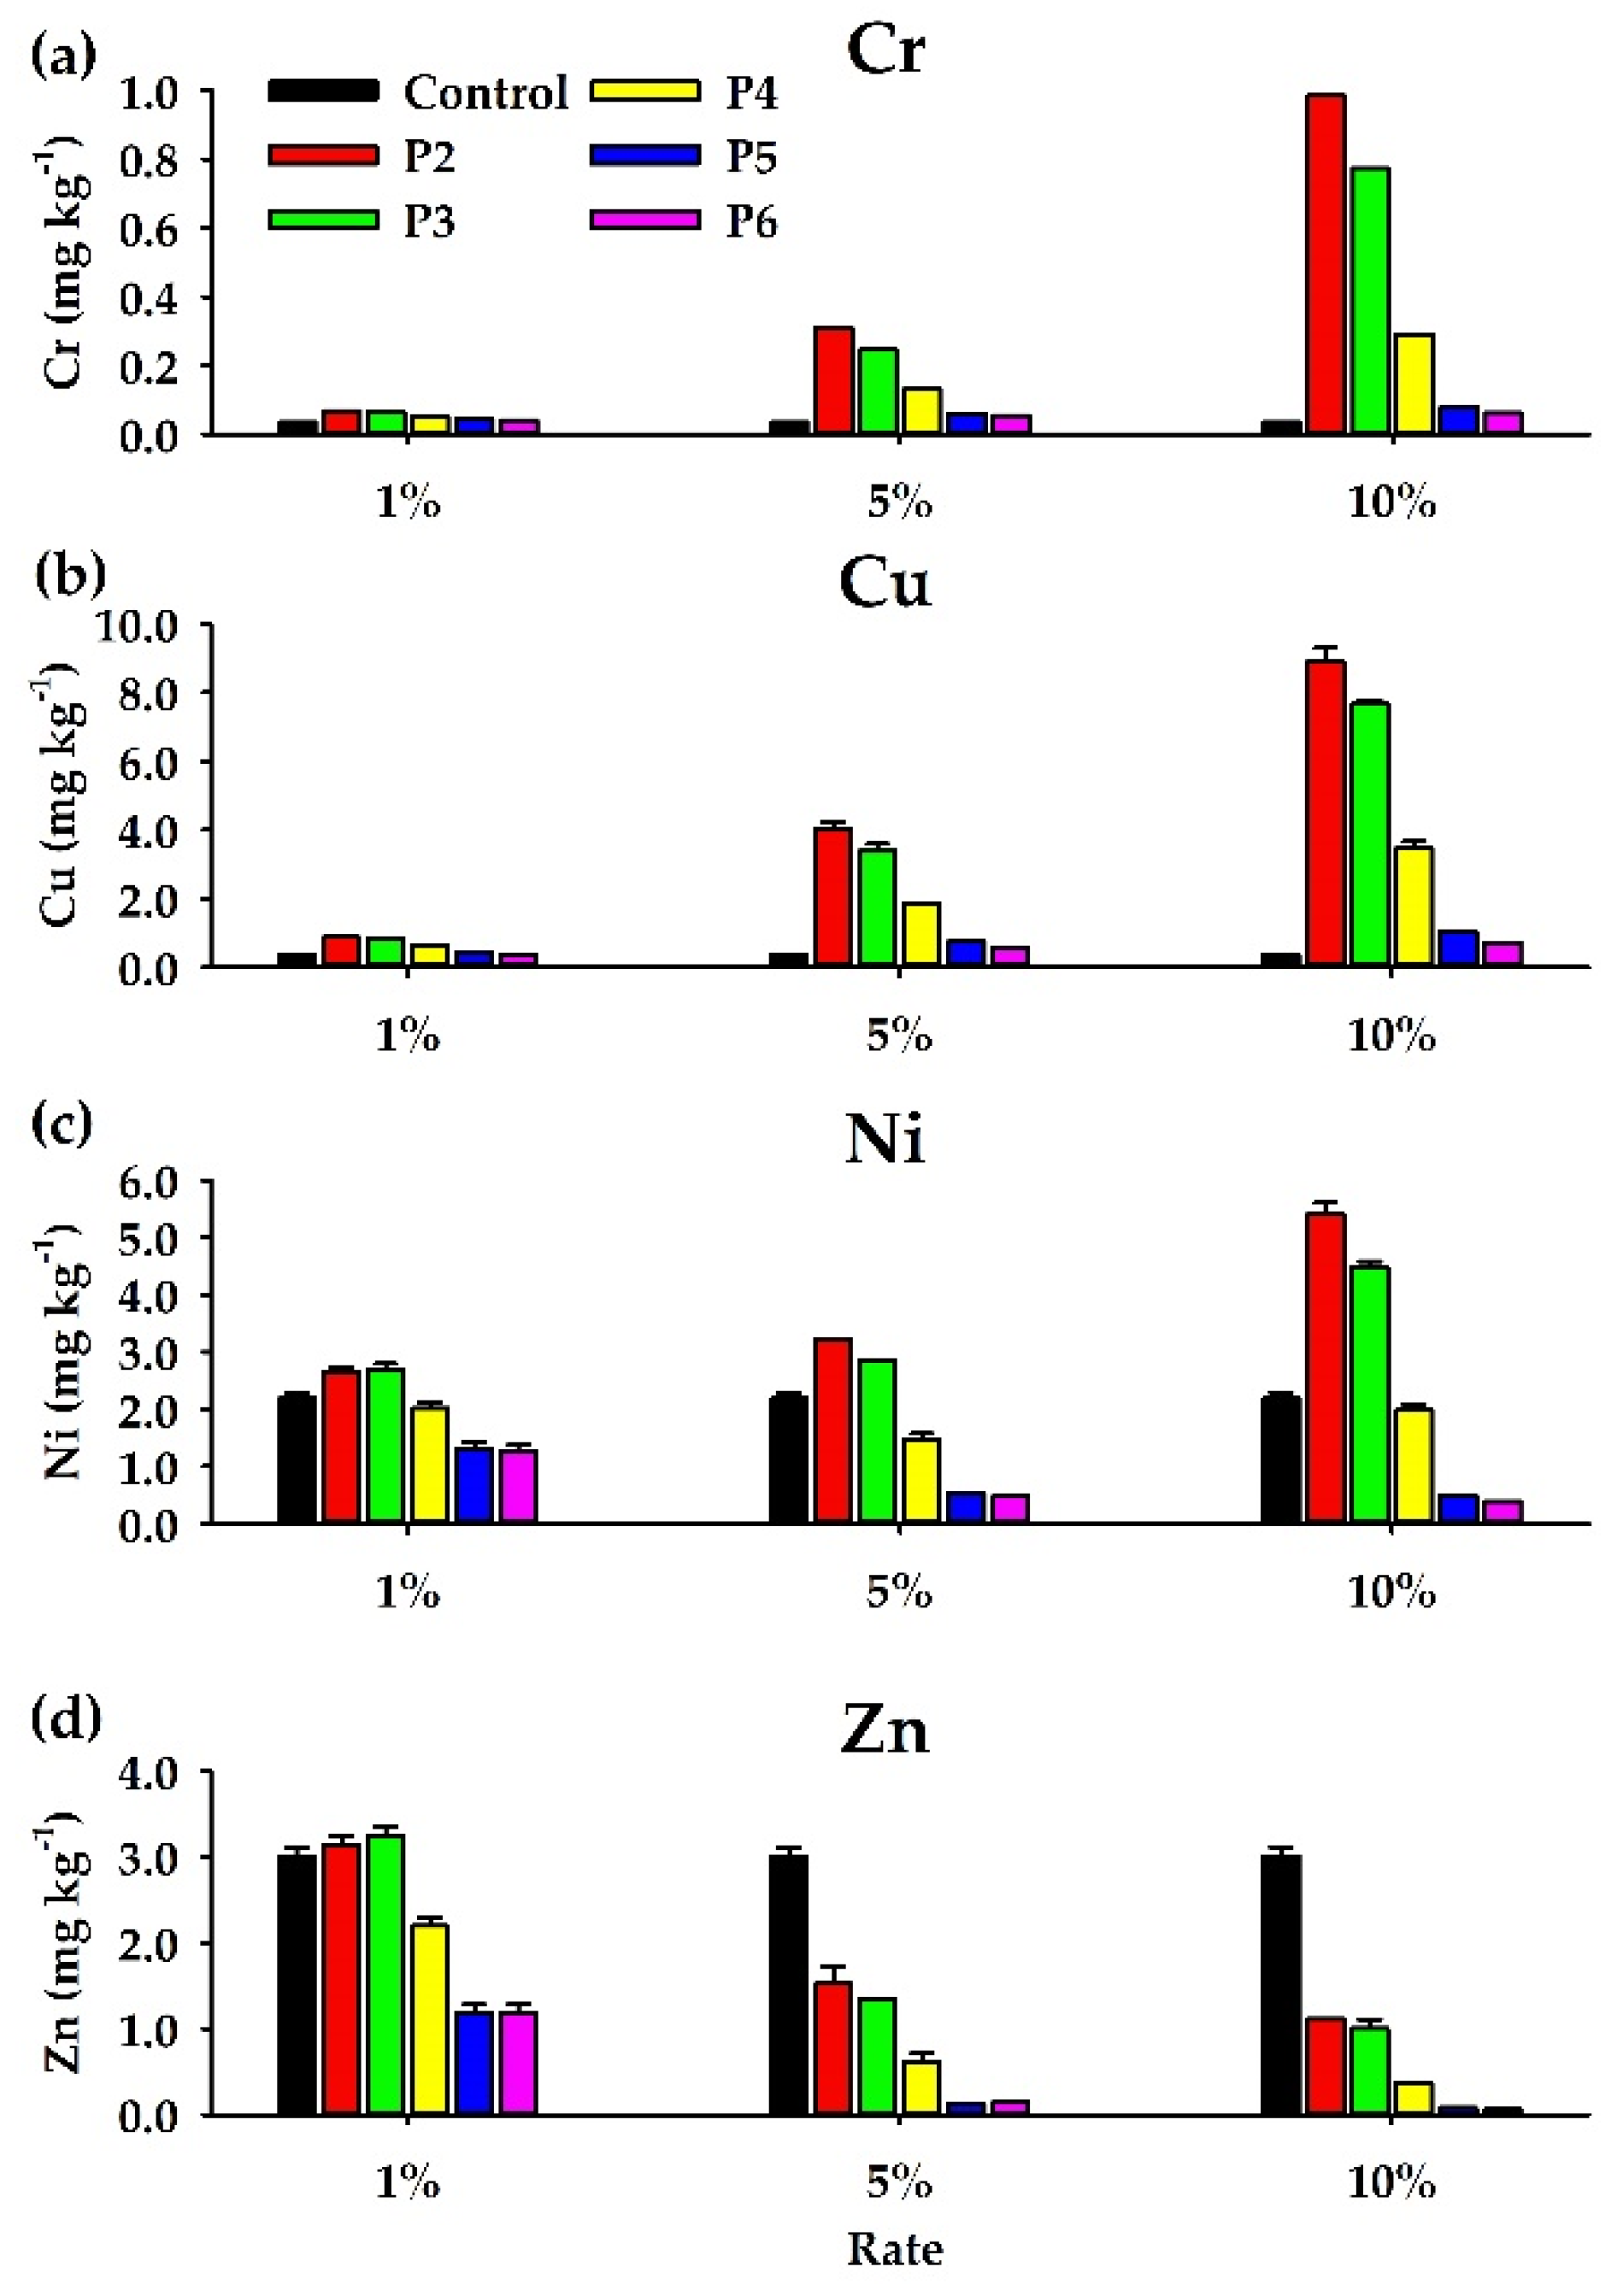
3.5. Cr, Cu, Ni, and Zn Concentrations

There was no significant difference in the Cr concentration between the control and P4, P5, and P6 upon the addition of 1%, but significant increases were observed in P2 and P3 (Figure 4a and Table S6). Upon the addition of 5%, the Cr concentration increased significantly for P2–P4 compared to the control, while no significant difference between the control and P5 and P6 were observed; however, there was a significant decrease from P2 to P4. Similar trends can be found, albeit slightly varied, after 10% was added, that is, significantly decreasing from P2 to P5, while no significant difference between the control and P6 was observed. As shown in Figure 4b and Table S6, the trends in the Cu concentration were similar to those of Cr, but the highest concentration was 10 times higher than that of Cr. The Ni concentrations of P4, P5, and P6 at additions of 1%, 5%, and 10% all showed significantly lower levels than the control (Figure 4c and Table S6), while they were much lower in the P5 and P6 treatments than in P4. The P2 treatment showed significantly higher Ni values than P3 after 5% and 10% were added, but no significant difference upon 1% addition. There was no significant difference between the P5 and P6 treatments after the three addition rates. In addition, the trend in the Zn concentration was similar after adding 5% and 10%, that is, all PLBs were significantly lower than the control, and decreased significantly with the increase in pyrolysis temperature (Figure 4d and Table S6). When adding 1%, compared to the control, the Zn concentration in P3 increased significantly, but there was no significant increase in P2. However, there was a significant decrease in P4, P5, and P6.

4. Discussion

4.1. Effects of the PLB Treatments on pH, EC, and DOC

At the end of 56 days of incubation, the water extraction solution pH was significantly affected by the addition rate and pyrolysis temperature of the PLBs compared to the control, and high-temperature pyrolysis PLBs had higher lime potential and could increase the soil pH (Figure 2a and Table S4). Pariyar et al. [52] pointed out that a good neutralization effect could be achieved by using high-pH biochar and in the presence of calcite. The pH of the five PLBs studied were in decreasing order of P6 > P5 > P4 > P2 > P3 (Table S1), and the high-temperature pyrolysis PLBs (e.g., P5 and P6) had obvious degradation of CaCO3 at >650 °C (Figure S1a), both confirming that higher-temperature pyrolysis PLBs (>500 °C) has a greater liming potential than lower-temperature PLBs (<400 °C) and a higher neutralizing effect when applied to soil. The EC values were significantly positively correlated with pH (r = 0.95, p < 0.0001) (Table 4), on average being 1.28, 2.67, and 4.9 dS m−1 for additions of 1%, 5%, and 10%, respectively (Table 3). For the P2, P3, P4, P5, and P6 treatments, the EC values were, on average, 2.40, 2.47, 2.67, 2.92, and 3.07 dS m−1, respectively. The results were indicative of salinization after the 5% addition, especially for P5 and P6 due to the higher EC in the raw materials after shaking biochar-water mixtures for 24 h (Table S1). The biochar and/or compost addition could increase soil EC value, which could be attributed to the release of basic cations from biochar and compost [54,55]. In this study, the EC value had a significant (p < 0.0001) positive correlation with P (r = 0.93), K (r = 0.98), Ca (r = 0.59), and Mg (r = 0.97), indicating that K and Mg have great contributions to EC extraction (Table 5). Furthermore, the results are consistent with the K and Mg contents of the raw PLBs (Table S1), that is, high-temperature pyrolysis PLBs with higher K and Mg contents could result in a higher EC of PLB-amended soils.
Since the important factors controlling the decomposition of soil organic matter (SOM) are substrate availability and microbial activity, DOC can be used as an indicator of total available carbon [56]. The DOC value showed a significant (p < 0.0001) positive correlation with pH (r = 0.56), but a less significant one with EC (r = 0.51) (Table 5). As shown in Figure 2c and Table S4, the DOC value after the addition of 5% and 10% PLB decreased very significantly with the increase in pyrolysis temperature. The results of the cumulative water-extractable organic C (WEOC) of the five PLBs after five washings also showed evident decrease with the increasing pyrolysis temperature [42]. The cumulative WEOC values were 33.8, 41.8, 37.6, 23.9, 3.63, and 2.55 g C kg−1 biochar for PL, P2, P3, P4, P5, and P6, respectively. Furthermore, the trends in DOC shown in Figure 3c are similar and consistent with the results of the cumulative CO2-C release [42], and the DOC values have a significant (p < 0.0001) positive correlation with the cumulative CO2-C (r = 0.97). The addition of low-temperature PLB could supply a higher labile C content and thus increase the C mineralization in PLB-amended soil, resulting in increasing organic matter decomposition derived from the PLB and increasing DOC content. The conversion of aliphatic carbon to more aromatic carbon with increasing pyrolysis temperature (Table S1) will thus reduce the labile carbon content. The addition of high-temperature PLB would result in a significant decrease in the DOC content in PLB-amended soil due to lower labile C content. For preventing soil C movement to microbial consumers, the sorption of DOC would reduce the SOC decomposition [40]. The DOC concentration has been shown to decrease in soils after woody-based biochar treatment (with or without litter), with a negatively related magnitude to biochar concentration [56]. On the contrary, Jiang et al. [57] pointed out that the addition of 10% biochar (corn straw) significantly increases the soil DOC concentration while decreasing SOC mineralization, and suggests that the addition of biochar results in a significant increase in pH and leads to higher DOC solubility. The present findings are similar to those of Jiang et al. [57]: with the increase of biochar addition rate, the DOC values of P2, P3, and P4 increased very significantly, and P5 and P6 increased significantly. However, SOC mineralization was consistent with DOC and showed a similar increasing trend [42].
In addition, soil clay content, ionic strength, and pH of soil water solution were all positively correlated with the adsorption capacity of soil dissolved organic matter (DOM) [58], because: (1) the clay fraction played a dominant role in adsorbing DOM; (2) Compared with higher pH, soil mineral surface with lower pH can adsorb more DOM molecules; (3) DOM adsorption capacity increases with the increase of ionic strength. In this study, the soils studied had a clay content of 33.1% and likely had a high absorption capacity for DOM, as confirmed by the DOC values after adding 1% PLB (Figure 2c). After the addition of 1%, the soil solution pH was approximately 4.0–5.0 for the control and the treatment (Figure 2a), allowing speculation that a higher DOM sorption occurred on amended and unamended soils (Figure 2c), similar to the suggestions of Shen [58], who indicated that the maximum DOM sorption occurs in soil at a pH of around 4–5 and decreases monotonically at higher pH values. However, after the addition of 5% and 10%, the pH value of the five PLB treatments were higher than pH 5.0, indicating the obvious decrease in DOM sorption, especially for the 10% addition. High-temperature pyrolysis PLB can supply more available cations, such as K, Ca, and Mg ions, and can thus increase the ionic strength of the soil solution and result in increasing the DOM adsorption capacity. Moreover, the negative surface charge of the soil minerals that adsorbed DOM decreased with the increase in the Ca2+ concentration, and in the presence of divalent cations, the degree of adsorption of DOM was greater than that in the absence or presence of monovalent cations [58]. In this study, the Ca2+ concentration decreased as the pyrolysis temperature increased (Figure 4c and Table S5), indicating that the degree of adsorption of DOM declined, confirmed by the DOC value of the soil solution decreasing with an increase in pyrolysis temperature. As shown in Table 5, the DOC was significantly (p < 0.0001) positively correlated with Ca (r = 0.81) and Mg (r = 0.66), but insignificantly with K. The stabilization of negatively charged organics by adsorption to positively charged cations can be attributed to an increase in organic matter solubility and/or negative charge [59]. We believe that this phenomenon may have occurred in our PLB-amended soils due to those PLBs containing very abundant exchangeable Ca2+ and Mg2+ ions (Table S1), and the release of such cations into soil solutions possibly formed Ca2+ and Mg2+ bridging with soil organic matter (SOM).

4.2. Effects of the PLB Treatments on the Available Nutrients (P, K, Ca, and Mg)

In Table S1, the concentrations of available P, K, Ca, and Mg showed a general increase at increasing temperature, similar to the suggestions of Ippolito et al. [60], who indicated that biochars produced from manure-based feedstocks increase the available nutrients, with the nutrient content generally increasing as the temperature increased. Compared to the control, the addition of 5% and 10% PLB led to a significant (p < 0.05) increase in the available P in the amended soil (Figure 3a and Table S5), similar to the results of Yang et al. [61], who reported the application of rice straw biochar at a 5% amendment. The current results confirm the suggestions of Angst and Sohi [62]. The abundant soluble P in the studied PLB during slow pyrolysis resulted in an increase in the available P content in biochar-amended soil. The addition of biochar affects soil P availability, which may be due to changes in soil pH [63], changes in P adsorption capacity [64], soil available P content (with or without P fertilizer), initial soil adsorption ability, and to controlling the adsorption mechanism (by Fe, Al and clay content compared to CaCO3) [65]. In addition, after biochar addition, the precipitation of P with Al and Fe decreased with increasing pH in acidic soil due to the increase of alkaline metal (Ca2+, Mg2+, and K+) oxides [65,66,67]. The increase in active alkaline metal oxides would result in a decrease in active Al3+ solubility [68]. As shown in Table 5, the concentrations of available P, K, Ca, and Mg were significantly (p < 0.0001) positively correlated with pH, EC, and DOC, except for K and DOC (Table 5). Within four nutrients, except for K and Ca, all showed significantly positive correlations between any two nutrients. In addition, biochar with a high pH and CEC is more effective in increasing soil P availability [61], but not evidenced in this study (Table 5). The pH of the PLBs showed an evident increase as the pyrolysis temperature increased; however, the CEC values of the PLBs were close to one another (Table 1). A higher addition rate (>5%) of PLB resulted in an abrupt increase in available P, and thus would increase the risk of P runoff and leaching in the field. Phosphorus surface runoff increases the risk of eutrophication of surface waters and, together with P leaching, enhances total P losses from agriculture.
Several physicochemical factors that affect the availability of biochar-derived K to plants include the solubility of K compounds in water and/or high ionic strength solutions, the extent and rate at which these compounds dissolve from biochar into soil, and soil properties such as texture, exchange capacity, pH and water content [69]. As shown in Table 5, the solution pH showed a significantly positive correlation with the available K, Ca, and Mg (p < 0.0001), which confirmed the previous suggestion. The increases in available K were very impressive, especially in the P5 and P6 treatments, being consistent with available K in raw PLBs (Table S1). The P5 treatment also resulted in a higher increase in available K compared to the other treatments. The highest increases in the available Ca and Mg were approximately 155% (P2–10) and 416% (P5–10), respectively, much lower than the available P and K. The 1% addition of the five PLBs showed no significant difference to the control, but increased 39–47% for Ca and 57–67% for Mg. The P2 and P5 treatments resulted in a higher increase in the available Ca and Mg, respectively, compared to the other treatments. The P and Mg contents experienced no significant differences between the five PLBs, but were significantly higher than the control, which could be due to similar concentrations of available P and Mg by Mehlich-3 extraction in the five PLBs (Table S1). Compared to the control, the K content of the five PLBs significantly increased with the increase in pyrolysis temperature, but the differences were not significant between P2 and P3 and between P5 and P6. On the contrary, the Ca content of the five PLBs showed significant decreases with the increase in pyrolysis temperature, and the differences were not significant between P3 and P4 or between P5 and P6. The available K content also showed an increasing trend with the increase in pyrolysis temperature, but was not similar between P2 and P3 or P5 and P6; in addition, the available Ca content showed increasing trends from P3 to P5, but was similar between P2 and P6 (Table S1).

4.3. Effects of the PLB Treatments on the Cr, Cu, Ni, and Zn Solubility in Soil

The solution pH and EC values only showed significant (p < 0.0001) negative correlations with Zn and insignificant negative ones with Ni (Table 5). On the contrary, pH was significantly (p < 0.01) positively correlated with Cr and Cu. Additionally, the Cr and Cu values also showed significant positive correlations with P (r = 0.57 and 0.58, respectively) and Ca (r = 0.75 and 0.81, respectively). The Ni value was positively correlated with Ca (r = 0.50). On the contrary, the Zn value showed significantly negative correlations with P (r = –0.71), K (r = –0.78) and Mg (r = –0.80), and was negatively correlated with Ca (r = –0.48). Within the four HMs, there was a very significantly (p < 0.0001) positive correlation between chromium, copper, and nickel (r = 0.99 for Cr and Cu; r = 0.84 for Cr and Ni; r = 0.85 for Cu and Ni).
The pH value, dissolved organic carbon (DOC), and ash content of biochar can affect the interaction mechanism between biochar and HMs, including complexation, reduction, cation exchange, electrostatic attraction, and precipitation [70,71,72]. Although the current study results indicate that the Cr and Cu values increased as the pH value increased, the amount of variation that can be explained is only less than 20% (r2 = 0.16 and 0.18 for Cr and Cu, respectively). The addition of high-pH and -alkaline natural biochar to acidic soil may accelerate the precipitation of potential toxic elements (PTEs) [73]. In the biochar-amended soil, the soil pH significantly increased, as did the DOC, which may be favorable in reducing the metal bioavailability in the soil by promoting HM (Cd, Cr, Cu, Ni, Pb, and Zn) adsorption and precipitation [4,32,35,61,72,74,75,76]. Contrary to previous studies, as described above, our study results indicate that the DOC values were significantly positively correlated with Cr (r = 0.97), Cu (r = 0.97), and Ni (r = 0.74). However, the current study results are similar to the reports of Beesley et al. [77] and Park et al. [23]. Beesley et al. [77] reported that the Cu and As concentrations in soil pore water increased more than 30-fold after adding both amendments, associated with significant increases in dissolved organic carbon and pH, whereas Zn and Cd significantly decreased. Meanwhile, Park et al. [23] indicated that biochars significantly increase Cd and Pb immobilization in soil; however, biochars were not very effective in Cu immobilization. The water-soluble carbon (WSC) concentrations ranged from 0.1 to 109 g kg−1 in biochars derived from different feedstocks and production temperatures [78]. Dissolved organic carbon (DOC) can complex with trace metals to form organometallic complexes, and therefore, DOC can act as a carrier and can promote the leaching of trace metals, especially in soils modified with biochar containing a large fraction of DOC [79]. Beesley et al. [80] suggested that there are two effects of soluble carbon by the application of organic materials to soils: (1) Frequently in an immobilization of metals in soils; and (2) enhancing the solubility by co-mobilization with DOC. In a column system, as the biochar is leached, the WSC concentration decreases rapidly, which indicates that the C output from the biochar to the solution of the amended soil system is quite fast after the initial application or environmental exposure [81]. Additionally, Cu mobility increased after a hardwood biochar amendment because the biochar increased the DOC in the soil pore water by the formation of soluble DOC–Cu complexes [77]. Chicken manure-derived biochar added to Cu-spiked soil resulted in an increase in soil DOC content. The addition caused the conversion of Cu (II) to Cu complexes with higher solubility [23]. The Cu concentration increased in the soil pore water, being the proximate consequence of the Cu (II) desorption from the soil with the form of an organic complex [70].
Furthermore, Jia et al. [79] indicated that the effect of DOC on soil metal mobility would not be a major factor. In their study results, a high-pH solution (7.0) produced higher DOC levels and larger molecular weights of dissolved organic matter than low-pH solutions (pH 3.0 and 4.5). The weak contribution of DOC derived mainly from biochar, resulted in a low soil pH, and made only a small contribution to the increase in metal mobility. On the contrary, in the higher-pH system, Oste et al. [82] indicated that the system has higher DOC concentrations. Moreover, higher humic acid (HA) fractions in the higher-pH system and higher fulvic acid (FA) in the lower-pH system (pH 3–5) play a major role in increasing solution Cu concentrations [83]. The current study results clearly indicate the enhanced solubility of Cr, Cu, and Ni mainly by co-mobilization with DOC, especially for Cr and Cu. The solubility of Cr and Cu was also subordinately enhanced by co-mobilization with Ca, and minorly with P. The significantly positive correlations were between P and Ca for Cr and Cu, and by Cr and Cu for Ni. Except for DOC, the Ni solubility was enhanced with Cr, Cu, and Ca. The treatments of the P2, P3, and P4 low-temperature PLBs showed significant co-metabolization effects compared to P5 and P6, increasing as the rate increased. The treatments of P5 and P6 showed insignificant changes of Cr and Cu, and a significant decline in Ni with an increasing rate.
There was a decrease in surface functional groups when the pyrolysis temperature increased, and as a result, the CEC decreased, which can lead to a decrease in toxic element immobilization [84]. Biochar pyrolyzed at 500 °C, as compared to that produced at 300 °C, was significantly more effective in Ni immobilization [37,85], which could be attributed to its higher calcium carbonate, ash, and lower organic matter contents [86]. Additionally, biochar produced at higher temperatures (700 °C) induced the highest reduction in Cr mobilization of the soil solution [87]. In addition, Muhammad et al. [71] indicated that the immobilization effects of PTEs were in the order of Cd > Pb > Cr > Ni > Cu > Mn > As > Co > Fe > Zn. The authors further suggested that among the various applications of biochars (BCs), biochar pyrolyzed at 800 °C (800BC), when applied with a weight ratio of 5% to the soil, demonstrated the best performance. Therefore, 800BC with a 5% application rate is recommended for soil remediation. Enhanced solubility of Cr and Cu was evident for low-temperature pyrolysis PLB (e.g., P2, P3, and P4) (Table S6). For Ni, there were enhanced solubilities at P2 and P3 with an increasing rate, and reduced solubilities at P4, P5, and P6 with increases in the rate. As for Zn, high-temperature PLB (P5 and P6) and a high addition rate (5%) demonstrated the best performance, significantly (p < 0.0001) reducing the solubility (95–98%) compared to the control. In the presence of 10% miscanthus biochar, Houben et al. [88] reported that the CaCl2-extractable Zn declined and reached 87%. Yang et al. [61] also reported that bamboo and rice straw biochar significantly (p < 0.05) decreased the concentration of CaCl2-extractable HMs with increasing biochar application rate, and the 5% application rate of fine rice straw biochar resulted in the greatest reductions in extractable Zn (62.2%). They pointed out that the HM (Cd, Cu, Pb, and Zn) extractability was significantly (p < 0.01) correlated with pH, water-soluble organic carbon, and available P in soil. Our study results for Zn were similar to those from Yang et al. [61], but additionally including Ca and Mg. Except for the effect of pH, the exchange with different cations (e.g., K+, Ca2+, and Mg2+) present on the surface of biochar [89] and the precipitation by forming phosphate, sulphate, and carbonate compounds with anions (e.g., PO 4 3 - , SO 4 2 - , and CO 3 2 - ) remaining present on the surface of biochar [90] both have important effects on the decrease in Zn.

5. Conclusions

The current study results suggested that PL pyrolyzed at >400 °C and applied with a weight ratio of 5% to the soil demonstrated the best performance because it was more stable and less decomposed during incubation, in addition to an increase in the available nutrients and a decrease in HM solubility. The increasing solubility of Cr, Cu, and Ni in lower-temperature PLB (e.g., P2 and P3) treatments could be attributed to the co-mobilization with DOC derived from the PLB forming an organic complex, as well as co-mobilization with P and Ca. The lower solubility of Zn and Ni was significantly affected by pH, EC, P, K, and Mg, indicating significant adsorption by electrostatic interaction and ion exchange with the biochar surface and/or soil surface exchange site. Therefore, P5 and P6 with a 5% application rate are recommended for soil remediation in the multi-contaminated soil in Taiwan for maximizing the benefits of PLB applications, minimizing the potential environmental risk, as well as achieving and assisting sustainable soil management and aiding the achievement of multiple SDGs. The limitation of this study is only focusing on water-soluble concentration of contaminants, that is, bioavailable concentration. Restoring contaminated farmland for agricultural use is an important goal. Under the condition that the total concentration of HMs in soil cannot be effectively and rapidly reduced, if the available concentration can be gradually reduced or its dissolution in the soil solution can be reduced, the contaminated soil might also be gradually restored, and contaminated farmland might be restored for agricultural use. Further study on planting crops in the PLB-amended soil should be conducted in pots or in fields for examining crop growth abnormality, as well as food safety.

Supplementary Materials

The following are available online at https://www.mdpi.com/article/10.3390/agronomy12020405/s1, Figure S1: (a) Thermogravimetric analysis of the five PLBs biochar produces from different temperatures at constant heating rate (10°C min−1) with N2 gas at 20 mL min−1; (b) IR spectrum for six PLBs corresponding to DTG peak, Figure S2: Principal component analysis, based on soil chemical characteristics and cumulative CO2-C after 56-d incubation period, in soil treated with 0% (control), 5.0% (-5), and 10% (-10) PLB, Table S1: Characteristics of the five studied biochars, Table S2: The results of basic statistical description of soil parameters. Table S3: Standardized canonical coefficients (SCC) and correlation coefficients (r) between the first two canonical discriminant functions (Can) and variables, Table S4: Significance test of water extraction solution pH, electrical conductivity, and dissolve organic carbon after 56 days incubation, Table S5: Significance test of water-extractable P, K, Ca, and Mg after 56 days incubation, Table S6: Significance test of water extractable Cr, Cu, Ni, and Zn after 56 days incubation.

Author Contributions

Conceptualization, C.-C.T. and Y.-F.C.; methodology, C.-C.T. and Y.-F.C.; validation, C.-C.T. and Y.-F.C., formal analysis, Y.-F.C.; investigation, C.-C.T. and Y.-F.C.; data curation, C.-C.T. and Y.-F.C.; writing-original draft preparation, C.-C.T.; writing-review and editing, C.-C.T.; supervision, C.-C.T.; funding acquisition, C.-C.T. All authors have read and agreed to the published version of the manuscript.

Funding

This research was funded by Ministry of Science and Technology of the Republic of China, Contract number MOST 108-2313-B-197-005.

Data Availability Statement

Data will be made available upon request.

Acknowledgments

The authors would like to thank Thermal Analyzer Laboratory, the Instrumentation Center, National Taiwan University, for helping with TG/FTIR analysis.

Conflicts of Interest

The authors declare no conflict of interest.

References

  1. Wang, X.; Sato, T.; Xing, B.; Tao, S. Health risks of heavy metals to the general public in Tianjin, China via consumption of vegetables and fish. Sci. Total Environ. 2005, 350, 28–37. [Google Scholar] [CrossRef] [PubMed]
  2. Khan, S.; Cao, Q.; Zheng, Y.M.; Huang, Y.Z.; Zhu, Y.G. Health risks of heavy metals in contaminated soils and food crops irrigated with wastewater in Beijing, China. Environ. Pollut. 2008, 152, 686–692. [Google Scholar] [CrossRef]
  3. Woldetsadik, D.; Drechsel, P.; Keraita, B.; Marschner, B.; Itanna, F.; Gebrekidan, H. Effects of biochar and alkaline amendments on cadmium immobilization, selected nutrient and cadmium concentrations of lettuce (Lactuca sativa) in two contrasting soils. SpringerPlus 2016, 5, 397. [Google Scholar] [CrossRef] [PubMed] [Green Version]
  4. Antonangelo, J.A.; Zhang, H. Heavy metal phytoavailability in a contaminated soil of northeastern Oklahoma as affected by biochar amendment. Environ. Sci. Pollut. Res. 2019, 26, 33582–33593. [Google Scholar] [CrossRef]
  5. Virkutyte, J.; Sillanpää, M.; Latostenmaa, P. Electrokinetic soil remediation—critical review. Sci. Total Environ. 2002, 289, 97–121. [Google Scholar] [CrossRef]
  6. Yeung, A.T.; Hsu, C.N. Electrokinetic remediation of cadmium contaminated clay. J. Environ. Eng. 2005, 131, 298–304. [Google Scholar] [CrossRef]
  7. Dermont, G.; Bergeron, M.; Mercier, G.; Richer-Laflèche, M. Metal-contaminated soils: Remediation practices and treatment technologies. J. Hazard. Toxic Radioact. Waste 2008, 12, 188–209. [Google Scholar] [CrossRef]
  8. Peng, J.F.; Song, Y.E.; Yuan, P.; Cui, X.Y.; Qiu, G.L. The remediation of heavy metals contaminated sediment. J. Hazard. Mater. 2009, 161, 633–640. [Google Scholar] [CrossRef]
  9. Mulligan, C.N.; Yong, R.N.; Gibbs, B.F. Surfactant-enhanced remediation of contaminated soil: A review. Eng. Geol. 2001, 60, 371–380. [Google Scholar] [CrossRef]
  10. Alkorta, I.; Hernández-Allica, J.; Becerril, J.M.; Amezaga, I.; Albizu, I.; Garbisu, C. Recent findings on the phytoremediation of soils contaminated with environmentally toxic heavy metals and metalloids such as zinc, cadmium, lead, and arsenic. Rev. Environ. Sci. Bio. Technol. 2004, 3, 71–90. [Google Scholar] [CrossRef]
  11. Ghosh, M.; Singh, S.P. A review on phytoremediation of heavy metals and utilization of its by-products. As. J. Energy Env. 2005, 6, 214–231. Available online: https://www.thaiscience.info/Journals/Article/AJEE/10262422.pdf (accessed on 24 November 2021).
  12. Ahumada, I.; Sepúlveda, K.; Fernández, P.; Ascar, L.; Pedraza, C.; Richter, P.; Brown, S. Effect of biosolid application to Mollisol Chilean soils on the bioavailability of heavy metals (Cu, Cr, Ni, and Zn) as assessed by bioassays with sunflower (Helianthus annuus) and DGT measurements. J. Soils Sedim. 2014, 14, 886–896. [Google Scholar] [CrossRef]
  13. Sidhu, V.; Sarkar, D.; Datta, R. Effects of biosolids and compost amendment on chemistry of soils contaminated with copper from mining activities. Environ. Monit. Assess. 2016, 188, 176. [Google Scholar] [CrossRef]
  14. Chun, Y.; Sheng, G.Y.; Chiou, C.T.; Xing, B.S. Compositions and sorptive properties of crop residue-derived chars. Environ. Sci. Technol. 2004, 38, 4649–4655. [Google Scholar] [CrossRef] [PubMed]
  15. Ok, Y.S.; Oh, S.E.; Ahmad, A.; Hyun, S.; Kim, K.R.; Moon, D.H.; Lee, S.S.; Lim, K.J.; Jeon, W.T.; Yang, J.E. Effects of natural and calcined oyster shells on Cd and Pb immobilization in contaminated soils. Environ. Earth. Sci. 2010, 61, 1301–1308. [Google Scholar] [CrossRef]
  16. Uchimiya, M.; Lima, I.M.; Klasson, T.; Wartelle, L.H. Contaminant immobilization and nutrient release by biochar soil amendment: Roles of natural organic matter. Chemosphere 2010, 80, 935–940. [Google Scholar] [CrossRef] [PubMed]
  17. Liu, L.N.; Chen, H.S.; Cai, P.; Lianga, W.; Huang, Q.Y. Immobilization and phytotoxicity of Cd in contaminated soil amended with chicken manure compost. J. Hazard. Mater. 2009, 163, 563–567. [Google Scholar] [CrossRef] [PubMed]
  18. Lee, S.S.; Lim, J.E.; El-Azeem, S.A.M.A.; Choi, B.; Oh, S.E.; Moon, D.H.; Ok, Y.S. Heavy metal immobilization in soil near abandoned mines using eggshell waste and rapeseed residue. Environ. Sci. Pollut. Res. 2013, 20, 1719–1726. [Google Scholar] [CrossRef]
  19. Mohan, D.; Pittman, C.U.; Bricka, M.; Smith, F.; Yancey, B.; Mohammad, J.; Steele, P.H.; Alexandre-Franco, M.F.; Gomez-Serrano, V.; Gong, H. Sorption of arsenic, cadmium, and lead by chars produced from fast pyrolysis of wood and bark during bio-oil production. J. Colloid Interface Sci. 2007, 310, 57–73. [Google Scholar] [CrossRef]
  20. Cao, X.D.; Ma, L.N.; Gao, B.; Harris, W. Dairy-manure derived biochar effectively sorbs lead and atrazine. Environ. Sci. Technol. 2009, 43, 3285–3291. [Google Scholar] [CrossRef]
  21. Cao, X.D.; Harris, W. Properties of dairy-manure-derived biochar pertinent to its potential use in remediation. Bioresour. Technol. 2010, 101, 5222–5228. [Google Scholar] [CrossRef]
  22. Cao, X.D.; Ma, L.; Liang, Y.; Gao, B.; Harris, W. Simultaneous immobilization of lead and atrazine in contaminated soils using dairy manure biochar. Environ. Sci. Technol. 2011, 45, 4884–4889. [Google Scholar] [CrossRef]
  23. Park, J.H.; Choppala, G.K.; Bolan, N.S.; Chung, J.W.; Chuasavathi, T. Biochar reduces the bioavailability and phytotoxicity of heavy metals. Plant Soil 2011, 348, 439–451. [Google Scholar] [CrossRef]
  24. Steiner, C.; Teixeira, W.G.; Lehmann, J.; Nehls, T.; de Macedo, J.L.V.; Blum, W.E.H.; Zech, W. Long term effects of manure, charcoal and mineral fertilization on crop production and fertility on a highly weathered Central Amazonian upland soil. Plant Soil 2007, 291, 275–290. [Google Scholar] [CrossRef] [Green Version]
  25. Chen, J.P.; Lin, M. Equilibrium and kinetics of metal ion adsorption onto a commercial H-type granular activated carbon: Experimental and modeling studies. Water Res. 2001, 35, 2385–2394. [Google Scholar] [CrossRef]
  26. Jiang, T.Y.; Jiang, J.; Xu, R.K.; Li, Z. Adsorption of Pb(II) on variable charge soils amended with rice-straw derived biochar. Chemosphere 2012, 89, 249–256. [Google Scholar] [CrossRef] [PubMed]
  27. Jiang, J.; Xu, R.K.; Li, Z. Immobilization of Cu(II), Pb(II) and Cd(II) by the addition of rice straw derived biochar to a simulated polluted Ultisol. J. Hazard. Mater. 2012, 229, 145–150. [Google Scholar] [CrossRef]
  28. Uchimiya, M.; Lima, I.M.; Thomas Klasson, K.; Chang, S.; Wartelle, L.H.; Rodgers, J.E. Immobilization of heavy metal ions (CuII, CdII, NiII, and PbII) by broiler litter-derived biochars in water and soil. J. Agric. Food Chem. 2010, 58, 5538–5544. [Google Scholar] [CrossRef] [PubMed]
  29. Comis, D. Better ballfields and rain gardens start below the surface. Agric. Res. Mag. 2010, 58. Available online: https://agresearchmag.ars.usda.gov/2010/nov/gardens. (accessed on 2 November 2021).
  30. Guo, M.; Qiu, G.; Song, W. Poultry litter-based activated carbon for removing heavy metal ions in water. Waste Manag. 2010, 30, 308–315. [Google Scholar] [CrossRef]
  31. Houben, D.; Evrard, L.; Sonnet, P. Beneficial effects of biochar application to contaminated soils on the bioavailability of Cd, Pb and Zn and the biomass production of rapeseed (Brassica napus L.). Biomass Bioenerg. 2013, 57, 196–204. [Google Scholar] [CrossRef]
  32. Gondek, K.; Mierzwa-Hersztek, M. Effect of low-temperature biochar derived from pig manure and poultry litter on mobile and organic matter-bound forms of Cu, Cd, Pb and Zn in sandy soil. Soil Use Manag. 2016, 32, 357–367. [Google Scholar] [CrossRef]
  33. Choppala, G.; Bolan, N.; Kunhikrishnan, A.; Skinner, W.; Seshadri, B. Concomitant reduction and immobilization of chromium in relation to its bioavailability in soil. Environ. Sci. Pollut. Res. 2015, 22, 8969–8978. [Google Scholar] [CrossRef] [PubMed]
  34. Lin, Q.; Xu, X.; Wang, L.; Chen, Q.; Fang, J.; Shen, X.; Lou, L.; Tian, G. The speciation, leachability and bioaccessibility of Cu and Zn in animal manure-derived biochar: Effect of feedstock and pyrolysis temperature. Front. Environ. Sci. Eng. 2017, 11, 5. [Google Scholar] [CrossRef]
  35. Sehrish, A.K.; Aziz, R.; Hussain, M.M.; Rafiq, M.T.; Rizwan, M.; Muhammad, N.; Rafiq, M.K.; Sehar, A.; ud Din, J.; Al-Wabel, M.I.; et al. Effect of poultry litter biochar on chromium (Cr) bioavailability and accumulation in spinach (Spinacia oleracea) grown in Cr-polluted soil. Arab. J. Geosci. 2019, 12, 57. [Google Scholar] [CrossRef]
  36. Banik, C.; Lawrinenko, M.; Bakshi, S.; Laird, D.A. Impact of pyrolysis temperature and feedstock on surface charge and functional group chemistry of biochars. J. Environ. Qual. 2018, 47, 452. [Google Scholar] [CrossRef] [Green Version]
  37. Zhang, G.; Guo, X.; Zhao, Z.; He, Q.; Wang, S.; Zhu, Y.; Yan, Y.; Liu, X.; Sun, K.; Zhao, Y.; et al. Effects of biochars on the availability of heavy metals to ryegrass in an alkaline contaminated soil. Environ. Pollut. 2016, 218, 513–522. [Google Scholar] [CrossRef]
  38. Al-Wabel, M.I.; Usman, A.R.; El-Naggar, A.H.; Aly, A.A.; Ibrahim, H.M.; Elmaghraby, S.; Al-Omran, A. Conocarpus biochar as a soil amendment for reducing heavy metal availability and uptake by maize plants. Saudi J. Biol. Sci. 2015, 22, 503–511. [Google Scholar] [CrossRef] [Green Version]
  39. Li, H.; Ye, X.; Geng, Z.; Zhou, H.; Guo, X.; Zhang, Y.; Zhao, H.; Wang, G. The influence of biochar type on long-term stabilization for Cd and Cu in contaminated paddy soils. J. Hazard. Mater. 2016, 304, 40–48. [Google Scholar] [CrossRef] [PubMed]
  40. Lu, K.; Yang, X.; Shen, J.; Robinson, B.; Huang, H.; Liu, D.; Bolan, N.; Pei, J.; Wang, H. Effect of bamboo and rice straw biochars on the bioavailability of Cd, Cu, Pb and Zn to Sedum plumbizincicola. Agric. Ecosyst. Environ. 2014, 191, 124–132. [Google Scholar] [CrossRef]
  41. Puga, A.; Abreu, C.; Melo, L.; Beesley, L. Biochar application to a contaminated soil reduces the availability and plant uptake of zinc, lead and cadmium. J. Environ. Manag. 2015, 159, 86–93. [Google Scholar] [CrossRef]
  42. Tsai, C.C.; Chang, Y.F. Quality evaluation of poultry litter biochar produced at different pyrolysis temperatures as a sustainable management approach and its effects on soil carbon mineralization. Agronomy 2021, 11, 1692. [Google Scholar] [CrossRef]
  43. Environmental Protection Administration (EPA). Total Concentration of Metals in Soils; Method Code No: NIEA S321.63B; Environmental Protection Administration of Taiwan: Taipei, Taiwan, 2003; 11p. [Google Scholar]
  44. Baker, D.E.; Amacher, M.C. Nickel, Copper, Zinc and Cadmium. In Methods of Soil Analysis, Part 2, Chemical and Microbiological Properties, Agronomy Monograph 9, 2nd ed.; Page, A.L., Miller, R.H., Keeney, D.R., Eds.; Agronomy Society of America and Soil Science Society of America: Madison, WI, USA, 1982; pp. 323–336. [Google Scholar]
  45. Novozamsky, I.; Lexmond, T.H.M.; Houba, V.J.G. A single extraction procedure of soil for evaluation of uptake of some heavy metals by plant. Int. J. Environ. Anal. Chem. 1993, 51, 47–58. [Google Scholar] [CrossRef]
  46. Houba, V.J.G.; Temminghoff, E.J.M.; Gaikhorst, G.A.; van Vark, W. Soil analysis procedures using 0.01 M calcium chloride as extraction reagent. Commun. Soil Sci. Plant Anal. 2000, 31, 1299–1396. [Google Scholar] [CrossRef]
  47. Degryse, F.; Broos, K.; Smolders, E.; Merckx, R. Soil solution concentration of Cd and Zn can be predicted with a CaCl2 soil extract. Eur. J. Soil Sci. 2003, 54, 149–157. [Google Scholar] [CrossRef] [Green Version]
  48. Jones, J.B.; Case, V.W.; Westerman, R. Sampling, Handling, and Analyzing Plant Tissue Samples. In Methods of Soil Analysis, Part 5-Mineralogical Methods; Soil Science Society of America: Madison, WI, USA, 2018; pp. 389–427. [Google Scholar]
  49. Kalderis, D.; Kotti, M.S.; Méndez, A.; Gascó, G. Characterization of hydrochars produced by hydrothermal carbonization of rice husk. Solid Earth 2014, 5, 477–483. [Google Scholar] [CrossRef] [Green Version]
  50. Mimmo, T.; Panzacchi, P.; Baratieri, M.; Davies, C.A.; Tonon, G. ScienceDirect effect of pyrolysis temperature on miscanthus (Miscanthus 3 giganteus) biochar physical, chemical and functional properties. Biomass Bioenergy 2014, 62, 149–157. [Google Scholar] [CrossRef]
  51. Dandamudi, K.P.R.; Luboowa, K.M.; Laideson, M.; Murdock, T.; Seger, M.; McGowen, J.; Lammers, P.J.; Deng, S. Hydrothermal liquefaction of Cyanidioschyzon merolae and Salicornia bigelovii Torr.: The interaction effect on product distribution and chemistry. Fuel 2020, 277, 118146. [Google Scholar] [CrossRef]
  52. Pariyar, P.; Kumari, K.; Jain, M.K.; Jadhao, P.S. Evaluation of change in biochar properties derived from different feedstock and pyrolysis temperature for environmental and agricultural application. Sci. Total Environ. 2020, 713, 136433. [Google Scholar] [CrossRef]
  53. Hailegnaw, N.S.; Mercl, F.; Pračke, K.; Száková, J.; Tlustoš, P. High temperature-produced biochar can be efficient in nitrate loss prevention and carbon sequestration. Geoderma 2019, 338, 48–55. [Google Scholar] [CrossRef]
  54. Berek, A.K.; Hue, N.V.; Radovich, T.J.K.; Ahmad, A.A. Biochars improve nutrient phyto-availability of Hawai’i’s highly weathered soils. Agronomy 2018, 8, 203. [Google Scholar] [CrossRef] [Green Version]
  55. Chintala, R.; Mollinedo, J.; Schumacher, T.; Malo, D.D.; Julson, J.L. Effect of biochar on chemical properties of acidic soil. Arch. Agron. Soil Sci. 2013, 60, 393–404. [Google Scholar] [CrossRef]
  56. Li, Y.; Zhiu, C.; Qiu, Y.; Tigabu, M.; Ma, X. Effects of biochar and litter on carbon and nitrogen mineralization and soil microbial community structure in a China fir plantation. J. For. Res. 2019, 30, 1913–1923. [Google Scholar] [CrossRef]
  57. Jiang, X.; Denef, K.; Stewart, C.E.; Cotrufo, M.F. Controls and dynamics of biochar decomposition and soil microbial abundance, composition, and carbon use efficiency during long-term biochar-amended soil incubations. Biol. Fertil. Soils 2016, 52, 1–14. [Google Scholar] [CrossRef]
  58. Shen, Y.H. Sorption of natural dissolved organic matter on soil. Chemosphere 1999, 38, 1505–1515. [Google Scholar] [CrossRef]
  59. Whittinghill, K.A.; Hobbie, S.E. Effects of pH and calcium on soil organic matter dynamics in Alaskan tundra. Biogeochemistry 2012, 111, 569–581. [Google Scholar] [CrossRef]
  60. Ippolito, J.A.; Spokas, K.A.; Novak, J.M.; Lentz, R.D.; Cantrell, K.B. Biochar elemental composition and factors influencing nutrient retention. In Biochar for Environmental Management: Science and Technology, 2nd ed.; Lehmann, J., Joseph, S., Eds.; Earthscan: London, UK, 2015; pp. 137–162. [Google Scholar]
  61. Yang, X.; Liu, J.; McGrouther, K.; Huang, H.; Lu, K.; Guo, X.; He, L.; Lin, X.; Che, L.; Ye, Z.; et al. Effect of biochar on the extractability of heavy metals (Cd, Cu, Pb, and Zn) and enzyme activity in soil. Environ. Sci. Pollut. Res. 2016, 23, 974–984. [Google Scholar] [CrossRef]
  62. Angst, T.E.; Sohi, S.P. Establishing release dynamics for plant nutrients from biochar. GCB Bioenergy 2013, 5, 221–226. [Google Scholar] [CrossRef]
  63. Murphy, P.N.C.; Stevens, R.J. Lime and gypsum as source measures to decrease phosphorus loss from soils to water. Water Air Soil Pollut. 2010, 212, 101–111. [Google Scholar] [CrossRef]
  64. Laird, D.; Fleming, P.; Wang, B.Q.; Horton, R.; Karlen, D. Biochar impact on nutrient leaching from a Midwestern agricultural soil. Geoderma 2010, 158, 436–442. [Google Scholar] [CrossRef] [Green Version]
  65. Bornø, M.L.; Müller-Stöver, D.S.; Liu, F. Contrasting effects of biochar on phosphorus dynamics and bioavailability in different soil types. Sci. Total Environ. 2018, 627, 963–974. [Google Scholar] [CrossRef]
  66. Parfitt, R.L. Anion adsorption by soils and soil materials. Adv. Agron. 1979, 30, 1–50. [Google Scholar] [CrossRef]
  67. Atkinson, C.J.; Fitzgerald, J.D.; Hipps, N.A. Potential mechanisms for achieving agricultural benefits from biochar application to temperate soils: A review. Plant Soil 2010, 337, 1–18. [Google Scholar] [CrossRef]
  68. DeLuca, T.H.; Gundale, M.J.; MacKenzie, M.D.; Davey, L.J. Biochar effects on soil nutrient transformations. In Biochar for Environmental Management: Science and Technology, 2nd ed.; Lehmann, J., Joseph, S., Eds.; Earthscan: London, UK, 2015; pp. 421–455. [Google Scholar]
  69. Jindo, K.; Audette, Y.; Higashikawa, F.S.; Silva, C.A.; Akashi, K.; Mastrolonardo, G.; Sánchez-Monedero, M.A.; Mondini, C. Role of biochar in promoting circular economy in the agriculture sector. Part 1: A review of the biochar roles in soil N, P and K cycles. Chem. Biol. Technol. Agric. 2020, 7, 15. [Google Scholar] [CrossRef]
  70. Cheng, S.; Chen, T.; Xu, W.; Huang, J.; Jiang, S.; Yan, B. Application Research of Biochar for the Remediation of Soil Heavy Metals Contamination: A Review. Molecules 2020, 25, 3167. [Google Scholar] [CrossRef] [PubMed]
  71. Muhammad, N.; Ge, L.; Khan, M.H.; Chan, W.P.; Bilal, M.; Lisak, G.; Nafee, M. Effects of different biochars on physicochemical properties and immobilization of potentially toxic elements in soil-A geostatistical approach. Chemosphere 2021, 277, 130350. [Google Scholar] [CrossRef]
  72. Arabi, Z.; Rinklebe, J.; El-Naggar, A.; Hou, D.; Sarmah, A.K.; Moreno-Jiménez, E. (Im)mobilization of arsenic, chromium, and nickel in soils via biochar: A meta-analysis. Environ. Pollut. 2021, 286, 117199. [Google Scholar] [CrossRef]
  73. Yuan, H.; Lu, T.; Wang, Y.; Chen, Y.; Lei, T. Sewage sludge biochar: Nutrient composition and its effect on the leaching of soil nutrients. Geoderma 2016, 267, 17–23. [Google Scholar] [CrossRef]
  74. Zhang, X.; Wang, H.; He, L.; Lu, K.; Sarmah, A.; Li, J.; Bolan, N.S.; Pei, J.; Huang, H. Using biochar for remediation of soils contaminated with heavy metals and organic pollutants. Environ. Sci. Pollut. Res. 2013, 20, 8472–8483. [Google Scholar] [CrossRef]
  75. Liu, K.; Ly, J.; He, W.; Zhang, H.; Cao, Y.; Dai, Y. Major factors influencing cadmium uptake from the soil into wheat plants. Ecotoxicol. Environ. Saf. 2015, 113, 207–213. [Google Scholar] [CrossRef]
  76. Rehman, M.Z.; Rizwan, M.; Ali, S.; Fatima, N.; Yousaf, B.; Naeem, A.; Sabir, M.; Ahmad, H.R.; Ok, Y.S. Contrasting effects of biochar compost and farm manure on alleviation of nickel toxicity in maiz (Zea mays L.) in relation to plant growth, photosynthesis and metal uptake. Ecotoxicol. Environ. Saf. 2016, 133, 218–255. [Google Scholar] [CrossRef]
  77. Beesley, L.; Moreno-Jiménez, E.; Gomez-Eyles, J.L. Effects of biochar and greenwaste compost amendments on mobility, bioavailability and toxicity of inorganic and organic contaminants in a multi-element polluted soil. Environ. Pollut. 2010, 158, 2282–2287. [Google Scholar] [CrossRef]
  78. Gell, K.; van Groenigen, J.W.; Cayuela, M.L. Residues of bioenergy production chains as soil amendments: Immediate and temporal phytotoxicity. J. Hazard. Mater. 2011, 186, 2017–2025. [Google Scholar] [CrossRef] [PubMed]
  79. Jia, M.; Yu, J.; Li, Z.; Wu, L.; Christie, P. Effects of biochar on the migration and transformation of metal species in a highly acid soil contaminated with multiple metals and leached with solutions of different pH. Chemosphere 2021, 278, 130344. [Google Scholar] [CrossRef]
  80. Beesley, L.; Moreno-Jiménez, E.; Gomez-Eyles, J.L.; Harris, E.; Robinson, B.; Sizmur, T. A review of biochars’ potential role in the remediation, revegetation and restoration of contaminated soils. Environ. Pollut. 2011, 159, 3269–3282. [Google Scholar] [CrossRef] [PubMed]
  81. Beesley, L.; Marmiroli, M. The immobilisation and retention of soluble arsenic, cadmium and zinc by biochar. Environ. Pollut. 2011, 159, 474–480. [Google Scholar] [CrossRef]
  82. Oste, L.A.; Temminghoff, J.M.E.; Van Riemsdijk, W.H. Solid-solution Partitioning of Organic Matter in Soils as Influenced by an Increase in pH or Ca Concentration. Environ. Sci. Technol. 2002, 36, 208–214. [Google Scholar] [CrossRef] [PubMed]
  83. Impellitteri, C.A.; Lu, Y.F.; Saxe, J.K.; Allen, H.E.; Peijnenburg, W.J. Correlation of the partitioning of dissolved organic matter fractions with the desorption of Cd, Cu, Ni, Pb and Zn from 18 Dutch soils. Environ. Int. 2002, 28, 401–410. [Google Scholar] [CrossRef]
  84. Joseph, S.D.; Camps-Arbestain, M.; Lin, Y.; Munroe, P.; Chia, C.H.; Hook, J.; Van Zwieten, L.; Kimber, S.; Cowie, A.; Singh, B.P.; et al. An investigation into the reactions of biochar in soil. Soil Res. 2010, 48, 501–515. [Google Scholar] [CrossRef]
  85. Qiao, Y.; Crowley, D.; Wang, K.; Zhang, H.; Li, H. Effects of biochar and Arbuscular mycorrhizae on bioavailability of potentially toxic elements in an aged contaminated soil. Environ. Pollut. 2015, 206, 636–643. [Google Scholar] [CrossRef]
  86. Boostani, H.R.; Najafi-Ghiri, M.; Hardie, A.G. Nickel immobilization in a contaminated calcareous soil with application of organic amendments and their derived biochars. Commun. Soil Sci. Plant Anal. 2020, 51, 503–514. [Google Scholar] [CrossRef]
  87. Rafique, M.I.; Usman, A.R.; Ahmad, M.; Sallam, A.; Al-Wabel, M.I. In situ immobilization of Cr and its availability to maize plants in tannery waste–contaminated soil: Effects of biochar feedstock and pyrolysis temperature. J. Soils Sedim. 2020, 20, 330–339. [Google Scholar] [CrossRef]
  88. Houben, D.; Evrard, L.; Sonnet, P. Mobility, bioavailability and pH dependent leaching of cadmium, zinc and lead in a contaminated soil amended with biochar. Chemosphere 2013, 92, 1450–1457. [Google Scholar] [CrossRef] [PubMed]
  89. Lu, H.; Zhang, W.; Yang, Y.; Huang, X.; Wang, S.; Qiu, R. Relative distribution of Pb2+ sorption mechanisms by sludge-derived biochar. Water Res. 2012, 46, 854–862. [Google Scholar] [CrossRef] [PubMed]
  90. Park, J.H.; Choppala, G.; Lee, S.J.; Bolan, N.; Chung, J.W.; Edraki, M. Comparative sorption of Pb and Cd by biochars and its implication for metal immobilization in soils. Water Air Soil Pollut. 2013, 224, 1711. [Google Scholar] [CrossRef]
Figure 1. Canonical scores of the first two canonical discriminant functions (Can) of the control and PLB treatments (1, 5, and 10 = 1%, 5%, and 10%).
Agronomy 12 00405 g001
Figure 2. Mean values of the (a) pH, (b) electrical conductivity (EC), and (c) dissolved organic carbon (DOC) in the control (C) and biochar-amended soil after 56 days of incubation. Values represent the mean (n = 5) ± standard deviation (error bars). P2, P3, P4, P5, and P6 = poultry litter pyrolyzed at 200, 300, 400, 500, and 600 °C, respectively.
Agronomy 12 00405 g002
Figure 3. Mean values of (a) P, (b) K, (c) Ca, and (d) Mg in the control (C) and biochar-amended (1%, 5%, and 10%) soil after 56 days of incubation. Values represent the mean (n = 5) ± standard deviation (error bars). P2, P3, P4, P5, and P6 = poultry litter pyrolyzed at 200, 300, 400, 500, and 600 °C, respectively.
Agronomy 12 00405 g003
Figure 4. The contents of (a) Cr, (b) Cu, (c) Ni, and (d) Zn in the control (C) and biochar-amended (1%, 5%, and 10%) soil after 56 days of incubation. Values represent the mean (n = 5) ± standard deviation (error bars). P2, P3, P4, P5, and P6 = poultry litter pyrolyzed at 200, 300, 400, 500, and 600 °C, respectively.
Agronomy 12 00405 g004
Table 1. Heavy metal concentrations of the studied soil and five PLBs.
Soil/BiocharsCdCrCuNiPbZn
mg kg−1
Soil0.1 N HClND29.732910115.6216
Aqua RegiaND101748890143.9824
Raw0.1N HClND 253.513.0NDND168
P2 10.1N HClND 251.310.70.640.07144
0.01M CaCl20.0143.118.21.040.0235.2
Total0.0827157.33.18ND304
P30.1 N HClND42.88.140.480.07140
0.01 M CaCl20.0135.414.60.830.0331.1
Total0.0535173.44.85ND409
P40.1 N HClND24.54.210.170.01105
0.01 M CaCl20.00417.37.990.350.0113.8
Total0.0644292.84.84ND523
P50.1 N HClND4.950.33NDND8.02
0.01 M CaCl2ND2.020.79NDND0.46
Total0.116721436.83ND718
P60.1 N HClND3.4NDNDND14.9
0.01 M CaCl2ND0.430.04NDNDND
Total0.145971297.17ND752
1 P2, P3, P4, P5, and P6 = poultry litter pyrolyzed at 200, 300, 400, 500, and 600 °C, respectively; 2 ND = not detected.
Table 2. Significance (p-value) of the two-way ANOVA results of water extraction solution pH, electrical conductivity (EC), dissolved organic carbon (DOC), nutrients, and heavy metals.
Sourcesdf 1pHECDOCPKCaMgCrCuNiZn
Rate2*** 2******************************
Treatment4*********ns******ns************
Rate × Treatment8*******ns******ns************
1 df = degree of freedom; 2 *** p < 0.0001; ** p < 0.001; ns = not significant (p > 0.01).
Table 3. Significance test results of the water extraction solution pH, electrical conductivity (EC), dissolved organic carbon (DOC), nutrients, and heavy metals between the control and three rates and between the control and five PLB in this study.
SourcesDf 1pHECDOCPKCaMgCrCuNiZn
Rate dS m–1mg kg−1
Control34.45d 20.81d68.0d 11.80c19.1d264c66.3d0.030d0.37d2.19b3.01a
1%154.82c1.28c95.0c2.47c133c380b107c0.055c0.64c1.99c2.19b
5%156.11b2.67b252b15.6b699b535a228b0.160b2.12b1.71d0.75c
10%156.73a4.17a550a37.1a1644a549a328a0.439a4.36a2.55a0.52d
Treatment 3
Control34.45c0.81d68.0f1.80b 219.1d264d66.3b0.030e0.37f2.19c3.01a
P295.54b2.40c466a16.9a549c562a215a0.454a4.60a3.76a1.92b
P395.93a2.47c417b18.9a626c519b213a0.362b3.97b3.34b1.86b
P495.94a2.67bc308c19.6a770b502b227a0.160c1.99c1.83d1.06c
P595.89a2.92ab168d19.6a1046a428c222a0.061d0.75d0.78e0.46d
P696.13a3.07a135e17.0a1136a429c228a0.051d0.57e0.72e0.46d
1 df = degree of freedom; 2 means followed by different lowercase letter are significantly different for each parameter in the rate column and treat column (p < 0.01). 3 P2, P3, P4, P5, and P6 = poultry litter pyrolyzed at 200, 300, 400, 500, and 600 °C, respectively.
Table 4. Pearson correlation coefficients between measured parameters and principal components (PCs) (PC1 and PC2) after 56-d incubation.
ParameterPC1PC2
Total variance64.2%30.1%
Cumulative CO2-C0.816 *,10.573 *
pH0.859 *−0.466 (p = 0.0008)
Electrical conductivity0.829 *−0.530 (p = 0.0001)
Dissolve organic carbon0.892 *0.427 (p = 0.0025)
P0.927 *−0.283
K0.723 *−0.628 *
Ca0.870 *0.193
Mg0.924 *−0.371 (p = 0.0094)
Cr0.790 *0.586 *
Cu0.810 *0.582 *
Ni0.400 (p =0.0049)0.907 *
Zn−0.619 *0.668 *
1: The asterisks after the data indicate the significant correlations analyzed by SAS (p < 0.0001).
Table 5. Pearson’s correlation coefficients between the measured parameters on day 56.
Parameters 1pHECDOCPKCaMgCrCuNiZn
pH1.000.95 20.560.910.890.690.970.40
(0.005)
0.42
(0.003)
−0.08−0.85
EC 1.000.51
(0.0002) 3
0.930.980.590.970.340.36–0.13–0.80
DOC 1.000.730.38
(0.007)
0.810.660.970.970.74–0.27
P 1.000.890.670.970.570.580.13–0.71
K 1.000.42
(0.003)
0.910.220.22–0.25–0.78
Ca 1.000.740.750.810.50
(0.0003)
–0.48
(0.001)
Mg 1.000.50
(0.0003)
0.53
(0.0001)
0.04–0.80
Cr 1.000.990.84–0.12
Cu 1.000.85–0.13
Ni 1.000.41
(0.004)
Zn 1.00
1 EC = electrical conductivity; DOC = dissolve organic carbon. 2 Bold numbers indicate significant correlations analyzed by SAS (p < 0.0001). 3 The values in parentheses are the p-values.
Publisher’s Note: MDPI stays neutral with regard to jurisdictional claims in published maps and institutional affiliations.

