Article

Can Split Application of Slow-Release Fertilizer Improve Wheat Yield, Nitrogen Efficiency and Their Stability in Different Ecological Regions?

1
Jiangsu Key Laboratory of Crop Genetics and Physiology, Agricultural College of Yangzhou University, Yangzhou University, Yangzhou 225009, China
2
Co-Innovation Center for Modern Production Technology of Grain Crops, Yangzhou University, Yangzhou 225009, China
3
Joint International Research Laboratory of Agriculture and Agri-Product Safety, The Ministry of Education of China, Yangzhou University, Yangzhou 225009, China
4
College of Environmental Science and Engineering, Yangzhou University, Yangzhou 225009, China
*
Authors to whom correspondence should be addressed.
Agronomy 2022, 12(2), 407; https://doi.org/10.3390/agronomy12020407
Submission received: 7 January 2022 / Revised: 3 February 2022 / Accepted: 3 February 2022 / Published: 6 February 2022

Abstract

:
Environmental conditions (precipitation, temperature and soil properties) differ greatly in different regions and have dual effects on the wheat growth and nutrient release of slow-release fertilizer (SRF). Conventional fertilization methods such as the multiple-split application of urea and the one-time application of SRF may have difficulty achieving a stable and high wheat yield and nitrogen (N) efficiency in various environments. Therefore, the exploration of a rational application strategy of SRF is needed for improving wheat yield and its stability in different regions. A two-year field experiment was conducted in different regions (eight test sites per year) with five patterns: 100% N (270 kg ha−1) SRF applied pre-sowing (M1); 60% N SRF applied pre-sowing and 40% N urea applied at jointing (M2); 60% N SRF applied pre-sowing and 40% N SRF applied at re-greening (M3); M2 reducing the N rate by 15% (M4); M3 reducing the N rate by 15% (M5). The fourth-split application of urea was taken as the control (CK, 270 kg N ha−1). The results suggested that the average yield in M1 decreased by 3.65% of the CK, and the yield stability was poor. Both M2 and M3 significantly increased N efficiency, grain yield and benefit, but the stability of M3 was higher than that of M2 in different environments. Considering further improvements in wheat yield, N efficiency and profit, our results suggested that the twice-split application of SRF, which also improved the adaptability of wheat in different environments, could be recommended for wheat cultivation.

1. Introduction

The agricultural nitrogen (N) input continues to increase each year in China in order to further increase crop yields [1], whereas the linearly increasing N-application rate has not produced substantial increases in crop yields but has instead led to a sharp decline in N-use efficiency [2,3] as well as a series of environmental problems, such as water eutrophication, soil acidification, air pollution, etc. [4,5]. Over the past several decades, the conventional fertilizer application for winter wheat (Triticum aestivum L.) was mostly divided into 3–4 applications and consisted of basal and top-dressing, which is a high-demand, time-consuming and labor-intensive approach and limits the mechanization of wheat cultivation. Moreover, with rural labor migration and the aging of rural populations, fewer people are available to engage in agricultural work [6], and excessive N inputs and fertilization frequencies also lead to lower economic returns for growers from their fertilizer investments [7,8]. Thus, there is an urgent need to determine optimal N-fertilization strategies that can promote wheat yields, reduce N losses and save labor inputs.
In recent years, various fertilizer-application techniques for ensuring crop yields, quality and economic benefits have been recommended, such as soil testing and fertilizer recommendation, precise and quantitative fertilization, and water-and-fertilizer-coupling technology [9,10,11]. These techniques were expected to harmonize the components (spikes per unit area, kernels per spike and grain weight) of wheat yield [12]. Cao et al. [13] pointed out that spike number contributed the most to the wheat yield followed by grain weight, and kernels per spike showed negative effects on the yield. In contrast to kernels per spike, spike number and grain weight are more easily influenced by environmental conditions, indicating that they are susceptible to regulation by fertilizer-application strategies [14]. However, when using the conventional N-fertilizer-application strategies with urea as the main object it is generally difficult to overcome the deficiency of over-use of N fertilizer or high N loss. Theoretically, it can reduce the risk of N loss and thus improve N-use efficiency by controlling the N-release rate from fertilizers to match the N demand of crops [15]. The development of a slow-release fertilizer (SRF) fulfills the above goal and provides a new direction for more efficient and simplified fertilization of wheat [16]. By employing different coating materials or adding inhibitors, SRF can release N into the soil solution at a rate matching the plant demand, thereby reducing excess inorganic N accumulation and N loss from the soil profile [17,18].
Many studies believed that the one-time application of SRF could increase N-use efficiency while saving time and labor [16,19,20,21,22]. However, due to the additional coating materials and the complex manufacturing processes, CRU has been considered too expensive for application in cereal crops [17]. Furthermore, it is still controversial whether the one-time application of SRF can meet the N demand of wheat during the whole growth period, which is of great significance to the promotion of N absorption at different stages of wheat growth, the coordination of wheat-population quality and the decrease in the N loss [23,24]. In order to synchronize the N demand of wheat with the N supply of SRF, our previous study [25] proposed the strategy of a twice-split application of SRF at the pre-sowing and re-greening stages, which satisfied the growth of wheat in the seeding stage and promoted the reproductive growth of wheat, but its economic feasibility has not been confirmed.
These studies have promoted the use of SRF in wheat production. However, many studies have confirmed that wheat yield and nitrogen-use efficiency are also significantly regulated by environmental conditions (temperature, precipitation, soil characteristics, etc.) [26,27] and cultivation measures (variety, density, tillage and sowing methods, fertilizer management, etc.) [28,29,30,31]. In addition, temperature, moisture and physical and chemical soil properties could affect the nutrient release of SRF in soil [21,32], which contributed to the effectiveness of controlled-release urea, which varies with the coating material, cropping system, and cultivation conditions, leading to differences in the absorption and utilization of nutrients in crops and further affecting the grain yield [33,34,35]. In many studies, the influence of the environmental factors on the application effect of SRF is often ignored, which may result in large differences in yield and NUE in different ecological regions using the same fertilization strategy. The Jiangsu Province is one of the primary wheat production regions in China. However, there are great differences in climate and soil properties among different regions in the Jiangsu Province, resulting in significant differences in the effect of N-fertilizer management. In this context, it is of great significance to study the appropriate application strategy of SRF and its yield-increasing capacity and stability in different regions in order to promote the wide application of SRF in wheat cultivation and to ensure the safety of wheat production in China. Therefore, this study designed several SRF-application patterns, compared their differences in grain yield, N agronomic efficiency (NAE) and their benefits, and analyzed their response to different ecological regions. The objectives of this study were (1) to identify a high-yield and high-efficiency SRF-application strategy in wheat cultivation and (2) to explore whether and how the twice-split application of SRF improved wheat yield, N efficiency and their stability in different ecological regions.

2. Materials and Methods

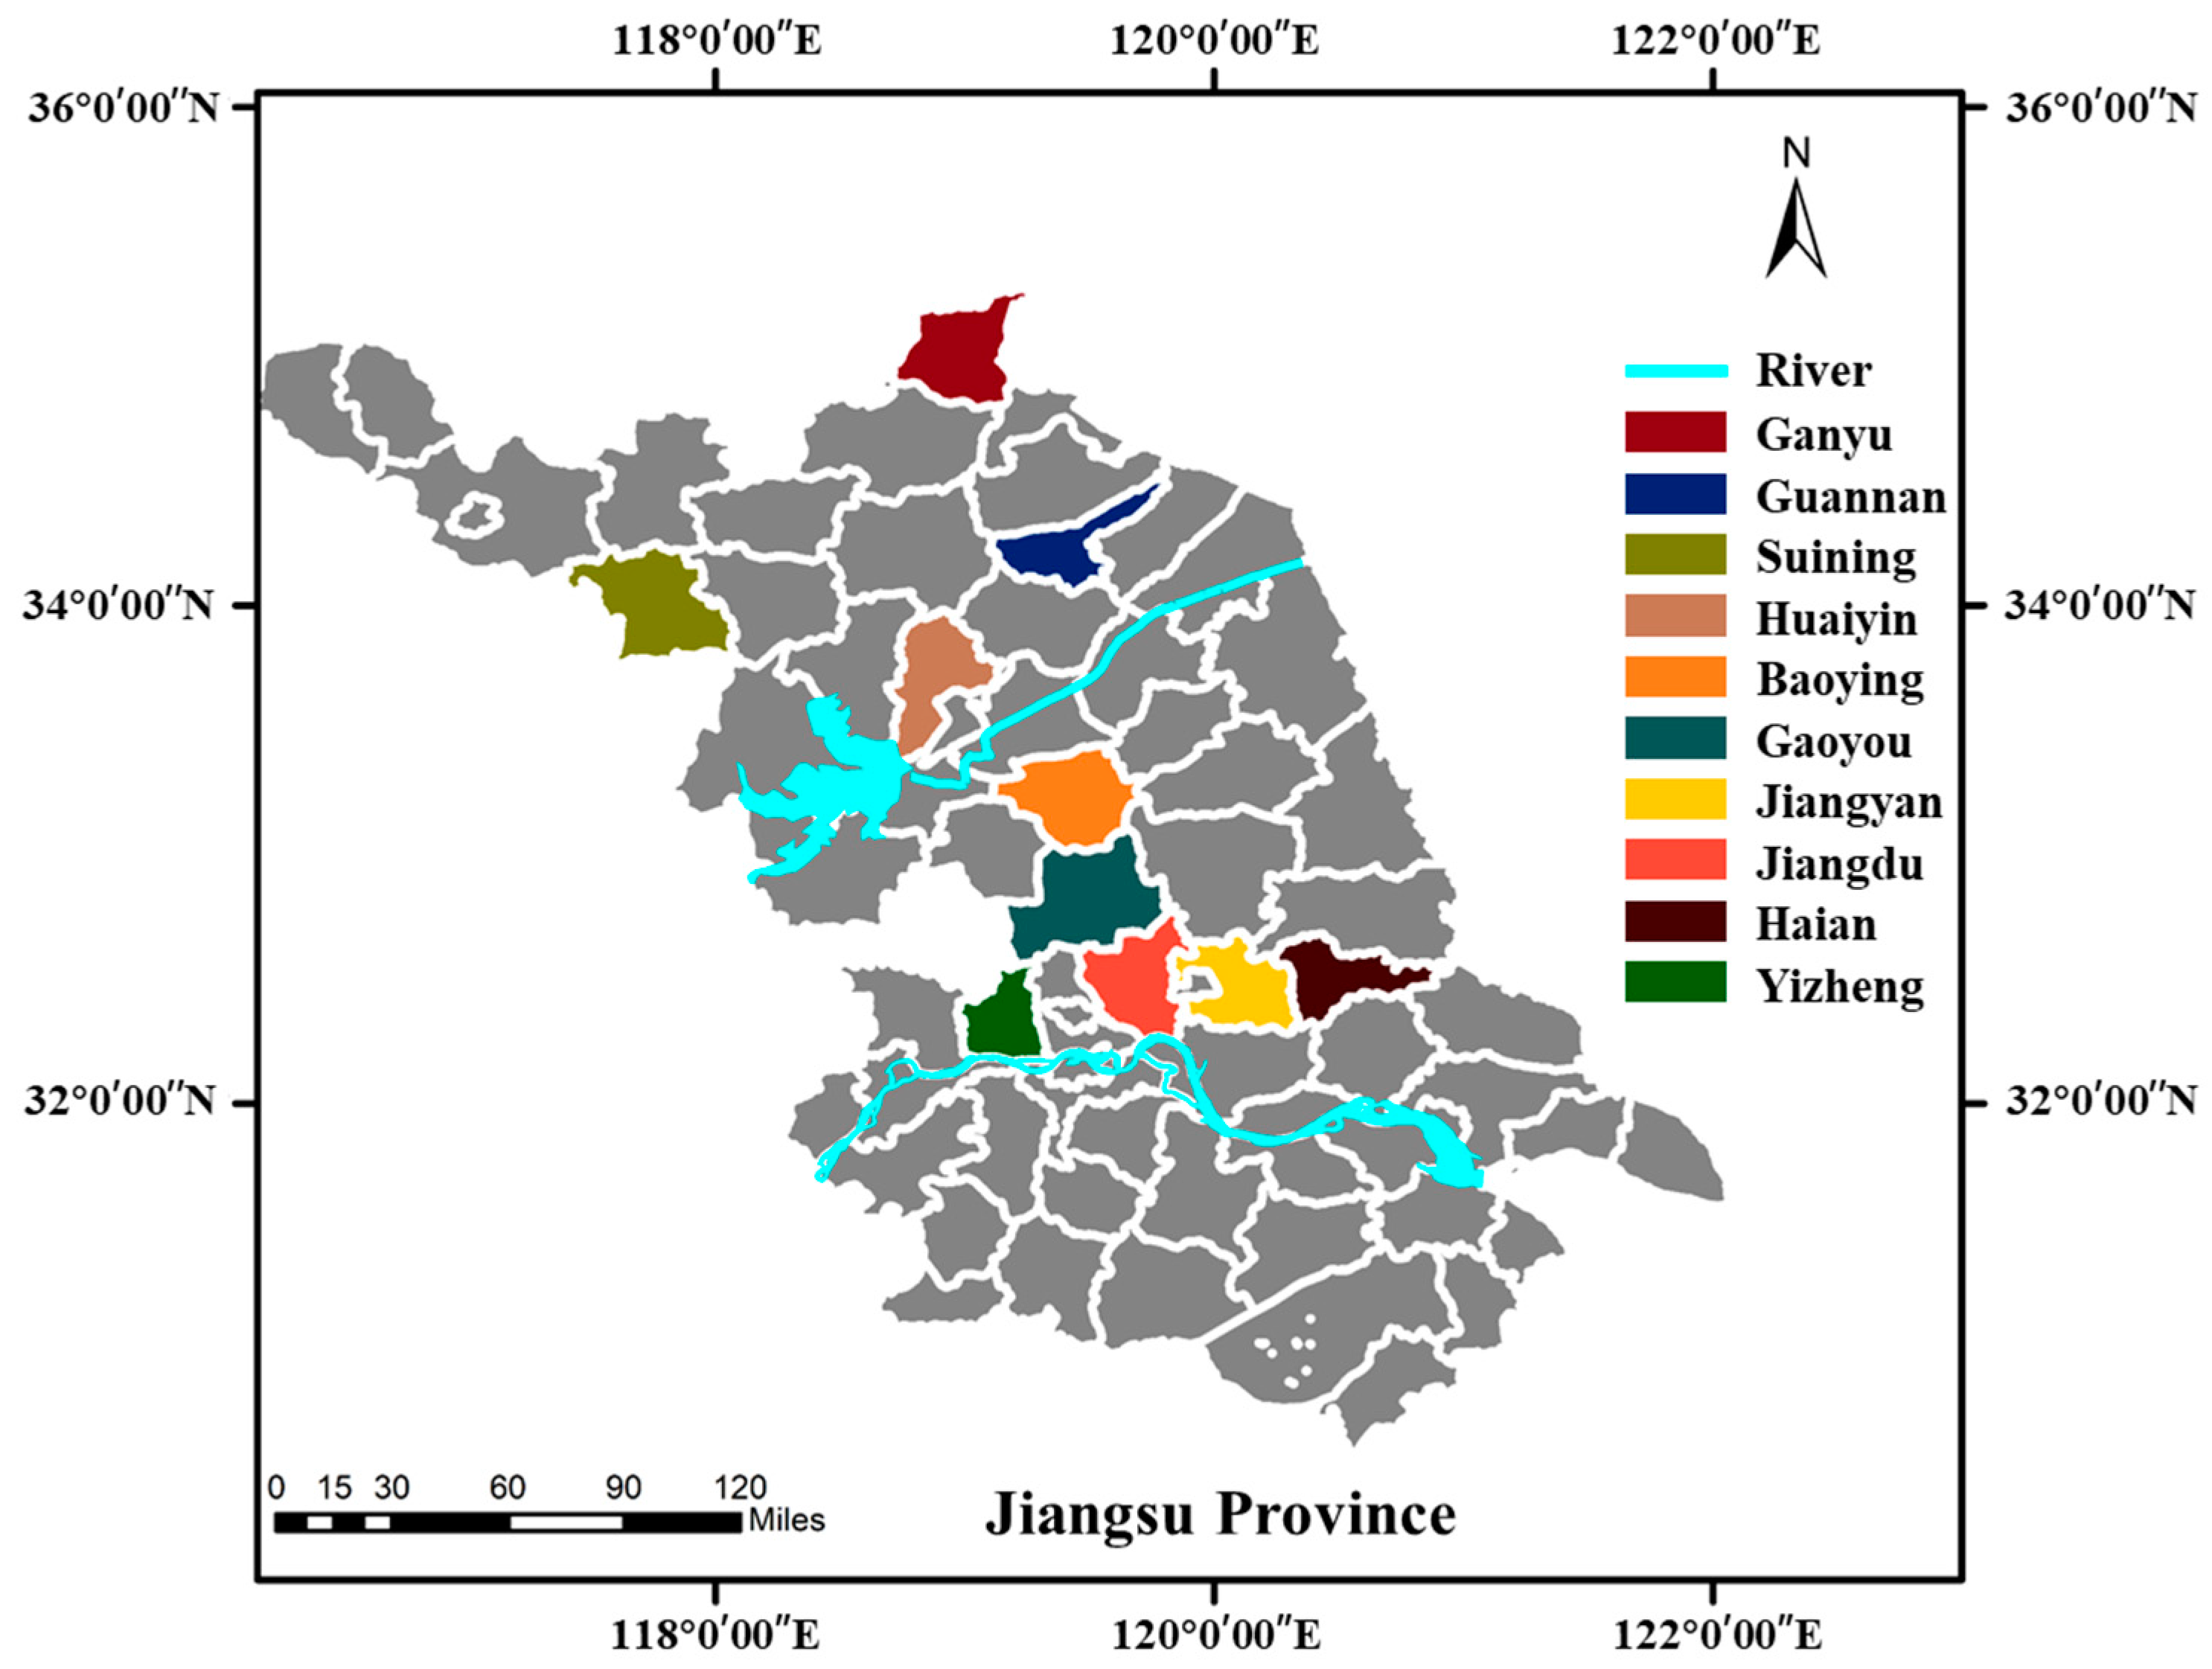
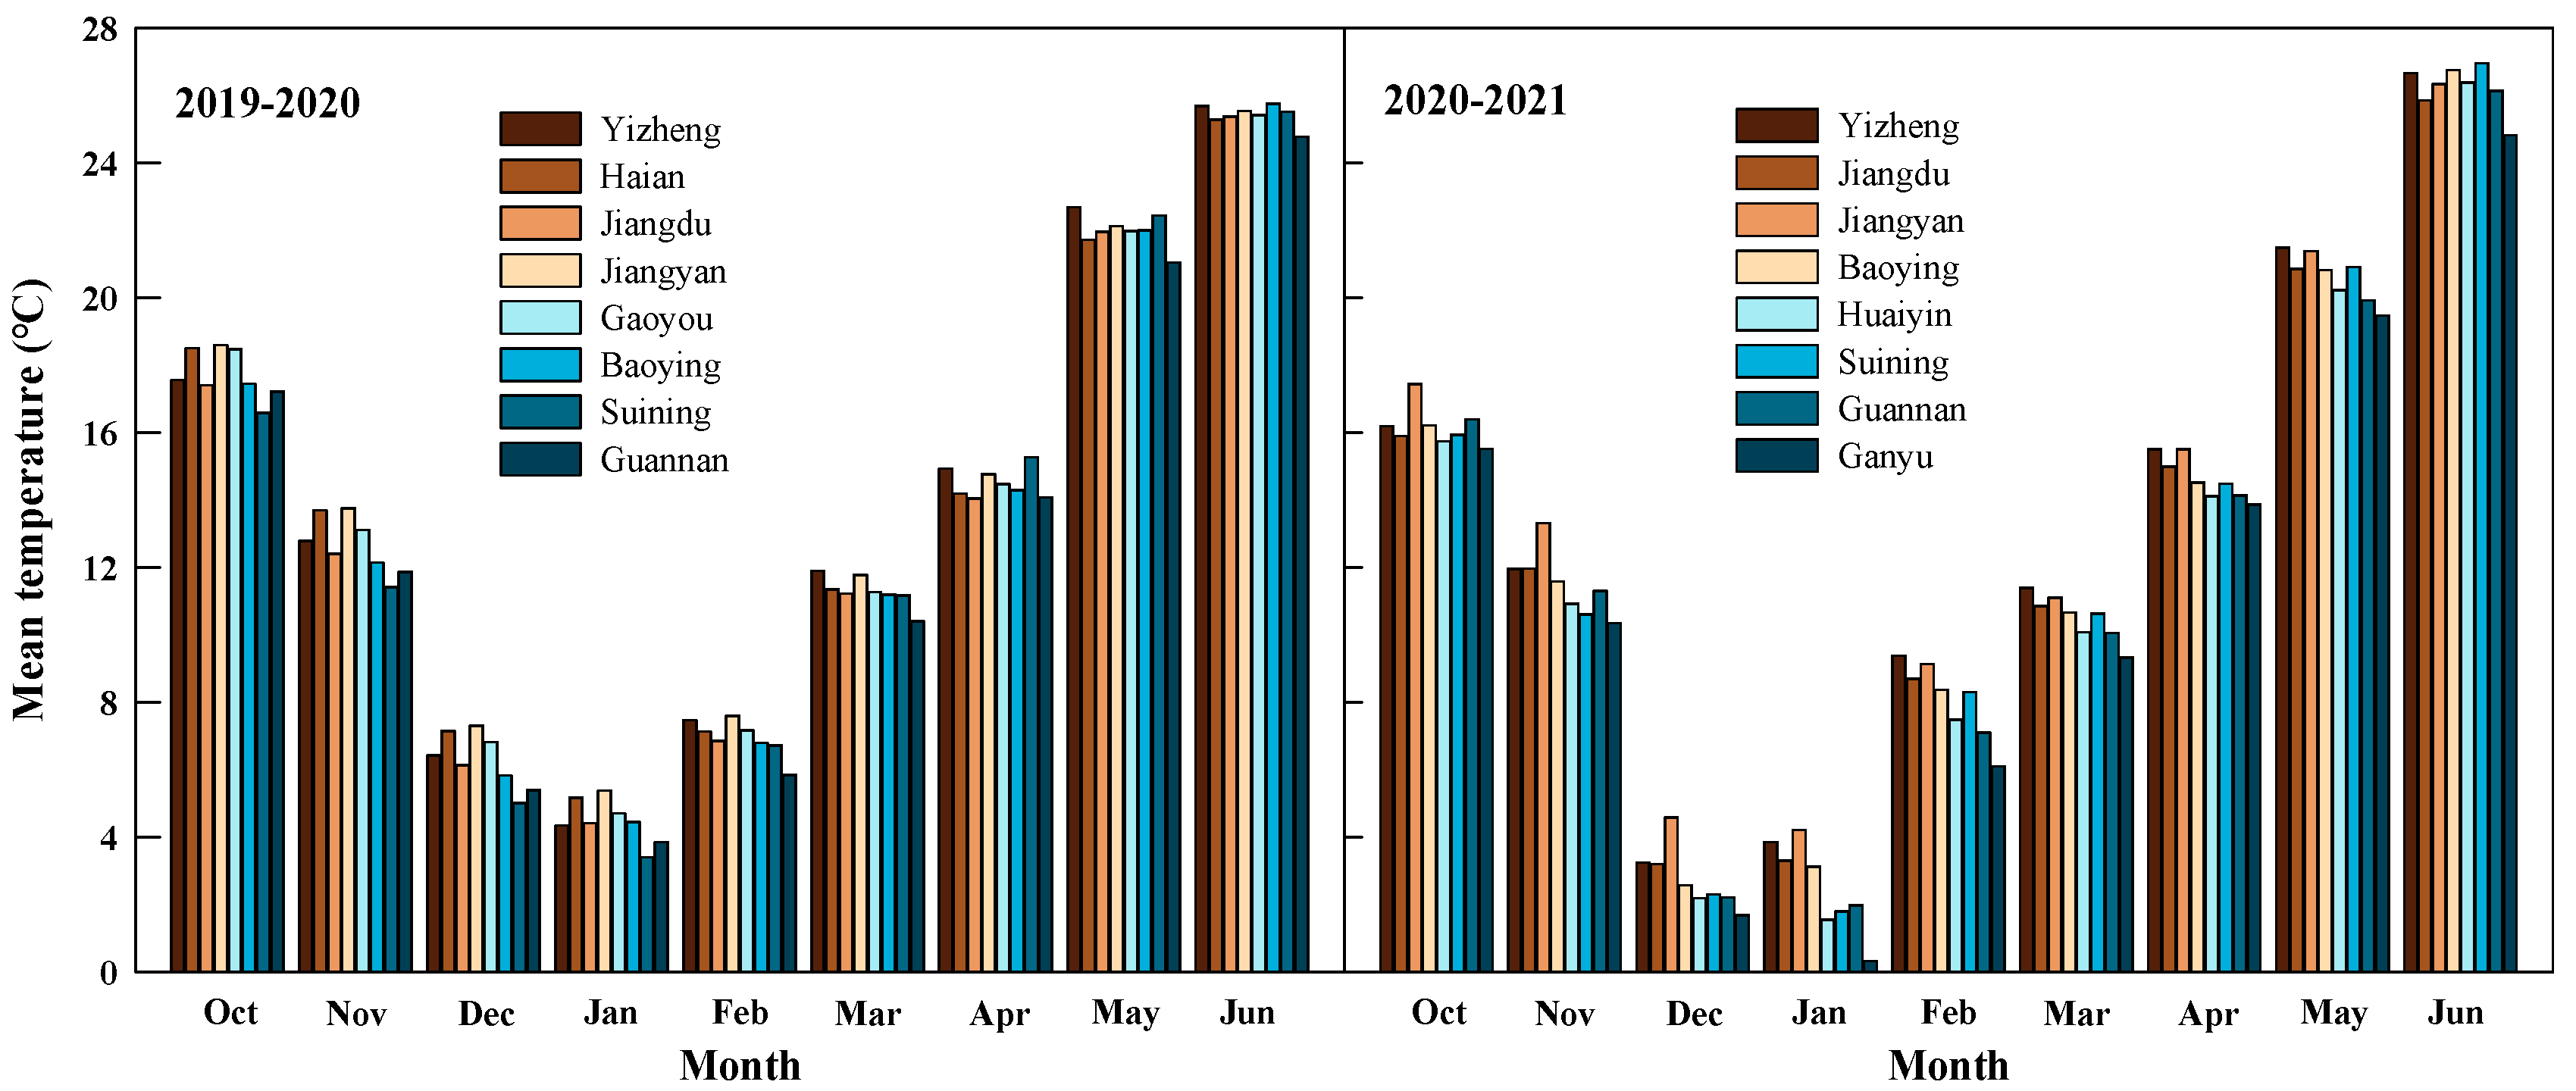
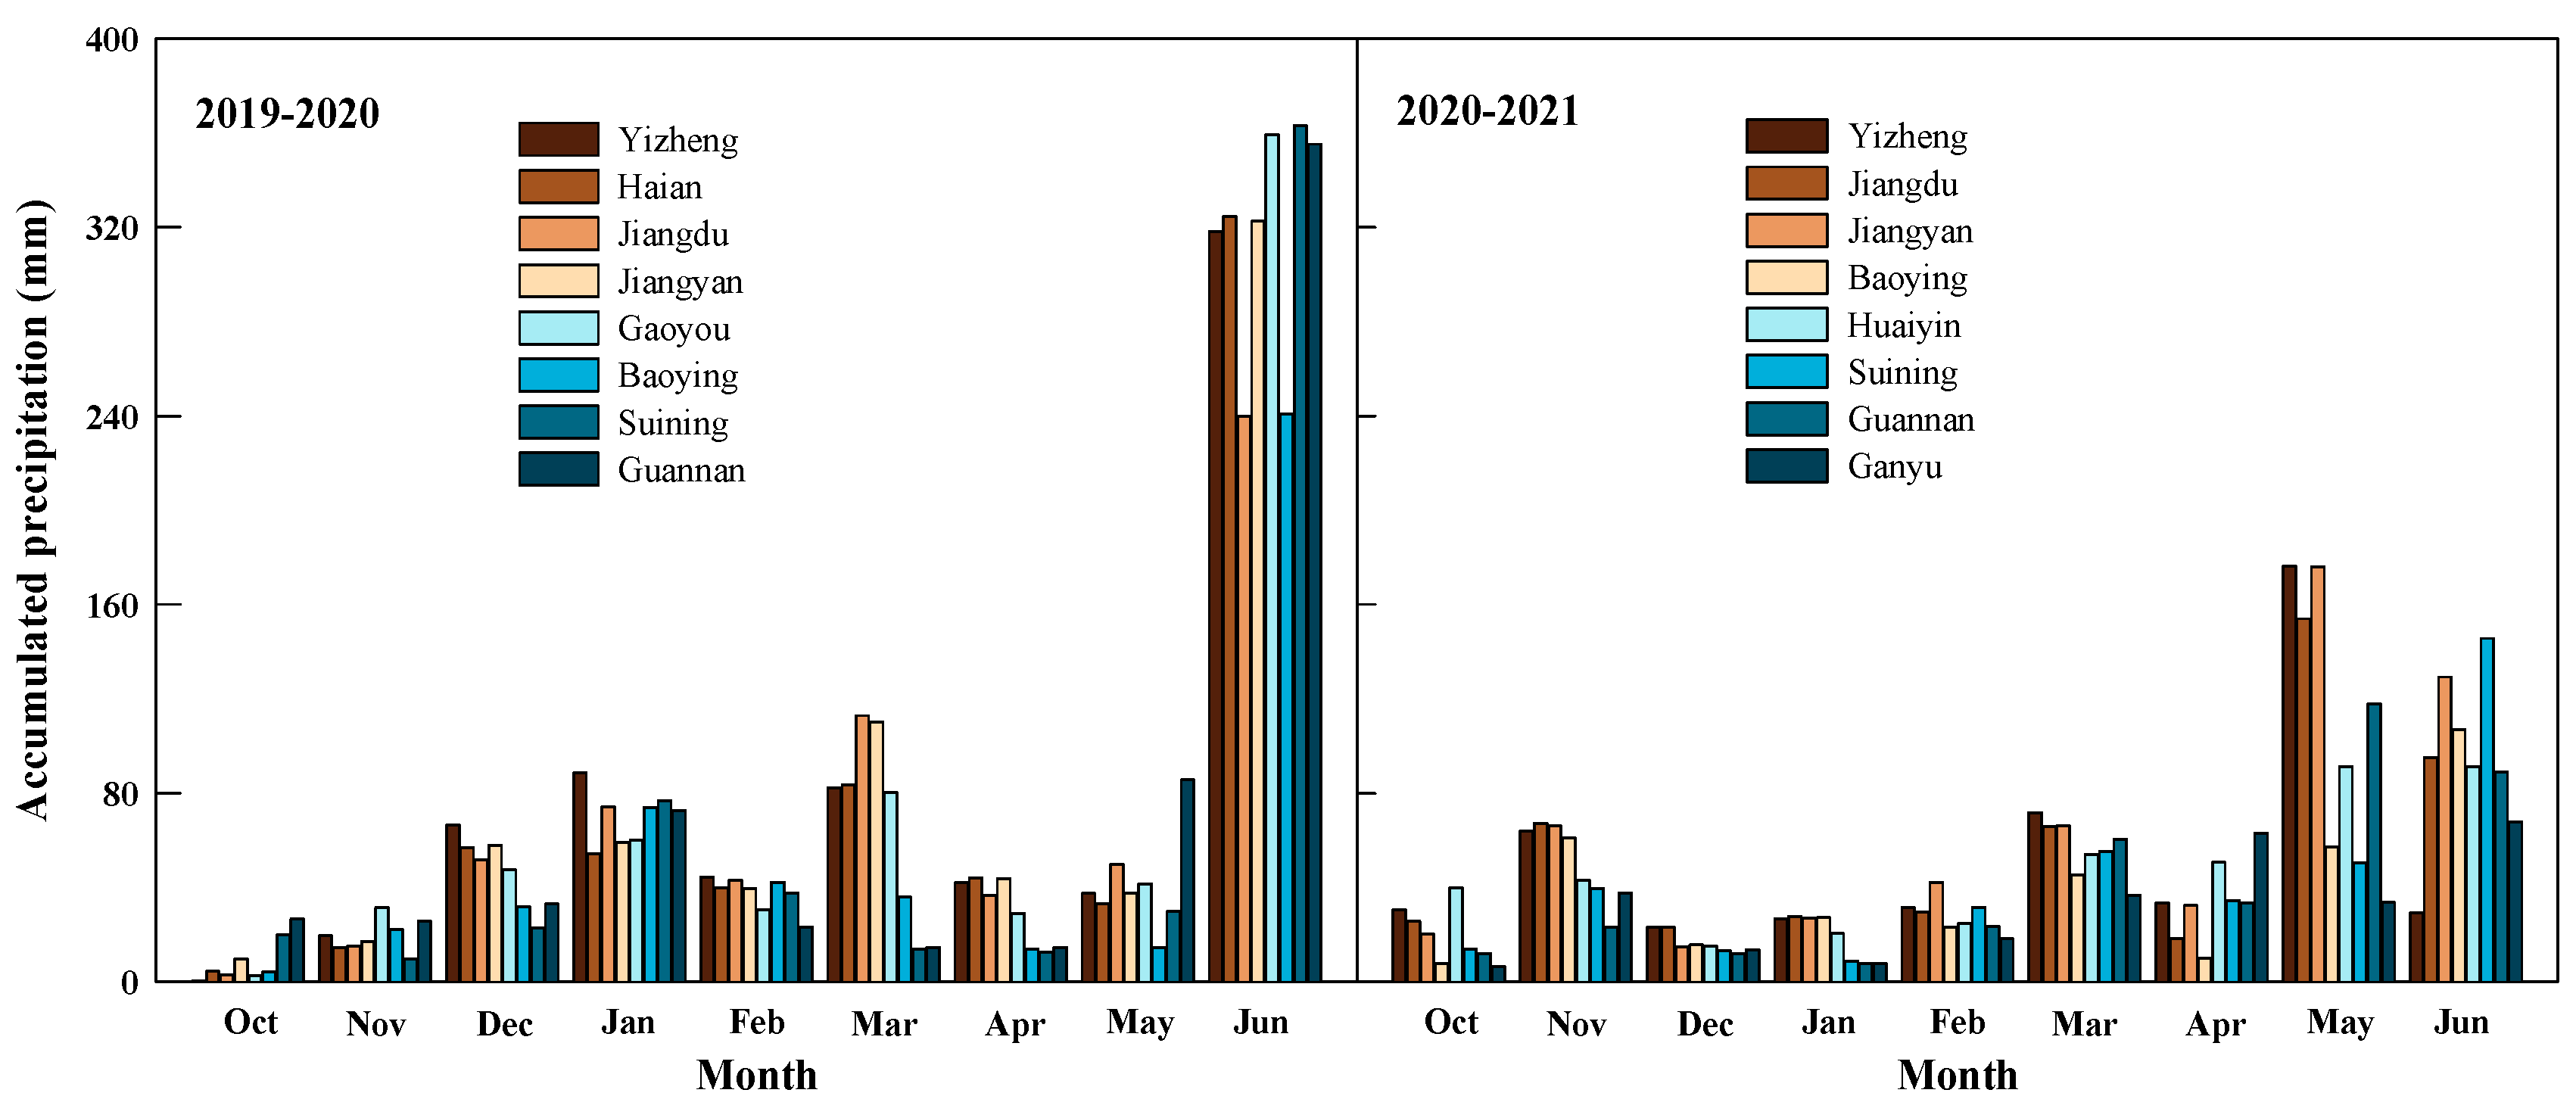
2.1. Materials and Site Description

During the wheat-growing seasons of 2019–2021, the field experiment was conducted in different ecological regions (8 test sites per year) in the Jiangsu province, China (Figure 1). Among all the test sites, Yizheng, Haian, Jiangdu, Jiangyan, Gaoyou and Baoying are located in the south of the Huaihe River and belong to the subtropical monsoon climate, while Huaiyin, Suining, Guannan and Ganyu are located north of Huaihe River and belong to the warm-temperate monsoon climate. At each test site, a widely promoted local wheat variety was grown in the field in a rotation with summer rice (Oryza sativa L.), and the rice straw was returned to the field in full quantity. Additional relevant information of each test site is shown in Table 1.
Temperature and precipitation are two important parameters affecting wheat growth (Figure 2 and Figure 3). In 2019–2020, the precipitation amount in Baoying, Suining and Guannan was very low during the vigorous growth of wheat in the spring (February to March 2020), among which the period of low rainfall in Guannan lasted the longest, resulting in the severe drought of wheat in the spring and thus affecting the top-dressing and normal growth of wheat. In 2020–2021, wheat at different test sites suffered from different degrees of low-temperature stress and the most severe frost damage was observed in Ganyu during the over-wintering stage, resulting in the death of tillers and thus limiting the number of spikes per unit area at the maturity stage.
The SRF used in this study was a mixture of sulfur-coated urea and common phosphorus and potassium fertilizers (N:P2O5:K2O = 26:12:12), with a sustained-nutrient-release period of 90–120 days, which was provided by Hanfeng Slow-Release Fertilizer (Jiangsu) Co., Ltd., China. Other common fertilizers were also used in this study, including urea (46.3% N), superphosphate (12% P2O5) and potassium chloride (60% K2O).

2.2. Experimental Design

Five fertilization patterns (M1–M5) were designed with different fertilizer ratios and fertilization frequencies of sulfur-coated SRF and common urea. The experiment also included a control (CK) of urea applied at four stages. Detailed N-application rates and N management are shown in Table 2. The N rate adopted in the CK and M1–M3 was 270 kg ha−1, which is suitable for the high-yield cultivation of local wheat. The N rate of M4 and M5 was 229.5 kg ha−1, which was reduced by 15% based on M2 and M3, respectively. The amount of phosphate (P2O5) and potassium (K2O) in all treatments was 124.6 kg ha−1. In addition to the phosphate and potassium contained in sulfur-coated SRF, other phosphate and potassium fertilizers were applied as a basal fertilizer using superphosphate and potassium chloride. A blank control treatment without N application but with the same amount of phosphate and potassium was included to calculate the NAE. The depth of the basal-fertilizer application in the soil was 10−15 cm, whereas the top-dressing was broadly cast on the soil surface. Each treatment was conducted in triplicate and the area of each replicate was 300 m2. At each test site, the wheat was sowed with a seeder during the appropriate sowing date, following the local suitable density. Additional field management of wheat was performed according to local high-production guidelines.

2.3. Sampling and Analysis

At the maturity stage, an area of 1 m2 in each plot was randomly selected to count the spike number and harvested manually to determine the grain yield. A quantity of 1000 kernels were randomly selected from the yield-measurement sample to calculate the TGW. The grains’ moisture content was determined and the grain-yield value and TGW were adjusted to 13% moisture. More than 50 ear-bearing culms from each treatment were randomly selected to determine the kernel number per spike by estimating a mean value. NAE was calculated based on the grain yield and N-application rate, and the formula was as follows [28]:
N A E   ( % ) = Y F Y 0   N   application   amount   × 100
where YF is the grain yield in the N treatment and Y0 is the grain yield in the blank control.
To assess the economics of SRF application in wheat, the net benefit was calculated by the following formula:
Net   benefit   ( CNY   ha 1 ) = T O C N F C T L C O T
where TO is the total output, CNF is the N-fertilizer cost, CTL is the top-dressing labor cost, and COT is other costs. TO is the product of the grain yield and the unit price of wheat.
The unit price of wheat in the two years followed the average price in the first half of 2020 and 2021 in the Jiangsu province, respectively. The prices of urea and SRF were calculated from the market price of 2100 CNY t−1 and 2850 CNY t−1, respectively. The labor cost of top-dressing was 150 CNY ha−1 each time. Other costs amounted to 4903.5 CNY ha−1, including phosphate and potassium fertilizer, wheat seeds, pesticides, agricultural machinery, labor input (except top-dressing), etc.
The coefficient of variation (CV) method was used to evaluate the effect and stability of different fertilization patterns on the wheat yield and NAE in different regions. The CV of the yield was calculated as follows [36]:
C V Y = ( S Y ÷ Y ) × 100 %
where SY is the standard deviation of yield for each treatment and Y is the average grain yield at different test sites for each treatment. Data for the two years were calculated separately. The quadrant graph was drawn with CVYCVA as the abscissa axis, YYA as the ordinate axis and the coordinate (0, 0) as the origin. CVA and YA are the mean values of CVY and Y for all treatments, respectively. If the coordinate is in quadrant I (CVYCVA > 0, YYA > 0), it means that the fertilization pattern is productive but unstable; if the coordinate is in quadrant II (CVYCVA < 0, YYA > 0), it means that the fertilization pattern is productive and stable; if the coordinate is in quadrant III (CVYCVA < 0, YYA < 0), it means that the fertilization pattern is stable but not productive; if the coordinate is in quadrant IV (CVYCVA > 0, YYA < 0), it indicates that the fertilization pattern is neither productive nor stable.
The CV of NAE was calculated as follows [36]:
C V N = ( S N ÷ N A E ) × 100 %
where SN is the standard deviation of NAE for each treatment. The quadrant graph was drawn with CVNCVB as the abscissa axis, YYA as the ordinate axis and coordinate (0, 0) as the origin. CVB and NAEB are the mean values of CVN and NAE for all treatments, respectively. If the coordinate is in quadrant I (CVNCVB > 0, NAENAEB > 0), it means that the fertilization pattern is high-NAE but unstable; if the coordinate is in quadrant II (CVNCVB < 0, NAENAEB > 0), it means that the fertilization pattern is high-NAE and stable; if the coordinate is in quadrant III (CVNCVB < 0, NAENAEB < 0), it indicates that the fertilization pattern is stable but low-NAE; if the coordinate is in quadrant IV (CVNCVB > 0, NAENAEB < 0), it indicates that the fertilization pattern is neither high-NAE nor stable.

2.4. Statistical Analysis of Data

Microsoft Excel 2010 (Microsoft Corporation, Washington, DC, USA) was used to process data, and Sigmaplot 10.0 (Systat Software, Inc., San Jose, CA, USA) was adopted to draw figures. A two-way analysis of variance (ANOVA) was conducted to evaluate the main and interactive effects of fertilization pattern and ecological area on grain yield, economic benefit, and NAE, using SPSS 19.0 (SPSS, Inc., Chicago, IL, USA). Where effects were significant, treatment means were compared using the least-significant-difference (LSD) test at p < 0.05.

3. Results

3.1. Grain Yield and Yield Components

3.1.1. Grain Yield

Different ecological regions and fertilization patterns showed significant effects on the wheat yield (Table S1). In 2019–2020, the average yield in Suining was the highest at 9239.18 kg ha−1, which was significantly higher than that of the test sites south of the Huaihe River. In 2020−2021, the average yields in Huaiyin, Suining and Guannan were observed to be significantly higher than those of in Yizheng, Jiangdu, Jiangyan and Baoying. The drought in spring and low-temperature stress at the over-wintering step resulted in the yield reduction in Guannan (2019–2020) and Ganyu (2020−2021), respectively. Comparing the yields in different fertilization patterns, it could be found that M1 significantly decreased the grain yield by 4.70% and 3.10% compared with the CK in 2019–2020 and 2020−2021, respectively. M2 significantly increased the grain yield compared with the CK, but the average increase was no more than 5% over the two years. The highest grain yield was observed in M3, which increased the grain yield significantly by 8.49% and 7.76% compared with the CK in 2019–2020 and 2020−2021, respectively. After reducing the N input by 15%, the grain yield in M5 showed no significant difference from the CK but was significantly higher than that in M4 in 2019–2020.
Further analysis of the relative yield of different fertilization patterns in different ecological regions showed that the relative yields in M1−M5 varied greatly in different regions (Figure 4). The relative yields of M1 and M4 were below 100% at most test sites over the two years. The relative yield of M3 was higher than 100% at all of the test sites (101.07%−121.31% in 2019–2020, 102.56%−111.23% in 2020−2021), and showed a trend of being higher than that of M2 at all of the test sites, except in Gaoyou (2019–2020), Baoying (2019–2020) and Ganyu (2020−2021). In 2019–2020, both M2 and M4 showed significantly lower relative yields compared with M3 and M5 in Guannan, which could be due to the drought in the spring, limiting the effect of the urea top-dressing.
As shown in Figure 5, CK is in quadrant III in both years, indicating that the yield of CK was slow but stable in different ecological conditions; M3 is in quadrant II, indicating that it was productive and stable in different ecological conditions; M2 also showed a relatively high yield but its stability was lower than M3. Among the treatments with equal N input, the yield and stability of M1 were the lowest.

3.1.2. Yield Components

Different ecological regions and fertilization patterns showed significant effects on the spikes per unit area, kernels per spike and TGW (Table S1). Comparing the yield components of different fertilization patterns, it was found that M1 had the lowest spike number and TGW in either year. M3 achieved the highest spike number and TGW, which were significantly higher than the CK, but there was no significant difference in kernel number per spike. There was no significant difference in spike number and kernel number per spike between M4, M5 and CK, but the TGW in M4 was significantly lower than that in M5 and the CK over the two years.
In different ecological regions and fertilization patterns, the grain yield was significantly correlated with spike number (r2019–2020 = 0.799 **, r2020–2021 = 0.828 **) and TGW (r2019–2020 = 0.311 *, r2020–2021 = 0.311 *) in both years, and the path-coefficient analysis showed that the spike number had the highest direct-path coefficient, followed by the kernel number per spike and the TGW, indicating that the spike number was the most important direct contributor to the grain yield (Table 3).

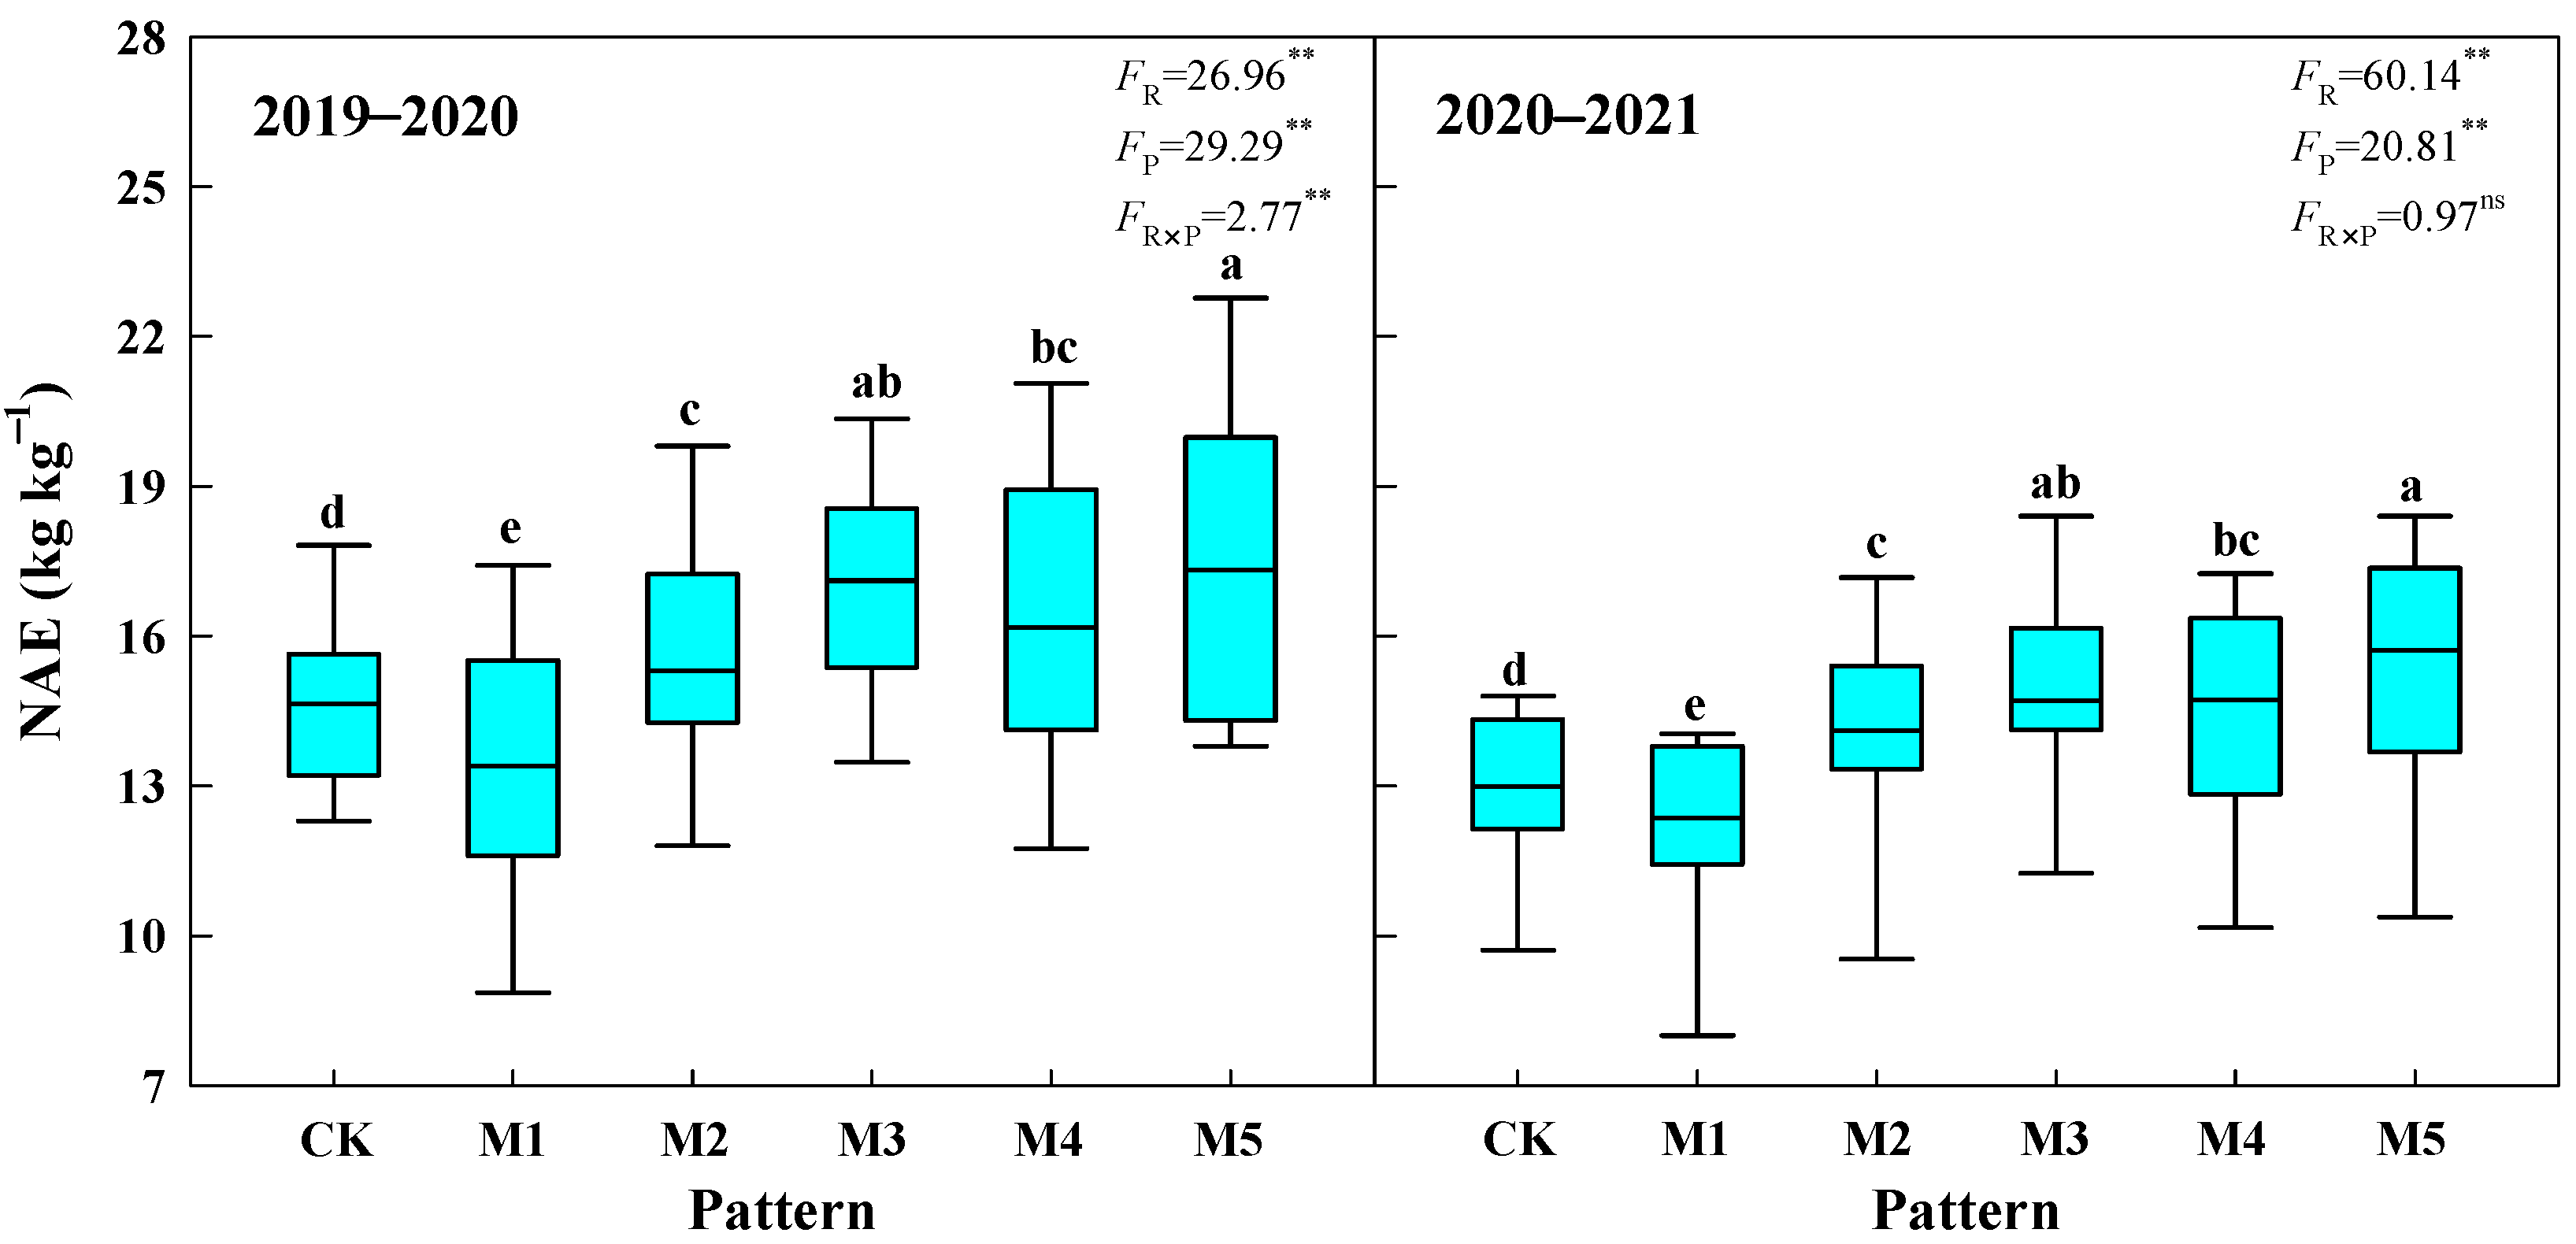
3.2. Nitrogen Agronomic Efficiency

The NAE of wheat was significantly affected by different ecological regions and fertilization patterns (Figure 6). Compared with the CK, M1 significantly decreased NAE by 9.04% in 2019–2020 and 6.77% in 2020−2021. The NAE in M2 was significantly higher than that in the CK, but significantly lower compared with that in M3. Despite reducing the N rate by 15%, M4 and M5 significantly increased NAE compared to the CK. M5 achieved the highest average NAE in all of the fertilization patterns, which was increased by 18.44% and 17.13% compared with the CK in both years, respectively.
The NAE of different fertilization patterns differed greatly at different test sites (Figure 7). The relative NAE of M1 was lower than that of M2−M5 at all of the test sites over the two years and was below 100% at most test sites. In 2019–2020, the relative NAE of M2 showed a similar trend as M4 at different test sites but was higher than M4 in Baoying, Haian, Jiangdu, Jiangyan, Gaoyou and Suining; similar to the yield, M2 and M4 in Guannan had significantly decreased relative NAE compared with that of M3 and M5 due to the drought in the spring; M5 achieved the highest relative NAE, except in Yizheng, Jiangdu and Baoying. In 2020−2021, the relative NAE of M4 tended to be higher than that of M2 at most of the test sites, and similar results were observed in M5 and M3; M5 achieved the highest relative NAE, except in Huaiyin, Jiangyan and Baoying.
Different fertilization patterns significantly affected the NAE and its stability in different ecological regions (Figure 8). The CK was stable but had low NAE in both years; the stability of NAE in M3 was similar to that in CK, but its NAE was much higher than CK; M1 had the lowest NAE and stability. Due to the reduction of N input, M4 and M5 had increased NAE compared with CK, but decreased stability.

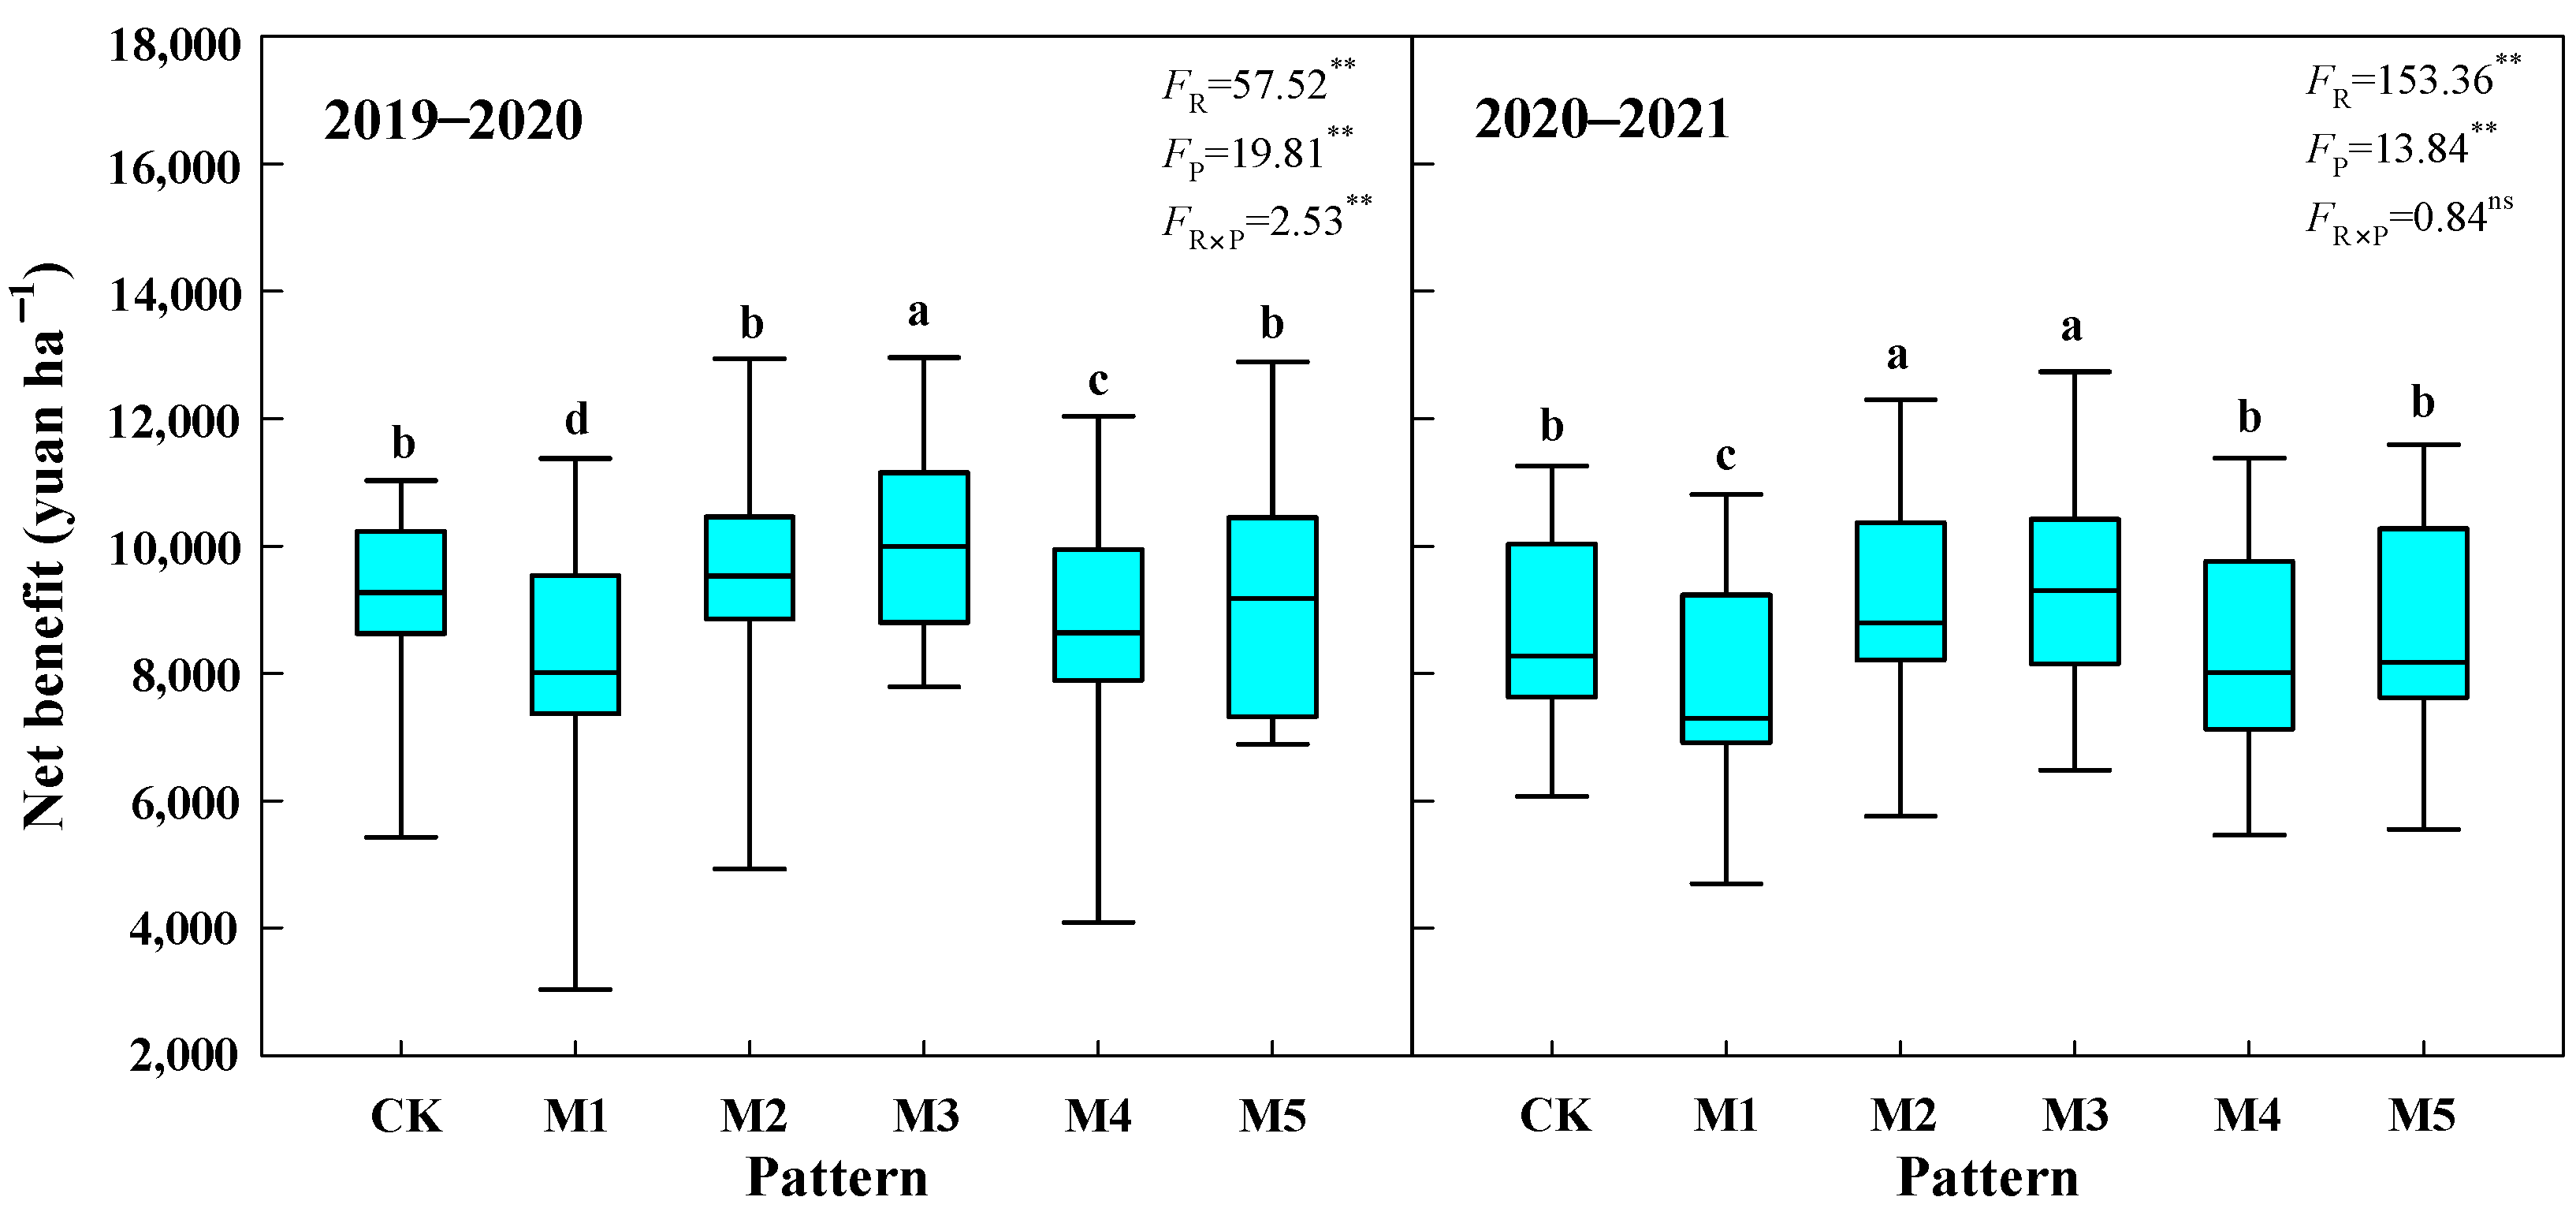
3.3. Economic Benefit

As the grain-yield, fertilizer-cost and fertilization-labor inputs jointly determined the economic benefits of wheat planting, significant differences in benefits were observed with different fertilization patterns (Figure 9). Compared with the CK, M1 decreased the artificial input of the top-dressing, but increased the cost of the nitrogen fertilizer and reduced the grain yield, resulting in a significant reduction in net benefit with a decrease of 13.88% in 2019–2020 and 8.60% 2020−2021. Compared with the CK, the average benefit of M2 and M3 increased by 4.12% (3.14% in 2019–2020 and 5.11% in 2020−2021) and 9.63% (11.46% in 2019–2020 and 7.80% in 2020−2021), respectively. M4 reduced the benefit by 6.56% in 2019–2020 and 4.61% in 2020−2021 compared with the CK. The benefit of M5 showed no significant difference compared with that of the CK and was significantly higher than that of M1.
The benefit of different fertilization patterns differed greatly at different test sites (Figure 10). The relative benefit of M1 and M4 was below 100% at most test sites over the two years. Except in Baoying (2019–2020), the relative benefit of M5 was higher than that of M1, and was above 100% in Haian, Jiangyan, Suining and Guannan in 2019–2020 and in Baoying, Suining, Guannan and Ganyu in 2020–2021. Similar to the yield, M3 obtained the highest relative benefit at most test sites, except in Gaoyou (2019–2020), Baoying (2019–2020) and Huaiyin (2020−2021).

4. Discussion

4.1. Synergies of NAE, Yield and Benefit of Wheat under Different Fertilization Patterns

SRF is produced by wrapping urea with various slow-release materials in order to release N into the soil at a more synchronous rate with the crop’s N absorption, thereby increasing the N availability to the crops, decreasing inorganic N leaching into the deep soil layer and reducing the risk of N loss [7,16,37]. However, the present study showed that although three top-dressing times were eliminated, the one-time application of SRF significantly decreased the NAE compared with the fourth-split urea application, contributing to a significant decrease in spike number, TGW and grain yield (Table S1, Figure 4). Previous studies indicated that SRF applied once as basal fertilizer released N too slowly or too fast due to the differences in fertilizer type and crops’ N-demand characteristics; therefore, it would not be an effective N source under certain circumstances [22,25]. For example, a single application of coated urea failed to increase the grain yield of early rice, which was related to the delayed release of N between the tillering and heading stages [33]. Winter wheat has a longer growth period compared with rice, even more than 230d [38]; therefore, a single application of N fertilizer is more likely to result in excessive growth during the vegetative period and slow crop growth during the reproductive period, thus decreasing grain yield and N-use efficiency [39].
A better-controlled urea-administration approach could boost early-season N availability as well as N absorption in the later growth stage [39]. This study found that M2 and M3 significantly improved NAE and grain yield compared with the fourth-split urea application and one-time SRF application (Table S1, Figure 6). The higher NAE in M3 indicated that the twice-split application of SRF could supply more N for wheat growth, which was beneficial to promote N uptake and utilization, especially in the later growth stage of wheat, thus reducing the death of tillering and increasing TGW. Our previous study [25] also confirmed that the twice-split application of controlled-release urea significantly increased the soil’s inorganic N content after jointing, which was beneficial to improving N uptake by wheat, delaying flag-leaf senescence and improving photosynthetic physiology post-anthesis, thereby contributing to a higher spike number and TGW while stabilizing the kernel number per spike. M2 had no significant differences in spike number and kernel number per spike, but it significantly decreased NAE and TGW compared with M3. After applying SRF before sowing, SRF that was top-dressed at re-greening could better meet the N demand of wheat in its later growth stage compared with urea that was top-dressed at jointing, thus promoting grain filling and increasing grain weight.
Yang et al. [32] reported that the application of controlled-release urea increased the grain yield of wheat compared with common urea even when the N rate was reduced by 20–30%. Geng et al. [19] also pointed out that controlled-release urea could reduce the recommended application rate of N by 30% while maintaining the same yield, thereby preserving soil fertility and saving labor. In the present study, with the N rate reduced by 15%, M5 had no significant difference in grain yield compared with the CK, but significantly increased grain yield compared with M1 in both years. More importantly, the highest NAE was obtained by M5, indicating that the twice-split application of SRF with a 15% N reduction was beneficial to decrease N loss and promote the uptake and utilization of fertilizer N by wheat. This was due to the fact that the supplied N of SRF was based on the needs of crops and maintained more mineral N in the topsoil in order to feed plants and decrease the leaching of N [19].
The economic considerations are the determinants limiting the adoption of controlled-release urea [39]. The use of expensive SRF has been proved to make sense from the point of view of mitigating environmental pollution [40]. However, the decrease in labor input failed to make up for the higher cost of CRNF, which was in the range of 2.5–8 times the cost of common chemical fertilizers [41]. Whether the yield benefits and saved labor cost can make up for the increase in fertilizer cost has become the key to the wide application of SRF, affecting the enthusiasm of farmers to grow wheat [25]. In this study, the one-time application of SRF saved the labor input for three top-dressing steps but significantly reduced grain yield, resulting in a significant decrease in net benefits compared with the fourth-split urea application (Figure 9). Among all of the patterns, M3 achieved the highest yield with only two fertilization inputs, which significantly increased benefits over the fourth-split urea application, with an average increase of 9.92% and 7.79%, respectively, in both years. This study confirmed that the twice-split application of SRF was an efficient way for SRF to reduce labor input, compensate for fertilizer cost and increase income. In addition, the twice-split application of SRF with a 15% N reduction had no significant difference in economic benefit compared with 100% N rate of the fourth-split urea application, but it could play an important role in promoting ecological benefits.

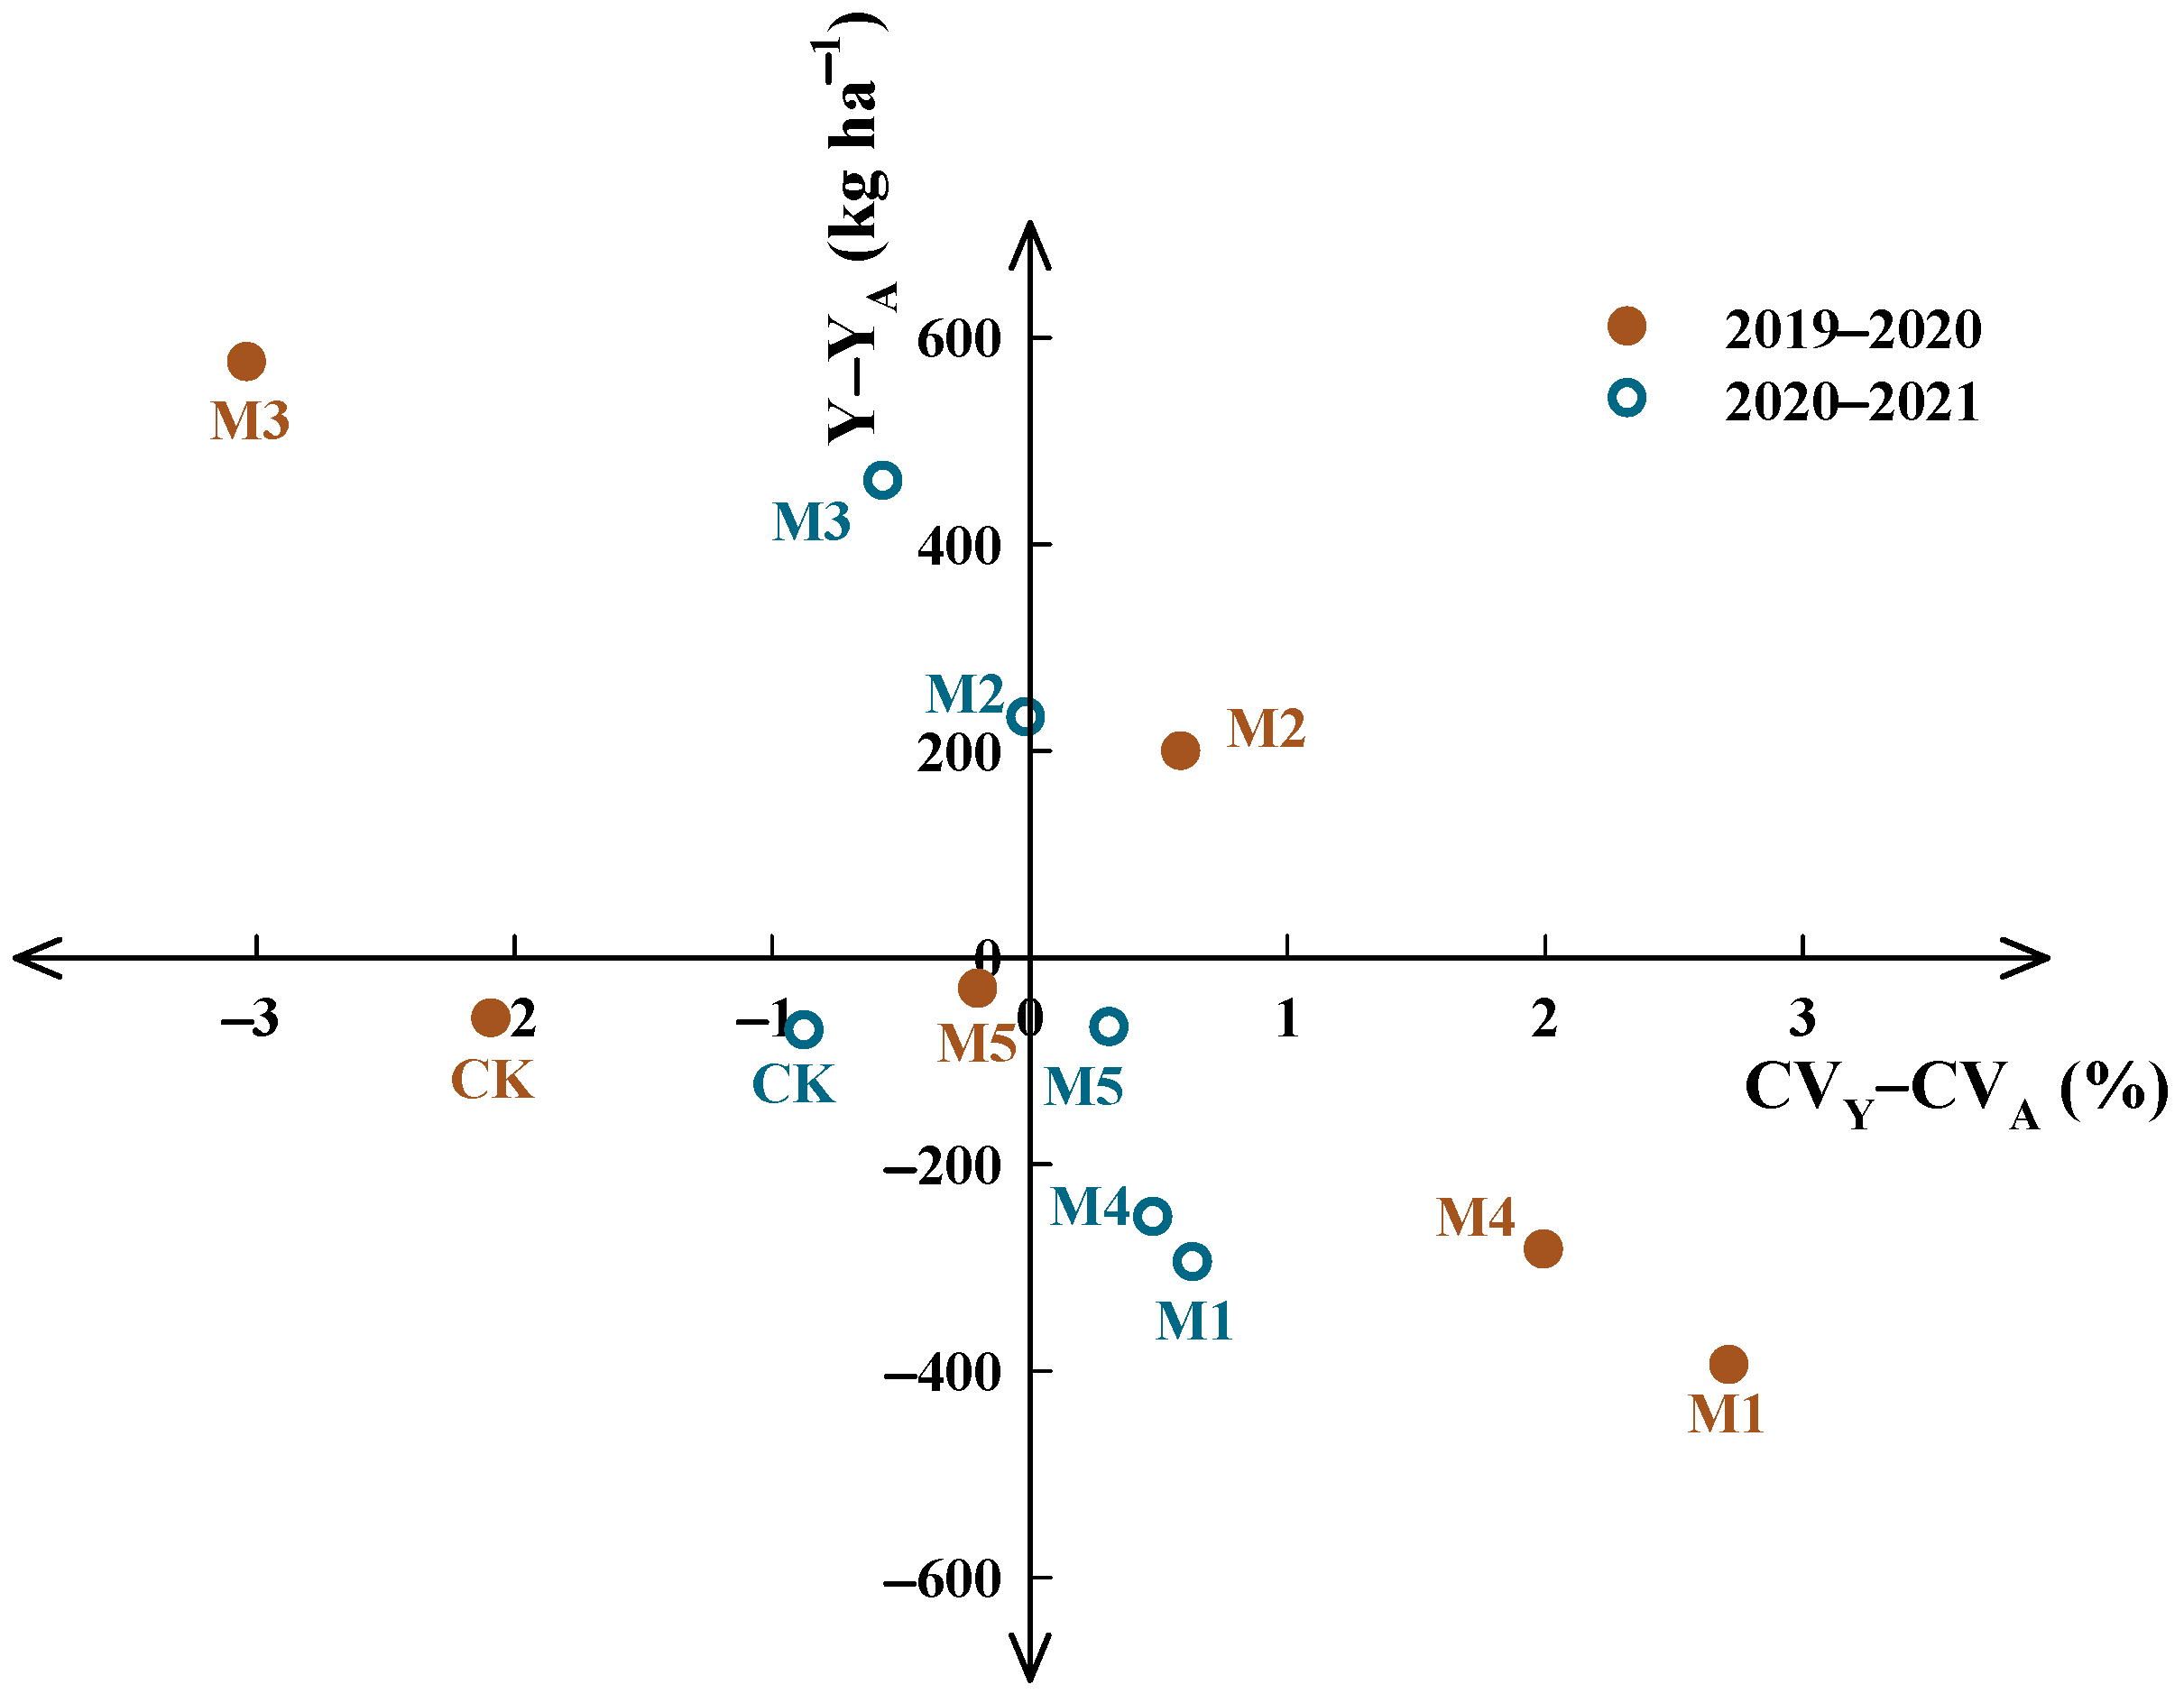
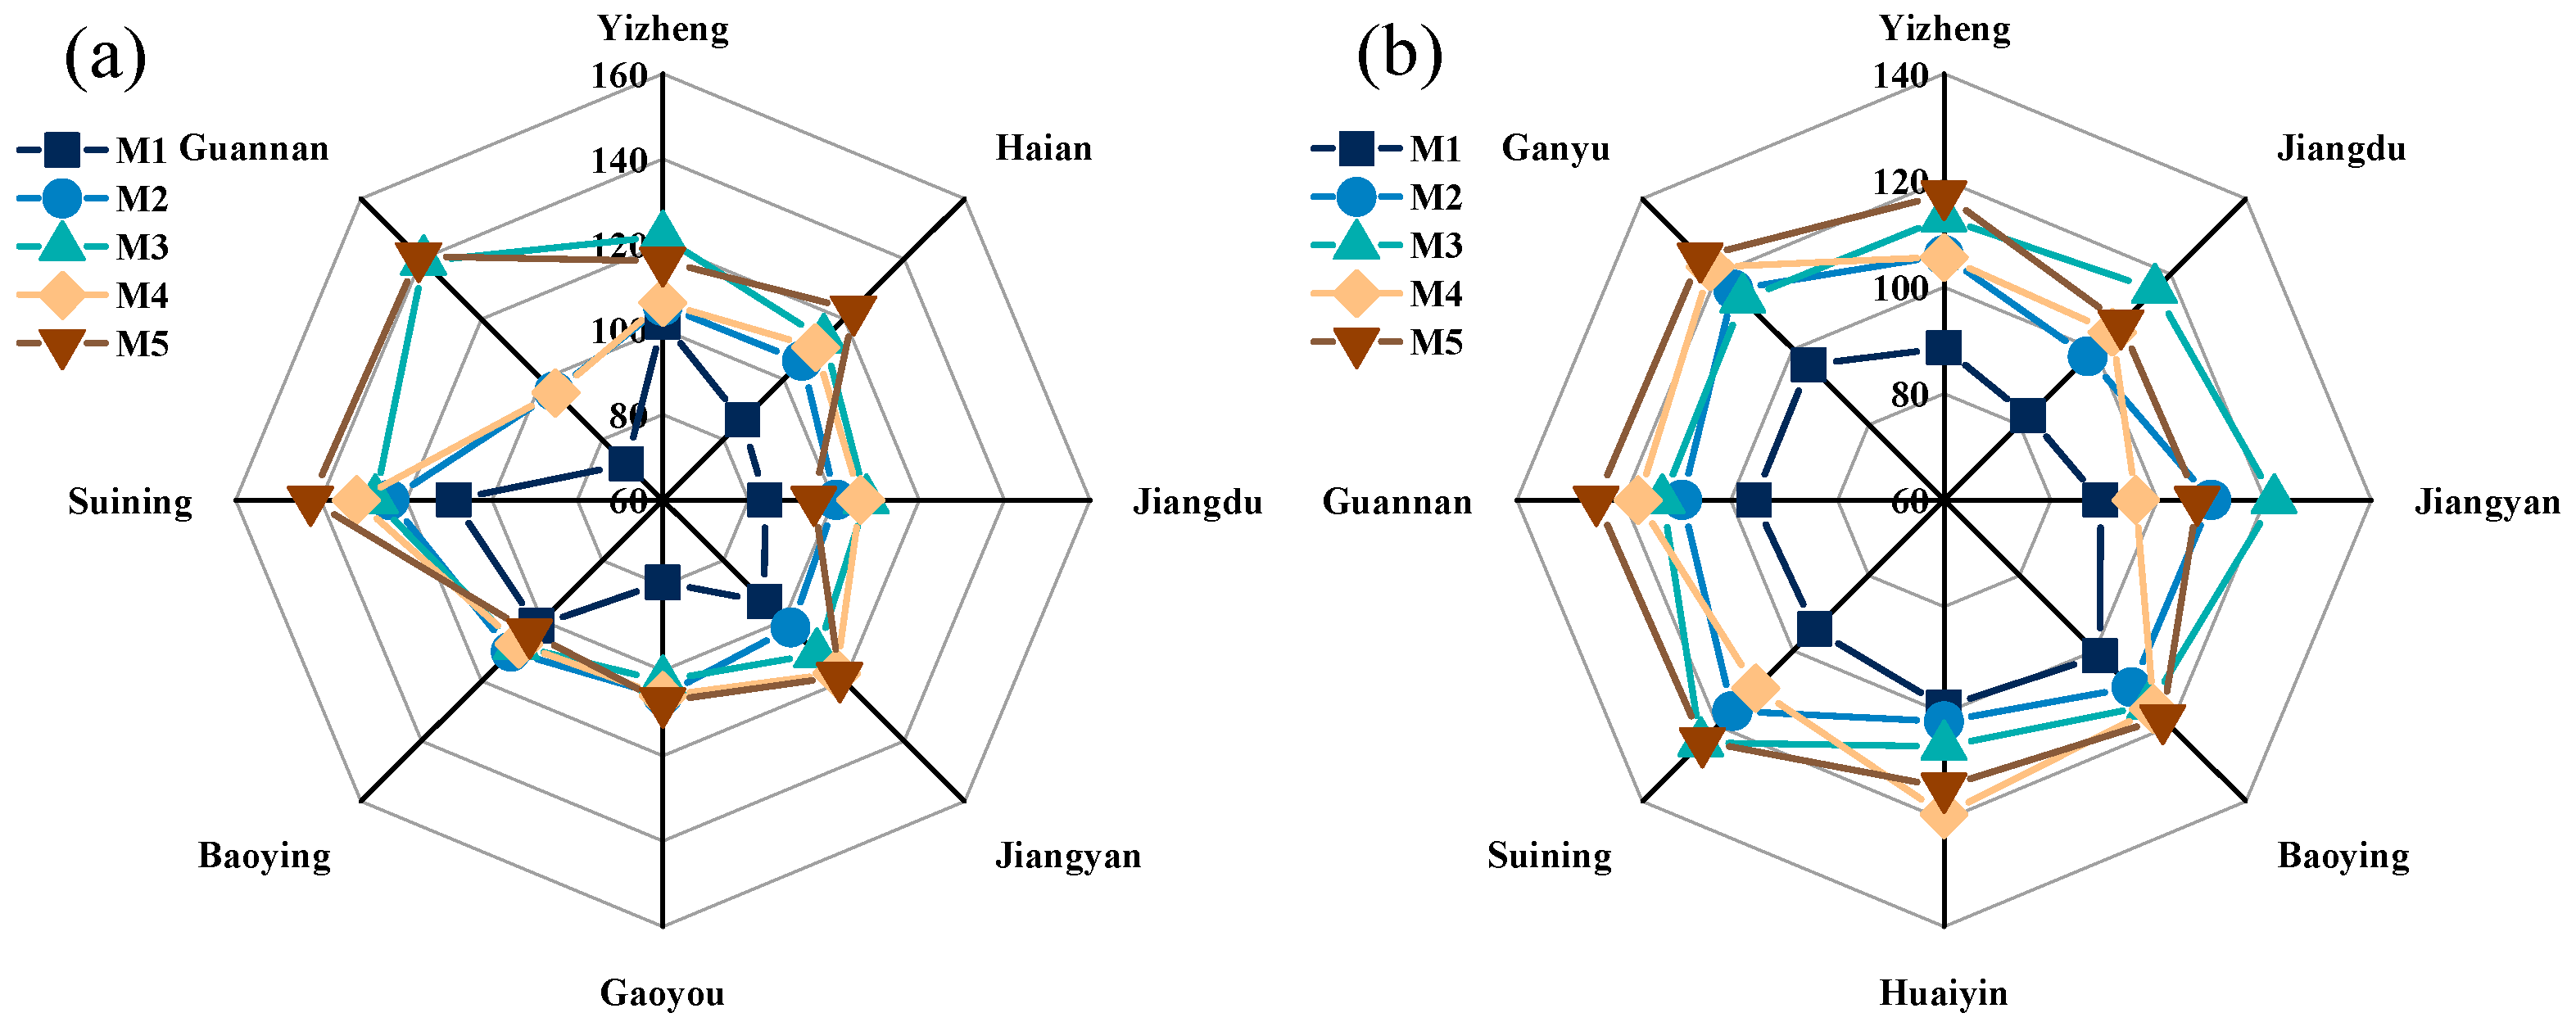
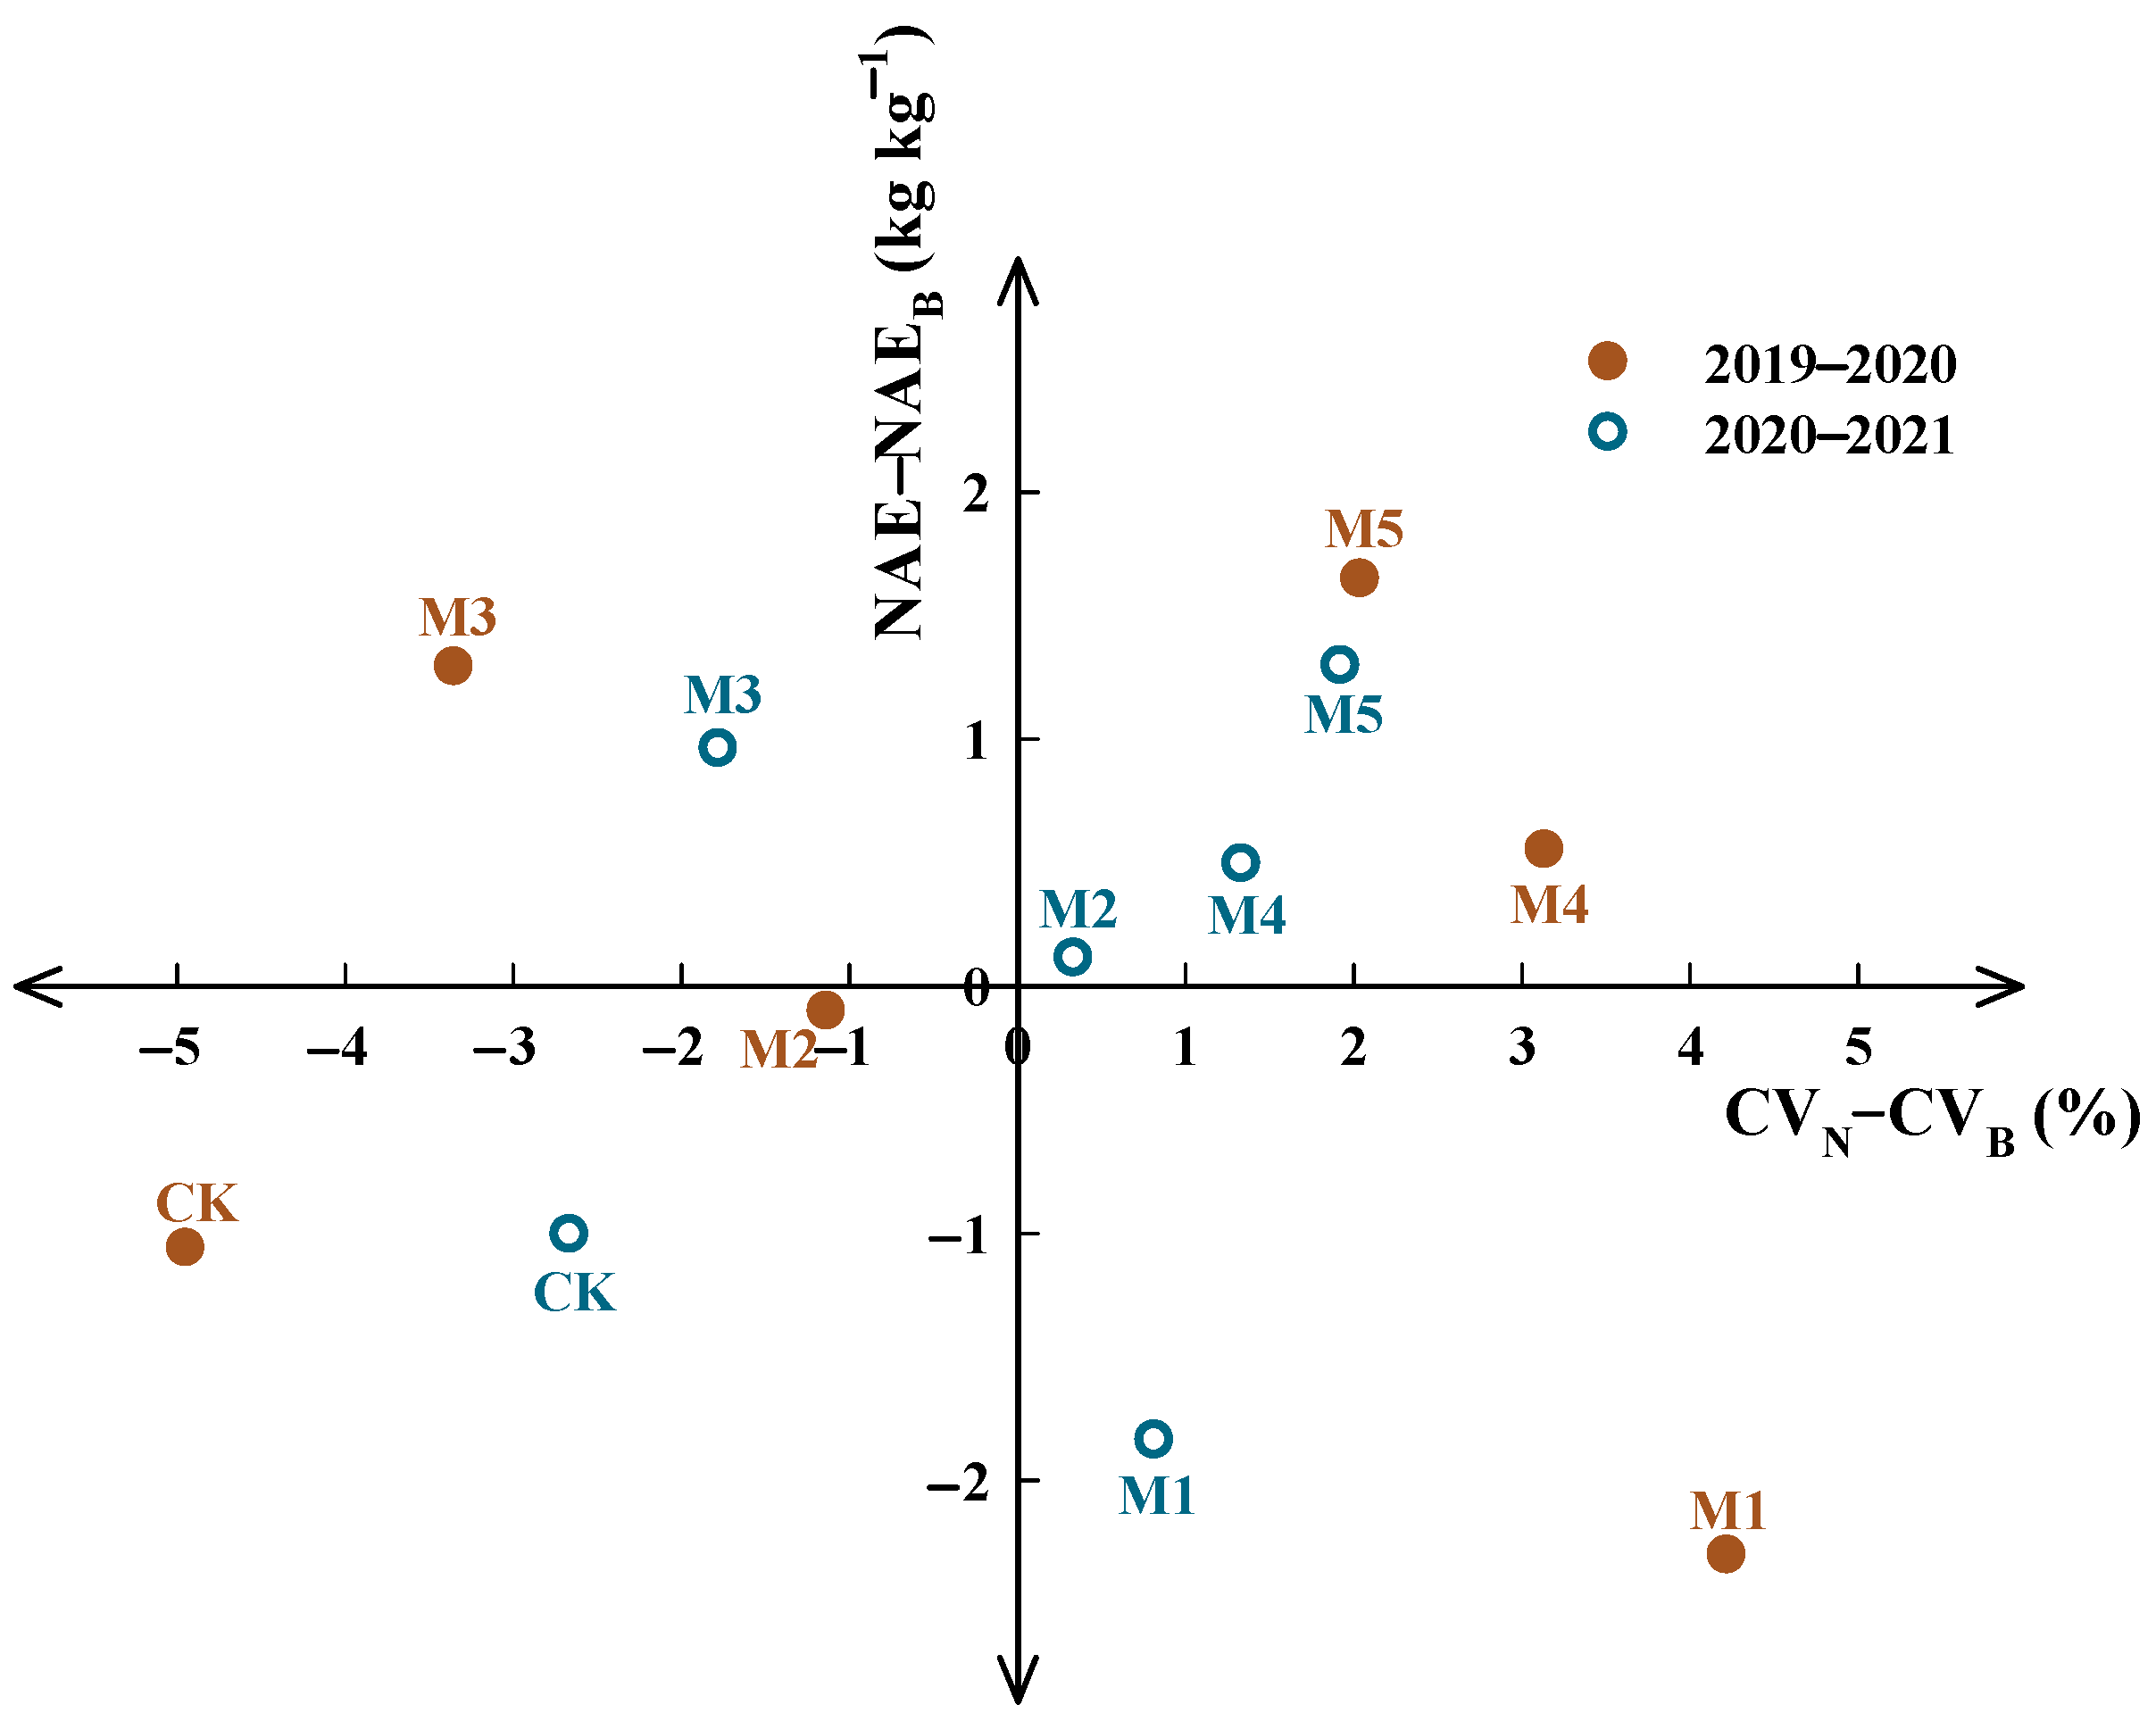
4.2. Assessment of Environmental Adaptability of Different Fertilization Patterns

In the present study, the ecological region significantly affected grain yield and NAE (Table S1, Figure 6). The spike number and grain yield north of the Huaihe River showed a higher trend than those south of the Huaihe River, which could be due to the relatively low precipitation being beneficial to the occurrence of wheat tillering, or to the relatively low temperature increasing the growth period of wheat. Environmental conditions such as precipitation and accumulated temperature not only directly affected wheat growth, but also indirectly affected wheat yield by affecting the nutrient-supply process in different fertilization patterns, resulting in great differences in the stability of NAE and the yield of different fertilization patterns under different environmental conditions. It was found that the one-time application of SRF failed to achieve a high and stable wheat yield or NAE, but the twice-split application of SRF achieved the highest yield as well as the highest stability in multiple ecological regions, which could be attributed to the continuous release of SRF that ensured the N demand of wheat at different growth stages and enhanced the resistance of wheat to adverse environmental conditions [42]. With the 15% N reduction, the twice-split application of SRF increased NAE but decreased its stability. The results indicated that the twice-split application of SRF was better for obtaining higher yields and NAE in complex and variable environments, which was conducive to its popularization and application. This study also found that the effect of drought in the spring on the yield of the SRF top-dressing was less than that of the urea top-dressing, especially when precipitation was extremely scarce. For example, the spring drought in Guannan in 2019–2020 resulted in a 19.39% decrease in the yield of M2 compared with M3, and a 18.95% decrease in the yield of M4 compared with M5, which was significantly higher than those in regions with normal precipitation in the spring. Similar conclusions have also been confirmed by the results of both years in Guannan, that is, in 2020–2021 when precipitation in the spring was relatively abundant, the yield increases in M2 and M4 was higher than those in 2019–2020. Under the conditions of suitable precipitation and temperature, the yield and benefit of SRF as a basal fertilizer combined with the urea top-dressing could be close to or even higher than that of the twice-split SRF application, such as Gaoyou (2019–2020), Baoying (2019–2020) and Ganyu (2020–2021). The yield and NAE of the fourth-split urea application were stable, but at low levels. This could be due to the fact that multiple applications of urea ensured the N supply in the key growth periods of wheat to some extent, but its characteristics of rapid evaporation and easy loss limited its full effect [43]. The effects of different fertilization patterns on the soil-available N in different ecological regions and its regulation mechanism on wheat growth will be further discussed in subsequent studies.

5. Conclusions

In order to realize the safe and stable production of wheat in different ecological regions, an appropriate SRF-application strategy should be selected to increase yield, N efficiency and benefits. Compared with the fourth-split urea application, the twice-split application of SRF increased NAE, yield and net benefits by 15.78%, 7.76% and 786.83 CNY ha−1 in different years and ecological regions on average, respectively, which was beneficial to save labor input and improve economic returns and had higher adaptability to different environments. With the 15% N reduction, the twice-split application of SRF still maintained the same yield and benefit as the fourth-split application of urea with a 100% N rate, but significantly increased NAE, which was conducive to reducing N loss and improving NAE. This study suggests that the twice-split application of SRF is worthy of widespread promotion in wheat cultivation, which can obtain sustainable increase in yield, N efficiency and profit, as well as high stability in different environments.

Supplementary Materials

The following supporting information can be downloaded at: https://www.mdpi.com/article/10.3390/agronomy12020407/s1, Table S1: Grain yield and yield components of wheat under different test sites and fertilization patterns in 2019−2021.

Author Contributions

Conceptualization, Q.M., M.Z., J.D., C.L., W.G., X.Z. (Xinkai Zhu) and H.S.; Investigation, Q.M., R.T., Y.D., X.Z. (Xinbo Zhang) and F.L.; Writing—original draft preparation, Q.M.; Writing—review and editing, X.Z. (Xinkai Zhu) and H.S.; Supervision & Project administration, X.Z. (Xinkai Zhu). All authors have read and agreed to the published version of the manuscript.

Funding

This work was jointly supported by the National Key Research and Development Program of China (2018YFD0200500); the Pilot Projects of the Central Cooperative Extension Program for Major Agricultural Technologies; the Priority Academic Program Development of Jiangsu Higher Education Institutions; the Science and Technology Innovation Team of Yangzhou University; the earmarked fund for Jiangsu Agricultural Industry Technology System (JATS [2021]503); the Postgraduate Research & Practice Innovation Program of Jiangsu Province (XKYCX20_020).

Institutional Review Board Statement

Not applicable.

Informed Consent Statement

Not applicable.

Data Availability Statement

Not applicable.

Conflicts of Interest

The authors declare no conflict of interest.

References

  1. Li, Y.; Liu, H.J.; Huang, G.; Zhang, R.; Yang, H.Y. Nitrate nitrogen accumulation and leaching pattern at a winter wheat: Summer maize cropping field in the North China Plain. Environ. Earth Sci. 2016, 75, 118. [Google Scholar] [CrossRef]
  2. Ma, L.; Velthof, G.; Wang, F.; Qin, W.; Zhang, W.; Liu, Z.; Zhang, Y.; Wei, J.; Lesschen, J.; Ma, W.; et al. Nitrogen and phosphorus use efficiencies and losses in the food chain in China at regional scales in 1980 and 2005. Sci. Total Environ. 2012, 434, 51–61. [Google Scholar] [CrossRef] [PubMed]
  3. Zhong, Y.; Wang, X.; Yang, J.; Zhao, X.; Ye, X. Exploring a suitable nitrogen fertilizer rate to reduce greenhouse gas emissions and ensure rice yields in paddy fields. Sci. Total Environ. 2016, 565, 420–426. [Google Scholar] [CrossRef]
  4. Guo, J.; Liu, X.; Zhang, Y.; Shen, J.; Han, W.; Zhang, W.; Christie, P.; Goulding, K.; Vitousek, P.; Zhang, F. Significant acidification in major Chinese croplands. Science 2010, 327, 1008–1010. [Google Scholar] [CrossRef] [PubMed] [Green Version]
  5. Rosas, F.; Babcock, B.A.; Hayes, D.J. Nitrous oxide emission reductions from cutting excessive nitrogen fertilizer applications. Clim. Chang. 2015, 132, 353–367. [Google Scholar] [CrossRef] [Green Version]
  6. Lyu, T.; Shen, J.; Ma, J.; Ma, P.; Li, M. Hybrid rice yield response to potted-seedling machine transplanting and slow-release nitrogen fertilizer application combined with urea topdressing. Crop J. 2020, 9, 915–923. [Google Scholar] [CrossRef]
  7. Zheng, W.; Zhang, M.; Liu, Z.; Zhou, H.; Lu, H.; Zhang, W.; Yang, Y.; Li, C.; Chen, B. Combining controlled-release urea and normal urea to improve the nitrogen use efficiency and yield under wheat-maize double cropping system. Field Crops Res. 2016, 197, 52–62. [Google Scholar] [CrossRef]
  8. Otteson, B.N.; Mergoum, M.; Ransom, J.K. Seeding rate and nitrogen management effects on spring wheat yield and yield components. Agron. J. 2007, 99, 1615–1621. [Google Scholar] [CrossRef]
  9. Chen, X.; Cui, Z.; Fan, M.; Vitousek, P.; Zhao, M.; Ma, W.; Wang, Z.; Zhang, W.; Yan, X.; Yang, J.; et al. Producing more grain with lower environmental costs. Nature 2014, 514, 486–489. [Google Scholar] [CrossRef]
  10. Peng, S.; Buresh, R.; Huang, J.; Yang, J.; Zou, Y.; Zhong, X.; Wang, G.; Zhang, F. Strategies for overcoming low agronomic nitrogen use efficiency in irrigated rice systems in China. Field Crops Res. 2006, 96, 37–47. [Google Scholar] [CrossRef]
  11. Fan, J.; Lu, X.; Gu, S.; Guo, X. Improving nutrient and water use efficiencies using water-drip irrigation and fertilization technology in Northeast China. Agron. Water Manag. 2020, 241, 106352. [Google Scholar] [CrossRef]
  12. Liang, W.; Zhang, Z.; Wen, X.; Liao, Y.; Liu, Y. Effect of non-structural carbohydrate accumulation in the stem pre-anthesis on grain filling of wheat inferior grain. Field Crops Res. 2017, 211, 66–76. [Google Scholar] [CrossRef]
  13. Cao, H.; Li, Y.; Chen, G.; Chen, D.; Qu, H.; Ma, W. Identifying the limiting factors driving the winter wheat yield gap on smallholder farms by agronomic diagnosis in North China Plain. J. Integ. Agron. 2019, 18, 1701–1713. [Google Scholar] [CrossRef]
  14. Du, Y.; Xi, Y.; Cui, T.; Anten, N.; Weiner, J.; Li, X.; Turner, N.; Zhao, Y.; Li, F. Yield components, reproductive allometry and the tradeoff between grain yield and yield stability in dryland spring wheat. Field Crops Res. 2020, 257, 107930. [Google Scholar] [CrossRef]
  15. Zheng, W.; Wang, Y.; Li, Y.; Liu, Z.; Chen, J.; Zhou, H.; Gao, Y.; Chen, B.; Zhang, M. Developing water and nitrogen budgets of a wheat-maize rotation system using auto-weighing lysimeters: Effects of blended application of controlled-release and un-coated urea. Environ. Pollut. 2020, 263, 114383. [Google Scholar] [CrossRef] [PubMed]
  16. Shoji, S.; Delgado, J.; Mosier, A.; Miura, Y. Use of controlled release fertilizers and nitrification inhibitors to increase nitrogen use efficiency and to conserve air and water quality. Commun. Soil Sci. Plan. 2001, 32, 1051–1070. [Google Scholar] [CrossRef]
  17. Shaviv, A. Advances in controlled-release fertilizers. Adv. Agron. 2001, 71, 1–49. [Google Scholar] [CrossRef]
  18. Wu, Q.; Wang, Y.; Ding, Y.; Tao, W.; Gao, S.; Li, Q.; Li, W.; Liu, Z.; Li, G. Effects of different types of slow- and controlled-release fertilizers on rice yield. J. Integr. Agric. 2021, 20, 1503–1514. [Google Scholar] [CrossRef]
  19. Geng, J.; Sun, Y.; Zhang, M.; Li, C.; Yang, Y.; Liu, Z.; Li, S.L. Long-term effects of controlled release urea application on crop yields and soil fertility under rice-oilseed rape rotation system. Field Crops Res. 2015, 184, 65–73. [Google Scholar] [CrossRef]
  20. Zhang, S.; Shen, T.; Yang, Y.; Li, Y.; Wan, Y.; Zhang, M.; Tang, Y.; Allen, S. Controlled-release urea reduced nitrogen leaching and improved nitrogen use efficiency and yield of direct-seeded rice. J. Environ. Manag. 2018, 220, 191–197. [Google Scholar] [CrossRef]
  21. Grant, C.; Wu, R.; Selles, F.; Harker, K.; Clayton, G.; Bittman, S.; Zebarth, B.; Lupwayi, N. Crop yield and nitrogen concentration with controlled release urea and split applications of nitrogen as compared to non-coated urea applied at seeding. Field Crops Res. 2012, 127, 170–180. [Google Scholar] [CrossRef]
  22. Farmaha, B.S.; Sims, A.L. Yield and Protein Response of Wheat Cultivars to Polymer-Coated Urea and Urea. Agron. J. 2013, 105, 229–236. [Google Scholar] [CrossRef] [Green Version]
  23. Kubar, M.; Feng, M.; Sayed, S.; Shar, A.; Rind, N.; Ullah, H.; Kalhoro, S.; Xie, Y.; Yang, C.; Yang, W.; et al. Agronomical traits associated with yield and yield components of winter wheat as affected by nitrogen managements. Saudi J. Biol. Sci. 2021, 28, 4852–4858. [Google Scholar] [CrossRef] [PubMed]
  24. Fageria, N.K.; Baligar, V.C. Enhancing nitrogen use efficiency in crop plants. Adv. Agron. 2005, 88, 97–185. [Google Scholar] [CrossRef]
  25. Ma, Q.; Wang, M.; Zheng, G.; Yao, Y.; Tao, R.; Zhu, M.; Ding, J.; Li, C.; Guo, W.; Zhu, X. Twice-split application of controlled-release nitrogen fertilizer met the nitrogen demand of winter wheat. Field Crops Res. 2021, 267, 108163. [Google Scholar] [CrossRef]
  26. Power, J.F.; Wiese, R.; Flowerday, D. Managing farming systems for nitrate control: A research review from Management Systems Evaluation Areas. J. Environ. Qual. 2001, 30, 1866–1880. [Google Scholar] [CrossRef]
  27. Li, W.; Nelson, J.; Chu, C.; Shi, L.; Huang, S.; Liu, D. Chromosomal locations and genetic relationships of tiller and spike characters in wheat. Euphytica 2002, 125, 357–366. [Google Scholar] [CrossRef]
  28. Zheng, B.; Zhang, X.; Wang, Q.; Li, W.; Huang, M.; Zhou, Q.; Cai, J.; Wang, X.; Cao, W.; Dai, T.; et al. Increasing plant density improves grain yield, protein quality and nitrogen agronomic efficiency of soft wheat cultivars with reduced nitrogen rate. Field Crops Res. 2021, 267, 108145. [Google Scholar] [CrossRef]
  29. Ghafoor, I.; Habib-ur-Rahman, M.; Ali, M.; Afzal, M.; Ahmed, W.; Gaiser, T.; Ghaffar, A. Slow-release nitrogen fertilizers enhance growth, yield, NUE in wheat crop and reduce nitrogen losses under an arid environment. Environ. Sci. Pollut. Res. 2021, 28, 43528–43543. [Google Scholar] [CrossRef]
  30. Wang, J.; Barański, M.; Hasanaliyeva, G.; Korkut, R.; Kalee, H.; Leifert, A.; Winter, S.; Janovska, D.; Willson, A.; Barkla, B.; et al. Effect of irrigation, fertiliser type and variety on grain yield and nutritional quality of spelt wheat (Triticum spelta) grown under semi-arid conditions. Food Chem. 2021, 358, 129826. [Google Scholar] [CrossRef]
  31. Wang, C.; Zhao, J.; Feng, Y.; Shang, M.; Bo, X.; Gao, Z.; Chen, F.; Chu, Q. Optimizing tillage method and irrigation schedule for greenhouse gas mitigation, yield improvement, and water conservation in wheat–maize cropping systems. Agron. Water Manag. 2021, 248, 106762. [Google Scholar] [CrossRef]
  32. Yang, Y.; Zhang, M.; Zheng, L.; Cheng, D.; Liu, M.; Geng, Y. Controlled release urea improved nitrogen use efficiency, yield, and quality of wheat. Agron. J. 2011, 103, 479–485. [Google Scholar] [CrossRef]
  33. Mi, W.; Zheng, S.; Yang, X.; Wu, L.; Liu, Y.; Chen, J. Comparison of yield and nitrogen use efficiency of different types of nitrogen fertilizers for different rice cropping systems under subtropical monsoon climate in China. Eur. J. Agron. 2017, 90, 78–86. [Google Scholar] [CrossRef]
  34. Lyu, X.; Yang, Y.; Li, Y.; Fan, X.; Wan, Y.; Geng, Y.; Zhang, M. Polymer-Coated Tablet Urea Improved Rice Yield and Nitrogen Use Efficiency. Agron. J. 2015, 107, 1837–1844. [Google Scholar] [CrossRef]
  35. Ye, Y.; Liang, X.; Chen, Y.; Liu, J.; Gu, J.; Guo, R.; Li, L. Alternate wetting and drying irrigation and controlled-release nitrogen fertilizer in late-season rice. Effects on dry matter accumulation, yield, water and nitrogen use. Field Crops Res. 2013, 144, 212–224. [Google Scholar] [CrossRef]
  36. He, Z.; Sun, H.; Chen, Y.; Luo, J.; Ge, S.; Yao, Q.; Du, S.; Wang, D.; Li, W.; Wang, J. High yield and stability analysis of cotton varieties in Bazhou comparative experiment. Xinjiang Agron. Sci. Technol. 2021, 4, 4–6. (In Chinese) [Google Scholar] [CrossRef]
  37. Malhi, S.; Grant, C.; Johnston, A.; Gill, K. Nitrogen fertilization management for no-till cereal production in the Canadian great plains: A review. Soil Tillage Res. 2001, 60, 101–122. [Google Scholar] [CrossRef]
  38. Zhao, H.; Zhang, P.; Wang, Y.; Ning, T.; Xu, C.; Wang, P. Canopy morphological changes and water use efficiency in winter wheat under different irrigation treatments. J. Integr. Agron. 2020, 19, 1105–1116. [Google Scholar] [CrossRef]
  39. Li, G.; Gu, R.; Xu, K.; Guo, B.; Dai, Q.; Huo, Z.; Wei, H. Split application of a mixture of controlled-release and common urea for improving quality and agronomic and economic performance in wheat production. Crop Sci. 2021, 61, 4402–4415. [Google Scholar] [CrossRef]
  40. Trenkel, M.E. Slow- and Controlled-Release and Stabilized Fertilizers: An Option for Enhancing Nutrient Use Efficiency in Agriculture, 2nd ed.; International Fertilizer Industry Association (IFA): Paris, France, 2010; pp. 21–54. ISBN 978-2-9523139-7-1. [Google Scholar]
  41. Davidson, D.; Gu, F. Materials for sustained and controlled release of nutrients and molecules to support plant growth. J. Agric. Food Chem. 2012, 60, 870–876. [Google Scholar] [CrossRef]
  42. Altaf, A.; Zhu, X.; Zhu, M.; Ma, Q.; Irshad, S.; Xu, D.; Aleem, M.; Zhang, X.; Gull, S.; Li, F.; et al. Effects of environmental stresses (heat, salt, waterlogging) on grain yield and associated traits of wheat under application of sulfur-coated Urea. Agronomy 2021, 11, 2340. [Google Scholar] [CrossRef]
  43. Zhang, G.; Zhao, D.; Liu, S.; Liao, Y.; Han, J. Can controlled-release urea replace the split application of normal urea in China? A meta-analysis based on crop grain yield and nitrogen use efficiency. Field Crops Res. 2022, 275, 108343. [Google Scholar] [CrossRef]
Figure 1. Distribution of test sites in Jiangsu Province, China.
Agronomy 12 00407 g001
Figure 2. Monthly mean temperature during the growing seasons at different test sites in 2019–2021.
Agronomy 12 00407 g002
Figure 3. Accumulated precipitation during the growing seasons at different test sites in 2019–2021.
Agronomy 12 00407 g003
Figure 4. Analysis of relative yield (%) of different fertilization patterns at different test sites in 2019–2020 (a) and 2020−2021 (b). The relative yield is the percentage of the yield in treatment to the yield in CK. CK, urea applied at four stages, basal:tillering:jointing:booting = 50%:10%:20%:20%; M1, SRF applied once before sowing; M2, 60% N SRF applied before sowing and 40% N urea applied at jointing; M3, 60% N SRF applied before sowing and 40% N SRF applied at re-greening; M4, M2 reducing N rate by 15%; M5, M3 reducing N rate by 15%. TGW, 1000-grain weight.
Agronomy 12 00407 g004
Figure 5. The quadrant graph of yield and its stability assessment for different fertilization patterns. CK, urea applied at four stages, basal:tillering:jointing:booting = 50%:10%:20%:20%; M1, SRF applied once before sowing; M2, 60% N SRF applied before sowing and 40% N urea applied at jointing; M3, 60% N SRF applied before sowing and 40% N SRF applied at re-greening; M4, M2 reducing N rate by 15%; M5, M3 reducing N rate by 15%.
Agronomy 12 00407 g005
Figure 6. Nitrogen agronomic efficiency (NAE) of different fertilization patterns in 2019−2021. CK, urea applied at four stages, basal:tillering:jointing:booting = 50%:10%:20%:20%; M1, SRF applied once before sowing; M2, 60% N SRF applied before sowing and 40% N urea applied at jointing; M3, 60% N SRF applied before sowing and 40% N SRF applied at re-greening; M4, M2 reducing N rate by 15%; M5, M3 reducing N rate by 15%. Error bars represent standard error of the mean. Different letters above bars indicate significant difference at p < 0.05. ns, no significant; **, significant at p < 0.01.
Agronomy 12 00407 g006
Figure 7. Analysis of relative nitrogen agronomic efficiency (NAE) (%) of different fertilization patterns at different test sites in 2019–2020 (a) and 2020−2021 (b). The relative NAE is the percentage of NAE in treatment to NAE in CK. CK, urea applied at four stages, basal:tillering:jointing:booting = 50%:10%:20%:20%; M1, SRF applied once before sowing; M1, SRF applied once before sowing; M2, 60% N SRF applied before sowing and 40% N urea applied at jointing; M3, 60% N SRF applied before sowing and 40% N SRF applied at re-greening; M4, M2 reducing N rate by 15%; M5, M3 reducing N rate by 15%.
Agronomy 12 00407 g007
Figure 8. The quadrant graph of NAE and its stability assessment for different fertilization patterns. CK, urea applied at four stages, basal:tillering:jointing:booting = 50%:10%:20%:20%; M1, SRF applied once before sowing; M2, 60% N SRF applied before sowing and 40% N urea applied at jointing; M3, 60% N SRF applied before sowing and 40% N SRF applied at re-greening; M4, M2 reducing N rate by 15%; M5, M3 reducing N rate by 15%.
Agronomy 12 00407 g008
Figure 9. Net benefit of different fertilization patterns in 2019–2021. CK, urea applied at four stages, basal:tillering:jointing:booting = 50%:10%:20%:20%; M1, SRF applied once before sowing; M2, 60% N SRF applied before sowing and 40% N urea applied at jointing; M3, 60% N SRF applied before sowing and 40% N SRF applied at re-greening; M4, M2 reducing N rate by 15%; M5, M3 reducing N rate by 15%. Error bars represent standard error of the mean. Different letters above bars indicate significant difference at p < 0.05. ns, no significant; **, significant at p < 0.01.
Agronomy 12 00407 g009
Figure 10. Analysis of relative benefit (%) of different fertilization patterns in different test sites in 2019–2020 (a) and 2020−2021 (b). The relative benefit is the percentage of the net benefit in treatment to the net benefit in CK. CK, urea applied at four stages, basal:tillering:jointing:booting = 50%:10%:20%:20%; M1, SRF applied once before sowing; M1, SRF applied once before sowing; M2, 60% N SRF applied before sowing and 40% N urea applied at jointing; M3, 60% N SRF applied before sowing and 40% N SRF applied at re-greening; M4, M2 reducing N rate by 15%; M5, M3 reducing N rate by 15%.
Agronomy 12 00407 g010
Table 1. Relevant information of different test sites.
SiteWheat
Varieties
Sowing
Date
(Month-Day)
Harvest
Date
(Month-Day)
Soil
Texture
Nutritional Characteristics of the Top Soil
(0–20 cm Depth)
Organic
Matter
(g kg−1)
Available
N
(mg kg−1)
Available
P
(mg kg−1)
Available
K
(mg kg−1)
2019–2020
YizhengYangami 2311-15-27Clay loam35.1127.06.9111.9
HaianNongmai 8811-35-29Loam32.3116.323.6133.8
JiangduMingmai 13311-95-29Medium loam25.587.627.457.0
JiangyanNongmai 8811-115-31Clay loam35.198.621.1149.4
GaoyouYangfumai 410-295-29Clay36.4103.85.8160.1
BaoyingNingmai 2611-76-1Clay19.689.726.5134.5
SuiningXumai 81810-306-5Sandy loam22.696.735.0143.7
GuannanHuaimai 3311-66-10Clay12.858.619.6102.0
2020–2021
YizhengYangmai 2311-36-5Clay loam36.2119.98.63109.2
JiangduYangfumai 411-26-4Medium loam30.576.323.587.0
JiangyanNongmai 8810-316-3Clay loam33.4108.722.3134.6
BaoyingZhenmai 1211-66-5Clay19.482.625.6122.5
HuaiyinHuaimai 5210-306-10Clay22.190.346.194.2
SuiningXumai 81810-236-10Clay loam25.8101.328.3129.6
GuannanHuaimai 3310-306-12Clay13.663.418.499.7
GanyuHuaimai 4610-306-20Clay20.874.214.2130.1
Table 2. Fertilization pattern design and N rate.
PatternN Rate
(kg ha−1)
N Fertilizer Types and N Management
CK270100% N U, basal:tillering:jointing:booting = 50%:10%:20%:20%
M1270100% N SRF applied once before sowing
M227060% N SRF applied before sowing; 40% N U top-dressed at jointing stage
M327060% N SRF applied before sowing; 40% N SRF top-dressed at re-greening stage
M4229.560% N SRF applied before sowing; 40% N U top-dressed at jointing stage
M5229.560% N SRF applied before sowing; 40% N SRF top-dressed at re-greening stage
Table 3. Path-coefficient analysis showing direct and indirect effects of yield components on grain yield at different test sites and with different fertilization patterns in 2019–2021.
Yield
Component
Correlation
Coefficient
with Yield
Direct Path
Coefficient
Indirect Path Coefficient
SpikesKernels per SpikeTGWTotal
2019–2020
Spikes0.799 **1.134 -−0.335 0.000 −0.335
Kernels per spike−0.048 ns0.583 −0.652 -0.021 −0.631
TGW0.311 *0.266 −0.001 0.046 -0.045
2020−2021
Spikes0.828 **1.215-−0.417 0.030 −0.388
Kernels per spike−0.399 **0.711−0.713 -−0.398 −1.110
TGW0.311 *0.6760.053 v0.419 -−0.365
TGW, 1000-grain weight. ns, no significant; *, significant at p < 0.05; **, significant at p < 0.01.
Publisher’s Note: MDPI stays neutral with regard to jurisdictional claims in published maps and institutional affiliations.

