Abstract
Exact yield estimation of fruits on plants guaranteed fine and timely decisions on harvesting and marketing practices. Automatic yield estimation based on unmanned agriculture offers a viable solution for large orchards. Recent years have witnessed notable progress in computer vision with deep learning for yield estimation. Yet, the current practice of vision-based yield estimation with successive frames may engender fairly great error because of the double counting of repeat fruits in different images. The goal of this study is to provide a wise framework for fruit yield estimation in sequence images. Specifically, the anchor-free detection architecture (CenterNet) is utilized to detect fruits in sequence images from videos collected in the apple orchard and orange orchard. In order to avoid double counts of a single fruit between different images in an image sequence, the patch matching model is designed with the Kuhn–Munkres algorithm to optimize the paring process of repeat fruits in a one-to-one assignment manner for the sound performance of fruit yield estimation. Experimental results show that the CenterNet model can successfully detect fruits, including apples and oranges, in sequence images and achieved a mean Average Precision (mAP) of 0.939 under an IoU of 0.5. The designed patch matching model obtained an F1-Score of 0.816 and 0.864 for both apples and oranges with good accuracy, precision, and recall, which outperforms the performance of the reference method. The proposed pipeline for the fruit yield estimation in the test image sequences agreed well with the ground truth, resulting in a squared correlation coefficient of R2apple = 0.9737 and R2orange = 0.9562, with a low Root Mean Square Error (RMSE) for these two varieties of fruit.
1. Introduction
Smart farming is becoming increasingly pervasive in modern agriculture, from crop planting with commonly automatic equipment in the fields to the current trend of intelligent monitoring for fruit tree growing in the orchard, providing effective management tools to support precise cultivating [1]. Fruit yield is a significant indicator for the cultivation management of fruit trees [2], allowing planters to arrange fruit harvest, storage and sales more appropriately [3,4]. The conventional approach for estimating yield primarily relies on humans, which is sampling a fixed percentage (e.g., 5% or 10%) of trees randomly and fruit counting before extrapolating the total yield of the entire orchard [5]. However, this sampling and extrapolation practice for long hours is not only labor intensive and time consuming, but also prone to the error caused by brain fatigue or other interference. Therefore, an automatic fruit yield estimation would be a highly desirable solution, better than the one involving humans, as a machine saves labor and never tires.
The application of autonomous systems in orchard plantations has significantly grown in the past several years and the adoption of vision-based methods is increasing in yield estimation tasks because of the lower costs and greater efficiency [6,7,8]. Much previous research paid more attention to the traditional approaches of image processing depending on the hand-crafted features in fruit yield estimation, such as textural features [9,10], color features [11,12], shape features [13,14], etc. [15]. Few critical reviews concerning fruit tasks in orchards are reported by Gongal et al. [16] and Koirala et al. [17], pointing out that machine learning yields better results than traditional image processing techniques.
Recent years have witnessed tremendous progress of Deep Learning in fruit yield estimation. Sa et al. [18] were the first to attempt Deep Learning-based fruit detection for yield prediction. Chen et al. [19] reported a specific estimation approach that extracted the candidate blob by the Fully Convolutional Network and predict the number of fruits in each blob region using a regression model related to the CNN. Bargoti and Underwood [20] reported a transfer learning architecture with Faster-RCNN to estimate the fruit yield, while Chen et al. [21] similarly applied ResNet-50 as the backbone of the Faster R-CNN to perform strawberry detection for yield estimation in the orchard. Through integrated segmentation and count regression techniques into a framework, Häni et al. [22] developed an end-to-end system that combined U-Net with Faster RCNN to estimate the fruits number from the apple clusters in orchards and achieved the accuracy of 0.978. Kestur et al. [23] designed a MangoNet specifically used for the yield prediction of mango, which can well detect mangos in views of partial occlusion or overlap. Behera et al. [24] introduced a modified intersection of union (MIoU) into the Faster R-CNN algorithm to provide extra attention on overlapped regions during the fruit detection in yield estimation. Zhou et al. [25] developed an Android APP for kiwifruit yield prediction by using a lightweight SSD model. Anderson et al. [26] compared several orchards in fruits counts and indicated that the DCNNs-based methods gave a better result than transitional methods. In addition, few other specific deep learning-based methods were designed to simplify the model building for better estimation performance [27,28,29].
Although previous works continuously improved the performance of fruits estimation in single-frame images, it lacks temporal awareness of fruit correlation between neighboring images in the image sequence, which may cause double counting during fruit yield estimation. Estimating fruit yield in sequence images is still challenging, as not only do the fruit number need to be counted in the sequence image, but also duplicate fruits also need to be eliminated in different images [30]. Hence, it is necessary to design a wise method to cull the same fruit observed more than once in successive frames.
Automated yield estimation in successive frames relies on efficient fruit detection and identical fruit matching. The excellent deep learning-based detection methods require a trade-off between processing time and detection rate. The faster the inference time, the lower the detection rate, creating a balance between the desired cycle-time and required detection rate. The concept of the anchor is shared by both two-stage detectors and one-stage detectors, which works by enumerating box templates of diverse scales and aspect ratios concerning the dataset in process, and anchors should adapt to the attributes of the dataset. However, designing anchor sets and dispatching objects to particular anchors calls for vast experience. Different IoU thresholds might give rise to significant performance variations when IoU is generally the major criterion during assigning objects to certain anchors. Motivated by these observations, many approaches without anchors have attracted much attention recently [31,32,33,34,35], where the anchor mechanism is dropped and the key points are used for objects representation. The CenterNet network [35] is currently one of the best-performing and most efficient methods without the anchor. Instead of detecting two bounding box corners as keypoints, such as CornerNet, or detecting the top-, left-, bottom-, right-most, and center points, such as ExtremeNet, both of which require some extra time for a combinatorial grouping after keypoint detection, the CenterNet network simply extracts a single center point of each object, and grouping or post-processing is not required. Furthermore, a center point can be seen as a single shape-agnostic anchor, which can better realize the balance between speed and precision. The CenterNet network has been adopted in many studies [36,37] in recent years to solve the problem of crop detection. By introducing MobileNetV3 and the transposed convolutional layer, Xia et al. [38] built a lightweight model based on the CenterNet framework for apple detection. The model increased the robustness for apple detection under the condition of limited hardware resources while maintaining a similar detection accuracy with a lower storage footprint.
The Deep CNN-based approach of metric learning has been employed to numerous image matching issues with great success [39,40]. The metric network allows the feature descriptors with pairs of images to be considered jointly and establishes correct correspondences between image patches [41]. Various models have been developed recently for patch similarity learning and assessing from image patches. Zagoruyko and Komodakis [42] evaluated several deep networks for metric learning on the tasks of image patch matching and found that the networks can gain a satisfying result via learning metrics without explicit descriptor computing. Through designing two identical CNNs to learn the descriptor and metric simultaneously, Han et al. [43] proposed a MatchNet model and achieved image pairs identification between positive patches and negative patches. To compare image patches, Zagoruyko and Komodakis [44] proposed a DeepCompare model by training the joint features of image pairs and assessing the patches by the similarity function. Though the existing approaches offer flexibility, as it starts by processing the two image patches jointly, this scheme just solved the maximum assignment problem instead of the optimal assignments, which may result in underestimation as image patches cannot be matched one-to-one, so it could not be the best solution for fruit yield estimation.
In this research, a wisely visual-based method is proposed to estimate the yield for different kinds of fruit in image sequences. A framework that combines anchor-free detection and optimal patch matching technique is designed to overcome double counting during the fruit number prediction. The main contributions of this work are, thus: (i) A specific framework based on CenterNet model and fruit matching model was proposed for fruit yield estimation in the image sequences; (ii) A novel fruit matching model was developed with the Kuhn–Munkres algorithm for a higher performance of identical fruit matching; (iii) The proposed pipeline was evaluated and gave an encouraging result for the yield estimation of different varieties of fruit (apple and orange), which will pave the way for practical application.
The rest of this article is structured as follows. Section 2 described the material and methods with data collection and the description of the proposed method. The experiments and results for fruit detection, repeated fruit correlation, as well as the task of yield estimation, are detailed in Section 3, followed by the further discussion and analysis of the model performance in Section 4. Finally, in Section 5, the conclusions and future works are summarized.
2. Materials and Methods
2.1. Data Acquirement
In this study, the video type data were collected from different scenarios for apple and orange. The apple orchard is located in XingCheng, China, and the orange orchard is located in NanNing, China. The videos were captured by the primary camera of the iPhone 8 smartphone in 1080 × 1920 pixel resolution while holding the smartphone and moving along the row of fruit trees. All experimental videos were gathered on several sunny days and shot from morning to dusk each day, which ensures the captured videos contain various light intensities.
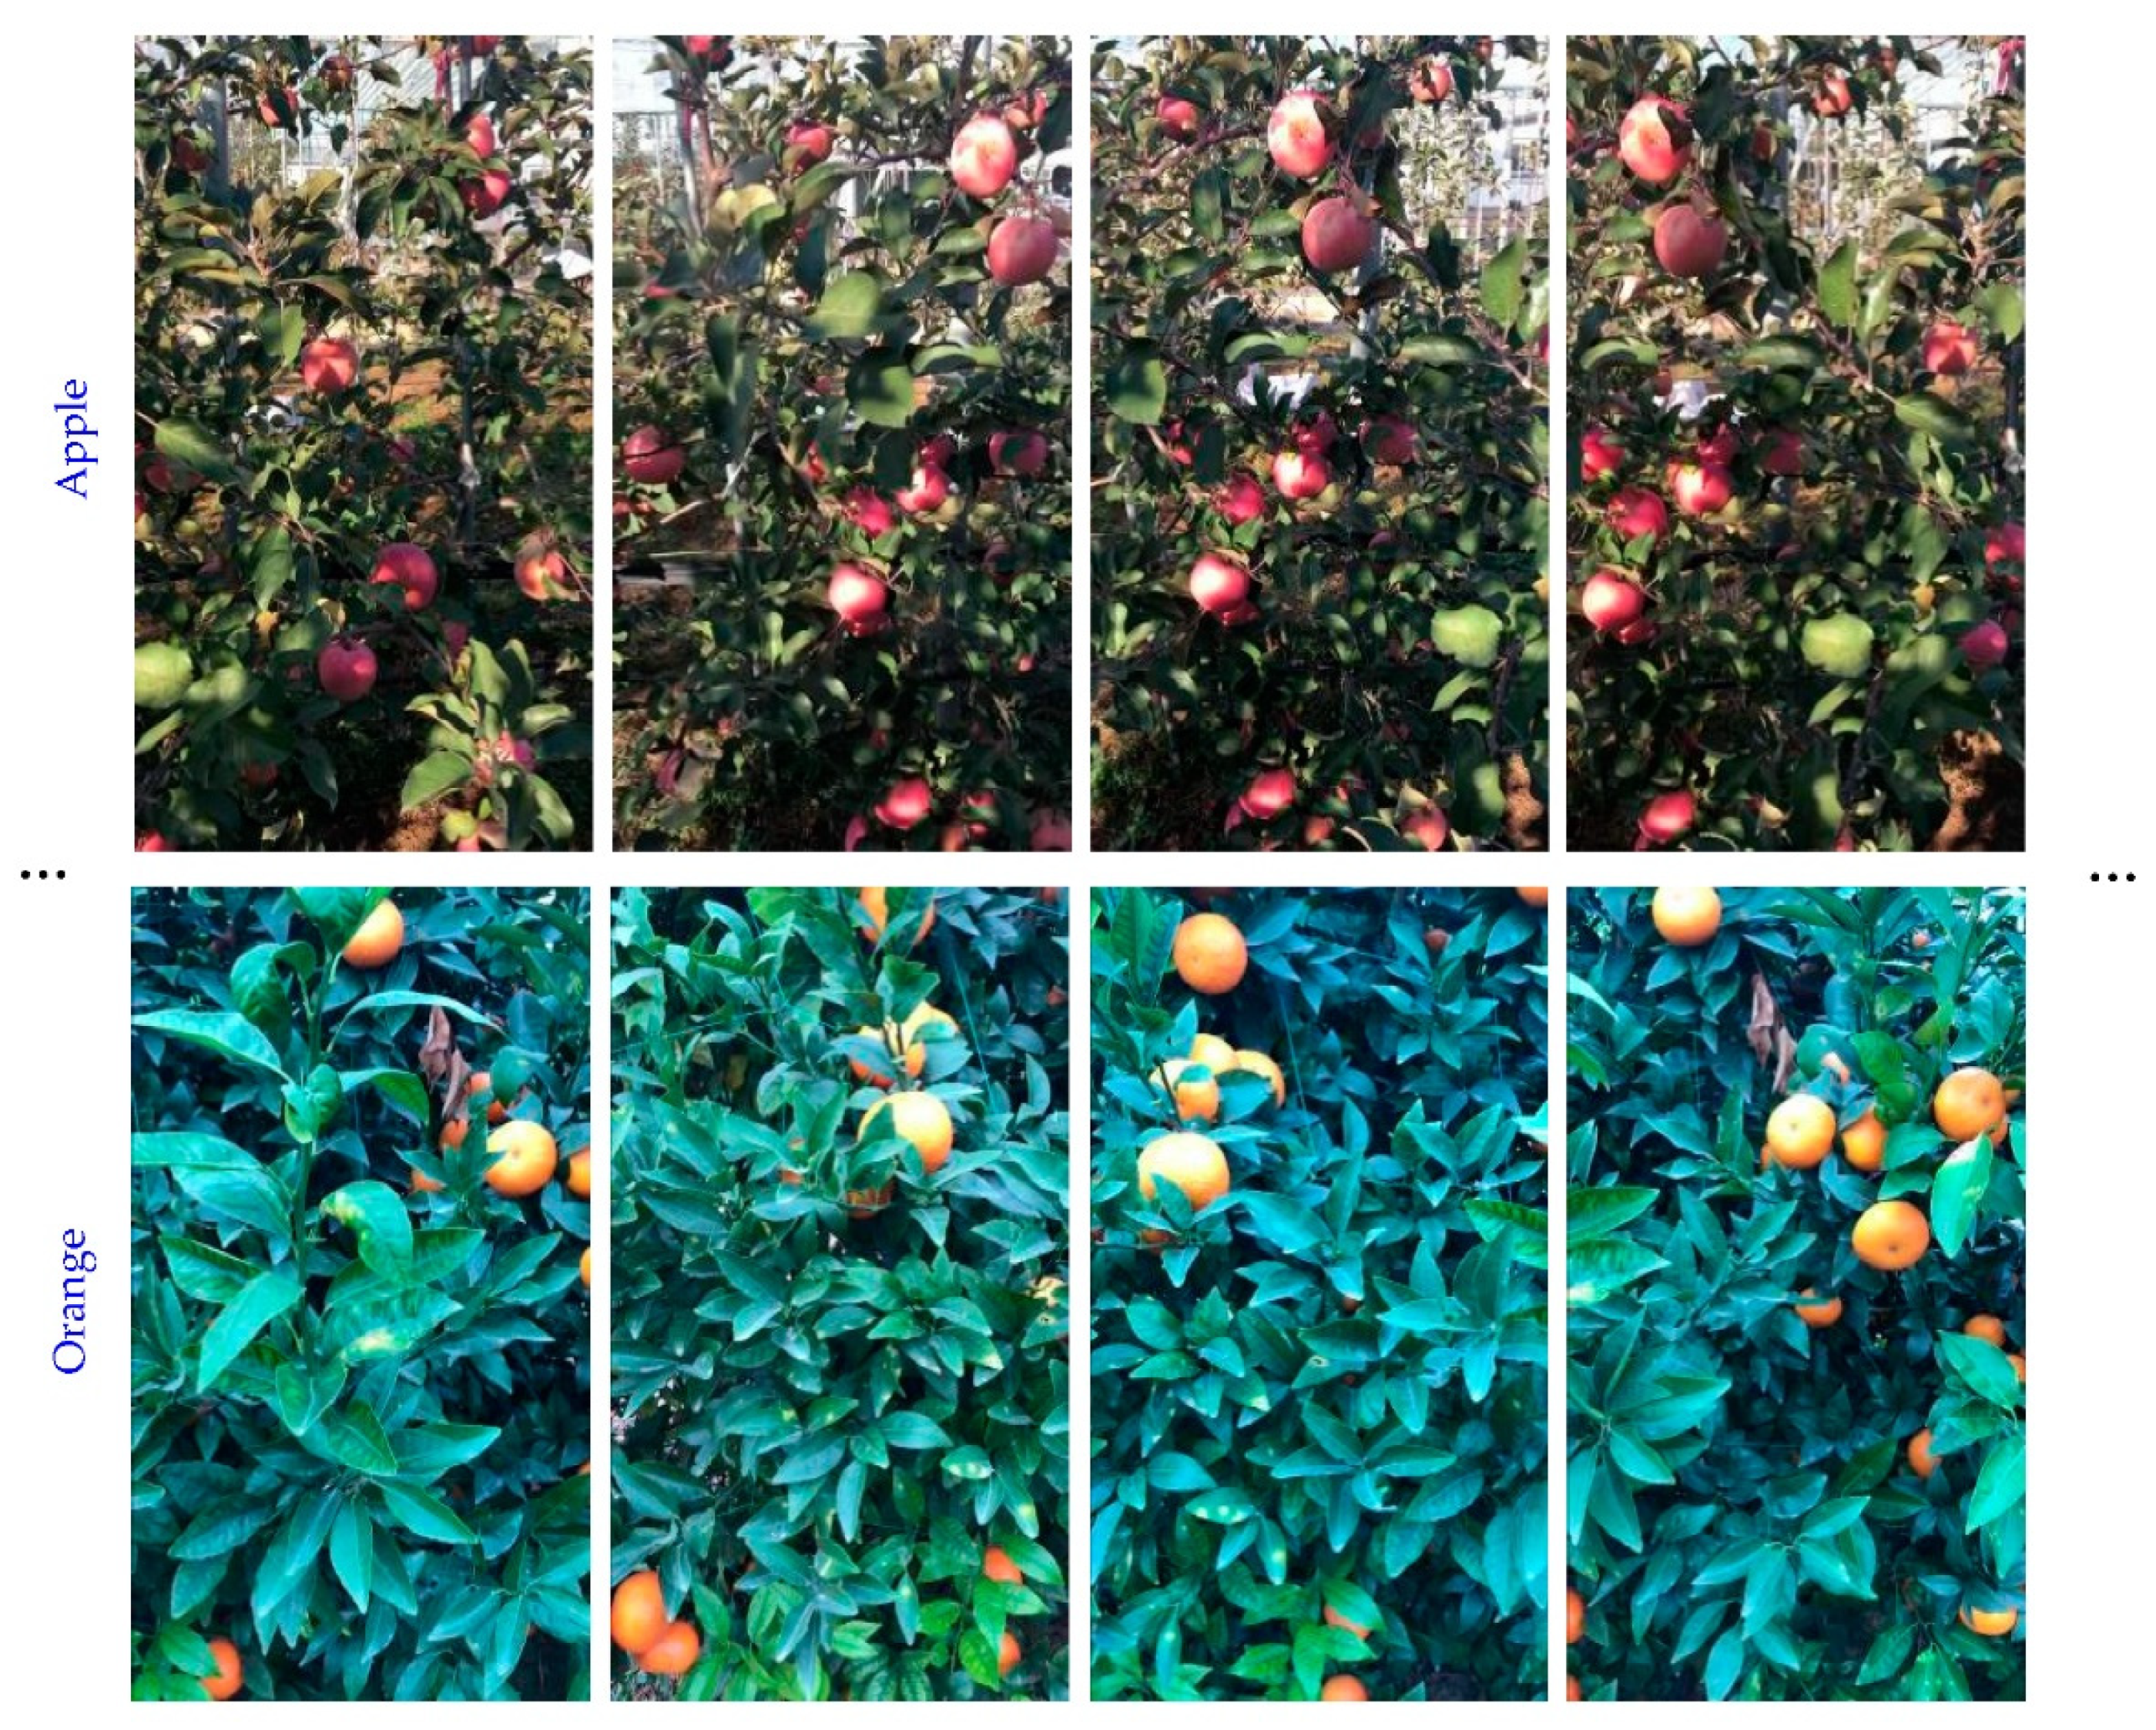
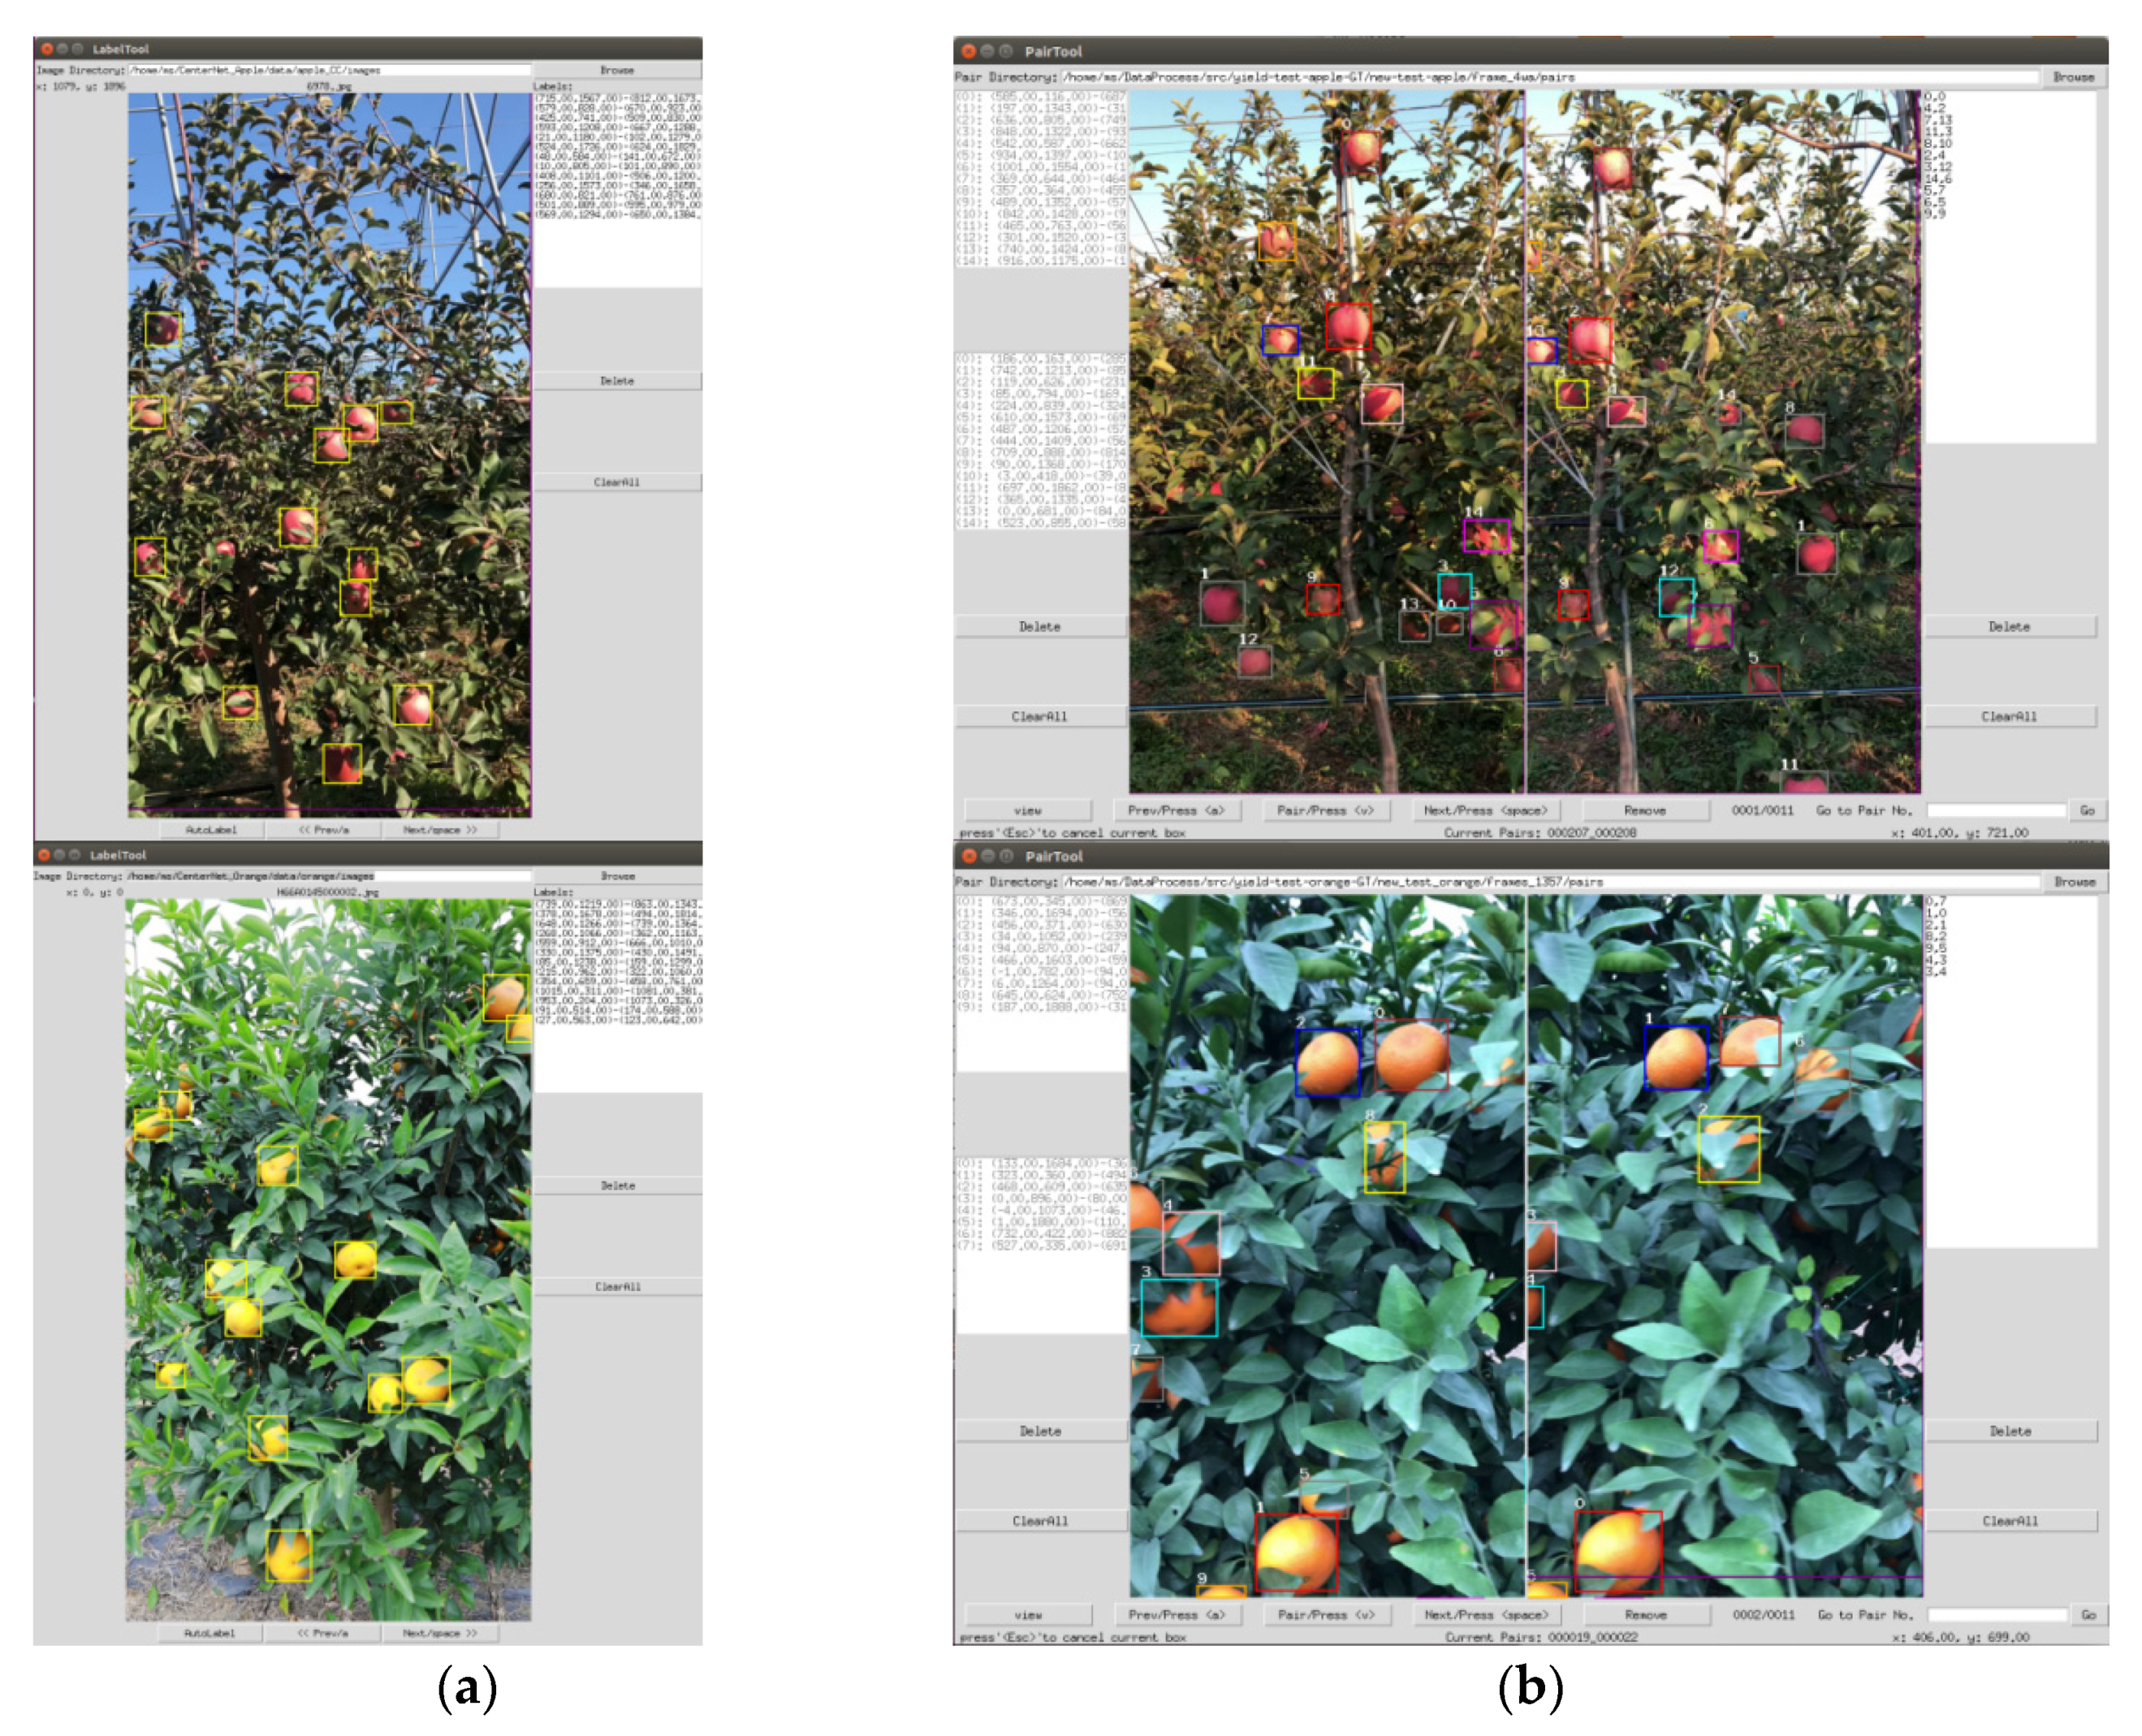
Employing keyframes from the video streams is beneficial since the number of frames needed to be processed is reduced, while it still sufficient feature correspondence between frames to provide multiple views for observed fruits [45]. Thus, the keyframes were extracted from the videos, then 120 apple image sequences and 120 orange image sequences were obtained for this research. The image sequences of each kind of fruit are divided into two parts equally for model training and test. Figure 1 shows the examples of the fruit image sequences. The data annotation in terms of fruits locations and duplicate fruits in successive images was carried out for the experiments. Firstly, the fruit annotation in bounding box format is performed with a self-developed coordinates label tool, as shown in Figure 2a. Four coordinates (min-x, min-y, max-x, and max-y) of fruits in each image can be marked and recorded by the label tool. Secondly, the relations of duplicate fruits in successive images were annotated with a self-developed pair tool, as shown in Figure 2b. The serial number of the same fruits in adjacent images would be marked and recorded by the pair tool. During the data annotation, two data engineers were asked to calculate the ground truth of fruits in sequence images using the pair tool. One of them firstly calculated the ground truth of fruits by subtracting the duplicated fruits from the total fruits in sequence images, and then the other checked the number again to ensure the correctness of the ground truth.
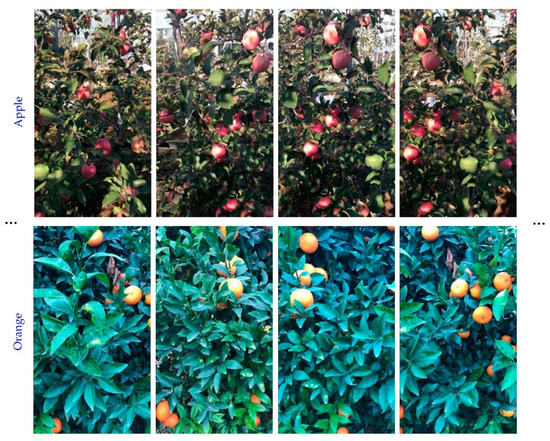
Figure 1.
Examples of the fruit image sequences.
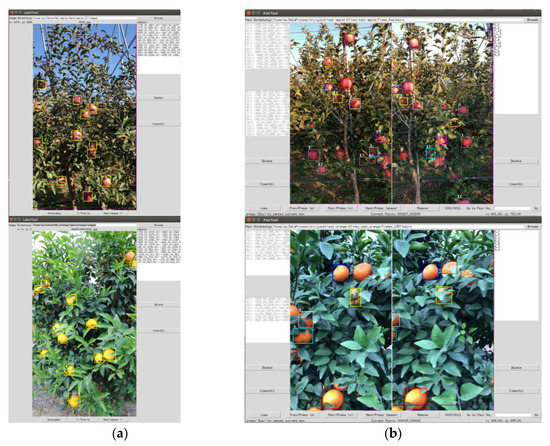
Figure 2.
Self-developed tools for data annotation. (a) Coordinates label tool, (b) Pair tool.
2.2. Methodology
2.2.1. Method Overview
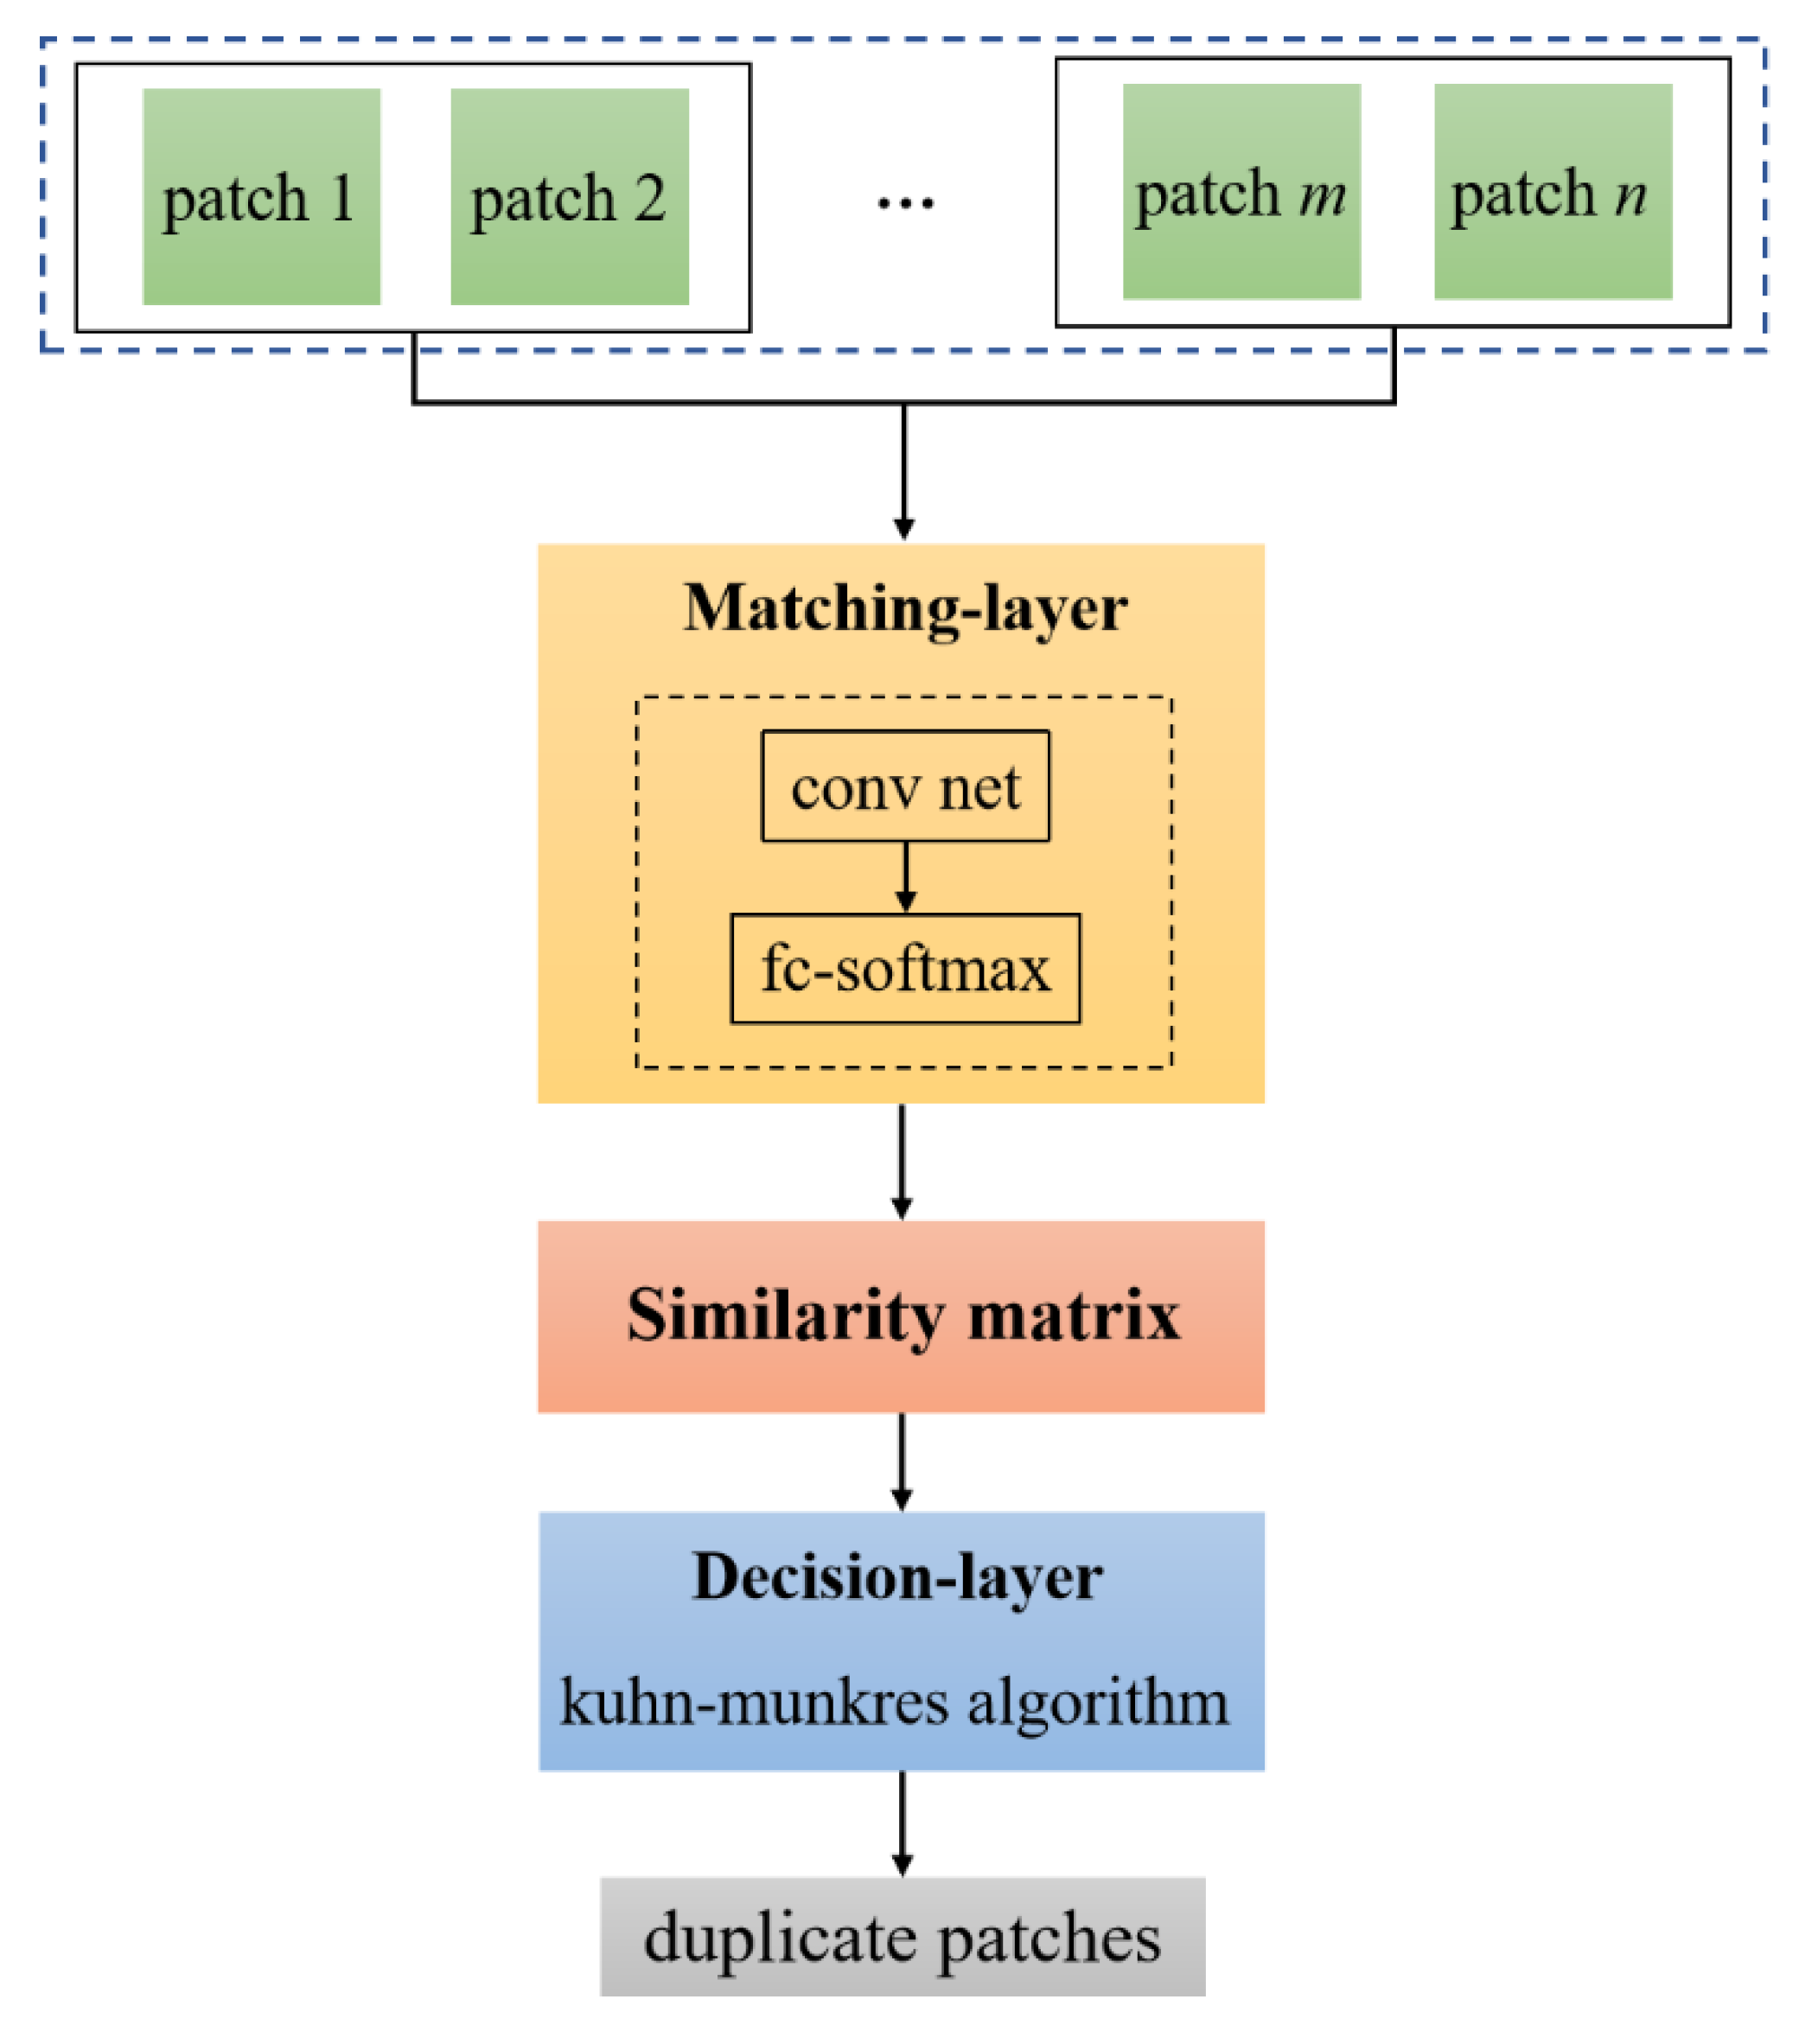
Fruit yield estimation in image sequences consists of fruit detection, duplicate fruit matching, and correction of fruit number. Figure 3 illustrates the workflow of the proposed method. For an input images sequence, the CNN-based detection model CenterNet is employed to detect the fruit regions in each image and the detector outputs a set of detected bounding boxes. To avoid double counting for a single fruit, the fruit matching model is utilized to recognize and mark the detected fruits that have the same identities between successive images, then the fruit number counted in images is corrected according to the number of duplicated fruits. The sum of fruits count in the image sequences can be calculated by:
where S represents an image sequence, n denotes the number of images in S, si indicates an image from the image sequence (si ∈ S), count (·) represents the fruit count of images, and count (si ∩ si+1) indicates the count of duplicate fruit from si and si+1.

Figure 3.
The workflow of the proposed method.
2.2.2. Fruit Detection Model
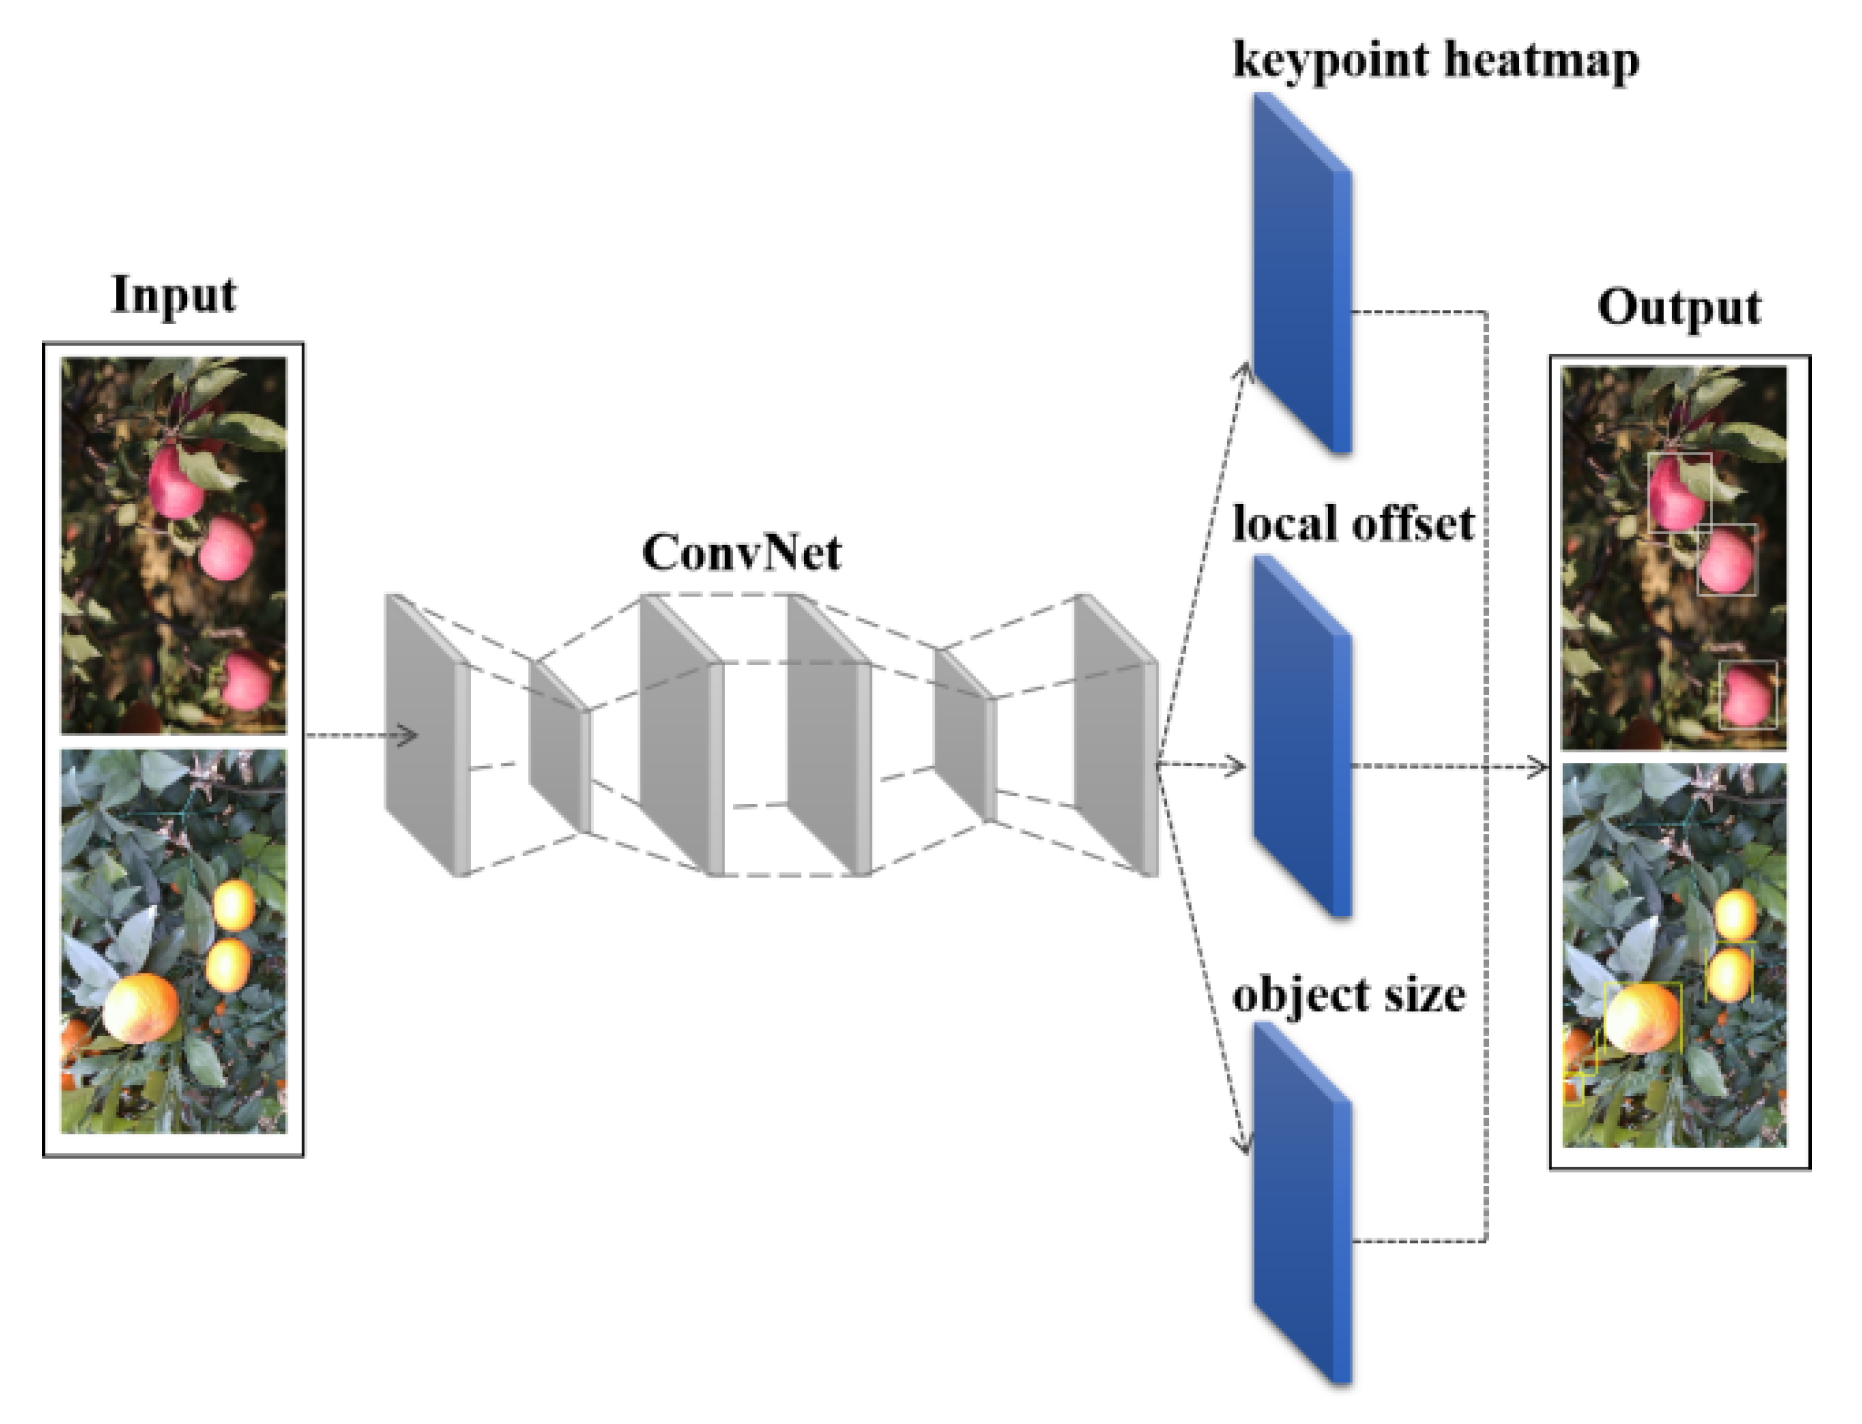
Fruit detection is one of the most perceptual steps towards fruit yield estimation. In the aspect of fruit detection using the CNN-based model, CenterNet [35] is a preeminent anchor-free detection model, which is considering object detection as the problem of key-points prediction and bounding boxes regression [46]. This concept takes advantage of the speed-accuracy trade-off, since it does not require non-maximum suppression (NMS) to eliminate the multiple prior anchors. Therefore, the CenterNet is adopted in this work as the fruit detector for better detection in the complex orchard condition. Figure 4 shows the network architecture of the CenterNet detector.
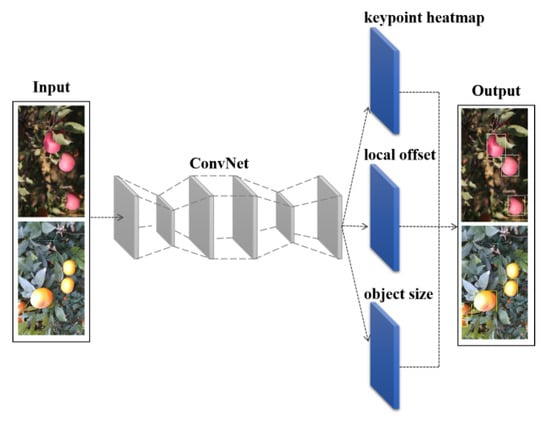
Figure 4.
The network architecture of the CenterNet detector.
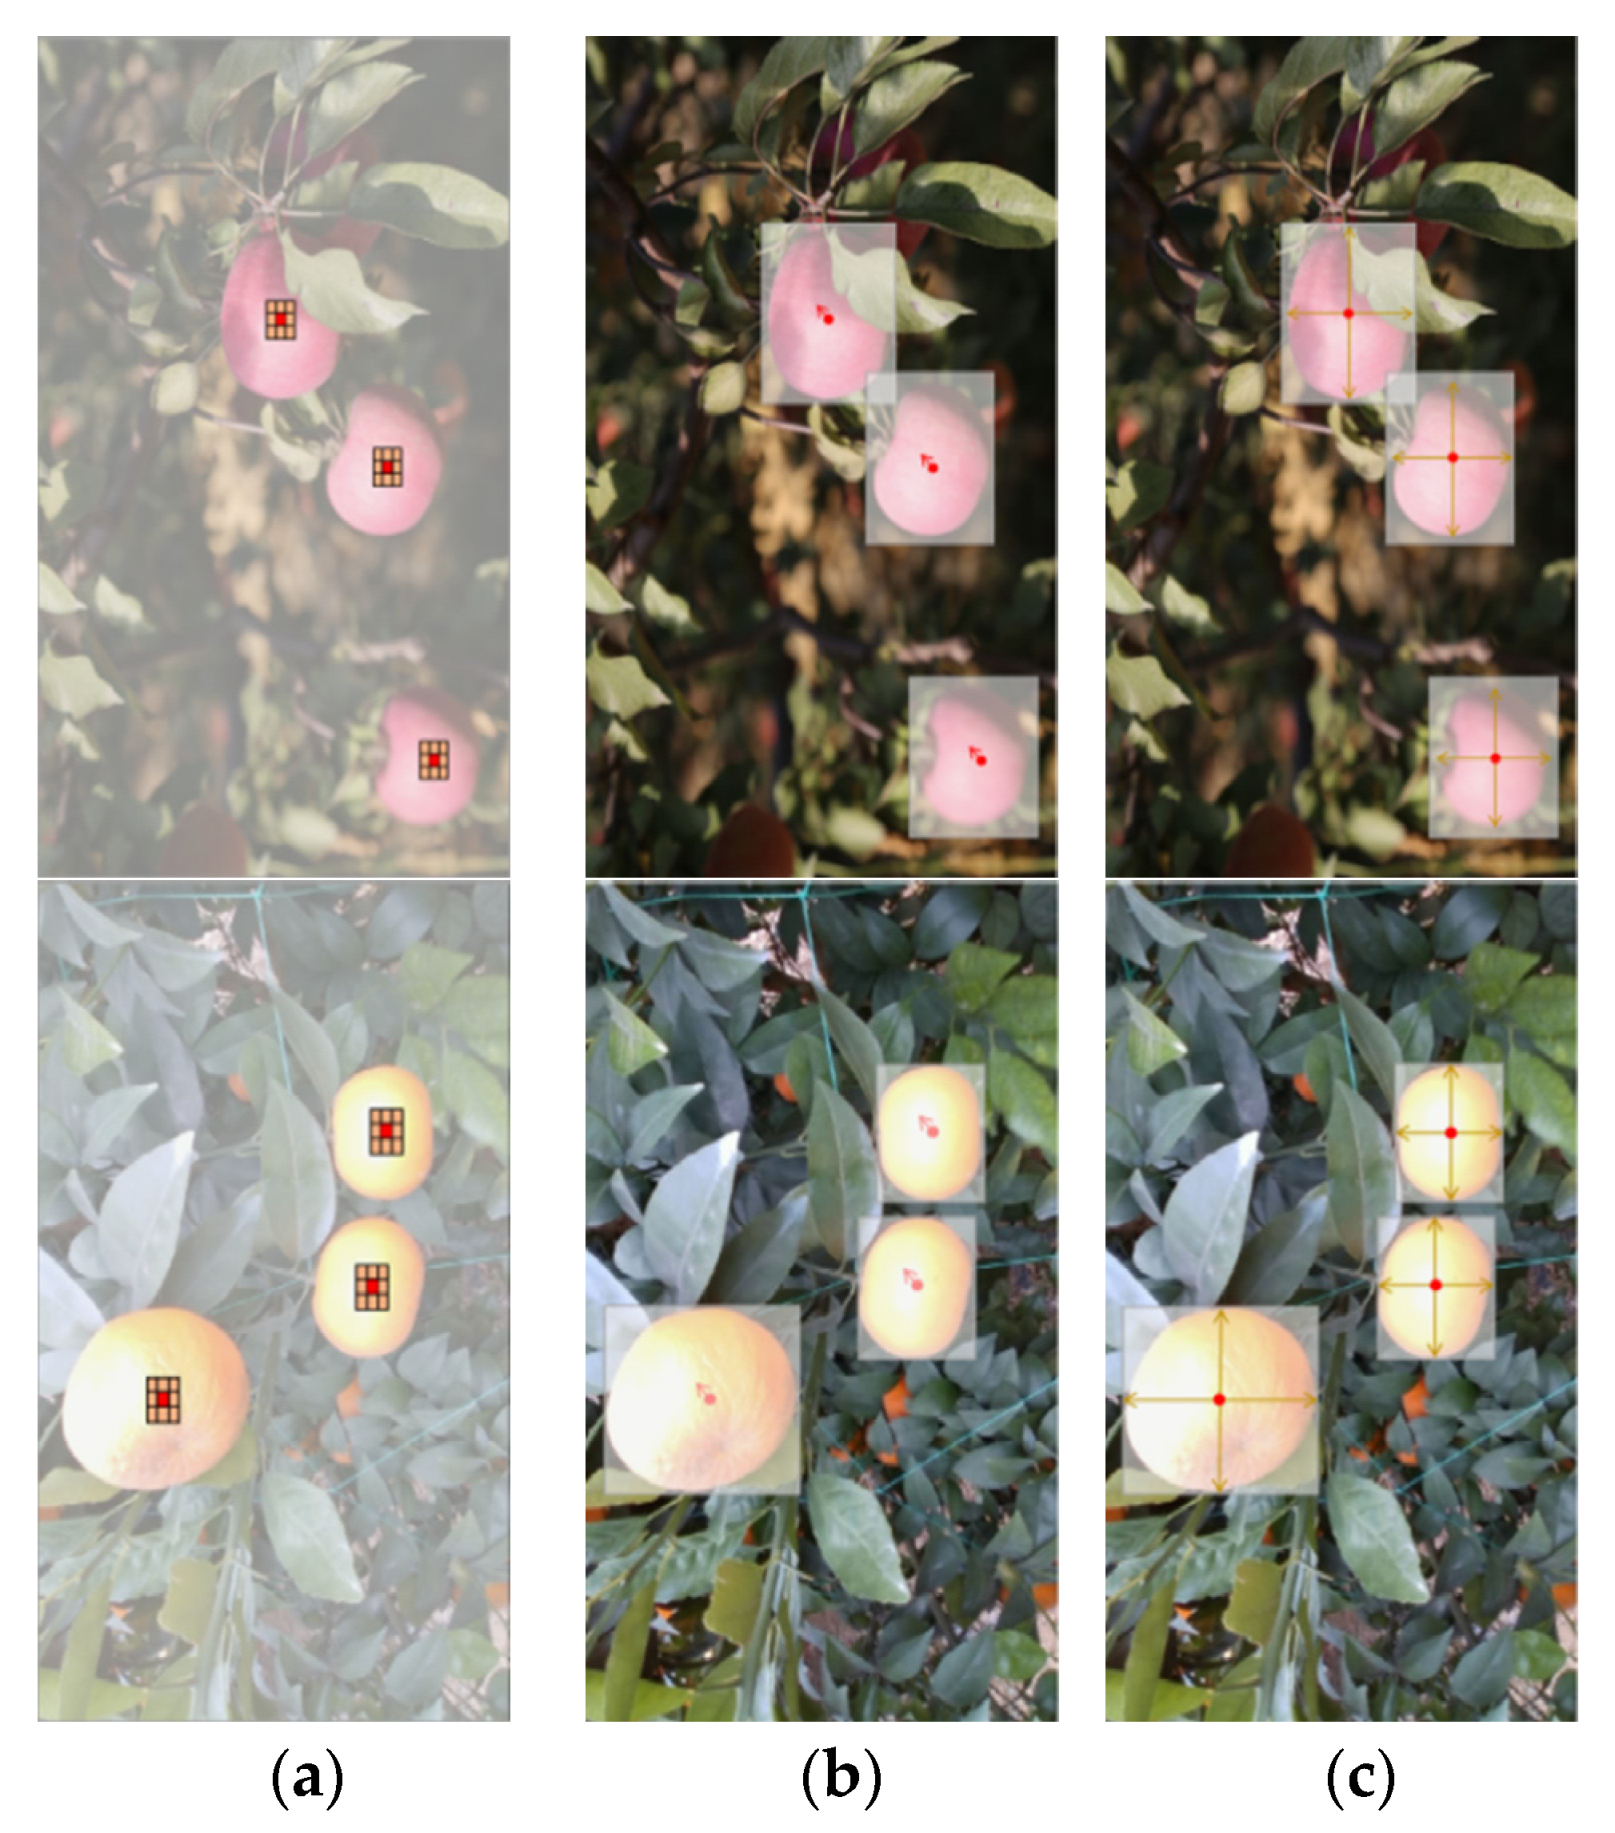
Specifically, CenterNet takes an encoder-decoder convolutional neural network as the backbone to generate feature maps from extracted features of images for fruit recognition and location regression. The final feature maps include three branches: keypoint heatmap branch, local offset branch, and object size branch. In the keypoint heatmap branch, each object is represented as the Gaussian kernel generated by the object properties in terms of locations, shapes, and sizes. The equation of the Gaussian kernel is depicted as:
where Y is the Gaussian kernel, is the coordinate of the kernel center, and is the standard deviation from the shape and size of the fruit.
Meanwhile, the local offset branch and the object size branch are responsible for the local offsets of center points and the bounding box sizes of objects, respectively. Based on the above process, the location of the center points and the sizes of fruits can be calculated. The example of prediction outputs from three branches of the CenterNet detector is illustrated in Figure 5.
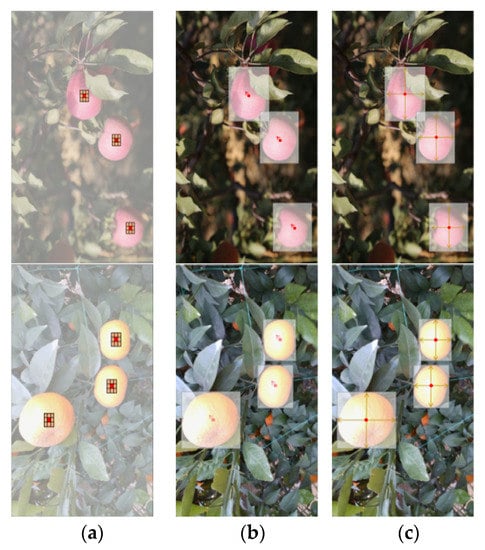
Figure 5.
Example of the outputs from three branches of the CenterNet detector. (a) Heat map, (b) Local offset, (c) Object size.
2.2.3. Fruit Matching Model
The same fruit between adjacent images may have a big different appearance affected by the branches’ obstacle and shadow. It is hard to establish matches of some fruits even by human eyes. In order to avoid double counting of fruits in yield estimation, an effective method is needed to identify the same fruits patches observed repeatedly across the sequential images. The objective of image patch matching is to learn the same or similar features from two images, enabling matches to be as close as possible while the unmatched ones are far apart in the measuring space [47]. The DeepCompare network adopts a double-channel network to learn the discriminative metric for similarity measurement from raw image patches, providing good flexibility, since it starts with jointly processing for each two image patches [48]. Nevertheless, it is prone to allocate one fruit with many different ones as duplicate fruit because of the maximum assignment strategy adopted in the model, resulting in image patches being invalid to match one-to-one. To solve this issue, an advanced fruit matching model is designed in this work to complete the optimal assignment for a better pairing of fruit patches.
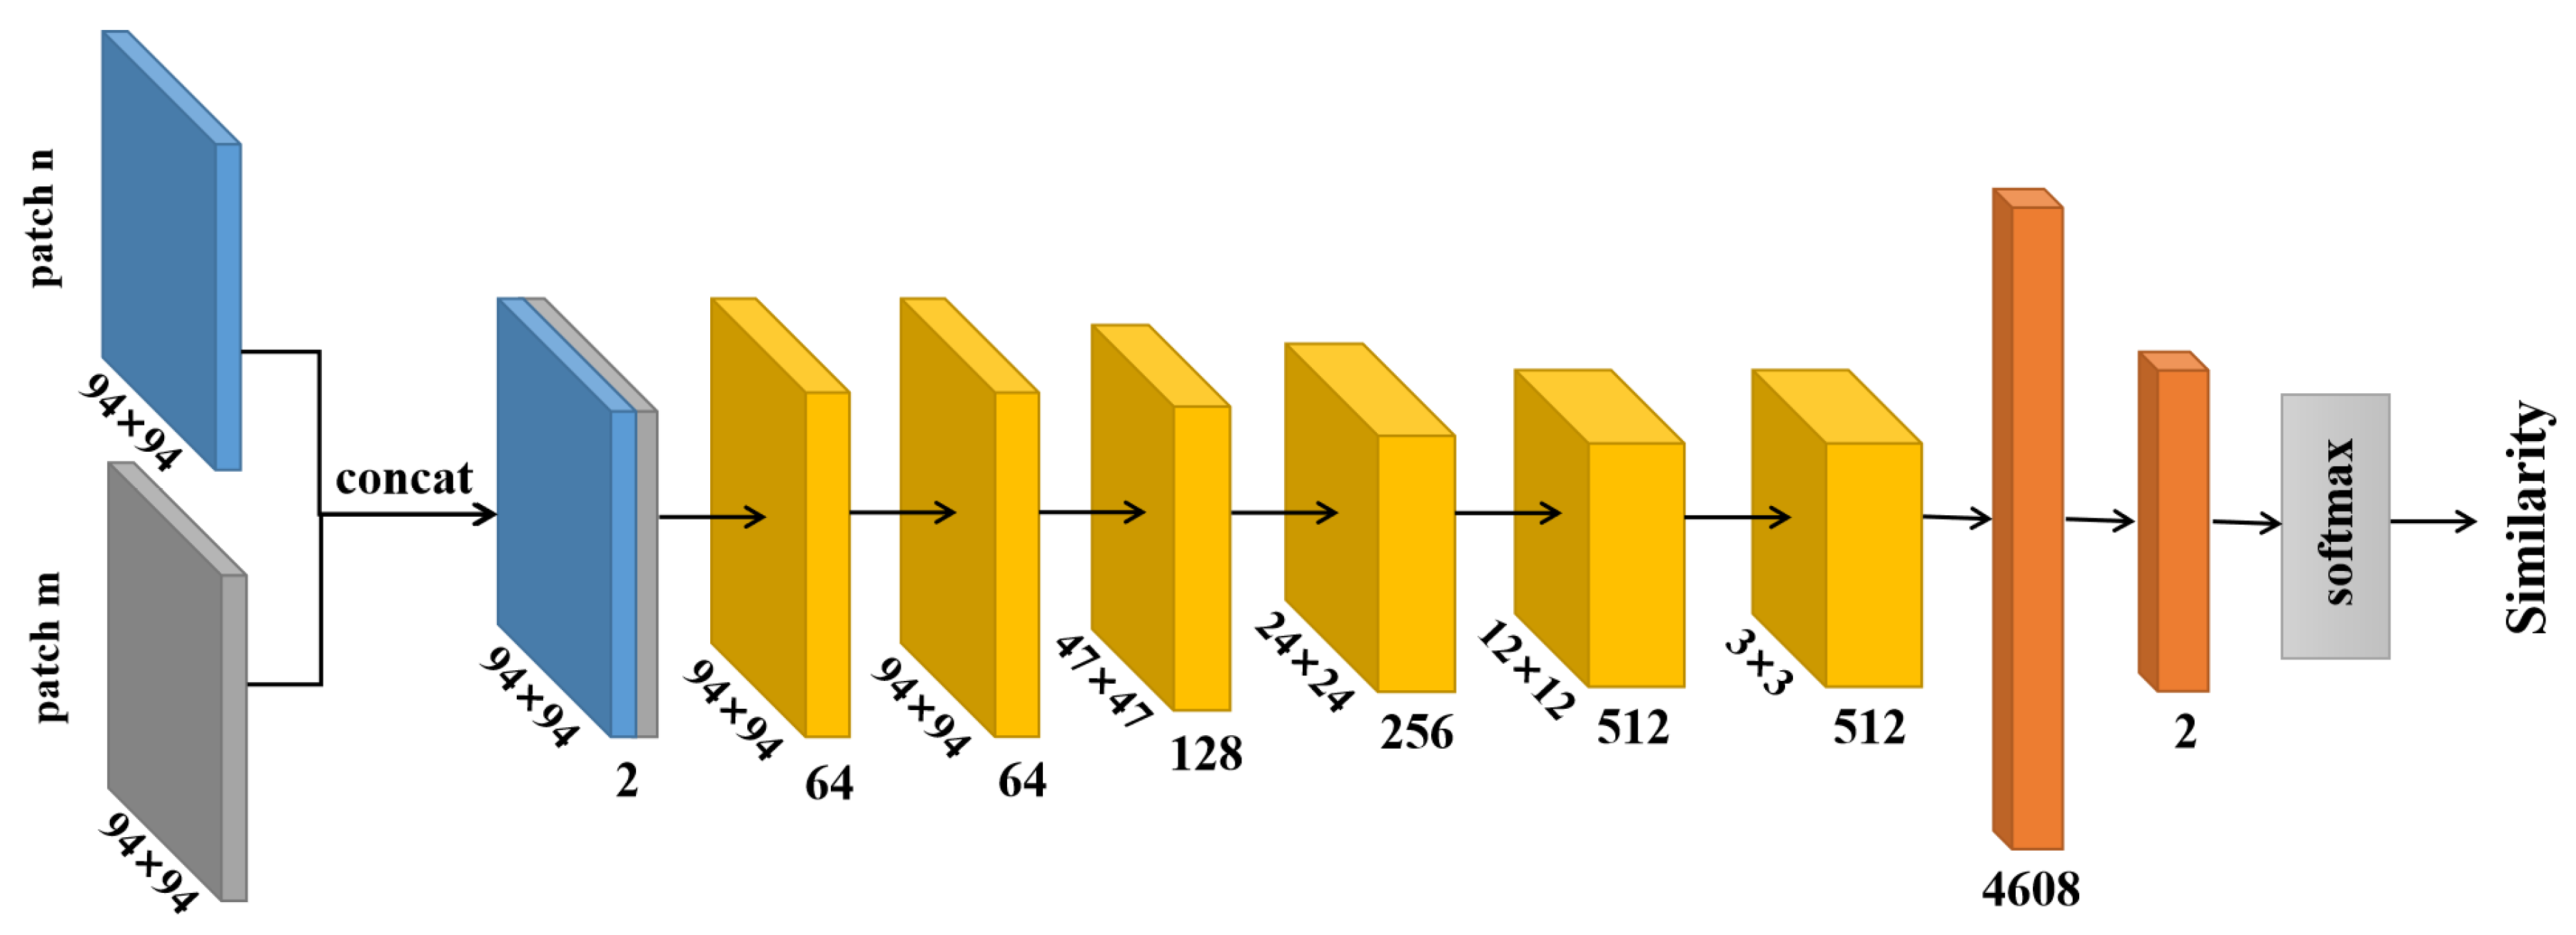
The fruit matching model consists of matching layer and decision layer, as shown in Figure 6. The matching layer is responsible for generating a similarity matrix, while the decision layer assesses feature similarity of patches to predict the duplicate fruits. The input of the model is multiple image patches from fruit regions detected in images by the CenterNet. The matching layer consists of a series of convolutional, fully connected linear and softmax function to identify probe images and possible similar candidates. Figure 7 depicts the network structure of the matching layer.
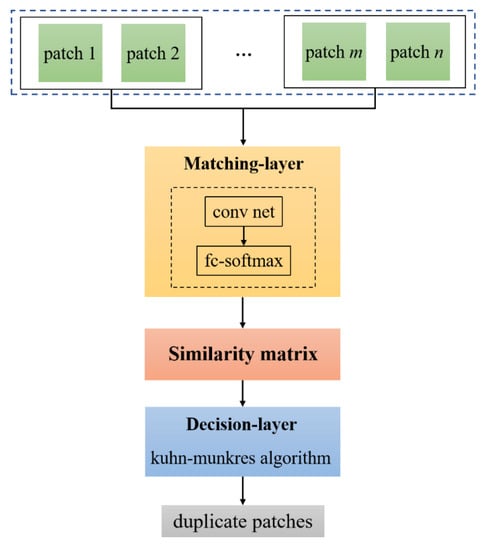
Figure 6.
The workflow of the fruit matching model.
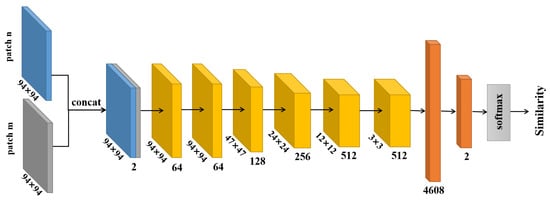
Figure 7.
The network structure of the matching layer.
Each pair of input patches would be resized to 94 × 94 pixels and concatenated before input to the matching layer. Specifically, let ri and ri+1 denote the fruit patches detected in image si and si+1, respectively. The matching result can be predicted by:
where Pmn presents the matrix of maximum matching between ri and ri+1, where m and n are numbers of fruit regions of images si and si+1, and the conf (rim,) is the similarity score between the m th patch in ri and the n th patch in ri+1, which is in (0, 1).
The cross-entropy loss is used as the loss function for the training of the matching layer, which can be defined as:
where is the number of samples, is the label of sample , , and is the confidence of positive, .
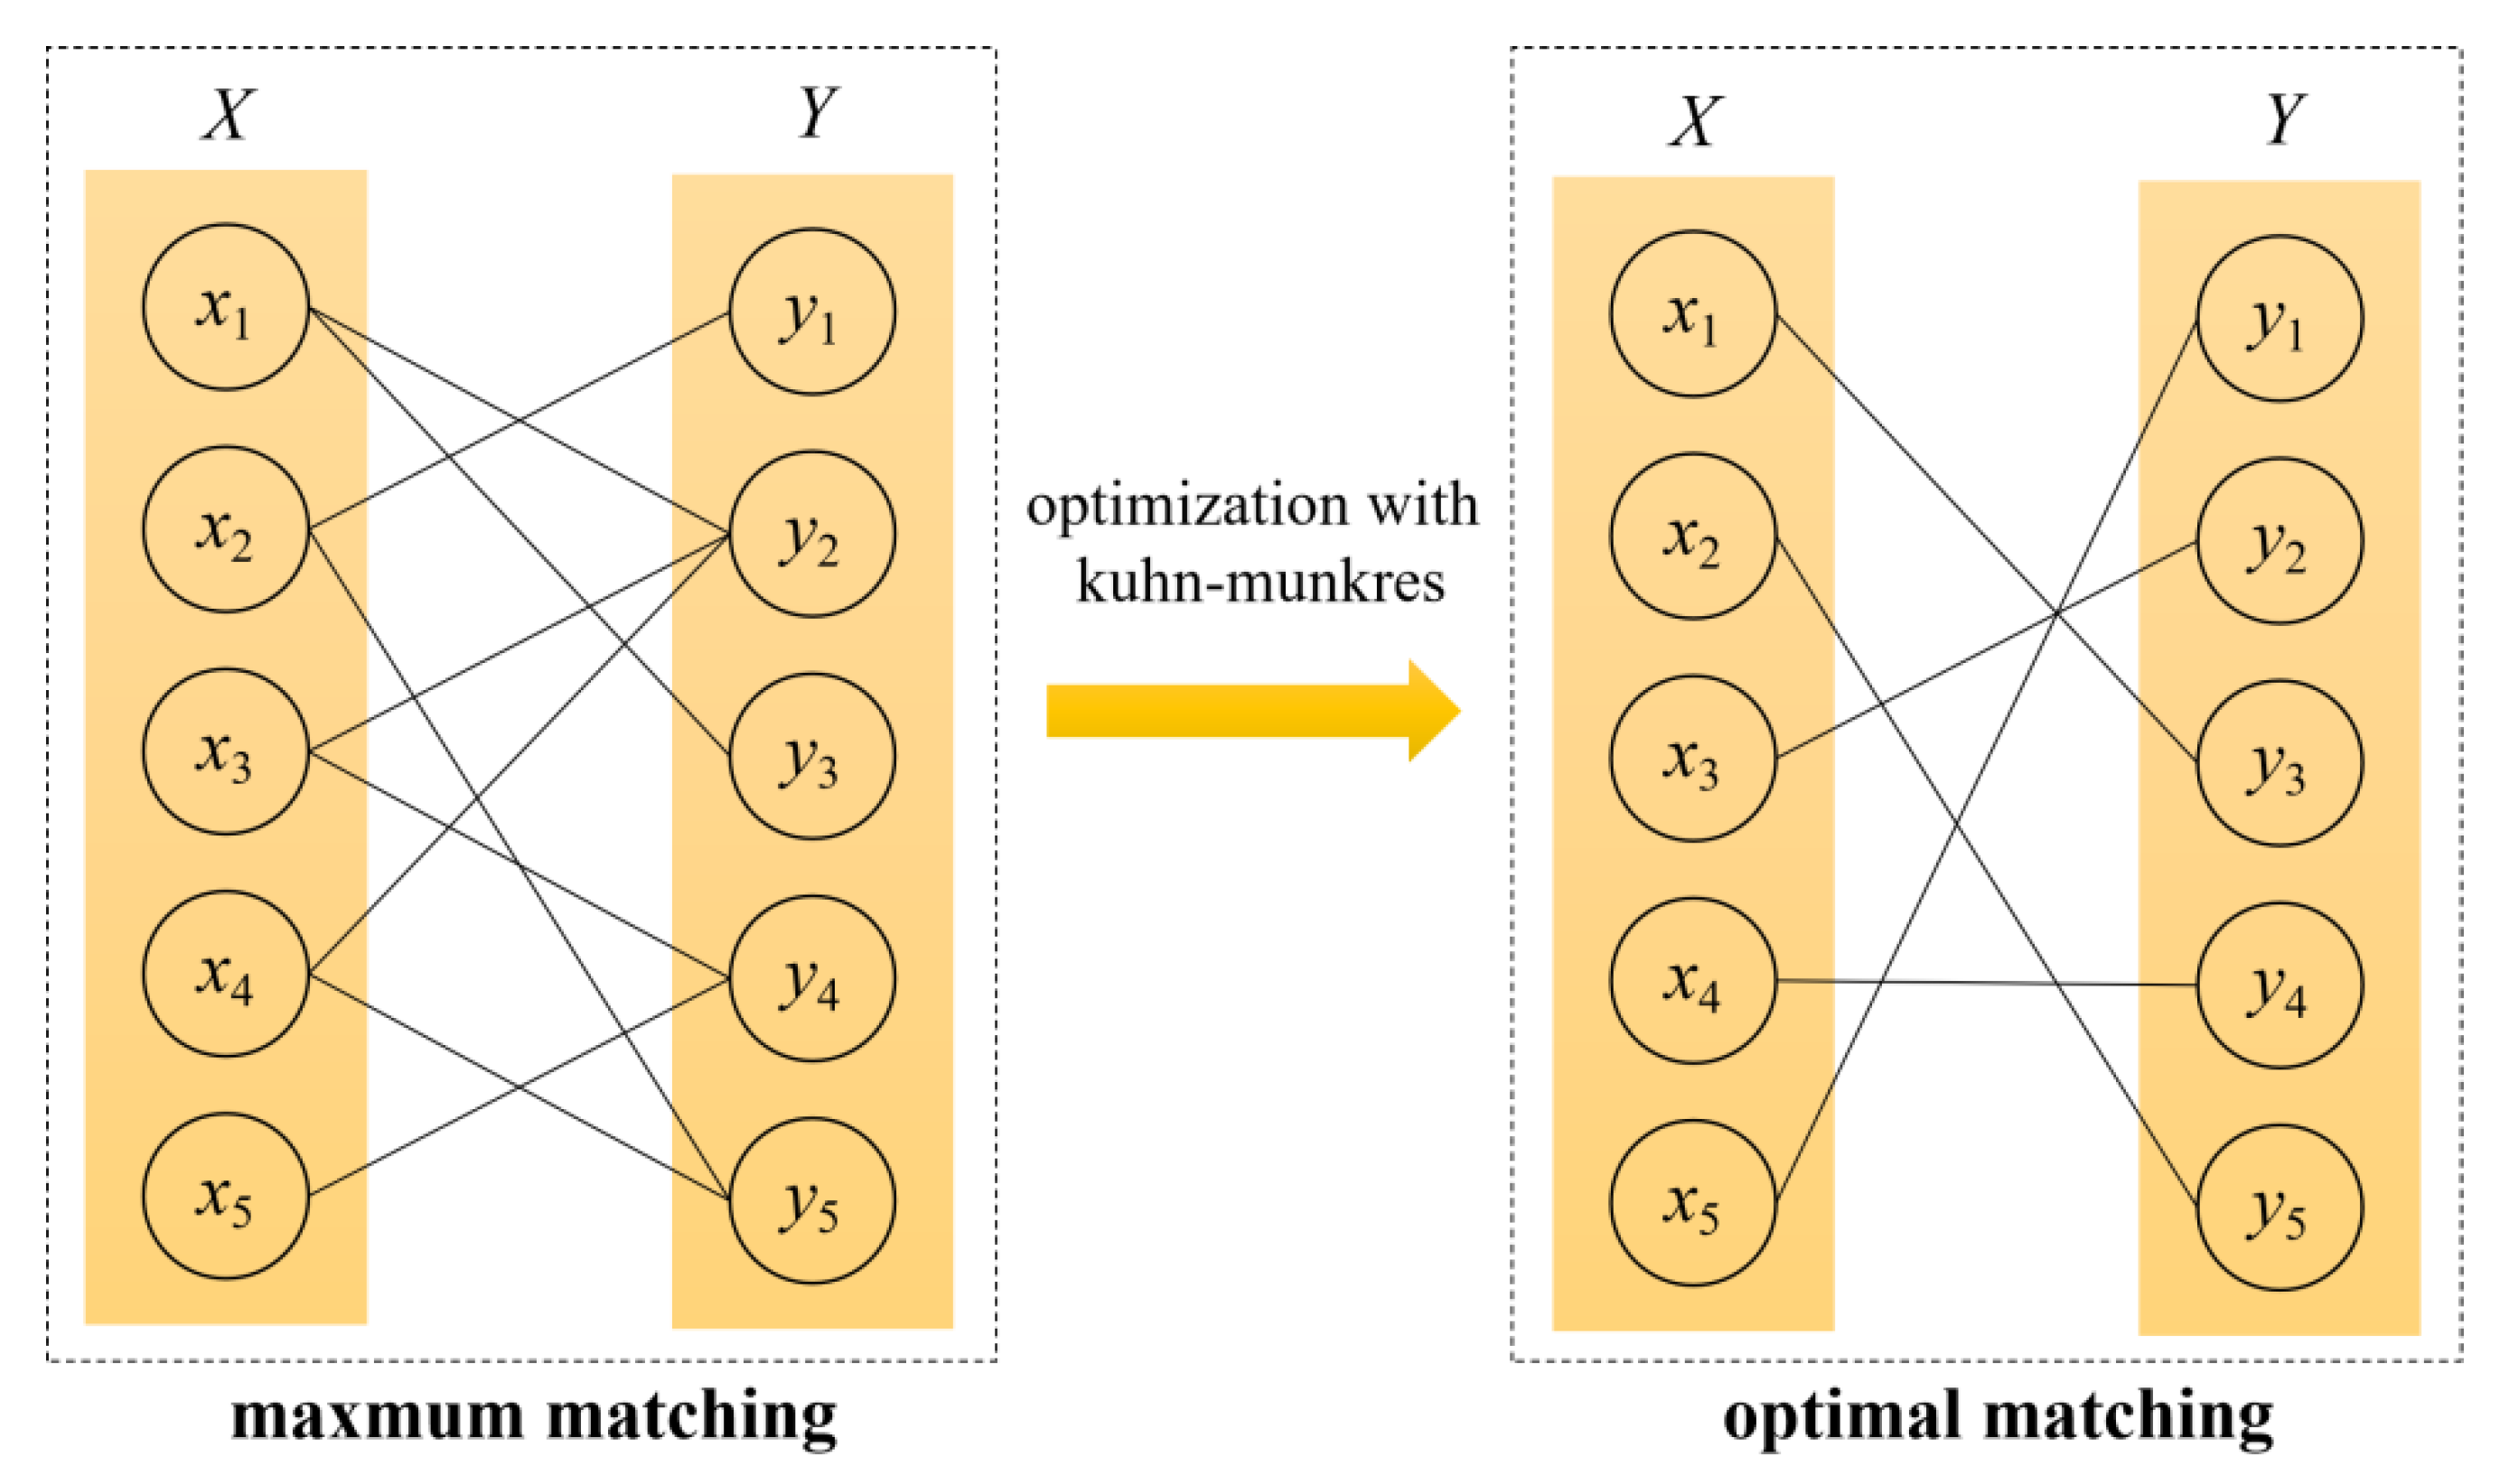
The Kuhn–Munkres filter, invented by Kuhn [49] and improved by Munkres [50], is a combinatorial optimization algorithm that solves the optimal assignment problem. An example of Kuhn–Munkres optimization is shown in Figure 8. In this research, the Kuhn–Munkres algorithm is employed in the decision layer to correlate the same fruit in adjacent images by turning a maximum matching from the similarity matrix into an optimal matching result for a corrected count of duplicate fruits.
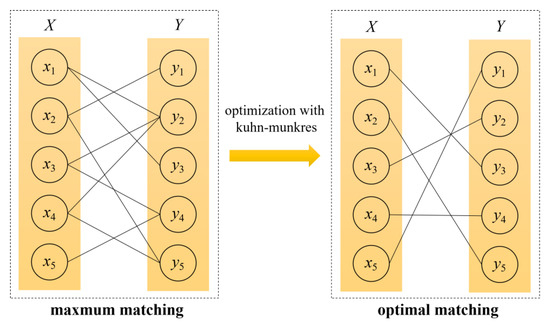
Figure 8.
Example of Kuhn–Munkres optimization.
Specifically, for an initial similarity metric of patches generated from images si and si+1, setting rim and as elements of graph vector X and graph vector Y in the similarity metrix, respectively, then the weight of the connection between elements can be denoted as weight (rim,), and the corresponding connected edge can be denoted as edge (rim,) [51]. In the process of optimal matching using the Kuhn–Munkres algorithm, similarity scores of patches from the similarity matrix are considered as the weights of the edges between elements of vector X and vector Y for bipartite graph matching [52]. By updating the top marks of the elements, the number of viable edges between elements is continuously gained, and all these top marks would be assured to be viable top marks until the optimal matching is completed. The score of the weight might act on the priority of the match. Finally, the number of matched pairs obtained from the optimal assignment process is the corrected count of duplicate fruits between images.
3. Experiments and Results
3.1. Experimental Environment
To train models and evaluate the performance of the proposed method for fruit yield estimation, all experiments are implemented on a workstation platform containing an NVIDIA (R) TITAN Xp GPU with 16 GB of graphics memory, an Intel(R) Core i7 7700 CPU processor, and 32 GB of DDR4 RAM, running on the Ubuntu Linux 16.04 operating system. Compute unified device architecture (CUDA) toolkit 10.0 and CUDA deep neural network (cuDNN) v7.5 are both applied to faster graphic calculation and less memory access latency. Python is employed as the programing language to implement model building, training, and testing under PyTorch 1.0 deep learning framework.
3.2. Performance of Fruit Detection
For generation and evaluation of the fruit detection model, 1199 apple images (contain 10,177 fruits) and 2849 orange images (contain 34,470 fruits) were randomly selected from the image sequences to be used for the experiment of the fruit detection. Furthermore, an additional ACFR-Apple dataset from the publicly available dataset ACFR FRUIT DATASET [53], which contains 1120 RGB images of apples with corresponding annotations (contain 5765 fruits), was used for a fair comparison. The detailed partition of fruit images for the fruit detection model is shown in Table 1. By setting the training hyperparameters, the model can be trained and used for fruit detection. The initial key parameters of the detection model are listed in Table 2.

Table 1.
The detailed partition of fruit images for the fruit detection model.

Table 2.
Initial key parameters of the detection model.
In the experiment, the detection model treated each image as an individual input, then outputs the bounding boxes corresponding to the detected fruits. The detection evaluation is performed on the test dataset of this study, which contains 121 apple images and 286 orange images, and the ACFR-Apple dataset, which contains 112 apple images. The average precision (AP) of each kind of fruit and the mean average precision (mAP) of two kinds of fruits are selected as the evaluation metrics, which are generally adopted in object detection tasks [54,55,56]. The AP and mAP can be defined as:
where P denotes the precision, while R denotes the recall.
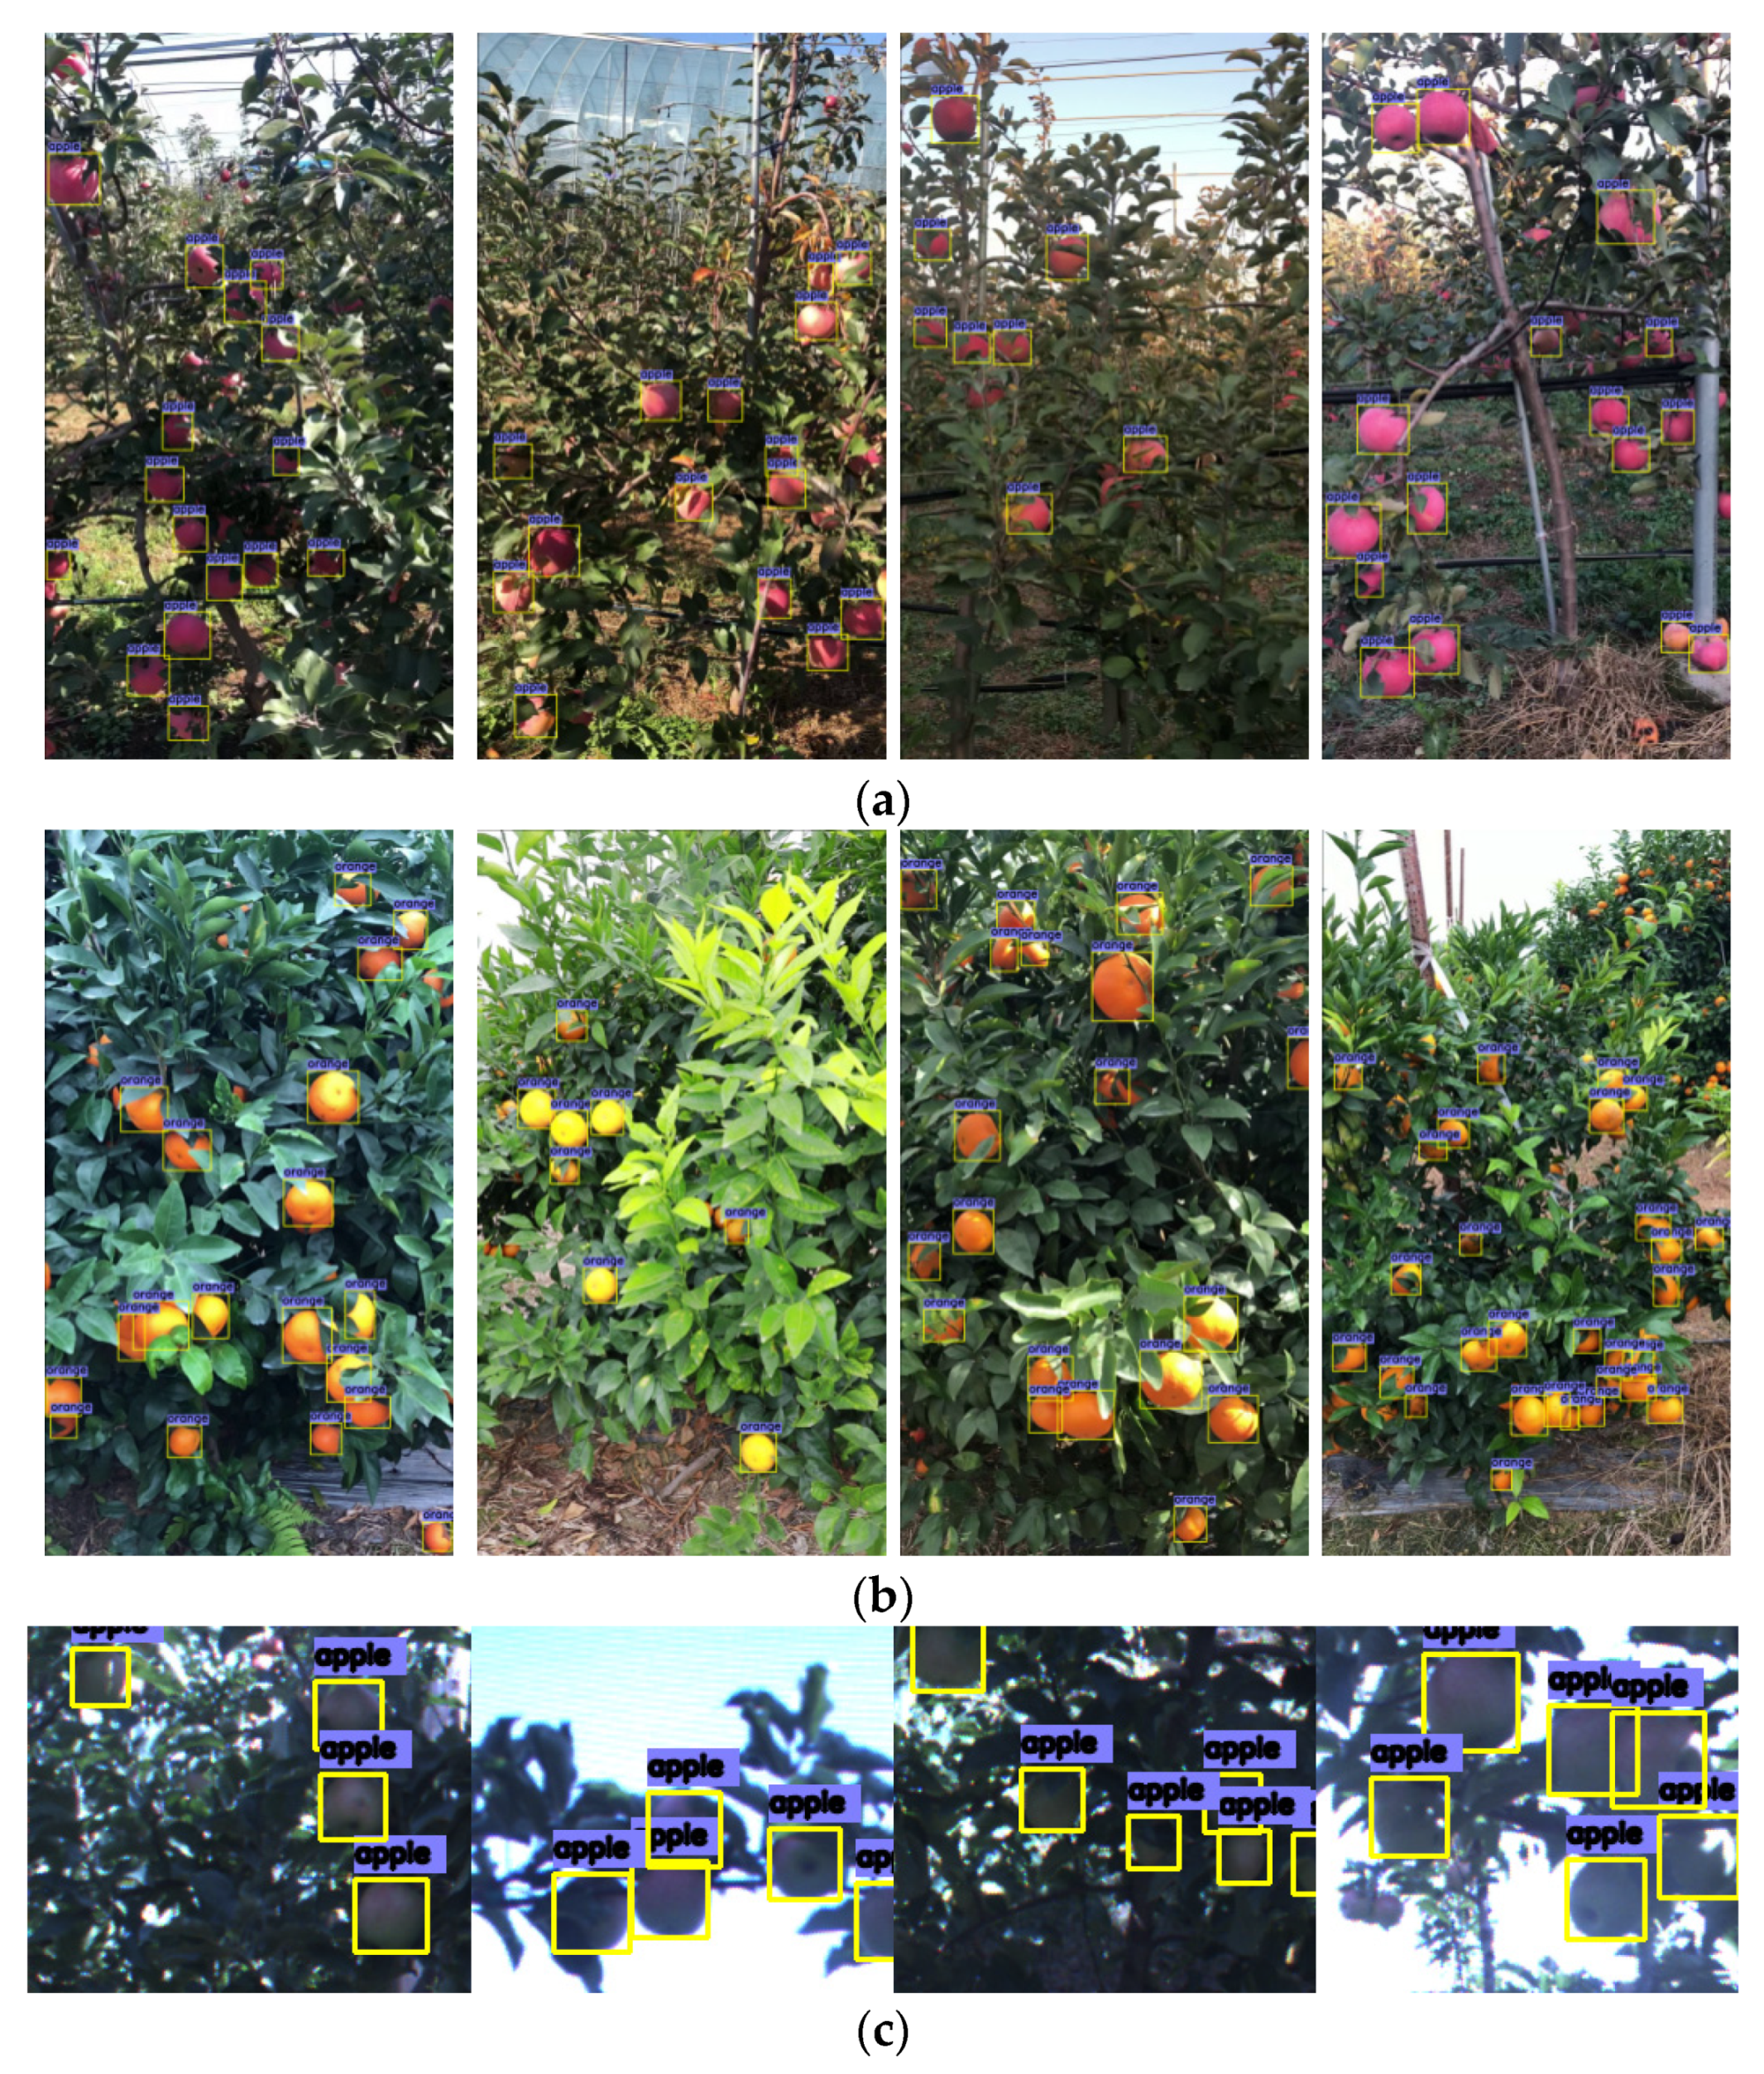
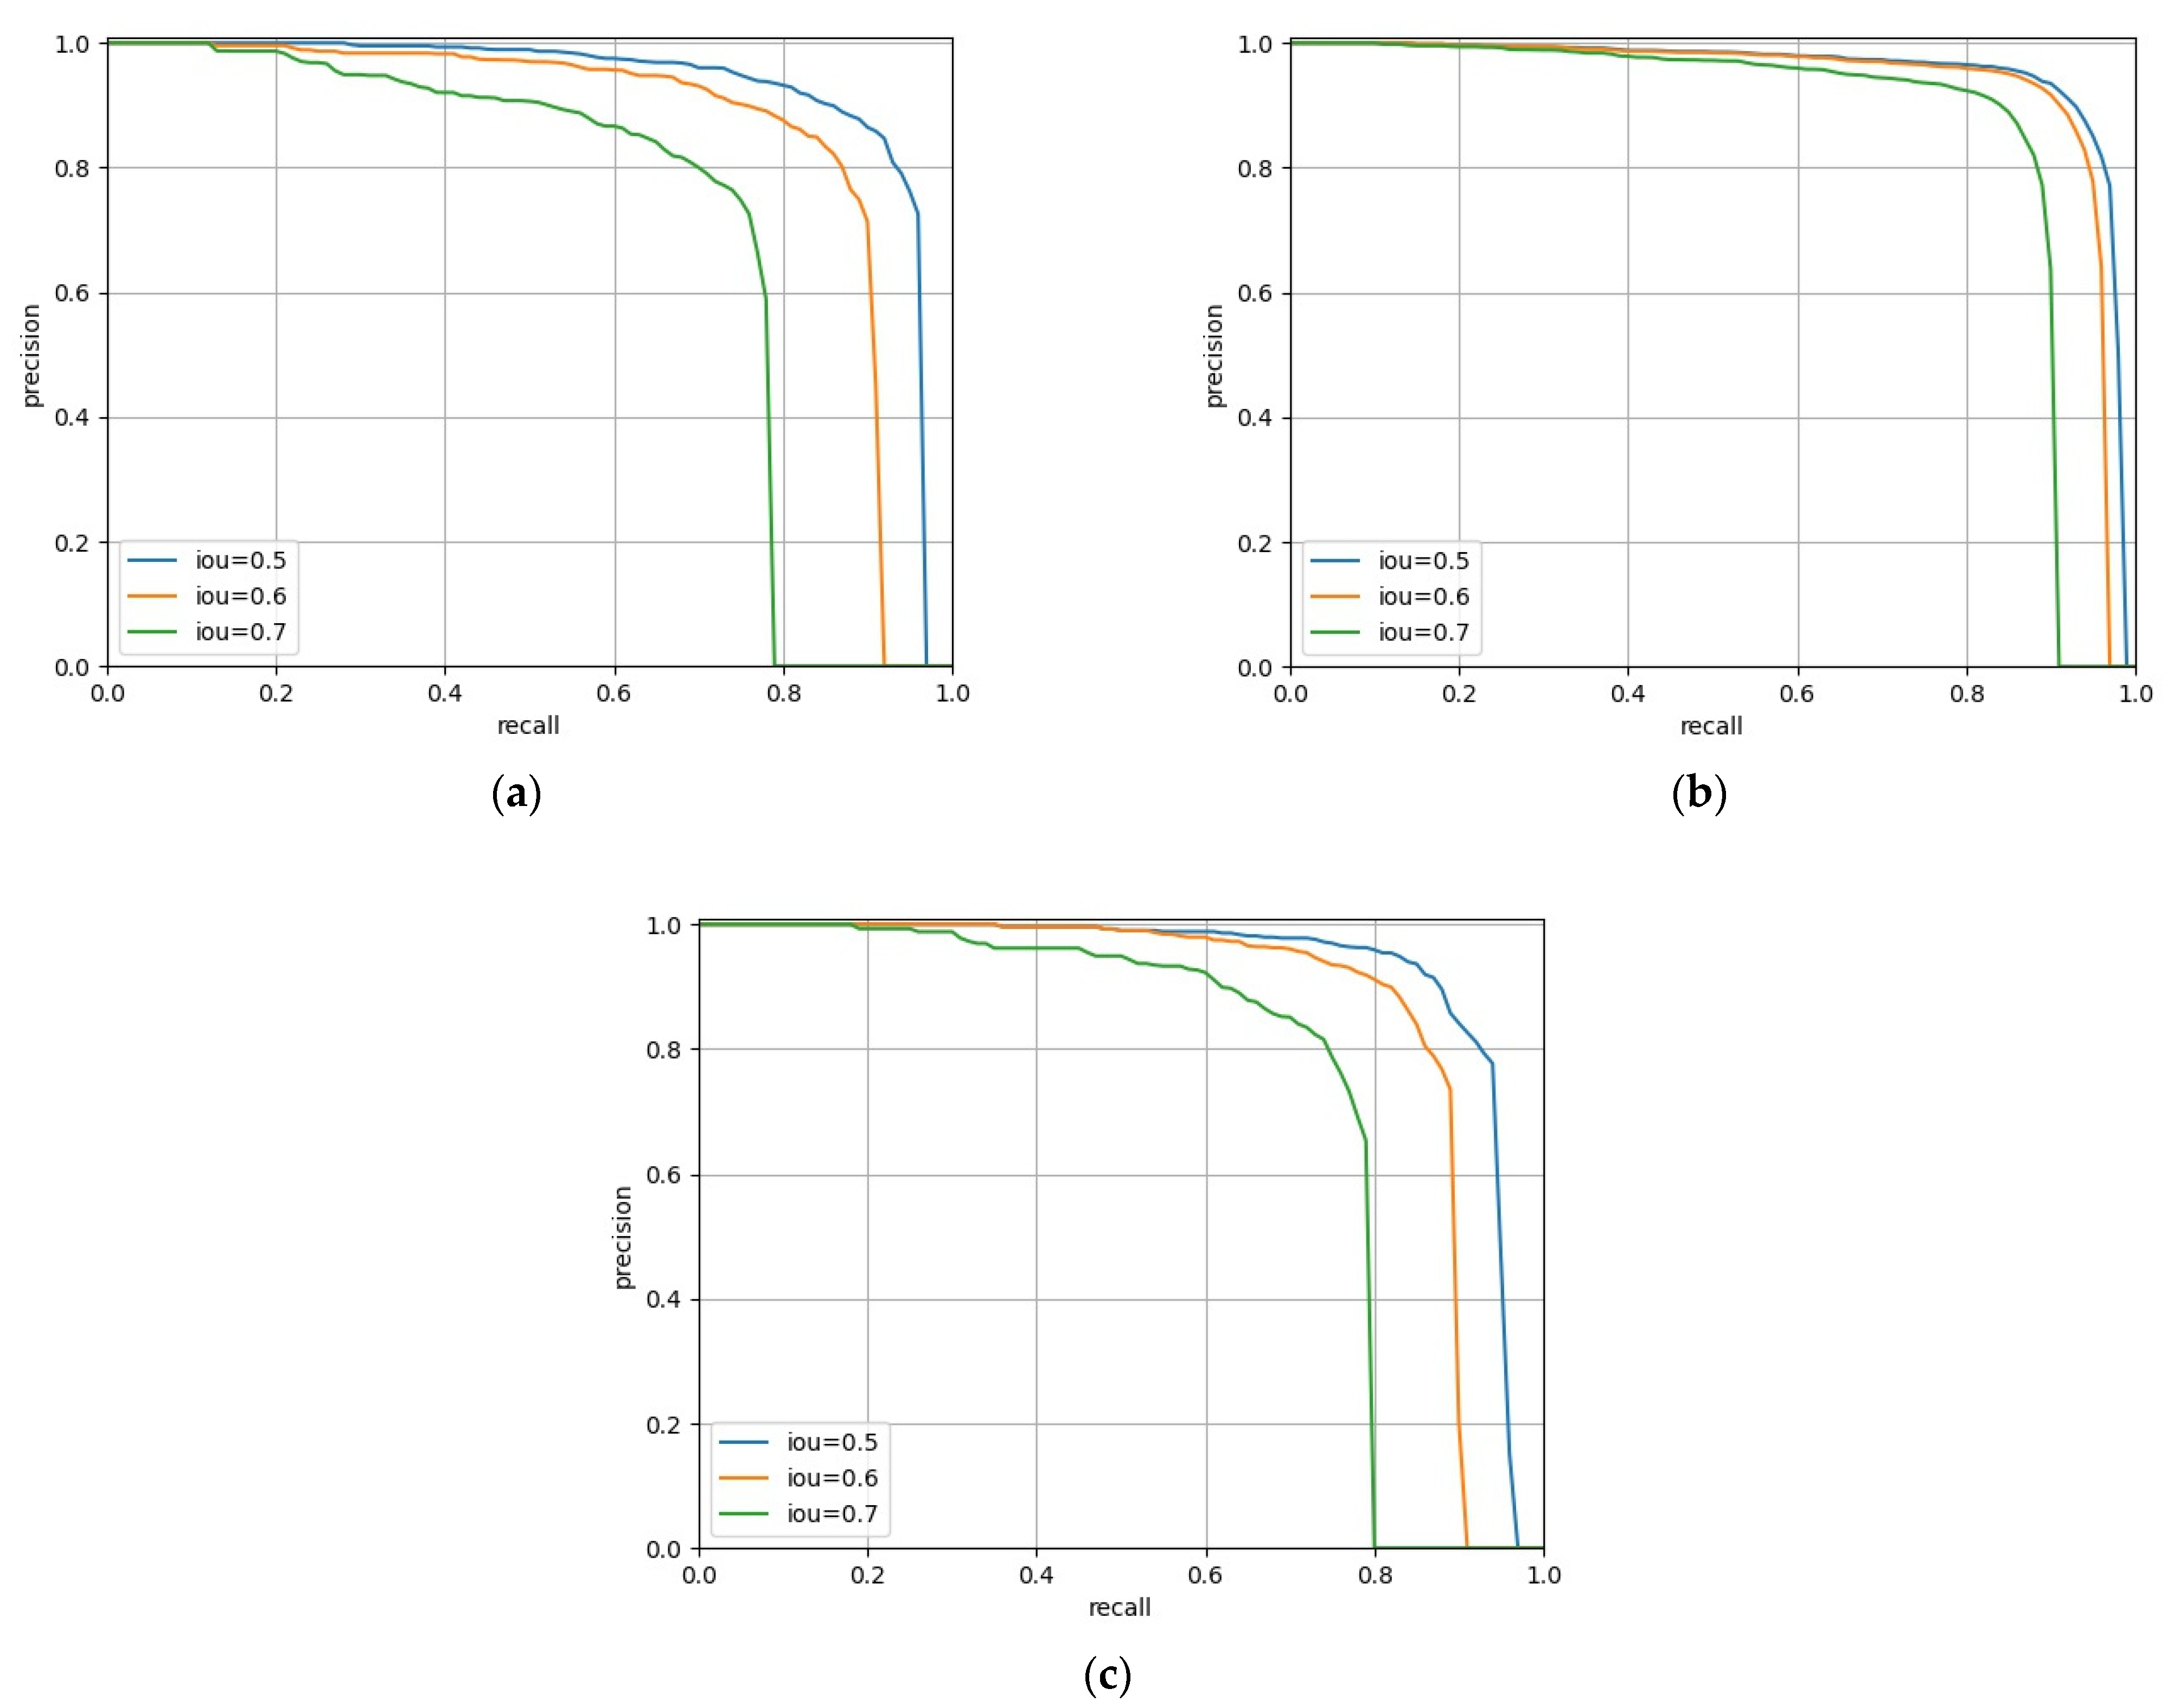
The values of the AP and mAP are calculated when the Intersection Over Union (IOU) is set to 0.5, 0.6, and 0.7, respectively. Furthermore, the precision-recall curve (PRC) tested in each dataset is utilized as well for comprehensive observation of the detection performance. Figure 9 illustrates the trained detection model worked on test images. As shown in Figure 9, most fruits can be detected from the background by the CenterNet model and shown the robustness for detecting both apples and oranges under various conditions in the orchard. Hence, the effectiveness of the CenterNet model is validated. After fruit detection, the yellow rectangles in images were regarded as true detected fruits to be used for counting the fruit number during the yield estimation.
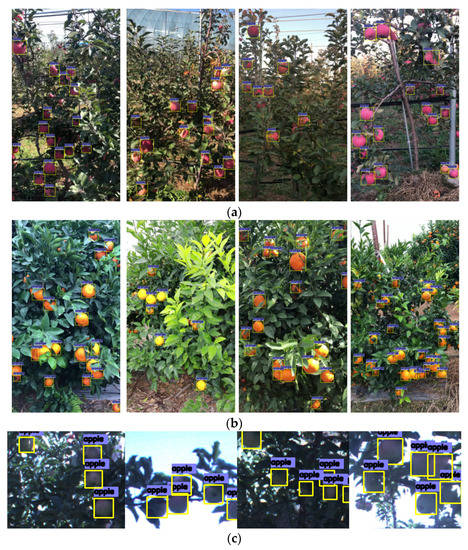
Figure 9.
Illustration of the fruit detection results. (a) Illustration of the apple detection result in the collected dataset of this study, (b) Illustration of the orange detection result in the collected dataset of this study, (c) Illustration of the apple detection result in the ACFR-Apple dataset.
The quantitative results of the model evaluation for fruit detection are listed in Table 3 and the precision-recall curve (PRC) is shown in Figure 10. It can be seen from the detection result in the dataset of this study that the detector proves sound performance in each category. The AP of apples and oranges are both reached more than 0.90, while the mAP of these two classes achieved 0.939 under an IoU of 0.5, which is a better result than that on IoU of 0.6 and 0.7. The detection result in the ACFR-Apple dataset has shown that the AP value is 0.924 under IoU of 0.5, and this result is also better than that on IoU of 0.6 and 0.7 in the ACFR-Apple dataset. The experimental results revealed that the CenterNet model can support a solid basis for fruit detection.

Table 3.
The quantitative results of the model evaluation for fruit detection.
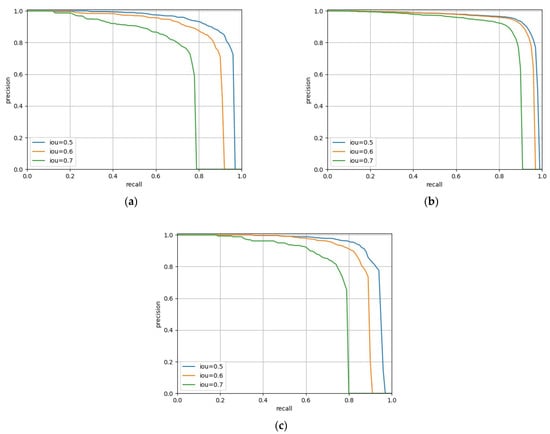
Figure 10.
Precision-Recall curve of the model evaluation for fruit detection. (a) The P-R curve of apple detection in the collected dataset of this study. (b) The P-R curve of orange detection in the collected dataset of this study. (c) The P-R curve of apple detection in the ACFR-Apple dataset.
3.3. Performance of Fruit Matching
The fruit matching model proposed in this study determines the correlation of fruit image patches by analyzing the similarity of their features. In the experiment, 3066 pairs of apple image patches and 6028 pairs of orange images patches were cropped according to the coordinate annotation from the training data of the fruit image sequences for matching model training. Each image pair consists of two patches of fruit images that have the same identity. Figure 11 shows the training samples of fruit image pairs.

Figure 11.
Samples of fruit pairs for the training of the fruit matching model. (a) Training samples of apple image pairs. (b) Training samples of orange image pairs.
The fruit matching model was trained from scratch in mini-batches of a size of 16 with a constant learning rate of 0.0005 for 300 epochs. The Adam optimizer was applied in model training. All image pairs would convert to greyscale before feeding into the deep convolutional neural network.
For evaluating the performance of our fruit matching model, 20 groups of two adjacent images for apple (contain 828 fruits) and 20 groups of adjacent images for orange (contain 793 fruits) were randomly selected from the test data of the fruit image sequences, and the classical DeepCompare model was compared with our fruit matching model. The average values of the accuracy, precision, recall, and F1 score are selected as the evaluation metrics.
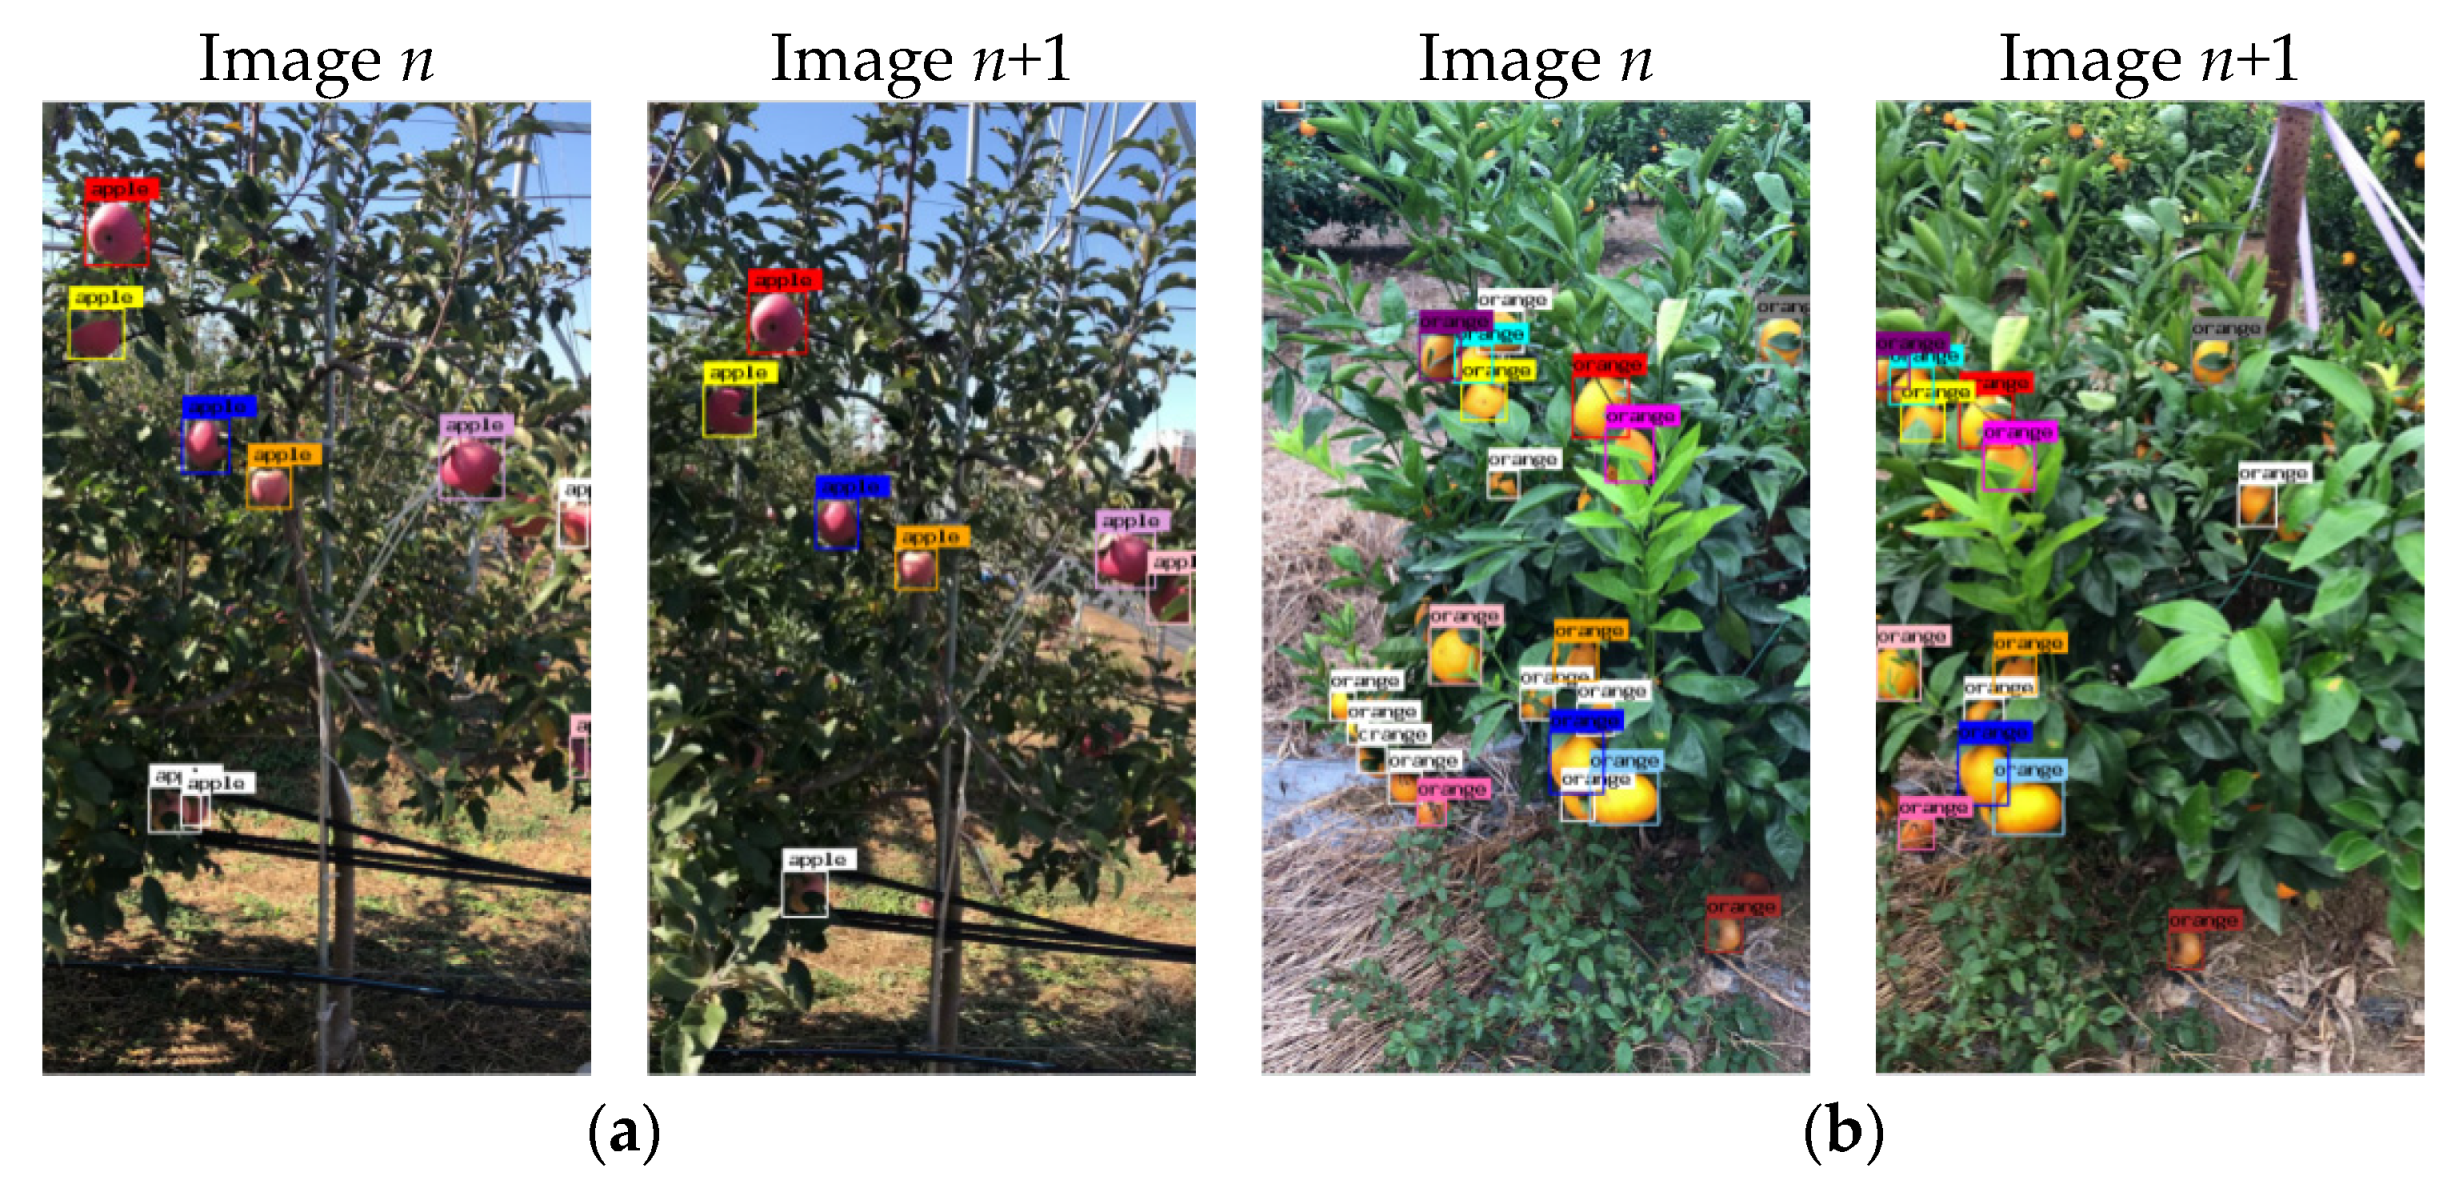
Figure 12 presents the examples of visualized results for fruit matching in adjacent images using the fruit matching model, where the matched fruits are represented by the bounding box with the same colors, while the single fruits are represented by the white color bounding box.
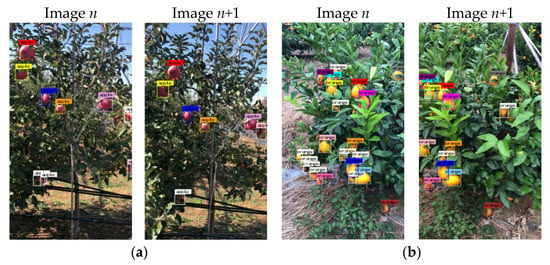
Figure 12.
Examples of fruit matching in adjacent fruit images. (a) Result of fruit matching in adjacent apple images. (b) Result of fruit matching in adjacent orange images.
Table 4 recorded the quantified evaluation results of the fruit matching, while the performance comparison between the DeepCompre model and ours is shown in Figure 13. It can be seen in Table 4 and Figure 13 that the fruit matching model obtained an F1-Score of 0.816 and 0.864 for both apple and orange, with good accuracy, precision, and recall. Comparison with the DeepCompare model, our fruit matching model exhibits better performance than the former. The experimental results demonstrate that the Kuhn–Munkres algorithm in the fruit matching model can significantly improve the recognition power for duplicate fruits.

Table 4.
Quantified evaluation results of the fruit matching model.

Figure 13.
Performance comparison between the fruit matching model and the comparative model. (a) Performance comparison for apples matching. (b) Performance comparison for oranges matching.
3.4. Evaluation of Yield Estimation
In order to observe the performance of the proposed method for the task of fruit yield estimation. Our pipeline was evaluated on 20 apple image sequences (including 910 fruits) and 20 orange image sequences (including 844 fruits) from the test data of the fruit image sequences.
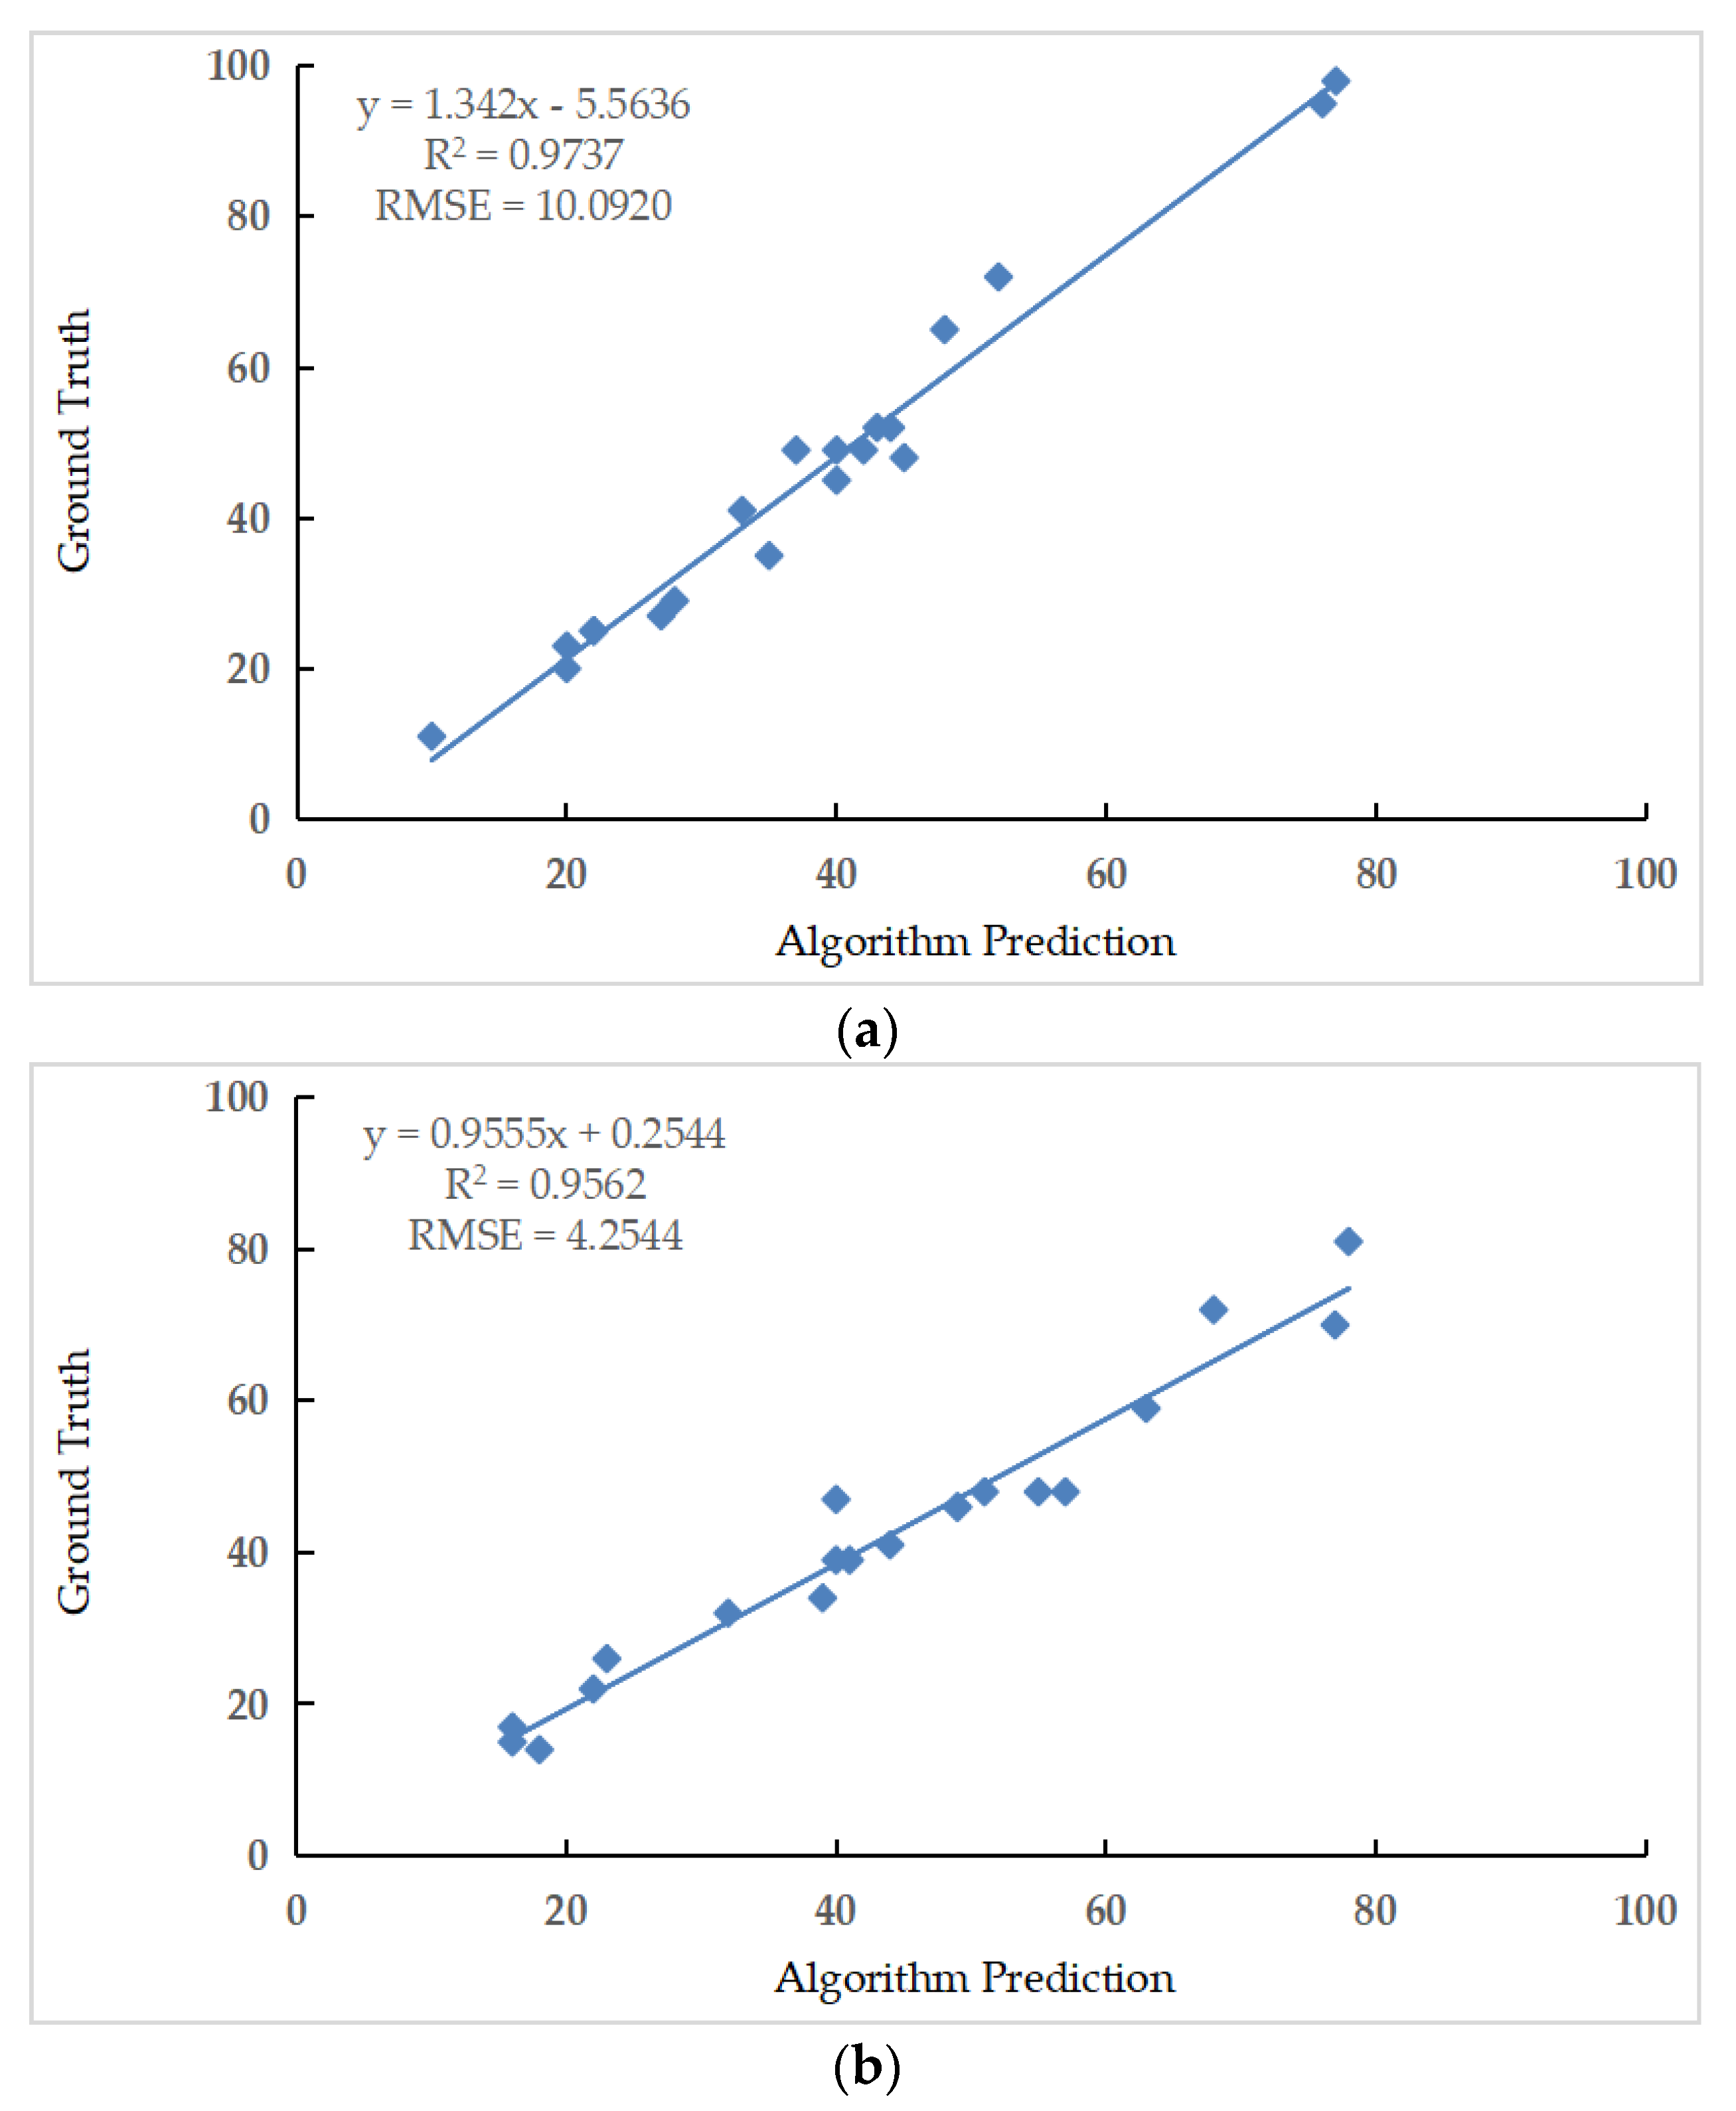
The predicted yields utilized by our method are compared against the ground truth of fruits. Figure 14 shows the linear regression and resulting coefficient of correlation (R2), and the ground truth for both apple and orange are 0.9737 and 0.9562, respectively. The results in Figure 14 demonstrated that the regression line fits well over the data, which means the algorithm predicted yields of the fruits are similar to the ground truth. The root mean square error (RMSE) of yield estimation for apple and orange are 10.0920 and 4.2544, respectively, which proves the reliability of the proposed model in yield estimation for different fruits. The average computational time of test image sequences is 5.33 min per image sequence.
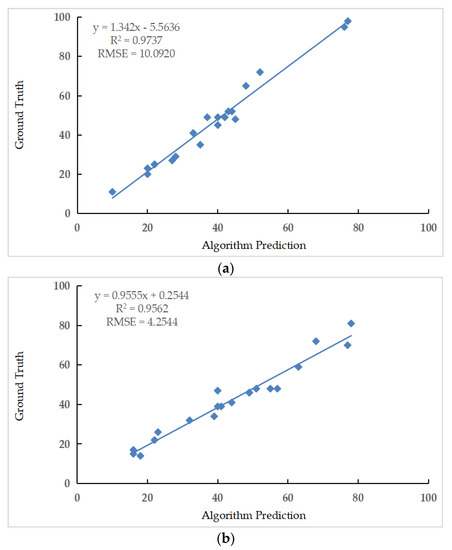
Figure 14.
Performance evaluation of fruit yield estimation. (a) Evaluation results of the apple yield estimation. (b) Evaluation results of the orange yield estimation.
4. Discussion
The information from the fruit yield estimation is valuable for planning fruit cultivation schedules. Faultless fruit counting in successive images is fundamentally important during estimating fruit yield. The deep learning-based method can produce impressive and robust results for fruit yield estimation.
The fine prediction ability of the proposed method for fruit yield estimation benefits from wisely processing the fruit patches jointly by the specific architecture of our pipeline. The evaluation provides an encouraging result for yield estimation using our pipeline. As can be seen from Figure 13, the proposed fruit matching model is significantly better than the reference model in fruit culling. The main reason for this is that the Kuhn–Munkres algorithm can pair fruits one-to-one to achieve the optimal matching of the fruits in adjacent images, helping our model prevent fruits from being double counted, caused by repeat detection in successive images, which leads to better inference results for fruit pair matching and de-duplication.
In fruit yield estimation, fruit detection may be affected by different factors, such as different perspectives, partial occlusion of branches and leaves, and various light conditions. The deep learning algorithm can realize fruit detection through model training in a way that features learning of fruits. However, the training samples cannot cover all the interference cases completely, due to the difficulty of collecting massive amounts of samples in the agricultural environment. In some cases, the model may misjudge some unlearned features of fruits, which leads to low detection confidence and, thereby, affects the final yield estimation. Yet, this effect can be reduced by increasing additional training samples and model improvement. More videos of fruit trees under different conditions need to be collected in different orchards to enrich the training samples. Furthermore, the network can learn more diverse fruit features by introducing the transfer learning technology and improving the network structure, so as to promote the model to be more robust to figure out more fruits that are not easily detected.
To identify the same fruits patches observed repeatedly across the sequential images, we proposed a fruit matching model based on the DeepCompare network that accepts images in the form of grayscale image patches as input to learn the same or similar features of fruits, such that the original image pairs are converted to greyscale before feeding into the network to adapt to the input requirements of the network. Thus, we followed the rules of the model in this study. However, the color information in patch images may contain abundant available information that can promote the model to extract more learnable features for patch matching issues. Thus, further relevant attempts will be made in the subsequent study to optimize the network structure by employing the color information in patch images for superior performance of the fruit matching model.
This study put forward an effective pipeline to culling double counting in the view of single-side for fruit yield estimation. Yet, the fruits may not be detected in the case of yield prediction on the single-side view as the interference of fruit tree morphology, branches and leaves. Thus, a more feasible way is to obtain fruits information on both sides of the trees for better fruit counting. Due to the same fruit may have different phenotypes on different sides, so how to use multiple cameras to collect fruit images on both sides of the trees and combine the local feature similarity of fruits and the global feature similarity among fruits to cull the identical fruits from bilateral perspective will be an important issue to be considered in the follow-up study.
In some poorly managed orchards, trees are planted in arbitrary and unreasonable positions due to the non-standard planting patterns, resulting in sparse distances between trees. Hence, the fruits on the plants of other rows might be included on the image when shooting an image and/or video in orchards, which may alter the correct counting. However, it is observed that fruits in other tree rows appeared smaller in size on the images compared to that of the tree row we photographed. Therefore, a feasible way to solve this problem is that avoid labeling the fruits from other tree rows during the data annotation and adjust the network parameters to train a robust detector that does not consider fruits from other rows as the valid detection targets, so as to acquire the correct counting results. In addition, as orchards increasingly adopt the dense planting mode, this issue will also be ameliorated. In dense planting mode, each row of trees can form the tree wall and block the trees in other rows from the view, which might dramatically reduce the interference of other trees during fruit counting.
In the experiment of fruit yield estimation, our pipeline was evaluated on 20 apple image sequences and 20 orange image sequences from the test data of the fruit image sequences. The average computational time of test image sequences is 5.33 min per image sequence. Due to the experimental data in this research being collected in the field for orchard scene use, the final computational time of counting fruit in the field would be similar to that in the experiment. Although the fruit detection speed is fast enough, the fruit pairing still does not satisfy the requirement of real-time speed, since it needs all patches to be compared against each other in a brute-force way, which would be studied further in future works. The analysis of time efficiency between automatic and manual fruit counting will also be carried out in the following study.
5. Conclusions
The work of this study presented a novel framework for the fruit estimating yield in sequence images. The anchor-free detection architecture (CenterNet) was utilized to detect fruits from each sequence image collected in the apple orchard and orange orchard, then the rectified count of the fruit yield was estimated after double counting removal by using the fruit patching model.
In most cases, the detector successfully maintains the identity of the detected fruits, including apples and oranges. The CenterNet detector achieved a mean Average Precision (mAP) of 0.939, 0.898, and 0.790 at an Intersection over Union (IOU) of 0.5, 0.6, and 0.7, respectively. The proposed fruit matching model was compared with the classical DeepCompare model and the evaluation results demonstrated a prominent improvement in culling duplicate fruits at a fine F1-score of 0.816 and 0.864 for apples and oranges, respectively.
The proposed pipeline was evaluated for the task of fruit yield estimation in sequence images and the prediction counts of fruits have agreed well with the ground truth, resulting in the squared correlation coefficient of R2apple = 0.9737 and R2orange = 0.9562 with sound RMSE for two kinds of fruits.
Although the proposed pipeline is developed for apples and oranges in this research, nothing prevents improving it to promote more potential applications for other crops.
Author Contributions
Conceptualization, X.C.; methodology, X.X. and Z.Z.; data acquisition, Z.Z. and Q.S.; writing—original draft preparation, X.X. and Z.Z.; writing—review and editing, X.C. and N.Z.; supervision, X.C. and T.S. All authors have read and agreed to the published version of the manuscript.
Funding
This research was funded by the National Natural Science Foundation of China (31971792, 61976219), Agricultural Science and Technology Innovation Program of Chinese Academy of Agricultural Sciences (CAAS-GXAAS-XTCX2019026-2, CAAS-ASTIP-2016-AII), and Central Public-interest Scientific Institution Basal Research Fund (Y2020YJ07, JBYW-AII-2021-05, JBYW-AII-2021-29).
Institutional Review Board Statement
Not applicable.
Informed Consent Statement
Not applicable.
Data Availability Statement
Not applicable.
Conflicts of Interest
The authors declare no conflict of interest.
References
- Bellocchio, E.; Costante, G.; Cascianelli, S.; Fravolini, M.L.; Valigi, P. Combining Domain Adaptation and Spatial Consistency for Unseen Fruits Counting: A Quasi-Unsupervised Approach. IEEE Robot. Autom. Lett. 2020, 5, 1079–1086. [Google Scholar] [CrossRef]
- Zine-El-Abidine, M.; Dutagaci, H.; Galopin, G.; Rousseau, D. Assigning Apples to Individual Trees in Dense Orchards Using 3D Colour Point Clouds. Biosyst. Eng. 2021, 209, 30–52. [Google Scholar] [CrossRef]
- Feng, A.; Zhou, J.; Vories, E.D.; Sudduth, K.A.; Zhang, M. Yield Estimation in Cotton Using UAV-Based Multi-Sensor Imagery. Biosyst. Eng. 2020, 193, 101–114. [Google Scholar] [CrossRef]
- Zhang, Z.; Flores, P.; Igathinathane, C.; Naik, L.D.; Kiran, R.; Ransom, J.K. Wheat Lodging Detection from UAS Imagery Using Machine Learning Algorithms. Remote Sens. 2020, 11, 1838. [Google Scholar] [CrossRef]
- Wulfsohn, D.; Zamora, F.A.; Téllez, C.P.; Lagos, I.Z.; García-Fiñana, M. Multilevel Systematic Sampling to Estimate Total Fruit Number for Yield Forecasts. Precis. Agric. 2012, 13, 256–275. [Google Scholar] [CrossRef]
- Xiong, Y.; Ge, Y.; Grimstad, L.; From, P.J. An Autonomous Strawberry-Harvesting Robot: Design, Development, Integration, and Field Evaluation. J. Field Robot. 2020, 37, 202–224. [Google Scholar] [CrossRef] [Green Version]
- Scalisi, A.; McClymont, L.; Underwood, J.; Morton, P.; Scheding, S.; Goodwin, I. Reliability of a Commercial Platform for Estimating Flower Cluster and Fruit Number, Yield, Tree Geometry and Light Interception in Apple Trees under Different Rootstocks and Row Orientations. Comput. Electron. Agric. 2021, 191, 106519. [Google Scholar] [CrossRef]
- Williams, H.; Nejati, M.; Hussein, S.; Penhall, N.; Lim, J.Y.; Jones, M.H.; MacDonald, B. Autonomous Pollination of Individual Kiwifruit Flowers: Toward a Robotic Kiwifruit Pollinator. J. Field Robot. 2020, 37, 246–262. [Google Scholar] [CrossRef]
- Kurtulmus, F.; Lee, W.S.; Vardar, A. Green Citrus Detection Using ‘Eigenfruit’, Color and Circular Gabor Texture Features under Natural Outdoor Conditions. Comput. Electron. Agric. 2011, 78, 140–149. [Google Scholar] [CrossRef]
- Massah, J.; Vakilian, K.A.; Shabanian, M.; Shariatmadari, S.M. Design, Development, and Performance Evaluation of a Robot for Yield Estimation of Kiwifruit. Comput. Electron. Agric. 2021, 185, 106132. [Google Scholar] [CrossRef]
- Zhou, R.; Damerow, L.; Sun, Y.; Blanke, M.M. Using Colour Features of CV. ‘Gala’ Apple Fruits in an Orchard in Image Processing to Predict Yield. Precis. Agric. 2012, 13, 568–580. [Google Scholar] [CrossRef]
- Annamalai, P.; Lee, W.S. Citrus Yield Mapping System Using Machine Vision. In Proceedings of the Annual International Conference of The American Society of Agricultural Engineers, Las Vegas, NV, USA, 27–30 July 2003. [Google Scholar]
- Linker, R.; Cohen, O.; Naor, A. Determination of the Number of Green Apples in RGB Images Recorded in Orchards. Comput. Electron. Agric. 2012, 81, 45–57. [Google Scholar] [CrossRef]
- Dorj, U.O.; Lee, M.; Yun, S.S. An Yield Estimation in Citrus Orchards via Fruit Detection and Counting Using Image Processing. Comput. Electron. Agric. 2017, 140, 103–112. [Google Scholar] [CrossRef]
- Fu, L.; Gao, F.; Wu, J.; Li, R.; Karkee, M.; Zhang, Q. Application of Consumer RGB-D Cameras for Fruit Detection and Localization in Field: A Critical Review. Comput. Electron. Agric. 2020, 177, 105687. [Google Scholar] [CrossRef]
- Gongal, A.; Amatya, S.; Karkee, M.; Zhang, Q.; Lewis, K. Sensors and Systems for Fruit Detection and Localization: A Review. Comput. Electron. Agric. 2015, 116, 8–19. [Google Scholar] [CrossRef]
- Koirala, A.; Walsh, K.B.; Wang, Z.; McCarthy, C. Deep Learning-Method Overview and Review of Use for Fruit Detection and Yield Estimation. Comput. Electron. Agric. 2019, 162, 219–234. [Google Scholar] [CrossRef]
- Sa, I.; Ge, Z.; Dayoub, F.; Upcroft, B.; Perez, T.; McCool, C. DeepFruits: A Fruit Detection System Using Deep Neural Networks. Sensors 2016, 16, 1222. [Google Scholar] [CrossRef] [Green Version]
- Chen, S.W.; Shivakumar, S.S.; Dcunha, S.; Das, J.; Okon, E.; Qu, C.; Taylor, C.J.; Kumar, V. Counting Apples and Oranges with Deep Learning: A Data-Driven Approach. IEEE Robot. Autom. Lett. 2017, 2, 781–788. [Google Scholar] [CrossRef]
- Bargoti, S.; Underwood, J. Deep Fruit Detection in Orchards. In Proceedings of the 2017 IEEE International Conference on Robotics and Automation (ICRA), Singapore, 29 May–3 June 2017; pp. 3626–3633. [Google Scholar]
- Chen, Y.; Lee, W.S.; Gan, H.; Peres, N.; Fraisse, C.; Zhang, Y.; He, Y. Strawberry Yield Prediction Based on a Deep Neural Network Using High-Resolution Aerial Orthoimages. Remote Sens. 2019, 11, 1584. [Google Scholar] [CrossRef] [Green Version]
- Häni, N.; Roy, P.; Isler, V. A Comparative Study of Fruit Detection and Counting Methods for Yield Mapping in Apple Orchards. J. Field Robot. 2020, 37, 263–282. [Google Scholar] [CrossRef] [Green Version]
- Kestur, R.; Meduri, A.; Narasipura, O. MangoNet: A Deep Semantic Segmentation Architecture for a Method to Detect and Count Mangoes in an Open Orchard. Eng. Appl. Artif. Intell. 2019, 77, 59–69. [Google Scholar] [CrossRef]
- Behera, S.K.; Rath, A.K.; Sethy, P.K. Fruits Yield Estimation Using Faster R-CNN with MIoU. Multimed. Tools Appl. 2021, 80, 19043–19056. [Google Scholar] [CrossRef]
- Zhou, Z.; Song, Z.; Fu, L.; Gao, F.; Li, R.; Cui, Y. Real-Time Kiwifruit Detection in Orchard Using Deep Learning on Android™ Smartphones for Yield Estimation. Comput. Electron. Agric. 2020, 179, 105856. [Google Scholar] [CrossRef]
- Anderson, N.T.; Underwood, J.P.; Rahman, M.M.; Robson, A.; Walsh, K.B. Estimation of Fruit Load in Mango Orchards: Tree Sampling Considerations and Use of Machine Vision and Satellite Imagery. Precis. Agric. 2019, 20, 823–839. [Google Scholar] [CrossRef]
- Bellocchio, E.; Ciarfuglia, T.A.; Costante, G.; Valigi, P. Weakly Supervised Fruit Counting for Yield Estimation Using Spatial Consistency. IEEE Robot. Autom. Let. 2019, 4, 2348–2355. [Google Scholar] [CrossRef]
- Marino, S.; Beauseroy, P.; Smolarz, A. Weakly-supervised learning approach for potato defects segmentation. Eng. Appl. Artif. Intell. 2019, 85, 337–346. [Google Scholar] [CrossRef]
- Bellocchio, E.; Crocetti, F.; Costante, G.; Fravolini, M.L.; Valigi, P. A Novel Vision-Based Weakly Supervised Framework for Autonomous Yield Estimation in Agricultural Applications. Eng. Appl. Artif. Intell. 2022, 109, 104615. [Google Scholar] [CrossRef]
- Zhang, Q.; Liu, Y.; Gong, C.; Chen, Y.; Yu, H. Applications of Deep Learning for Dense Scenes Analysis in Agriculture: A Review. Sensors 2020, 20, 1520. [Google Scholar] [CrossRef] [Green Version]
- Duan, K.; Bai, S.; Xie, L.; Qi, H.; Huang, Q.; Tian, Q. Centernet: Keypoint Triplets for Object Detection. In Proceedings of the IEEE/CVF International Conference on Computer Vision, Seoul, Korea, 27 October–2 November 2019; pp. 6569–6578. [Google Scholar]
- Law, H.; Deng, J. Cornernet: Detecting Objects as Paired Keypoints. In Proceedings of the European Conference on Computer Vision (ECCV), Munich, Germany, 8–14 September 2018; pp. 734–750. [Google Scholar]
- Wang, D.; Zhang, N.; Sun, X.; Zhang, P.; Zhang, C.; Cao, Y.; Liu, B. AFP-Net: Realtime Anchor-Free Polyp Detection in Colonoscopy. In Proceedings of the 2019 IEEE 31st International Conference on Tools with Artificial Intelligence (ICTAI), Portland, OR, USA, 4–6 November 2019; IEEE: Manhattan, NY, USA, 2019; pp. 636–643. [Google Scholar]
- Zhou, X.; Zhuo, J.; Krahenbuhl, P. Bottom-up Object Detection by Grouping Extreme and Center Points. In Proceedings of the IEEE Conference on Computer Vision and Pattern Recognition, Long Beach, CA, USA, 16–20 June 2019; pp. 850–859. [Google Scholar]
- Zhou, X.; Wang, D.; Krahenbuhl, P. Objects as Points. arXiv 2019, arXiv:1904.07850. [Google Scholar]
- Tan, C.; Li, C.; He, D.; Song, H. Anchor-Free Deep Convolutional Neural Network for Plant and Plant Organ Detection and Counting. In Proceedings of the 2021 ASABE Annual International Virtual Meeting, Online, 12–16 July 2021. [Google Scholar]
- Zhao, K.; Yan, W. Fruit Detection from Digital Images Using CenterNet. Geom. Vis. 2021, 1386, 313–326. [Google Scholar]
- Xia, X.; Sun, Q.; Shi, X.; Chai, X. Apple Detection Model Based on Lightweight Anchor-Free Deep Convolutional Neural Network. Smart Agric. 2020, 2, 99. [Google Scholar]
- Hughes, L.H.; Schmitt, M.; Zhu, X.X. Mining Hard Negative Samples for SAR-Optical Image Matching Using Generative Adversarial Networks. Remote Sens. 2018, 10, 1552. [Google Scholar] [CrossRef] [Green Version]
- Lee, W.; Sim, D.; Oh, S.J. A CNN-Based High-Accuracy Registration for Remote Sensing Images. Remote Sens. 2021, 13, 1482. [Google Scholar] [CrossRef]
- Liu, W.; Shen, X.; Wang, C.; Zhang, Z.; Wen, C.; Li, J. H-Net: Neural Network for Cross-domain Image Patch Matchin. In Proceedings of the IJCAI—2018 International Joint Conference on Artificial Intelligence, Stockholm, Sweden, 13–19 July 2018; pp. 856–863. [Google Scholar]
- Zagoruyko, S.; Komodakis, N. Learning to Compare Image Patches via Convolutional Neural Networks. In Proceedings of the IEEE Conference on Computer Vision and Pattern Recognition, Boston, MA, USA, 7–12 June 2015; pp. 4353–4361. [Google Scholar]
- Han, X.; Leung, T.; Jia, Y.; Sukthankar, R.; Berg, A.C. Matchnet: Unifying Feature and Metric Learning for Patch-Based Matching. In Proceedings of the IEEE Conference on Computer Vision and Pattern Recognition, Boston, MA, USA, 7–12 June 2015; pp. 3279–3286. [Google Scholar]
- Zagoruyko, S.; Komodakis, N. Deep Compare: A Study on Using Convolutional Neural Networks to Compare Image Patches. Comput. Vis. Image Und. 2017, 164, 38–55. [Google Scholar] [CrossRef]
- Santos, T.T.; de Souza, L.L.; dos Santos, A.A.; Avila, S. Grape Detection, Segmentation, and Tracking Using Deep Neural Networks and Three-Dimensional Association. Comput. Electron. Agric. 2020, 170, 105247. [Google Scholar] [CrossRef] [Green Version]
- Dai, Z.; Yi, J.; Jiang, L.; Yang, S.; Huang, X. Cascade CenterNet: Robust Object Detection for Power Line Surveillance. IEEE Access 2021, 9, 60244–60257. [Google Scholar] [CrossRef]
- Schonberger, J.L.; Hardmeier, H.; Sattler, T.; Pollefeys, M. Comparative Evaluation of Hand-Crafted and Learned Local Features. In Proceedings of the IEEE Conference on Computer Vision and Pattern Recognition, Honolulu, HI, USA, 21–26 July 2017; pp. 1482–1491. [Google Scholar]
- Ma, J.; Jiang, X.; Fan, A.; Jiang, J.; Yan, J. Image Matching from Handcrafted to Deep Features: A Survey. Int. J. Comput. Vis. 2021, 129, 23–79. [Google Scholar] [CrossRef]
- Kuhn, H.W. Variants of the Hungarian Method for Assignment Problems. Nav. Res. Logis. Q. 1956, 3, 253–258. [Google Scholar] [CrossRef]
- Munkres, J. Algorithms for the Assignment and Transportation Problems. J. Soc. Ind. Appl. Math. 1957, 5, 32–38. [Google Scholar] [CrossRef] [Green Version]
- Wang, X.; Tan, G.; Dai, Y.; Lu, F.; Zhao, J. An Optimal Guidance Strategy for Moving-Target Interception by a Multirotor Unmanned Aerial Vehicle Swarm. IEEE Access 2020, 8, 121650–121664. [Google Scholar] [CrossRef]
- Xu, Z.; Yuan, G.Z.; Wang, X.D.; Quan, X.S.; Ren, T.Q.; Liu, J.S. Kuhn–Munkres Algorithm-Based Matching Method and Automatic Device for Tiny Magnetic Steel Pair. Micromachines 2021, 12, 316. [Google Scholar] [CrossRef] [PubMed]
- Stein, M.; Bargoti, S.; Underwood, J. Image Based Mango Fruit Detection, Localisation and Yield Estimation Using Multiple View Geometry. Sensors 2016, 16, 1915. [Google Scholar] [CrossRef] [PubMed]
- Vasconez, J.P.; Delpiano, J.; Vougioukas, S.; Cheein, F.A. Comparison of Convolutional Neural Networks in Fruit Detection and Counting: A Comprehensive Evaluation. Comput. Electron. Agric. 2020, 173, 105348. [Google Scholar] [CrossRef]
- Koirala, A.; Walsh, K.B.; Wang, Z.; Anderson, N. Deep Learning for Mango (Mangifera indica) Panicle Stage Classification. Agronomy 2020, 10, 143. [Google Scholar] [CrossRef] [Green Version]
- Gao, F.; Yang, T.; Fu, L. Apple Fruit Detection and Counting Based on Deep Learning and Trunk Tracking. In Proceedings of the 2021 ASABE Annual International Virtual Meeting, Online, 12–16 July 2021. [Google Scholar]
Publisher’s Note: MDPI stays neutral with regard to jurisdictional claims in published maps and institutional affiliations. |
© 2022 by the authors. Licensee MDPI, Basel, Switzerland. This article is an open access article distributed under the terms and conditions of the Creative Commons Attribution (CC BY) license (https://creativecommons.org/licenses/by/4.0/).

