Article

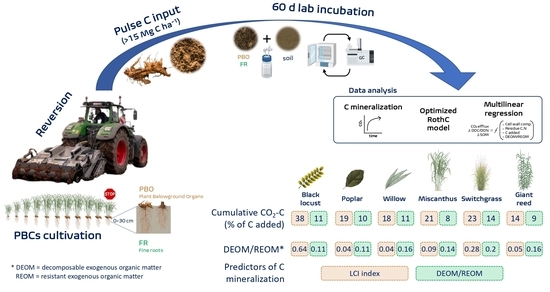
Short-Term Mineralization of Belowground Biomass of Perennial Biomass Crops after Reversion to Arable Land

1
Department of Sustainable Crop Production, Università Cattolica del Sacro Cuore, Via Emilia Parmense, 84, 29122 Piacenza, Italy
2
CREA—Centro di Ricerca Viticoltura ed Enologia, Via Trieste 23, 34170 Gorizia, Italy
*
Author to whom correspondence should be addressed.
Agronomy 2022, 12(2), 485; https://doi.org/10.3390/agronomy12020485
Submission received: 22 December 2021 / Revised: 11 February 2022 / Accepted: 14 February 2022 / Published: 15 February 2022
(This article belongs to the Topic Plant-Soil Interactions)

Abstract

:
Little is known about the effect of perennial biomass crops (PBCs) removal on soil C dynamics. The belowground biomass (BGB) that is composed by plant belowground organs (PBO) such as rhizomes in the herbaceous PBCs and stumps in woody PBCs should be considered, together with fine roots (FR), as a huge input of exogenous organic matter (EOM) that is incorporated into the soil at the reversion. In this study, we mimic the incorporation of BGB of PBCs through a soil-residues incubation under controlled conditions to investigate the effects of adding FR and PBO (at real field rates) on soil C and N mineralization dynamics, and to understand decomposition controlling factors. A modified RothC model version, encompassing a better description of decomposable (DEOM) and resistant (REOM) pools, was fitted to C mineralization curves of respiration measured by CO2 evolution in incubated soil to quantify partitioning factors and decomposition rates of PBCs BGB components. After 1 month, PBO showed higher mineralization rates (498 µg CO2-C gsoil−1) than FR (196 µg CO2-C gsoil−1), with black locust having the highest amount of C respired (38% of added C). The emission peak occurred within 3 days from the beginning of the experiment for PBO and after 1 day for FR. Generally, according to the modified version of RothC model, PBO had higher proportion of REOM than FR, except for black locust. The decomposition constant rates from the optimized RothC model were higher for PBO (kDEOM: 20.9 y−1, kREOM: 12.1 y−1) than FR (kDEOM: 0.4 y−1, kREOM: 0.1 y−1), indicating that FR are less decomposable than PBO. The C/N ratio is not the main controlling factor of decomposition when residue N is not a limiting factor, while the availability of easily decomposable substrates (DEOM/REOM ratio) and cell-wall composition decomposition is a strong predictor of C and N mineralization of these EOM types. The explicit inclusion of crop-specific DEOM/REOM ratios within RothC or a similar soil C model will help to improve the predictions of long-term C sequestration trajectories (half-life > 30 years) associated with PBCs cultivation, especially when dismission of such perennial cropping systems is addressed.

Graphical Abstract

1. Introduction

Perennial biomass crops (PBCs) are low-input crops with the potential to mitigate climate change by sequestering soil organic carbon (SOC) [1,2] and to sustain the provision of multiple ecosystem services [3,4,5]. However, crop yield of PBCs tends to decrease after 15–20 years [6,7], and for their economic sustainability it would be profitable to end their cultivation and convert the soil to the cultivation of annual crops. A consistent body of knowledge has been produced on the soil C sequestration rate of PBCs during their cultivation [8,9]. Nonetheless, there are few field experiments reporting the effect of PBCs removal on soil C and nutrients cycling [7,10,11,12,13,14].
Conserving C and nutrients locked up into soil organic matter (SOM) during the cultivation phase is a priority in perennial cropping systems being reconverted to arable land. PBCs can store huge amounts of C in belowground biomass (BGB) that is incorporated into the soil at the reversion [2,15]. BGB of PBCs is represented by plant belowground organs (PBO), such as rhizomes and/or stumps and fine roots (FR). Martani et al. [2] reported, for example, that C sequestered in BGB (18 Mg C ha−1) after 11 y in 0–30 cm soil layer by BGB is almost two times higher than the amount of C sequestered in soil. The fate of this C pool after reversion and its impact on SOC-cycling after reversion are still unknown. Concerns exist, that the reversion can lead to a fast decrease in soil quality [16], offsetting at least partially the climate benefits of PBCs [9], but the pulse incorporation of BGB in soil has the potential to save C after the reversion [2]. The effect of BGB incorporation on SOC trajectories largely depends on the removal method and the management of the following land use. To favor a rapid establishment of the annual crop the year of reversion, BGB is mechanically ground by means of a tiller to facilitate seedbed preparation and devitalize PBO organs. BGB incorporated into soil at the reversion with such an option enters the upper soil layers mainly as light fraction organic matter (LFOM) [10]. The SOM decomposition rate may undergo an increase after high and pulse fresh organic matter input to soil [17] from plant residues at reversion. How soil microbial biomass (SMB) size and activity (CO2 respiration) respond to the addition of LFOM (quantity and quality) determines the trajectory of positive or negative priming effect on SOM. The question on how to manage this new C input in the system is similar to that raised by Janzen et al. [18]: “Shall we hoard it or use it?”. If, during cultivation, the unintended climate goal was to accumulate C (“hoard it”), after reversion it might be swinging towards the “use it” tactic. Zhu et al. [19] recently proposed the concept of the soil microbial carbon pump (MCP), which emphasizes the active role of soil microbes in SOM storage. Flow of C (in terms of quantity and quality) through the soil drives soil multifunctionality [20,21], and ultimately supports microbially-mediated SOM formation [22,23].
The chemical composition of BGB residues plays a key role in determining the impact of C mineralization of SOM dynamics. To study the different chemical properties of plants residues, Abiven et al. [24] suggested separately considering different parts of plants for a better understanding of C and nitrogen (N) mineralization in decomposition studies. The study of C mineralization of BGB of PBCs after reversion is important but is hampered in open-field conditions by the large variability, due to the different sizes of residues following the mechanical shredding and even distribution of fragments into the soil. Soil incubation in the laboratory may overcome this difficulty by assuring homogeneous incorporation of BGB inputs into the soil [25] and standardizing other factors (humidity, temperature and residues size). Respiratory curves after addition of exogenous organic matter (EOM) can be a useful approach to characterize mineralization kinetics of PBCs residues at reversion. A recent incubation study on several EOM materials differing in chemical quality [26] showed how a modified version of the RothC model can explicitly simulate the C dynamics of the decomposable (DEOM), resistant (REOM) and humified (HEOM) EOM pools. To date, no data useful for soil C model were reported on the mineralization rate of BGB residues of PBCs and on partitioning factor of organic matter pools. From a management perspective, this information becomes crucial in the understanding of how quantity and quality of BGB residues of PBCs influence where the removal of PBCs promote mineralization or stabilization of SOM. From a modeling point of view, alternatively, these data may ultimately lead to a finer parametrization of soil C models that address explicitly the removal of PBCs within targeted crop rotation schemes. To address these research gaps, in the present study, we aimed to (1) mimic, under laboratory-controlled conditions, the effects of the reversion of six different PBCs on soil C cycling by studying the C mineralization dynamics of their different BGB components and (2) characterize EOM residues quality (partitioning factors and decomposition rates) to understand their impact on SOM dynamics.

2. Materials and Methods

2.1. Source of BGB Residues for Incubation

BGB residues for incubation were obtained before the reversion of a 11-y old multispecies field trial hosting six different PBCs: giant reed (Arundo donax L.), switchgrass (Panicum virgatum), miscanthus (Miscanthus x giganteus L.), poplar (Populus spp.), willow (Salix spp.) and black locust (Robinia pseudoacacia spp.). A detailed description of the field experiment is provided by Amaducci et al. [27] and Ferrarini et al. [5]. The experimental field trial is located in Gariga di Podenzano, Piacenza, NW Italy (44°58048″ N, 9°41009″ E). BGB sampling has been performed by Martani et al. [2]. In brief, PBO (rhizomes of herbaceous crops and stumps of woody crops) were excavated from the soil with a digger to a depth of 30 cm. Once excavated from the soil, samples were hand washed to remove any soil and weighted. A sub-sample was oven-dried at 65° until constant weight, then, ground and sieved at 2 mm for incubation and chemical analysis. Samples of FR biomass were collected at a depth of 0–100 cm pressing, with the hydraulic arm of a digger, a self-constructed ‘Shelby’ tube sampler of 7 cm diameter [28]. To separate FR from soil, samples were put in oxalic acid (2%) for 2 h, and then washed in a hydraulic sieving-centrifuge device [29]. Once cleaned, FR were hand-picked from the water using a 2-mm mesh sieve, oven-dried at 65 °C until constant weight.

2.2. Characterization of EOM Used in the Incubation

In total, twelve EOM were used for the incubation experiment, representative of two different BGB components (FR and PBO) of six different PBCs species (Table 1). FR and PBO samples were weighted and analysed by Dumas combustion method, with a CN elemental analyser, to determine C and N concentration (VarioMax CNS, Elementar, Germany). The cellulose, hemicellulose and lignin contents of the FR and PBO were determined according to the Van Soest method [30] with a AnkomII Fiber Analyzer (Ankom Technology Corporation, Fairport, NY, USA). The Lignocellulose index (LCI) was calculated as the ratio between Lignin content and Lignin + Cellulose content. The Water-Soluble Carbon (WSC), Water-Soluble Nitrogen (WSN) and mineral N content in biomass were quantified after extraction of 5 g of dry biomass with 100 mL of nano-pure water for one hour, filtration with a 0.4 μm glass-microfiber filter and then determined using a TOC–TN analyser (TOC-VCSN Shimadzu). PBO were considerably different from FR, according to their chemical (Table 2) and cell wall composition (Table 3). All of the EOM have an acid pH (4–5), while total organic carbon (TOC) concentration ranged between 29% and 44%. N concentration in PBO varied between 0.4% and 2.1%, with black locust, that is of the Leguminosae family, having the highest values. Generally, stump and FR of woody PBCs had higher WSC and WSN than rhizomes and FR of herbaceous PBCs, while FR had a higher concentration of mineral N (NO3 and NH4+) than PBO. FR had higher ash content than PBO, while PBO had higher cellulose content (Table 3).

2.3. Incubation Experiment

2.3.1. Soil Used in the Incubation Experiment

The soil used for the incubation experiments was sampled from the arable land beside the experimental field trial described above, where the annual crop rotation had continued. We chose this soil as control soil to avoid crop-specific legacy effect of SOM contents. The soil was sampled to a depth of 30 cm with a self-constructed ‘Shelby’ tube sampler of 7 cm diameter [28], and several subsamples were pooled together to obtain a representative sample. The location and main physicochemical characteristics of the soils are reported in Table 1. Soil was air-dried, sieved at 2 mm and stored at room temperature until the beginning of the experiments. Before the start of the trials, the soil was preconditioned by incubation under aerobic conditions for 7 days at the same temperature and water content was adopted for the experiments and set to a pre-defined value that was 20 °C in temperature and 40% of the water holding capacity (WHC).

2.3.2. Soil Incubation Experiment and CO2 Measurement

PBO were added at a dose equivalent to the amount that was measured in the field eleven years after establishment [2]. In the case of PBO, the addition rate was calculated according to the amount that was measured before PBCs reversion. The amount of PBO added ranged from 1541 (switchgrass) to 5534 (giant reed) µg C g−1 of soil (Table S1). The highest amount of C added among woody PBCs was for black locust (4161 µg C g−1 of soil). In the case of FR, this approach was not feasible as this would have implied the addition of an amount of residue too low to assure the precision of the weighing, the homogeneous mixing with the soil and the repeatability of the measured CO2 emissions. Therefore, for FR we chose an identical rate, equivalent to the amount of FR residues measured in field conditions for switchgrass, which was the crop with the larger amount of FR (5543 µg Cg−1). Overall, the C added to soil (sum of PBO and FR) was 5574, 4789, 5008, 6031, 3653, 7546 µg Cg−1, respectively, for black locust, poplar, willow, miscanthus, switchgrass and giant reed. Each PBCs EOM was replicated 3 times (n = 3) in the experiment. PBO and FR were incubated at 20 °C, respectively, for 2 and 1 months in the laboratory by means of an automated chromatographic system (Figure 1a). The system is described in Mondini et al. [31]. The system operates continuously, and the sampling frequency for CO2 content determination of each sample is every 6 h.

2.3.3. Soil C and N analysis

SOM was quantified at the beginning and the end of the incubation experiment on 2 g air-dried samples through loss-of-ignition at 550 °C for 2 h (constant weight) with a thermogravimetric analyzer (LECO TGA 601). Dissolved organic carbon (DOC) and nitrogen (DON) contents were quantified on soil samples after extraction with potassium sulphate (K2SO4) 0.05 M, then immediately filtered (0.45 μm cellulose acetate) and kept at 4 °C until analysis. DOC and DON were measured using a TOC–TN analyzer (TOC-VCSN Shimadzu).

2.4. Estimation of RothC EOM Pool Parameters

Soil respiration curves of incubated soils were used to derive EOM pool parameters of the RothC model, specifically modified for SOC modeling in amended soil by Mondini et al. [26] (Figure 1b). In brief, the standard RothC model, involving C input to the soil only as decomposable (DPM) or resistant (RPM) plant material, was modified by introducing additional pools of decomposable (DEOM) and resistant (REOM) EOM. The partitioning factors (fDEOM, fREOM) and decomposition rates (KDEOM, KREOM) of the additional EOM pools were estimated by model fitting to the respiratory curves of incubated soils (Figure 1b). Fitting was obtained using an Excel version of the modified model by changing the individual EOM pool parameters in a stepwise iteration using the ExcelSolver function with Newton’s method [32] until the maximum agreement between the measured and simulated values of CO2 was achieved, assuming as a criterion, the smallest sum of squared residuals (SSR). The four parameters were optimized simultaneously, considering the following constraints, to avoid biologically unrealistic parameter estimates:
(1)
fDEOM + fREOM = 1
(2)
kREOM > 0.02 yr1
The minimum KREOM value was set at 0.02 yr−1 to avoid unrealistic values according to the RothC decomposition rate of the humic substances pool, with the assumption that the decomposition ratio of residues cannot be lower than that of humic substances in soil.

2.5. Statistical Analysis

All statistical analyses were performed with R statistical software (version 3.6.2) [33]. Cumulative CO2 emissions (as µg CO2-C g−1 and % of added C) were analysed singularly for EOM type using a two-way ANOVA for crop and DoI (days of incubation) effects. Changes in soil DOC and DON (as µg C, N g−1 and % of added C,N) and DEOM/REOM ratio were analysed using a one-way ANOVA for crop effect within EOM types. Means were separated using Tukey’s honestly significant difference (α = 0.05). Log transformations were performed to satisfy assumptions of normality and heteroskedasticity when needed. A stepwise, multiple-linear regressions analysis was applied separately to EOM types (PBO and FR) to discriminate and rank the most important EOM variables in explaining the soil C and N mineralization variables (absolute and relative values of C respired as CO2, ΔDOC, ΔDON and ΔSOM as the difference of DOC, DON, SOM in soil from EOM mineralization). The following EOM group of variables were explored as predictors: EOM quality (C/N ratio, N content), EOM quantity (C and N added as EOM), DEOM/REOM ratio and EOM cell wall composition (ash, soluble, hemicellulose, cellulose, lignin, Lignin/N ratio and LCI index). Best AIC models were selected and the relative importance of the chosen predictors in the linear model (% of total R2 of the model) was estimated with the “relaimpo” package [34]. The breakdown of the model R2 into the relative importance metrics was undertaken with the lmg method, while the significance of the differences between the predictors’ relative importance (Bonferroni p < 0.05) was calculated with the bootstrap function (1000 samples).

3. Results

3.1. Stumps and Rhizomes C and N Mineralization

After 60 days of incubation, the amount of C mineralized from PBO added to soil ranged from 356 µg C g−1 of switchgrass to 1402 µg C g−1 of black locust (Table S1). The amount of C remaining in the soil after 60 days of incubation of soil incubated with PBO ranged from 1186 µg C g−1 of switchgrass to 4799 µg C g−1 of giant reed (Table S1). The cumulative amount of CO2-C mineralized from PBO after 60 days of incubation was on average 24.2% ranging from 13.8% in the case of giant reed to 38.2% in the case of black locust (Figure 2a and Figure 3a). Cumulatively black locust respired significantly 2.8 times more than giant reed (Figure 3a and Table S2). After 30 days of incubation, cumulative respiration as a percentage of added C was on average 14.9%, ranging from 8.8% in the case of giant reed to 29.4% in the case of black locust (Figure 3b). After 30 days of incubation, the PBO respiration rate of black locust was significantly 3.3 times higher than the one of giant reed (Table S2). Giant reed, willow and poplar had the lowest cumulative amount of respired CO2 compared to the amount of added C (Figure 3b). The dynamics of mineralization rate of PBO showed a very distinct pattern: black locust showed a sharp peak after about 7 h followed by a steady decrease and by a further lower, but broader, peak with a maximum reached after about 3 days (Figure 3a). Successively, mineralization slowly decreased but always presented significantly higher figures than the PBO of other PBCs (Figure 2a). Differently from black locust, giant reed, miscanthus and poplar had only an initial peak reached within the first day of incubation followed by a steady decrease (Figure 2a). Giant reed had a maximum respiration rate that was significantly higher than miscanthus and poplar, but also showed successively a more pronounced decrease, reaching lower values at the end of the incubation than the other two crop residues. Finally, switchgrass and willow showed a constant decrease from the start to the end of the incubation period (Figure 2a).
The addition of PBO to soil caused an increase in the DOC ranging from 5 to 40 µg g−1 (Figure 3e,f and Tables S2 and S3). On average, with PBO addition, DOC increased by 0.44% of C added (Figure 3f). Giant reed, black locust and miscanthus showed the significantly highest DOC increases compared to control (Figure 3e and Tables S2 and S3). The addition of PBO to soil resulted in a generalized decrease in DON at the end of incubation with respect to the control (Figure 3g,h and Tables S2 and S3). Net N immobilization was significantly lower for black locust (−6.3 µg N g−1 and 3.5% of added N), while for the remaining PBCs, it was on average at −25.5 µg N g−1 (Figure 3g) with an immobilization of 55% of added N (Figure 3h and Tables S2 and S3).

3.2. Fine Roots C and N Mineralization

Cumulative C mineralization of FR as a percentage of added C was on average 10.5% (range 7.9–14) (Figure 3c,d). Switchgrass showed the significantly highest cumulative C mineralization (295 µg CO2-C g−1) compared to the other PBCs (176 µg CO2-C g−1). The amount of added C remaining at the end of the incubation (30 days), for a dose of application of 5.5 mg DM g−1, ranged from 1506 to 1816 µg g−1 for poplar and switchgrass, respectively (Table S1). The dynamics of mineralization was characterized for FR of all PBCs by an immediate increase in the rate of CO2 emissions that reached its maximum about 1 day after residue addition (Figure 2b). The maximum respiration rate varied largely depending on the residue with higher and lower values recorded for switchgrass and poplar, respectively. Afterwards, the rate of respiration slowly decreased until the end of the incubation (Figure 2b). An exception to this general behavior was represented by switchgrass that showed a second lower and very broad peak of respiration rate occurring between days 5 and 12 of the incubation (data not shown).
The addition of FR resulted in a general increase in DOC at the end of incubation ranging from 3 µg C g−1 of willow to 14 µg C g−1 for black locust (Figure 3e) with respect to the control. On average, DOC with FR addition increased 0.43% of added C (Figure 3f). The addition of FR had, instead, after 30 days of incubation, an opposite effect on DON between black locust (N release) and other PBCs (N immobilization) (Figure 3g). In the case of the black locust, there was a significant increase of 8 µg N g−1 with respect to the control. Poplar, giant reed, miscanthus and willow showed values similar to the control, while in the case of switchgrass, DON content significantly decreased of 10 µg N g−1 (−27% of added N) respect to the control.

3.3. Pool Size and Decomposition Rates of EOM Types

The fitting procedure with the modified RothC model was applied to all the EOM types to calculate partitioning factors (f) and decomposition constant rate (k) of decomposable (DEOM) and resistant (REOM) pool from the respiration curve of the incubation experiment (Figure 4, Table S4).
On average fREOM and fDEOM values were, respectively, 0.14 and 0.87 for PBO and 0.13 and 0.86 for FR. No differences were found among EOM types for partitioning factor (f) for DEOM and REOM expect for switchgrass and black locust, which resulted in the PBCs with the highest fDEOM, respectively, of 0.22 and 0.39. Mean values of DEOM/REOM ratio for PBO (0.06) and FR (0.15) were significantly different if from the average are excluded the PBO values of black locust (0.64) and switchgrass (0.28) which are the PBCs with the highest proportion of DEOM.
The average decomposition rate of PBO for DEOM and REOM pools were, respectively, 20.9 and 0.39 yr−1, while FR instead showed lower kDEOM and kREOM, respectively, of 12.1 and 0.1 yr−1. In particular, among PBO the highest time constants (lowest kDEOM) were shown by poplar’s stumps (30.9 yr−1) and miscanthus’ rhizome (41.9 yr−1), while the lowest time constants (highest kDEOM) were shown by black locust’s stumps (7.9 yr−1) and switchgrass’s rhizomes (5.9 yr−1). Decomposition constant rate for decomposable pool (kREOM) for FR did not show differences among PBCs. Interestingly, decomposition rates of REOM (KREOM) were significantly higher for PBO of all PBCs than for FR except for black locust (KREOM: 0.21 yr−1).

3.4. Modeling C and N Mineralization of EOM Types Using Multiple Linear Regression Models

We investigated the linear relationships between C and N mineralization of EOM types (PBO and FR) and their corresponding array values by a series of linear regression analyses. Single linear regression models were built considering one C or N mineralization variable at a time as the dependent variable and single parameters of EOM quality, EOM quantity, DEOM/REOM ratio or cell wall composition as the independent variables. Five significant models with multiple predictors were predicted either for PBO and FR (Table 4). In most of the cases, the multiple regression models showed high adjusted R2 values and low residual standard error values. Overall model prediction results shows that soil CO2 efflux has different predictors than C and N soil variables either for PBO and FR (Table 4). Within the multiple predictors’ variables identified in C mineralization models for PBO, the most significant were the LCI index and DEOM/REOM ratio, while for FR the DEOM/REOM ratio. C added as FR was a significant predictor only in describing variations of DOC and SOM with PBO addition. C/N ratio was a significant predictor of DON and SOM variations when FR are added to the soil.

4. Discussion

4.1. C and N Mineralization of BGB Residues during Reversion

It was assumed that belowground biomass incorporation did not cause priming effect (PE) or similar PE among plant belowground organs (PBO) and fine roots (FR). As whole mineralization was low for both materials, but with PBO showing on average a 50% higher cumulative mineralization than FR (Figure 2).
The amount of EOM applied to the soil ranged from 3653 µg C g−1 in the case of switchgrass to 7547 µg C g−1 in the case of giant reed (Table S1). These residues-C inputs values may be considered either valuable (they are on the top C-input ranking among perennial cropping systems [35]) or interesting, as they can depict new relationships between SOC sequestration and C input at reversion. This C input, if entering the soil as LFOM, may positively affect the soil C accrual, even after PBCs cultivation has ceased as shown by a recent meta-analysis [36].
PBO contributed on average 80–90% of added C, with the only exception being switchgrass, which presented a larger added C contribution by FR (56%) than PBO (44%), a result that is confirmed by Martani et al. [2]. The initial differences in added C among different plants could be exacerbated by differences in the decomposition rate of residues. In this study, black locust and poplar showed the maximum and minimum rate of soil decomposition of total added C (PBO + FR), with 24.4% and 5.4% of added C lost as CO2 after 30 days of incubation, respectively. PBO and FR of switchgrass had very distinct dynamics of mineralization: FR presented the higher rates of CO2 emissions, while PBO always showed the lower values of mineralization rate among all the EOM considered (Figure 2). The added C remaining in the soil after 30 days from incorporation ranged from 3112 µg C g−1 in the case of switchgrass to 5735 µg C g−1 in the case of giant reed, corresponding to an increase in C content of 0.31% and 0.57% (12.8 and 23.6 Mg C ha−1). Consequently, the contribution of these two crops to SOC differed more than 2 times. These results identify the existence of a significant crop legacy effect on SOC accrual after reversion to arable land. To date, this is the first study that identifies and provides data for multiple species on the contribution of PBO, such as stumps and rhizomes, to SOC sequestration. Considering an initial low SOC content in the soil of the site (0.8% and 32 t C ha−1 in the 0–30 cm layer [2], PBC reversion makes a substantial contribution to SOC change with an average PBO-C reversion to SOC rate of 40%.
To design positive soil C sequestration trajectories in cropping systems, it is fundamental to disentangle the effect of level (quantity) and type (quality) of C residues input on SOM stabilization [37,38]. The results of this study showed how C mineralization of PBO is more affected by cell wall composition (LCI index), but inversely SOM increase is more affected by C quantity (Table 4). C mineralization of decomposing recalcitrant residues has been already described to be mainly controlled by biochemical quality [39,40]. Interestingly, after grinding into the soil crop residues such as PBO, our data showed a linear relationship between C added and SOM increase. Newly generated SOM with PBO addition suggests that SOM stabilization did not decrease with increasing addition levels, as found by Shahbaz et al. [38]. This is in agreement with the findings of Kong et al. [35] on the cropping systems that have been implemented on soils with low SOC content, namely the soil did not reach an upper limit of saturation for soil C.
The FR contribution to the total C remaining in the soil after 30 days of incubation varied largely from 9.7% for poplar to 58.4% for switchgrass. These data confirm the importance that FR can have in the maintenance of SOC stocks due to the generally low rate of decomposition [2,9,41]. At the end of incubation, the addition of EOM contributed very differently to the increase in SOC as the amount of added C remaining in the soil varied as much as 4 times depending on the EOM type. On the contrary, the initial C-to-N ratio and the lignin/N ratio negatively influence the decay rate of the slow C pool [42] and that of FR residues positively influenced SOM accrual in the short term, confirming to be a what found by other authors [43,44,45].

4.2. Modeling C and N Mineralization of BGB Decomposition in the Soil

The EOM used in the present study showed remarkable variations according to their cell wall composition and biochemical properties. In particular, black locust seems to be characterized by the presence of two distinct pools of easily degradable materials, as underlined by the occurrence of two relative peaks within the first 3 days of incubation (Figure 2). On the other hand, switchgrass and willow showed a decreasing trend throughout the whole incubation and the lack of a clear initial peak (Figure 2). This behavior is likely correlated with the low amount of easily decomposable compounds and/or with their lower rate of decomposition (as underlined by kDEOM values for switchgrass) (Figure 4 and Table S4). Moreover, RothC pool parameters indicate that black locust had the highest content of easily decomposable material (fDEOM for black locust’s stump = 0.39). On the contrary, the EOMs with lower cumulative respiration were characterized by higher values of fREOM (Figure 4 and Table S4).
Giant reed rhizomes were characterized by very fast initial mineralization followed by a pronounced decline (Figure 2). As a matter of fact, cumulative respiration expressed as a percentage of added C sat in the lower part of the recorded range for the six PBCs (Figure 3). This evidence points to the occurrence of a small amount of easily decomposable compounds that are highly reactive, which are supported by values of fDEOM (0.05, Table S4) with the highest KREOM (0.42, Table S4). Poplar and giant reed PBO had a very distinct behavior: despite similar contents of C and N and consequently comparable C/N ratios, they showed a distinct respiratory pattern and cumulative respiration of 13.8% of added C in the case of giant reed and 19.1% in the case of poplar. This is in agreement with previous findings that the C/N ratio of residues does not regulate the residue decomposition in the soil, but mineralization depends more on the biochemical quality of the residues [46]. Toenshoff et al. [25] reported a value of C mineralization of PBO and FR of poplar residues of about 20% and 25% of added C after 30 and 42 days of incubation, while Wachendorf et al. [47] showed that decomposition of woody harvest is rapid.
The incorporation of EOM at actual field rates resulted in very different amounts of added C remaining in the soil after the mineralization of easily degradable compounds. Therefore, reversion of PBCs may lead to very different impacts on SOC depending on the crop involved. The mineralization of PBO was not related to the C/N ratio but instead to the LCI index of added materials, while there was a significant relationship between soil DOC, DON and C, N amounts of added materials. Similar results were found in the study of Marzi et al. [48] and Amougou et al. [49]. These data support the hypothesis that the ratio of C/N is not the main factor regulating organic matter decomposition.
In FR, the highest amount of C mineralized was not recorded for black locust as in the case of PBO, but for switchgrass, which has a C/N ratio of about 60. This is another confirmation that the C/N ratios are not the main factor controlling the decomposition of SOM. In addition, FR mineralization might not be limited by N availability. In fact, N availability as a sum of soil and ΔDON as percentage of added residue dried matter indicated that all FR had values above the threshold of 1.2% indicated by Jesmin et al. [50] and Henriksen et al. [51] for the reduction of residue decomposability due to N deficiency. When N availability is not a limiting factor, as in the present study, the C/N ratio of residues is not a driving factor of residue decomposition [46].
Switchgrass had the highest cumulative C mineralization of FR among PBCs and the highest C/N ratio, extra soluble C and fDEOM. Miscanthus FR had the lowest C mineralization and lowest values of kDEOM (Figure 4). Amounts of FR C mineralization were comparable with values of about 10% of added C measured by Wachendorf et al. [47] and values in the range of 7–13% found by other authors [52,53]. More likely, C mineralization of FR was lower than PBO, due to the different biochemical quality, resulting in different accessibility of degradable C compounds to microbes [39,54,55]. Low mineralization rates for FR have been previously reported [24,25,46] and attributed to the occurrence of large quantities of suberized cell walls recalcitrant lignin-N complexes and characteristic cell wall architecture (caspian bands) [25,46], which constitute a barrier to microbial attack. Values of kDEOM and kREOM for switchgrass FR (13 and 0.11, respectively) were consistent with values of 12 and 0.7, respectively, found by Johnson et al. [40]. Low mineralization of FR was reflected in the pool distribution with low values of KREOM (on average 0.09) than PBO (0.39) (Figure 4). The low mineralization rates of FR means that most residual C remains in the soil when FR are incorporated, underlining the significant role of belowground biomass in C stabilization [46]. The lower mineralization of FR resulted in a lower N immobilization than PBO, as recorded by Toenshoff et al. [25]. Root amended soils were characterized in general by a lower DOC content at the end of incubation. This is supported by the fact that FR presented a significantly lower rate of kREOM (at about 0.1 corresponding to mean residence time of 10 years) than PBO (KREOM was on average 0.4 corresponding to a mean residence time of 2.5 years).
The fact that biochemical properties had low relative importance in predicting C mineralization of FR compared to the DEOM/REOM ratio suggests that this lower mineralizing ability of the FR may be due not only to a specific highly recalcitrant C pool, but also to a reduced accessibility to decomposers. These results showed how not only the macromolecular composition, but also the anatomy of the tissue (location and thickness of the suberin–lignin complex) play a role in enzyme accessibility and protects the root externally by preventing easier decomposable compartments from decomposition [24].
The results showed the value of separately considering the different plant parts when studying plant residue decomposition [24].

4.3. RothC Model Optimization of BGB Residues for Multiple PBCs

RothC has been extensively used to predict SOC changes under different perennial energy crops at site-specific [56,57,58], regional [58] and European scale [59,60]. Nevertheless, one major limitation of the standard version of RothC model when run for PBCs is that it is insensitive to the variation in the quality of EOM inputs [58]. In other studies, the addition of different EOM pools satisfactorily described the patterns of litter decomposition [9,45,55]. The possibility to specifically parametrize important EOM such as FR and PBO might help in predicting with higher probability the soil C changes during cultivation and reversion phase of perennial energy crops. If BGB is ground and incorporated into the soil, reversion of PBCs is to be considered as a pulse OM addition at high dose in the to soil layer (on average, 47 Mg DM ha−1 for herbaceous PBCs and 38 Mg DM ha−1 for woody PBCs) [2]. To enhance the ability of RothC to accommodate a wider range of EOMs, some authors have proposed varying the partition coefficients attributed by RothC to EOM pools [61,62,63,64], but none of them has undertaken it explicitly for PBCs. In this study, we encompassed new EOM pools (PBO and FR) for multiple PBCs using the optimized version of RothC proposed by Mondini et al. [26]. In this study, for the first time, we provided the DEOM/REOM ratios of different EOM types relevant to C sequestration under PBCs cultivation (Table 4). The crop ranking for the DEOM/REOM ratio was as follows for PBO: black locust (0.64) > switchgrass (0.28) > giant reed (0.05) > poplar/willow (0.04), while the following was noted for FR: switchgrass (0.2) > giant reed/willow (0.16) > miscanthus (0.14) > black locust/poplar (0.11). These findings support the hypothesis already confirmed by Mondini et al. [26] that explicit treatment of EOM heterogeneity would improve the performance of the RothC model.
The results of this study also showed that DEOM/REOM ratios of EOM are directly linked with C mineralization and C, N cycling in soil after their addition (Table 4). The use of these optimized DEOM/REOM ratios for multiple EOM types of PBCs ratios seems to accommodate the large variability of the tested EOMs, in terms of cell wall composition and biochemical properties. Kinetically defined pools for PBO and FR, which consider such interactions, represent a clear advantage in terms of simulation accuracy over their operationally defined pools. For example, the significant relationship between C mineralization (% of added C-CO2) and DEOM could be explained by the fact that most of the mineralized EOM-C emitted during incubation is derived from the decomposable pool.

5. Conclusions

We simulated through a short-term incubation study the reversion of six different PBCs to arable land by adding to soil two distinct EOM types (PBO and FR). We have shown that PBCs residues decomposition and their relative contribution to SOM accrual is a complex process, regulated by either accessibility to decomposers, cell wall composition or biochemical quality. Multiple regression modeling allowed us to separate effects on C, N mineralization of residues and SOM storage of cell wall composition, C accessibility, biochemical quality and C quantity. The partitioning factors (fDEOM/REOM) and decomposition constant rate (KDEOM/REOM) of the decomposable and recalcitrant pool of EOM have been calculated for the first time for multiple PBCs with an optimized RothC model.
When PBO is ground into soil, we observed both a consistent C sequestration efficiency and SOM accrual, while roots decomposed slower and less new SOM was generated principally because of lower substrate accessibility to decomposers. The quantity of C added at real field doses is the main controlling factor for SOM accrual with PBO addition while LCI index predicted satisfactorily its PBO C mineralization. Multiple regression modeling of FR decay showed that C/N ratio together with DEOM/REOM are the two main controlling factors of SOM increase and C mineralization, respectively.
This type of information linked with decomposition constant rate (KDEOM and KREOM) information is extremely useful to refine sub-models of FR and PBO C dynamics in daily time steps or at the scale of a single growing season. What is commonly advocated in modeling studies addressing SOC changes under PBCs is the need to verify sustainable SOC enrichments in response to gross C inputs, EOM partitioning and SOC pool turnovers [9,65,66]. The inclusion of DEOM/REOM ratios in the RothC model or their use in similar soil C model will become essential in defining the long-term sustainability of C sequestration (half-life >30 years) associated with PBCs cultivation, especially when reversion of such perennial cropping systems is addressed.
Labile plant constituents (DEOM) are considered the dominant source of microbial products, relative to input rates, and they are efficiently utilized by microbes [21,55,67]. Such high and pulse labile C inputs from PBO might become the main precursors of stable SOM “potentially” generated after reversion of PBCs. In particular, the quality of inputs becomes even more relevant than the added C quantity itself, if we look at increasing the humification efficiency of these C-rich residues. Several recent findings showed how to assist microbially-mediated crop residue humification by integrating crop fertilization with residues stoichiometrically balanced supplementary fertilization [68,69,70]. The issue of how to manage C-rich BGB residues of PBCs under real-farm conditions to maximize short-term opportunities for sequestering C into new SOM after reversion calls for improved soil C models [71,72] New biogeochemical models exploring substrate quality, microbial community and the formation of stable SOM are being conceptualized and validated. Modeling research efforts should ultimately be prioritized towards incentivizing schemes supporting PBCs cultivation, not only for their climate benefits during the real crop life span, but also for their potential crop legacy effect on SOM accrual after reversion.

Supplementary Materials

The following supporting information can be downloaded at: https://www.mdpi.com/article/10.3390/agronomy12020485/s1, Table S1: Amount of C and N added to soil from the incubation of different exogenous organic matters (EOM), amount of EOM C remaining and relative variation of soil organic matter content (SOM) at the end of the incubation experiment for belowground biomass components (plant belowground organs and fine roots) of six different perennial biomass crops; Table S2: Analysis of variance on the effect of crop type for CO2 efflux and soil parameter (DOC and DON) considered in the incubation experiment of the two components of belowground biomass: plant belowground organs and fine roots. (*, **, *** denote statistically significant differences for p < 0.05, p < 0.01 and p < 0.001, respectively); Table S3: Mean values (µg g−1) of dissolved organic carbon (DOC) and nitrogen (DON) in soil at the end of incubation. Different letters show statistically different means among PBCs (Tukey’s test, p: 0.05) for each parameter within the same EOM type; Table S4: Mean values of partitioning factor (f) and decomposition rate constant (K) for different exogenous organic matter types as obtained by the improved version of the RothC model (Mondini et al., 2017).

Author Contributions

Conceptualization: A.F., E.M. and F.F.; methodology: C.M., F.F. and A.F.; Performed incubation: F.F.; soil C modelling: C.M.; data curation: C.M., A.F. and E.M.; statistical analysis: A.F.; writing—original draft preparation, A.F., C.M. and E.M.; writing—review and editing: A.F. and S.A.; visualization: A.F.; funding acquisition: S.A. All authors have read and agreed to the published version of the manuscript.

Funding

This research was supported by funding from the Rural Developing Program (measure 16.01) of Emilia Romagna region that financed the ‘FarmCO2Sink’ EIP-AGRI operational group.

Data Availability Statement

The data presented in this study are available in the article and in Supplemental Materials.

Conflicts of Interest

The authors declare no conflict of interest.

Glossary

BGBBelowground Biomass
DEOMDecomposable Exogenous Organic Matter
DOCDissolved Organic Carbon
DONDissolved Organic Nitrogen
DPMDecomposable Plant Material
EOMExogenous Organic Matter
fPartitioning factor
FRFine Roots
HEOMHumified Exogenous Organic Matter
HUMHumified Carbon Pool
kDecomposition rate constant
LFOMLight Fraction Organic Matter
PBOPlant Belowground Organs
PBCsPerennial Biomass Crops
REOMResistant Exogenous Organic Matter
RPMResistant Plant Material
SOCSoil Organic Carbon
SOMSoil Organic Matter
SMBSoil Microbial Biomass
TOCTotal Organic Carbon
WSCWater Soluble Carbon
WSNWater Soluble Nitrogen

References

  1. Chimento, C.; Almagro, M.; Amaducci, S. Carbon Sequestration Potential in Perennial Bioenergy Crops: The Importance of Organic Matter Inputs and Its Physical Protection. GCB Bioenergy 2016, 8, 111–121. [Google Scholar] [CrossRef]
  2. Martani, E.; Ferrarini, A.; Serra, P.; Pilla, M.; Marcone, A.; Amaducci, S. Belowground Biomass C Outweighs Soil Organic C of Perennial Energy Crops: Insights from a Long-term Multispecies Trial. GCB Bioenergy 2020, 13, 1–14. [Google Scholar] [CrossRef]
  3. Ferrarini, A.; Serra, P.; Almagro, M.; Trevisan, M.; Amaducci, S. Multiple Ecosystem Services Provision and Biomass Logistics Management in Bioenergy Buffers: A State-of-the-Art Review. Renew. Sustain. Energy Rev. 2017, 73, 277–290. [Google Scholar] [CrossRef]
  4. Ferrarini, A.; Fornasier, F.; Serra, P.; Ferrari, F.; Trevisan, M.; Amaducci, S. Impacts of Willow and Miscanthus Bioenergy Buffers on Biogeochemical N Removal Processes along the Soil-Groundwater Continuum. GCB Bioenergy 2017, 9, 246–261. [Google Scholar] [CrossRef]
  5. Ferrarini, A.; Martani, E.; Fornasier, F.; Amaducci, S. High C Input by Perennial Energy Crops Boosts Belowground Functioning and Increases Soil Organic P Content. Agric. Ecosyst. Environ. 2020, 308, 107247. [Google Scholar] [CrossRef]
  6. Lewandowski, I. The Role of Perennial Biom Ass Crops in a Growing Bioeconomy. In Perennial Biomass Crops for a Resource-Constrained World; Springer: Cham, Switzerland, 2016; pp. 1–313. [Google Scholar] [CrossRef]
  7. Dufossé, K.; Drewer, J.; Gabrielle, B.; Drouet, J.L. Effects of a 20-Year Old Miscanthus × Giganteus Stand and Its Removal on Soil Characteristics and Greenhouse Gas Emissions. Biomass Bioenergy 2014, 69, 198–210. [Google Scholar] [CrossRef]
  8. Ledo, A.; Smith, P.; Zerihun, A.; Whitaker, J.; Vicente-Vicente, J.L.; Qin, Z.; McNamara, N.P.; Zinn, Y.L.; Llorente, M.; Liebig, M.; et al. Changes in Soil Organic Carbon under Perennial Crops. Glob. Chang. Biol. 2020, 26, 4158–4168. [Google Scholar] [CrossRef]
  9. Agostini, F.; Gregory, A.S.; Richter, G.M. Carbon Sequestration by Perennial Energy Crops: Is the Jury Still Out? Bioenergy Res. 2015, 8, 1057–1080. [Google Scholar] [CrossRef] [Green Version]
  10. Toenshoff, C.; Georg, R.; Stuelpnagel, R.; Wachendorf, C. Dynamics of Soil Organic Carbon Fractions One Year after the Re-Conversion of Poplar and Willow Plantations to Arable Use and Perennial Grassland. Agric. Ecosyst. Environ. 2013, 174, 21–27. [Google Scholar] [CrossRef]
  11. McCalmont, J.P.; Rowe, R.; Elias, D.; Whitaker, J.; McNamara, N.P.; Donnison, I.S. Soil Nitrous Oxide Flux Following Land-Use Reversion from Miscanthus and SRC Willow to Perennial Ryegrass. GCB Bioenergy 2018, 10, 914–929. [Google Scholar] [CrossRef]
  12. Rowe, R.L.; Keith, A.M.; Elias, D.M.O.; Mcnamara, N.P. Soil Carbon Stock Impacts Following Reversion of Miscanthus × Giganteus and Short Rotation Coppice Willow Commercial Plantations into Arable Cropping. GCB Bioenergy 2020, 12, 680–693. [Google Scholar] [CrossRef]
  13. Mangold, A.; Lewandowski, I.; Kiesel, A. How Can Miscanthus Fields Be Reintegrated into a Crop Rotation? GCB Bioenergy 2019, 11, 1348–1360. [Google Scholar] [CrossRef]
  14. Moore, C.E.; Berardi, D.M.; Blanc-Betes, E.; Dracup, E.C.; Egenriether, S.; Gomez-Casanovas, N.; Hartman, M.D.; Hudiburg, T.; Kantola, I.; Masters, M.D.; et al. The Carbon and Nitrogen Cycle Impacts of Reverting Perennial Bioenergy Switchgrass to an Annual Maize Crop Rotation. GCB Bioenergy 2020, 12, 941–954. [Google Scholar] [CrossRef]
  15. Toenshoff, C.; Stuelpnagel, R.; Joergensen, R.G.; Wachendorf, C. Carbon in Plant Biomass and Soils of Poplar and Willow Plantations—Implications for SOC Distribution in Different Soil Fractions after Re-Conversion to Arable Land. Plant Soil 2013, 367, 407–417. [Google Scholar] [CrossRef]
  16. Beuschel, R.; Piepho, H.P.; Joergensen, R.G.; Wachendorf, C. Effects of Converting a Temperate Short-Rotation Coppice to a Silvo-Arable Alley Cropping Agroforestry System on Soil Quality Indicators. Agrofor. Syst. 2020, 94, 389–400. [Google Scholar] [CrossRef]
  17. Kuzyakov, Y.; Blagodatskaya, E. Microbial Hotspots and Hot Moments in Soil: Concept & Review. Soil Biol. Biochem. 2015, 83, 184–199. [Google Scholar] [CrossRef]
  18. Janzen, H.H. The Soil Carbon Dilemma: Shall We Hoard It or Use It? Soil Biol. Biochem. 2006, 38, 419–424. [Google Scholar] [CrossRef]
  19. Zhu, X.; Jackson, R.D.; DeLucia, E.H.; Tiedje, J.M.; Liang, C. The Soil Microbial Carbon Pump: From Conceptual Insights to Empirical Assessments. Glob. Chang. Biol. 2020, 26, 6032–6039. [Google Scholar] [CrossRef]
  20. Kramer, S.; Marhan, S.; Ruess, L.; Armbruster, W.; Butenschoen, O.; Haslwimmer, H.; Kuzyakov, Y.; Pausch, J.; Scheunemann, N.; Schoene, J.; et al. Carbon Flow into Microbial and Fungal Biomass as a Basis for the Belowground Food Web of Agroecosystems. Pedobiologia 2012, 55, 111–119. [Google Scholar] [CrossRef]
  21. Cotrufo, M.F.; Soong, J.L.; Horton, A.J.; Campbell, E.E.; Haddix, M.L.; Wall, D.H.; Parton, W.J. Formation of Soil Organic Matter via Biochemical and Physical Pathways of Litter Mass Loss. Nat. Geosci. 2015, 8, 776–779. [Google Scholar] [CrossRef]
  22. Kallenbach, C.M.; Frey, S.D.; Grandy, A.S. Direct Evidence for Microbial-Derived Soil Organic Matter Formation and Its Ecophysiological Controls. Nat. Commun. 2016, 7, 13630. [Google Scholar] [CrossRef] [PubMed]
  23. Liang, C.; Kästner, M.; Joergensen, R.G. Microbial Necromass on the Rise: The Growing Focus on Its Role in Soil Organic Matter Development. Soil Biol. Biochem. 2020, 150, 2018–2021. [Google Scholar] [CrossRef]
  24. Abiven, S.; Recous, S.; Reyes, V.; Oliver, R. Mineralisation of C and N from Root, Stem and Leaf Residues in Soil and Role of Their Biochemical Quality. Biol. Fertil. Soils 2005, 42, 119–128. [Google Scholar] [CrossRef]
  25. Toenshoff, C.; Joergensen, R.G.; Stuelpnagel, R.; Wachendorf, C. Initial Decomposition of Post-Harvest Crown and Root Residues of Poplars as Affected by N Availability and Particle Size. Biol. Fertil. Soils 2014, 50, 675–683. [Google Scholar] [CrossRef]
  26. Mondini, C.; Cayuela, M.L.; Sinicco, T.; Fornasier, F.; Galvez, A.; Sánchez-monedero, M.A. Modification of the RothC Model to Simulate Soil C Mineralization of Exogenous Organic Matter. Biogeosciences 2017, 14, 3253–3274. [Google Scholar] [CrossRef] [Green Version]
  27. Amaducci, S.; Facciotto, G.; Bergante, S.; Perego, A.; Serra, P.; Ferrarini, A.; Chimento, C. Biomass Production and Energy Balance of Herbaceous and Woody Crops on Marginal Soils in the Po Valley. GCB Bioenergy 2016, 9, 31–45. [Google Scholar] [CrossRef] [Green Version]
  28. Amaducci, S.; Zatta, A.; Raffanini, M.; Venturi, G. Characterisation of Hemp (Cannabis Sativa L.) Roots under Different Growing Conditions. Plant Soil 2008, 313, 227–235. [Google Scholar] [CrossRef]
  29. Monti, A.; Zatta, A. Root Distribution and Soil Moisture Retrieval in Perennial and Annual Energy Crops in Northern Italy. Agric. Ecosyst. Environ. 2009, 132, 252–259. [Google Scholar] [CrossRef]
  30. Van Soest, P.J.; Robertson, J.B.; Lewis, B.A. Methods for Dietary Fiber, Neutral Detergent Fiber, and Nonstarch Polysaccharides in Relation to Animal Nutrition. J. Dairy Sci. 1991, 74, 3583–3597. [Google Scholar] [CrossRef]
  31. Mondini, C.; Sinicco, T.; Cayuela, M.L.; Sanchez-Monedero, M.A. A Simple Automated System for Measuring Soil Respiration by Gas Chromatography. Talanta 2010, 81, 849–855. [Google Scholar] [CrossRef]
  32. Walsh, S.; Diamond, D. Non-Linear Curve Fitting Using Microsoft Excel Solver. Talanta 1995, 42, 561–572. [Google Scholar] [CrossRef]
  33. R Core Team. R: A Language and Environment for Statistical Computing; R Foundation for Statistical Computing: Vienna, Austria, 2020. [Google Scholar]
  34. Groempings, U.; Lehrkamp, M. Package ‘Relaimpo’. In Relative Importance of Regressors in Linear Models; R Fundation for Statstical Computing: Vienna, Austria, 2021. [Google Scholar]
  35. Kong, A.Y.Y.; Six, J.; Bryant, D.C.; Denison, R.F.; van Kessel, C. The Relationship between Carbon Input, Aggregation, and Soil Organic Carbon Stabilization in Sustainable Cropping Systems. Soil Sci. Soc. Am. J. 2005, 69, 1078–1085. [Google Scholar] [CrossRef]
  36. Martani, E.; Ferrarini, A.; Amaducci, S. Reversion of Perennial Biomass Crops to Save C and N: A Meta-Analysis. Agronomy 2021, 12, 232. [Google Scholar] [CrossRef]
  37. Wang, H.; Boutton, T.W.; Xu, W.; Hu, G.; Jiang, P.; Bai, E. Quality of Fresh Organic Matter Affects Priming of Soil Organic Matter and Substrate Utilization Patterns of Microbes. Sci. Rep. 2015, 5, 10102. [Google Scholar] [CrossRef] [PubMed] [Green Version]
  38. Shahbaz, M.; Kuzyakov, Y.; Heitkamp, F. Decrease of Soil Organic Matter Stabilization with Increasing Inputs: Mechanisms and Controls. Geoderma 2017, 304, 76–82. [Google Scholar] [CrossRef]
  39. Wickings, K.; Grandy, A.S.; Reed, S.C.; Cleveland, C.C. The Origin of Litter Chemical Complexity during Decomposition. Ecol. Lett. 2012, 15, 1180–1188. [Google Scholar] [CrossRef]
  40. Johnson, J.M.-F.; Barbour, N.W.; Weyers, S.L. Chemical Composition of Crop Biomass Impacts Its Decomposition. Soil Sci. Soc. Am. J. 2007, 71, 155–162. [Google Scholar] [CrossRef] [Green Version]
  41. Chimento, C.; Amaducci, S. Characterization of Fine Root System and Potential Contribution to Soil Organic Carbon of Six Perennial Bioenergy Crops. Biomass Bioenergy 2015, 83, 116–122. [Google Scholar] [CrossRef]
  42. Walela, C.; Daniel, H.; Wilson, B.; Lockwood, P.; Cowie, A.; Harden, S. The Initial Lignin: Nitrogen Ratio of Litter from above and below Ground Sources Strongly and Negatively Influenced Decay Rates of Slowly Decomposing Litter Carbon Pools. Soil Biol. Biochem. 2014, 77, 268–275. [Google Scholar] [CrossRef]
  43. Rubino, M.; Dungait, J.A.J.; Evershed, R.P.; Bertolini, T.; de Angelis, P.; D’Onofrio, A.; Lagomarsino, A.; Lubritto, C.; Merola, A.; Terrasi, F. Carbon Input Belowground Is the Major C Flux Contributing to Leaf Litter Mass Loss: Evidences from a 13C Labelled-Leaf Litter Experiment. Soil Biol. Biochem. 2010, 42, 1009–1016. [Google Scholar] [CrossRef]
  44. Castellano, M.J.; Mueller, K.E.; Olk, D.C.; Sawyer, J.E.; Six, J. Integrating Plant Litter Quality, Soil Organic Matter Stabilization, and the Carbon Saturation Concept. Glob. Chang. Biol. 2015, 21, 3200–3209. [Google Scholar] [CrossRef]
  45. Incerti, G.; Bonanomi, G.; Giannino, F.; Angela, F.; Piermatteo, D.; Castaldi, S.; De Marco, A.; Fierro, A.; Fioretto, A.; Maggi, O.; et al. Litter Decomposition in Mediterranean Ecosystems: Modelling the Controlling Role of Climatic Conditions and Litter Quality. Appl. Soil Ecol. 2011, 49, 148–157. [Google Scholar] [CrossRef]
  46. Sall, S.; Bertrand, I.; Chotte, J.L.; Recous, S. Separate Effects of the Biochemical Quality and N Content of Crop Residues on C and N Dynamics in Soil. Biol. Fertil. Soils 2007, 43, 797–804. [Google Scholar] [CrossRef]
  47. Wachendorf, C.; Stuelpnagel, R.; Wachendorf, M. Influence of Land Use and Tillage Depth on Dynamics of Soil Microbial Properties, Soil Carbon Fractions and Crop Yield after Conversion of Short-Rotation Coppices. Soil Use Manag. 2017, 33, 379–388. [Google Scholar] [CrossRef]
  48. Marzi, M.; Shahbazi, K.; Kharazi, N.; Rezaei, M. The Influence of Organic Amendment Source on Carbon and Nitrogen Mineralization in Different Soils. J. Soil Sci. Plant Nutr. 2020, 20, 177–191. [Google Scholar] [CrossRef]
  49. Amougou, N.; Bertrand, I.; Machet, J.-M.; Recous, S. Quality and Decomposition in Soil of Rhizome, Root and Senescent Leaf from Miscanthus x Giganteus, as Affected by Harvest Date and N Fertilization. Plant Soil 2010, 338, 83–97. [Google Scholar] [CrossRef]
  50. Jesmin, T.; Mitchell, D.T.; Mulvaney, R.L. Short-Term Effect of Nitrogen Fertilization on Carbon Mineralization during Corn Residue Decomposition in Soil. Nitrogen 2021, 2, 444–460. [Google Scholar] [CrossRef]
  51. Henriksen, T.M.; Breland, T.A. Nitrogen Availability Effects on Carbon Mineralization, Fungal and Bacterial Growth, and Enzyme Activities during Decomposition of Wheat Straw in Soil. Soil Biol. Biochem. 1999, 31, 1121–1134. [Google Scholar] [CrossRef]
  52. De Graaff, M.-A.; Jastrow, J.D.; Gillette, S.; Johns, A.; Wullschleger, S.D. Differential Priming of Soil Carbon Driven by Soil Depth and Root Impacts on Carbon Availability. Soil Biol. Biochem. 2014, 69, 147–156. [Google Scholar] [CrossRef]
  53. Rivas, F.A.; Tabatabai, M.A.; Olk, D.C.; Thompson, M.L. Kinetics of Short-Term Carbon Mineralization in Roots of Biofuel Crops in Soils. Biol. Fertil. Soils 2014, 50, 527–535. [Google Scholar] [CrossRef]
  54. Cleveland, C.C.; Reed, S.C.; Keller, A.B.; Nemergut, D.R.; O’Neill, S.P.; Ostertag, R.; Vitousek, P.M. Litter Quality versus Soil Microbial Community Controls over Decomposition: A Quantitative Analysis. Oecologia 2014, 174, 283–294. [Google Scholar] [CrossRef] [PubMed]
  55. Cotrufo, M.F.; Wallenstein, M.D.; Boot, C.M.; Denef, K.; Paul, E. The Microbial Efficiency-Matrix Stabilization (MEMS) Framework Integrates Plant Litter Decomposition with Soil Organic Matter Stabilization: Do Labile Plant Inputs Form Stable Soil Organic Matter? Glob. Chang. Biol. 2013, 19, 988–995. [Google Scholar] [CrossRef] [PubMed] [Green Version]
  56. Poeplau, C.; Don, A.A. Soil Carbon Changes under Miscanthus Driven by C4 Accumulation and C3 Decompostion—Toward a Default Sequestration Function. GCB Bioenergy 2013, 6, 327–338. [Google Scholar] [CrossRef]
  57. Zatta, A.; Clifton-Brown, J.; Robson, P.; Hastings, A.; Monti, A. Land Use Change from C3 Grassland to C4 Miscanthus: Effects on Soil Carbon Content and Estimated Mitigation Benefit after Six Years. GCB Bioenergy 2014, 6, 360–370. [Google Scholar] [CrossRef] [Green Version]
  58. Dondini, M.; Hastings, A.; Saiz, G.; Jones, M.B.; Smith, P. The Potential of Miscanthus to Sequester Carbon in Soils: Comparing Field Measurements in Carlow, Ireland to Model Predictions. GCB Bioenergy 2009, 1, 413–425. [Google Scholar] [CrossRef]
  59. Hastings, A.; Clifton-Brown, J.; Wattenbach, M.; Mitchell, C.P.; Smith, P. The Development of MISCANFOR, a New Miscanthus Crop Growth Model: Towards More Robust Yield Predictions under Different Climatic and Soil Conditions. GCB Bioenergy 2009, 1, 154–170. [Google Scholar] [CrossRef]
  60. Clifton-Brown, J.; Schwarz, K.U.; Hastings, A. History of the Development of Miscanthus as a Bioenergy Crop: From Small Beginnings to Potential Realisation. Biol. Environ. 2015, 115B, 1–13. [Google Scholar] [CrossRef]
  61. Gabrielle, B.; Da-Silveira, J.; Houot, S.; Michelin, J. Field-Scale Modelling of Carbon and Nitrogen Dynamics in Soils Amended with Urban Waste Composts. Agric. Ecosyst. Environ. 2005, 110, 289–299. [Google Scholar] [CrossRef]
  62. Kaboré, W.T.; Pansu, M.; Hien, E.; Houot, S.; Zombré, N.P.; Masse, D. Usefulness of TAO Model to Predict and Manage the Transformation in Soil of Carbon and Nitrogen Forms from West-Africa Urban Solid Wastes. Waste Manag. 2011, 31, 154–167. [Google Scholar] [CrossRef]
  63. Noirot-Cosson, P.E.; Vaudour, E.; Gilliot, J.M.; Gabrielle, B.; Houot, S. Modelling the Long-Term Effect of Urban Waste Compost Applications on Carbon and Nitrogen Dynamics in Temperate Cropland. Soil Biol. Biochem. 2016, 94, 138–153. [Google Scholar] [CrossRef]
  64. Vidal-Beaudet, L.; Grosbellet, C.; Forget-Caubel, V.; Charpentier, S. Modelling Long-Term Carbon Dynamics in Soils Reconstituted with Large Quantities of Organic Matter. Eur. J. Soil Sci. 2012, 63, 787–797. [Google Scholar] [CrossRef]
  65. Robertson, A.; Smith, P.; Davies, C.; Bottoms, E.; Mcnamara, N. Longevity of Contributions to SOC Stocks from Roots and Aboveground Plant Litter below a Miscanthus Plantation. In Proceedings of the EGU General Assembly 2013, Vienna, Austria, 7–12 April 2013; Volume 15, pp. 1920–2013. [Google Scholar]
  66. Robertson, A.D.; Davies, C.A.; Smith, P.; Dondini, M.; Mcnamara, N.P. Modelling the Carbon Cycle of Miscanthus Plantations: Existing Models and the Potential for Their Improvement. GCB Bioenergy 2015, 7, 405–421. [Google Scholar] [CrossRef] [Green Version]
  67. Liang, C.; Schimel, J.P.; Jastrow, J.D. The Importance of Anabolism in Microbial Control over Soil Carbon Storage. Nat. Microbiol. 2017, 2, 1–6. [Google Scholar] [CrossRef] [PubMed]
  68. Fang, Y.; Singh, B.P.; Cowie, A.; Wang, W.; Arachchi, M.H.; Wang, H.; Tavakkoli, E. Balancing Nutrient Stoichiometry Facilitates the Fate of Wheat Residue-carbon in Physically Defined Soil Organic Matter Fractions. Geoderma 2019, 354, 113883. [Google Scholar] [CrossRef]
  69. Kirkby, C.A.; Richardson, A.E.; Wade, L.J.; Conyers, M.; Kirkegaard, J.A. Inorganic Nutrients Increase Humification Efficiency and C-Sequestration in an Annually Cropped Soil. PLoS ONE 2016, 11, e0153698. [Google Scholar] [CrossRef] [Green Version]
  70. Kirkby, C.A.; Richardson, A.E.; Wade, L.J.; Batten, G.D.; Blanchard, C.; Kirkegaard, J.A. Carbon-Nutrient Stoichiometry to Increase Soil Carbon Sequestration. Soil Biol. Biochem. 2013, 60, 77–86. [Google Scholar] [CrossRef]
  71. Zhang, Y.; Lavallee, J.M.; Robertson, A.D.; Even, R.; Ogle, S.M.; Paustian, K.; Cotrufo, M.F. Simulating Measurable Ecosystem Carbon and Nitrogen Dynamics with the Mechanistically Defined MEMS 2.0 Model. Biogeosciences 2021, 18, 3147–3171. [Google Scholar] [CrossRef]
  72. Kyker-Snowman, E.; Wieder, W.; Frey, S.; Grandy, A.S. Stoichiometrically Coupled Carbon and Nitrogen Cycling in the MIcrobial-MIneral Carbon Stabilization Model (MIMICS-CN). Geosci. Model Dev. Discuss. 2019, 13, 1–32. [Google Scholar] [CrossRef]
Figure 1. Diagram of the automated chromatographic system for soil CO2 sampling and measurement (a) and structure of the modified RothC model (b). DPM: decomposable plant material; RPM: resistant plant material; EOM: exogenous organic matter; DEOM: decomposable EOM; REOM: resistant EOM; HEOM: humified EOM; BIO: soil microbial biomass; HUM: humified soil organic matter; IOM: inert organic matter; f: partitioning factor; K: decomposition constant rate (yr−1). Figure adapted from Mondini et al. [26].
Agronomy 12 00485 g001
Figure 2. Rate (a,b) and net cumulative measured (c,d) CO2 emissions from soil incubated with different components of PBCs belowground biomass as EOMs ((ac): stumps/rhizomes and (bd) fine roots) during 30 and 60-day laboratory incubations. For the rate of respiration, only the first 10 days of the incubation are reported. Respiratory curves are presented on the y axis with a different scale for better visualization.
Agronomy 12 00485 g002
Figure 3. Absolute (µg C-CO2 g−1) and relative (% of added C) mean values of carbon respired as CO2 (ad) for PBO (a,b) and fine roots (c,d) at 30 and 60 days of incubation (DoI); absolute (µg g−1) and relative (% of added C,N) mean values of the difference at the end of incubation of dissolved organic carbon (DOC) (e,f) and nitrogen (DON) (g,h) in soil from EOM mineralization with respect to control. Different lowercase letters show statistically different means among PBCs (Tukey’s test, p: 0.05) for each parameter within the same EOM type.
Agronomy 12 00485 g003
Figure 4. Mean values of partitioning factor (f) (a) and decomposition rate constant (k) (b) for different exogenous organic matter types as obtained by the improved version of the RothC model [26]. DEOM/REOM is the ratio of fDEOM/fREOM Different superscript letters show statistically different means among PBCs (Tukey’s test, p: 0.05) across all EOM types.
Agronomy 12 00485 g004
Table 1. Main physicochemical characteristics of the soil used for incubation.
SiteLand UseSandSiltClaypHCaCO3SOCSTNC/N
(%)(%)(%)(%)(g kg−1)(g kg−1)
GarigaArable1168216.9Negligible7.50.987.6
SOC: Soil Organic Carbon; STN: Soil Total Nitrogen.
Table 2. Main characteristics of the exogenous organic matter used in the experiment.
EOM GroupCropEOM TypepHOMTOCNTOTTOC/NTOTWSCWSNNH4+NO3
(%)(%)(%)(g kg−1)(g kg−1)(mg kg−1)(mg kg−1)
Woody
PBCs
Black locustStump5.3786.0441.923.142.85.420.2045.82
Poplar5.2989.7440.762.829.21.66.7945.90
Willow4.9283.2440.4110.031.50.79.3520.45
Herbaceous PBCsMiscanthusRhizome4.9474.8440.948.932.91.87.7835.10
Switchgrass5.0878.4400.580.027.40.96.2438.38
Giant reed4.1780.3440.855.054.81.38.5410.23
Woody
PBCs
Black locustFine roots5.0069.9292.113.812.42.6123.6778.88
Poplar4.9483.2351.216.713.11.185.77202.34
Willow4.1969.9311.031.013.20.760.88184.63
Herbaceous PBCsMiscanthusFine roots5.4068.2320.935.69.00.728.14141.06
Switchgrass4.8668.4360.751.426.10.611.9738.43
Giant reed5.4770.3300.742.99.50.826.33166.35
EOM: exogenous organic matter; OM: organic matter; TOC: total organic carbon; NTOT: total nitrogen; WSC: water-soluble carbon; WSN: water-soluble nitrogen.
Table 3. Cell wall composition of exogenous organic matter used in the experiment.
EOM GroupCropEOM TypeNDFADFADLHemicelluloseCelluloseLigninAshSolubleLCILignin/N
(%)(%)(%)(%)(%)
Woody PBCsBlack locustStump62.8746.2914.3016.5831.9911.712.6037.130.276.2
Poplar74.4167.7128.496.7039.2125.433.0725.590.3936.3
Willow67.7666.0329.431.7336.6026.223.2232.240.4265.5
Herbaceous PBCsMiscanthusRhizome68.0247.3821.0620.6426.3213.997.0731.980.3515.5
Switchgrass77.3653.2621.1724.1032.0918.962.2022.640.4140.1
Giant reed69.9752.0823.0317.9029.0420.033.0030.030.3723.7
Woody PBCsBlack locustFine roots70.8542.0328.087.7316.7720.9416.7737.780.568.4
Poplar62.2254.4937.7128.8213.9517.6310.4529.150.5617.5
Willow57.0356.3231.420.7224.9019.6011.8242.970.4419.6
Herbaceous PECbMiscanthusFine roots67.9953.8030.0514.1923.7513.9916.0532.010.3715.5
Switchgrass64.7945.4620.1419.3325.3212.777.3735.210.3418.2
Giant reed69.2349.3826.1819.8523.2015.5410.6430.770.4022.2
EOM: exogenous organic matter; NDF: neutral detergent fiber; ADF: acid detergent fiber; ADL: acid detergent lignin; Hemicellulose: NDF-ADF; Cellulose: ADF-ADL; Lignin: ADL-ASH; LCI: Lignocellulose index (Lignin/Lignin + Cellulose).
Table 4. Summary statistics of the multiple regression models obtained for exogenous organic matter types.
EOM TypeC and N Mineralization
Variables
Residual SEAdjusted R2F-Statisticp-ValueSignificant Predictors (% Relative Importance) *
Plant belowgroundorgansC mineralization
(cumulative C-CO2)
44.30.9872.810.013LCI index (51%) a, C added (34%) a, Lignin (15%) b
C mineralization
(% of added C-CO2)
0.370.99825.80.001LCI index (49%) a, DEOM/REOM (46%) a, Hemicellulose (6%) b
ΔDOC (μg C g−1)7.50.6510.080.033C added (100%) a
ΔDON (μg N g−1)9.40.556.780.045N content (48%) a, DEOM/REOM (37%) a, Cellulose (15%) b
ΔSOM (μg SOM g−1)0.090.9229.780.011C added (83%) a, Ash (16%) b
Fine rootsC mineralization
(cumulative C-CO2)
9.440.9753.40.018DEOM/REOM (42%) a, DEOM (40%) a, C/N ratio (17%) b
C mineralization
(% of added C)
2.010.8712.60.05DEOM/REOM (44%) a, DEOM (42%) a, C/N ratio (15%) b
ΔDOC (μg C g−1)1.070.9425.60.038Lignin/N ratio (53%) a, Soluble (32%) a, Lignin (17%) b
ΔDON (μg N g−1)0.0719139<0.001C/N ratio (52%) a, Cellulose (26%) b, Ash (22%) b
ΔSOM (μg SOM g−1)0.010.9437.20.008C/N ratio (87%) a, Cellulose (13%) b
SE: standard error; ΔDOC: the difference of dissolved organic carbon in soil from EOM mineralization; ΔDON: the difference of dissolved organic nitrogen in soil from EOM mineralization; ΔSOM: the difference of soil organic matter in soil from EOM mineralization. * metrics are normalized to sum to 100% of adjusted R2. Superscript lowercase letter denotes significant differences among predictors (p < 0.05 Bonferroni test) as assessed by bootstrap (n = 1000) measures of relative importance.
Publisher’s Note: MDPI stays neutral with regard to jurisdictional claims in published maps and institutional affiliations.

