Technical Note

Going Conservative or Conventional? Investigating Farm Management Strategies in between Economic and Environmental Sustainability in Southern Italy

1
Institute of Methodologies for Environmental Analysis, Italian National Research Council, 85050 Tito Scalo, Italy
2
Department of Methods and Models for Economics, Territory and Finance, Sapienza University of Rome, Via del Castro Laurenziano 9, 00161 Rome, Italy
*
Author to whom correspondence should be addressed.
Agronomy 2022, 12(3), 597; https://doi.org/10.3390/agronomy12030597
Submission received: 9 February 2022 / Accepted: 22 February 2022 / Published: 27 February 2022
(This article belongs to the Section Farming Sustainability)

Abstract

:
The European “Green Deal” strategy is aimed at making Europe the first climate-neutral continent by 2050 through integrated actions relying on healthier agricultural systems grounded in (environmental and economic) sustainable practices, including soil carbon management and biodiversity enhancement. In this vein, the present study contrasts the economic-environmental performances of conventional (deep tillage) and conservative (no-tillage and soil ripping) practices for two varieties of durum wheat (Triticum turgidum spp. durum), namely a modern (Anco Marzio) and an ancient landrace (Saragolla Lucana) variety in the Basilicata region (Southern Italy). Field and laboratory analysis (granulometry, mineralogy, and geochemistry) as well as satellite data (RapidEye) were used to characterize the soil and vegetation patterns. The empirical results indicate a higher biomass production and vegetative potential together with higher grain yields in soils managed with conventional deep tillage compared with soil managed with conservative practices. Similarly, the modern wheat variety exhibited better performance with respect to the old landrace. The soils managed with conventional practices had a distribution of exchangeable macro-nutrients characterized by a reduction in Ca+ and an increase in Mg2+ and K+ between pre-sowing and post-harvesting. Such a distribution was also genotype-dependent, with a higher variability for Saragolla Lucana than Anco Marzio, showing a diverging adsorption of macro-elements between the modern and ancient landrace varieties.

1. Introduction

The main goals set up by Agenda 2030 [1] involve both emerging economies and advanced countries with disadvantaged rural districts affected by social inequalities, demographic aging, and environmental degradation [2]. To cope with climate warming and food security challenges—in line with Agenda 2030—the European Commission recently presented a new strategy called “the European Green Deal” [3], a set of initiatives for the transition to a greener economy. The ambitious goal of the strategy is to make Europe the first climate-neutral continent in the world by 2050, implementing integrated actions focused on a circular economy, ecosystems and biodiversity, and transport, green, and healthier agriculture systems. Among these initiatives, the “Farm to Fork strategy” supports the shift of the focus of production from compliance to performance (with reference to farmers involved in the sustainable management of soil carbon, refined management of nutrients, and reduction of emissions) together with a containment of land abandonment, improving both socioeconomic dynamics and biodiversity sinks [4,5,6,7]. At the same time, cultivated areas have been decreasing steadily in Europe in the last decade (−0.9% between 2010 and 2019 in the EU-27). Arable land decreased by about 2.7% in 2019 compared with 2010, being at least in part replaced by woody crops, permanent meadows, and pastures [8]. An evident decline in farmland area has been observed in Italy, especially in “inner areas” (as clearly outlined in the National Strategy for Inner Areas (SNAI) [9,10] of Southern Italy, where a lack (or inadequacy) of infrastructure amplified the economic gap with Northern Italy [11]. Cereal crop surfaces decreased by 14,7% between 2010 and 2019 to just under 3.1 million hectares, determining the increased imports from the United States of America, Brazil, and Canada [12].
The Basilicata region in Southern Italy ranks third for durum wheat cultivated surfaces in Italy after Apulia and Sicily. In line with national trends, Basilicata has experienced a continuous decrease in agricultural surfaces, with a significant rate of loss especially in areas already specialized in cereal crops. Considering the last inter-census period, agricultural areas and farm numbers decreased by 10% and 34%, respectively [13]. Nearly 35% of the agricultural area of Basilicata was cultivated with cereals, of which durum wheat was the dominant crop (over 70%). Areas more devoted to cereal crops are located in the Vulture-Melfese district (northern part of Basilicata) and in the so-called Hills of Matera (southeastern part of Basilicata). Despite the inherent land abandonment, cereals maintain a strategic role in local agriculture, both in terms of surface areas and production value (nearly EUR 150 million per year [14]). The persistent decrease of land devoted to cereal production was frequently associated with lower profitability when compared with more valuable crops (e.g., vineyards, olive groves, and orchards) and moderate-to-low competitiveness of farms in Southern Italy within progressively globalized markets, where emerging products from developing countries gain market shares due to the cheaper labour costs [15]. Finally, climate change (i.e., droughts, intrinsic changes in rain seasonality, and an increase in extreme events) negatively impacted yields of different crops, including cereals [16,17,18,19,20,21]. Preserving these traditional crops by adopting economically and environmentally viable solutions means avoiding a generalized loss of income for farmers with the consequent depopulation of marginal areas. These strategies indirectly contribute to preserving landscapes against hydrogeological risks and land and water degradation, urban sprawl, as has been typical of rural communities for centuries [6,22,23,24,25,26,27,28,29,30,31,32,33,34,35].
Research may indicate possible alternatives in managing agricultural areas in a more sustainable way, contributing to preserving the environmental quality and the economic resilience of rural districts. In this vein, our study aims at evaluating the environmental fit of various agricultural practices that involve (1) the adoption of conservative tillage systems vs. conventional practices and (2) the use of modern (Anco Marzio) vs. ancient landrace (Saragolla Lucana) varieties. These findings may provide farmers with useful indications about the profitability of embracing environmentally friendly solutions (no tillage and minimum tillage) and high-quality genotypes (old landraces). To this aim, field surveys, soil laboratory analysis, and satellite image processing were implemented to characterize soil and biomass production in two sites of northern Basilicata, where both conventional and conservative agricultural practices were commonly adopted for the cultivation of durum wheat. In particular, the investigations conducted with the help of remote data provide a snapshot of the spatial patterns of high- and low-yield areas in order to make more informed decisions about agricultural management.

2. Study Area

Two areas within northern Basilicata (Southern Italy) renowned for agricultural production are studied here (Figure 1). To avoid the influence of different weather conditions in wheat growing, both conventional deep tillage (DT) and conservative agricultural practices (CP) were implemented in each site by dividing the fields into two sub-areas (see Section 3.1):
  • A DV area in the Lavello countryside, where the Anco-Marzio durum wheat variety was cultivated by implementing deep tillage and conservative no-tillage agricultural techniques;
  • A CA area in the Venosa countryside, where the Saragolla Lucana durum wheat variety was cultivated by managing the soil with conventional deep tillage and conservative ripping practices.
The tested genotype of durum wheat (Triticum turgidum spp. durum) is representative of modern (Anco Marzio) and old landrace (Saragolla Lucana) varieties. Most of the wheat flour commonly consumed derives from modern wheat varieties bred after the so-called “Green Revolution” (since late 1960s). They are characterized by the replacement of old low-yielding cultivars with more productive varieties which are generally not as tall to prevent bending and adapted to high-input agriculture [36,37].
Anco Marzio is a variety registered in 2003 (Pedigree Stot//Altar84/ALD) with a medium-early cycle, plant height of 70–80 cm, high electrolytic weight, and a low vernalization request (alternative). The average productivity is quite high (4–6 t/ha) with conventional agronomic practices and high input. Higher yields are frequently observed in the optimal agronomic contexts of Northern Italy (>8 t/ha) (National Council for Agricultural Research and Economics, former Experimental Institute for Cereal Growing, Database of Durum Wheat National Network http://qce.entecra.it/frduro/dblist3.asp, last access 24 February 2022). For pasta production, its semolina showed a high protein content and low cooking loss [38].
Saragolla Lucana is an ancient variety of durum wheat, and it was the first variety of durum wheat recovered and registered with the Italian Ministry of Agricultural, Food and Forestry Policies (MIPAAF) as a “conservation variety” in 2014 (DM 14A00355, Italian Official Gazette, GU series 22—8 January 2014). Conservation varieties are defined by the EU Directive 2009/145/EC as “the landraces or varieties of agricultural plant species which are naturally adapted to local and regional conditions and threatened by genetic erosion“ which are listed within national catalogues. At the national level, Italy has adopted this directive by providing the “Guidelines for the conservation and characterization of plant, animal and microbial genetic resources for food and agriculture” edited by the MIPAAF—Italian Ministry of Agricultural, Food and Forestry Policies in 2013.
In these guidelines, conservation varieties represent a subset of the local varieties (i.e., varieties that lack “formal” genetic improvement and are characterized by specific adaptations to the environmental conditions of the area of cultivation, such as being tolerant to the biotic and abiotic stresses of that area) and must meet the following additional requirements: “be of interest to a conservation program; be accompanied by information derived from an official examination or by inscriptions, characterizations, knowledge and other details obtained from competent authorities or organizations; not be entered in the Community Catalogue for at least two years; not be protected by either community or national property rights; be identified by the area of origin, and meet the limited DUS (Distinctness, Uniformity and Stability) requirements for those characteristics determined by technical questionnaires (Community Plant Variety Office—CPVO or International Union for the Protection of New Plant Varieties—UPOV)”. Precise requirements must also be met for the production of seeds, including the seed reproduction area.
The Saragolla Lucana variety was widely cultivated in northwestern Basilicata (especially in the municipalities of Palazzo San Gervasio, Forenza, Maschito, Banzi, Genzano di Lucania, Venosa, Montemilone, and Lavello). With the Green Revolution, it was replaced by more productive and small-sized modern durum wheat varieties. Today, these landraces are recovered thanks to the commitment of the Lucanian Cerealists Association of ancient varieties (ALCAV), the Council for Agricultural Research and Economics (CREA), and the Basilicata region. Saragolla Lucana has a medium-late cycle and is different from modern Saragolla with an early cycle, plant height of 140–160 cm, a high electrolytic weight, and a low gluten content.

2.1. Soils

Continental and marine sedimentary sequences are dominant in northern Basilicata (Figure 1). In detail, the DV study site is representative of soils developed above the recent (Olocene) terraced alluvial sediments of the Ofanto River, mainly consisting of sandy gravels and sands. According to the soil classification of the region (available at http://www.basilicatanet.it/suoli/regpedologiche.htm, last access 7 February 2022), the studied topsoils belong to shallow, poorly developed horizons that formed in flat areas at altitudes ranging from 100 to 400 m above sea level (samples from DV1 to DV6 were included in this soil classification). As for the CA site, the investigated soils (samples from CA1 to CA6) formed on the Pleistocene terraced deposits, mainly consisting of polygenic conglomerates locally embedded with sandy levels. These soils are from the top of a deep and well-developed profile in which the gravelly skeleton is abundant. In the study area, this soil type generally consolidated within sub-flat areas occurring at 230 to 700 m above sea level.

2.2. Climate

The climate of this rural district falls between two sub-groups of the Köppen–Geiger classification system: Csa and Bsk (i.e., the hot summer Mediterranean climate and the hot semi-arid climate, respectively) [39,40]. In other words, agricultural areas experience typical hot and dry summers and mild winters, while rainfall occurs prevalently in the autumn-to-winter period [41]. The daily mean air temperature and rainfall amounts for the year 2015 were derived from the weather stations of Lavello and Venosa (source: the regional network of the Agency of Development and Innovation in Agriculture (ALSIA)), which are close to the studied farms. As reported in Figure 2, the weather station of Lavello showed mean values of temperatures (15.3 °C) slightly higher than those at the station of Venosa (15.0 °C), whereas the amount of precipitation was rather similar (about 650 mm/year).

3. Materials and Methods

Laboratory and satellite analyses were used to characterize the soil matrix and vegetation patterns. The soil samples were primarily analyzed to identify significant differences in the pre-sowing soil characteristics that could affect wheat growth under deep and conservative tillage. High-resolution satellite data were elaborated to evaluate the different biomass vegetative conditions of the wheat fields with the different tillage types. Image processing and spatial analysis provided simple statistics and were carried out in a GIS environment (QGIS 3.14.15; see http://qgis.osgeo.org, last access 7 February 2022).

3.1. Sampling

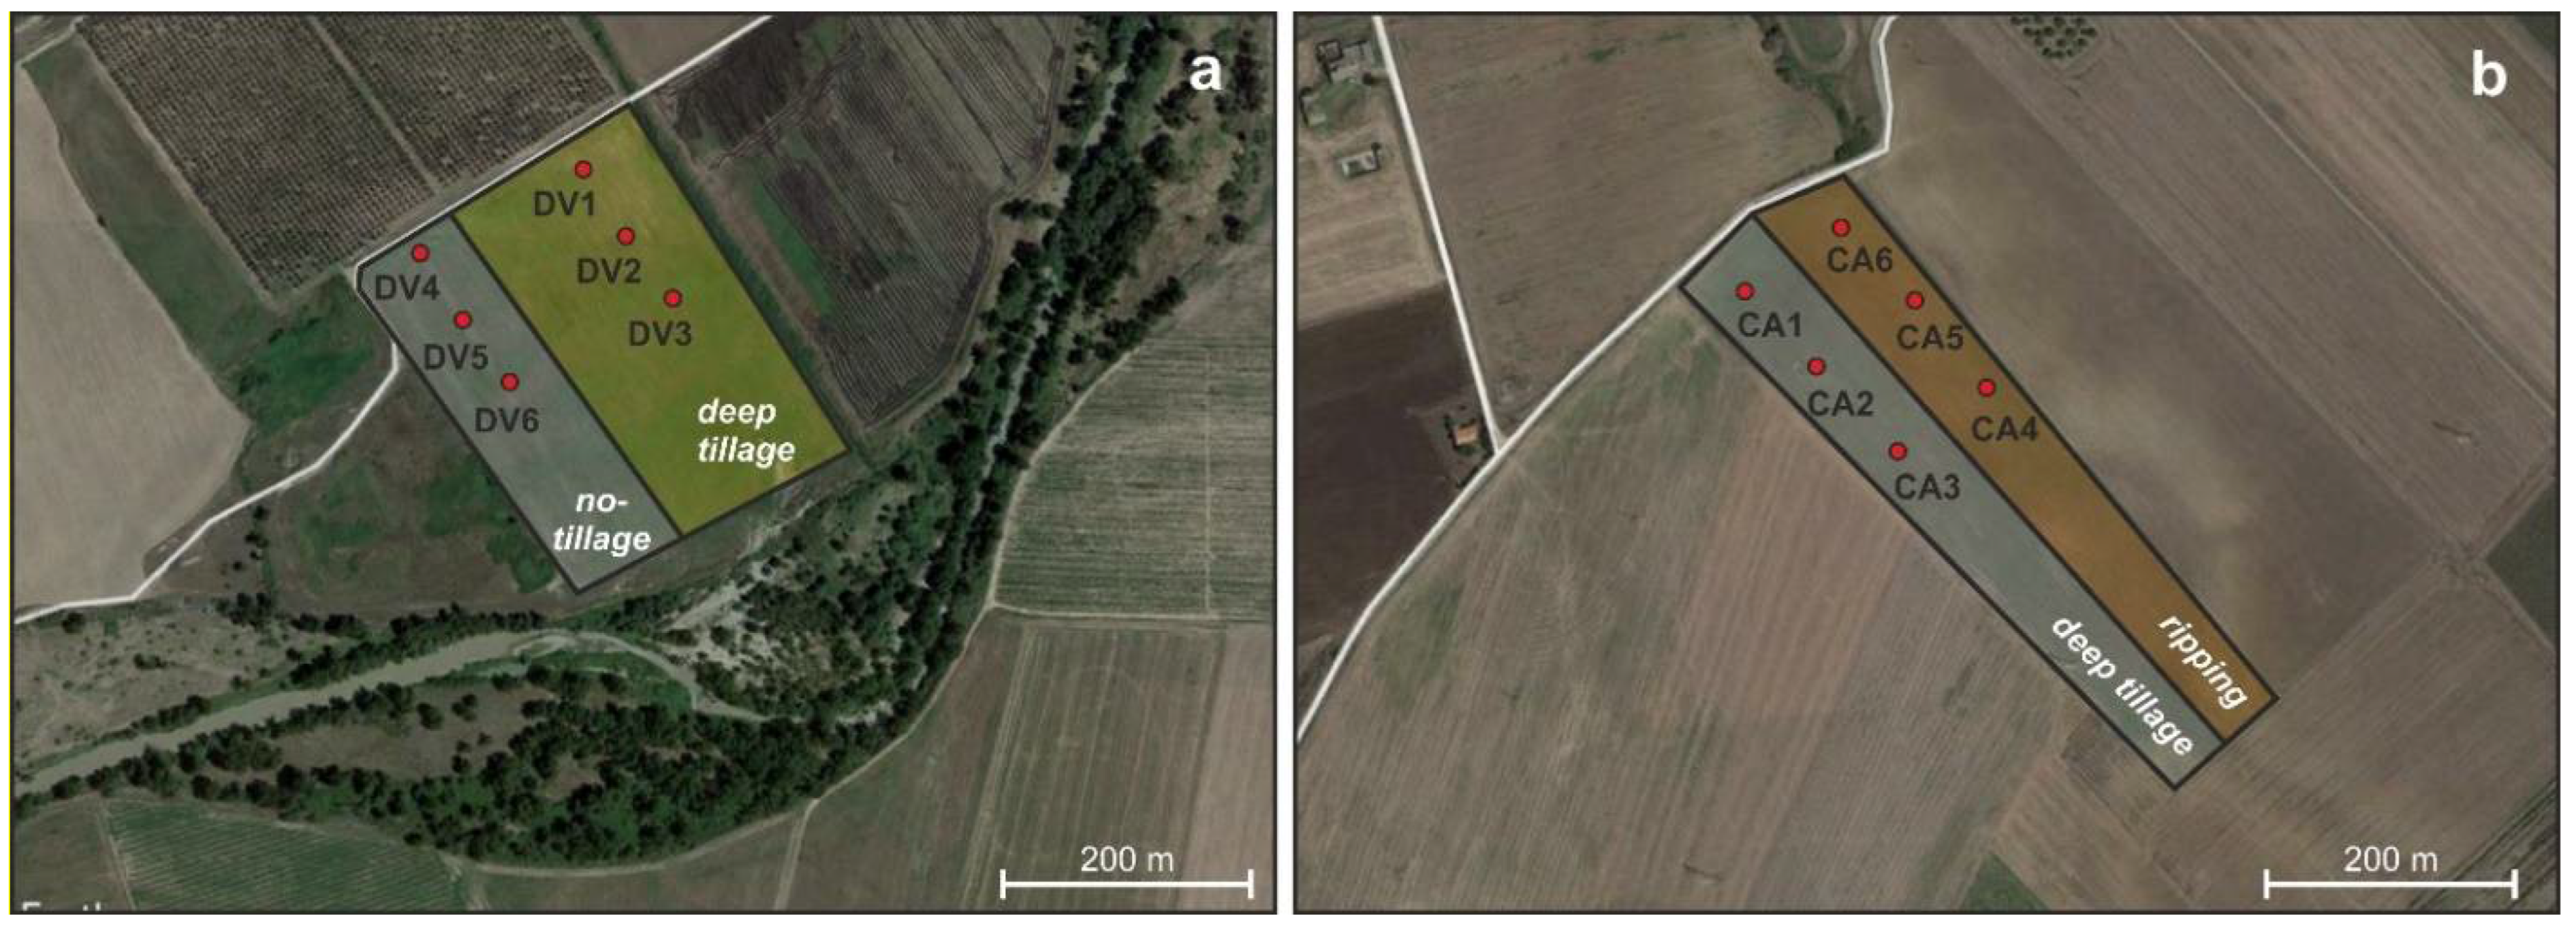
As durum wheat was planted during the autumn of 2014 and harvested in late June 2015, two fieldworks were performed in October 2014 and July 2015 to collect representative samples of the topsoil before seeding and after harvesting, respectively. During each fieldwork, six samples per area were collected (Figure 3), following a sampling scheme with 100-m long regular steps. In detail, at the DV site (Figure 3a), samples from DV1 to DV3 were taken from the soils managed with deep tillage, and samples from DV4 to DV6 were from a soil under conservative practice (no tillage;). Similarly, at the CA site (Figure 3b), CA1–CA3 samples were collected from a deep tillage soil, and the CA4–CA6 samples were representative of a conservative practice (ripped soil).

3.2. Grain Size Analysis

Granulometric analysis was carried out on all samples with the aim of detecting the percentage of grain size fractions composing the studied soils. The wet sieving and fractioned sedimentation methods were accomplished following the pretreatment and treatment activities described by Summa [42]. About 30 g of each sample was selected by quartering and then subjected to analysis. The wet sieving method was performed by using American Society for Testing and Materials (ASTM) standard sieves for the separation of the >2 mm and from 2 mm to 63 µm grain size fractions. Particles with diameters less than 63 μm were separated by fractioned sedimentation based on Stokes’s law and divided by siphoning in the following fractions: 63–2 μm and <2 μm. During the settling time, flocculation, linked to the presence of colloidal particles in the samples, was avoided by the additional dilution of the sample in distilled water or by using a few drops of NH3 as a deflocculating substance.

3.3. Mineralogical and Physical-Chemical Analysis

The mineralogical characterization of soils was carried out by means of X-ray diffraction analysis (XRD) of both the powdered bulk samples and <2 µm fractions. A Rigaku D/MAX-2200/PC diffractometer equipped with Cu Ka radiation, a secondary monochromator, and a sample spinner was used for the analyses at the Laboratory of Medical and Environmental Geology of the Institute of Methodologies for the Environmental Analysis of the Italian National Research Council (IMAA-CNR). Randomly oriented powders were used for the XRD analysis of the bulk, and oriented aggregates were used for the XRD analysis of the <2 µm fractions. Following a consolidated method [43,44], four types of oriented aggregates (air-dried, solvated with MgCl2, solvated with ethylene glycol overnight at 60 °C, and heated at 375 °C for 8 h) were analyzed and compared for the identification of clay minerals. Diffraction data were recorded between 2° and 70° 2θ for the bulk powders and between 2° and 33° 2θ for the <2 µm fractions. The mineral phase identification was realized by means of Winfit software [45]. The full-width half maximum (FWHM) and the peak areas of the principal diffraction peaks were also measured to quantify the mineralogical phases [46]. The characterization of mixed-layer clays was accomplished by following the Moore and Reynolds procedure [43].
The physico-chemical analyses of soils were aimed at the determination of the pH, electrical conductivity (EC), and contents of the main soluble and exchangeable cations (such as Mg2+, Ca2+, Na+, and K+). The pH and EC values were obtained, conducting measurements of a suspension following a formal methodology (Italian Law no. 79, 11 May 1992, “Official methods of soil chemical analysis”). The cation concentrations were detected by inductively coupled plasma optical emission spectrometry (ICP-OES) using a Varian Vista-MPX spectrometer at the IMAA-CNR laboratories. ICP-OES was performed on supernatants resulting from the soil/water suspensions (4 g of sediment dispersed in 40 mL of distilled water) after mechanical shaking (12 h), centrifugation (4000 rpm for 30 min), and filtering (with Whatman® Grade 40, Ashless filter paper). An additional pre-treatment with ammonium acetate instead of distilled water was also carried out on all samples following the procedure suggested by Chapman [47]. The cation contents were used to calculate the geochemical indices, including the cation exchangeable capacity (CEC), exchangeable sodium percentage (ESP), exchangeable calcium percentage (ECP), exchangeable magnesium percentage (EMP), and exchangeable potassium percentage (EPP), which were suitable to assess the water–rock interaction processes affecting the soil matrix [23,48,49].

3.4. Satellite Data Analysis

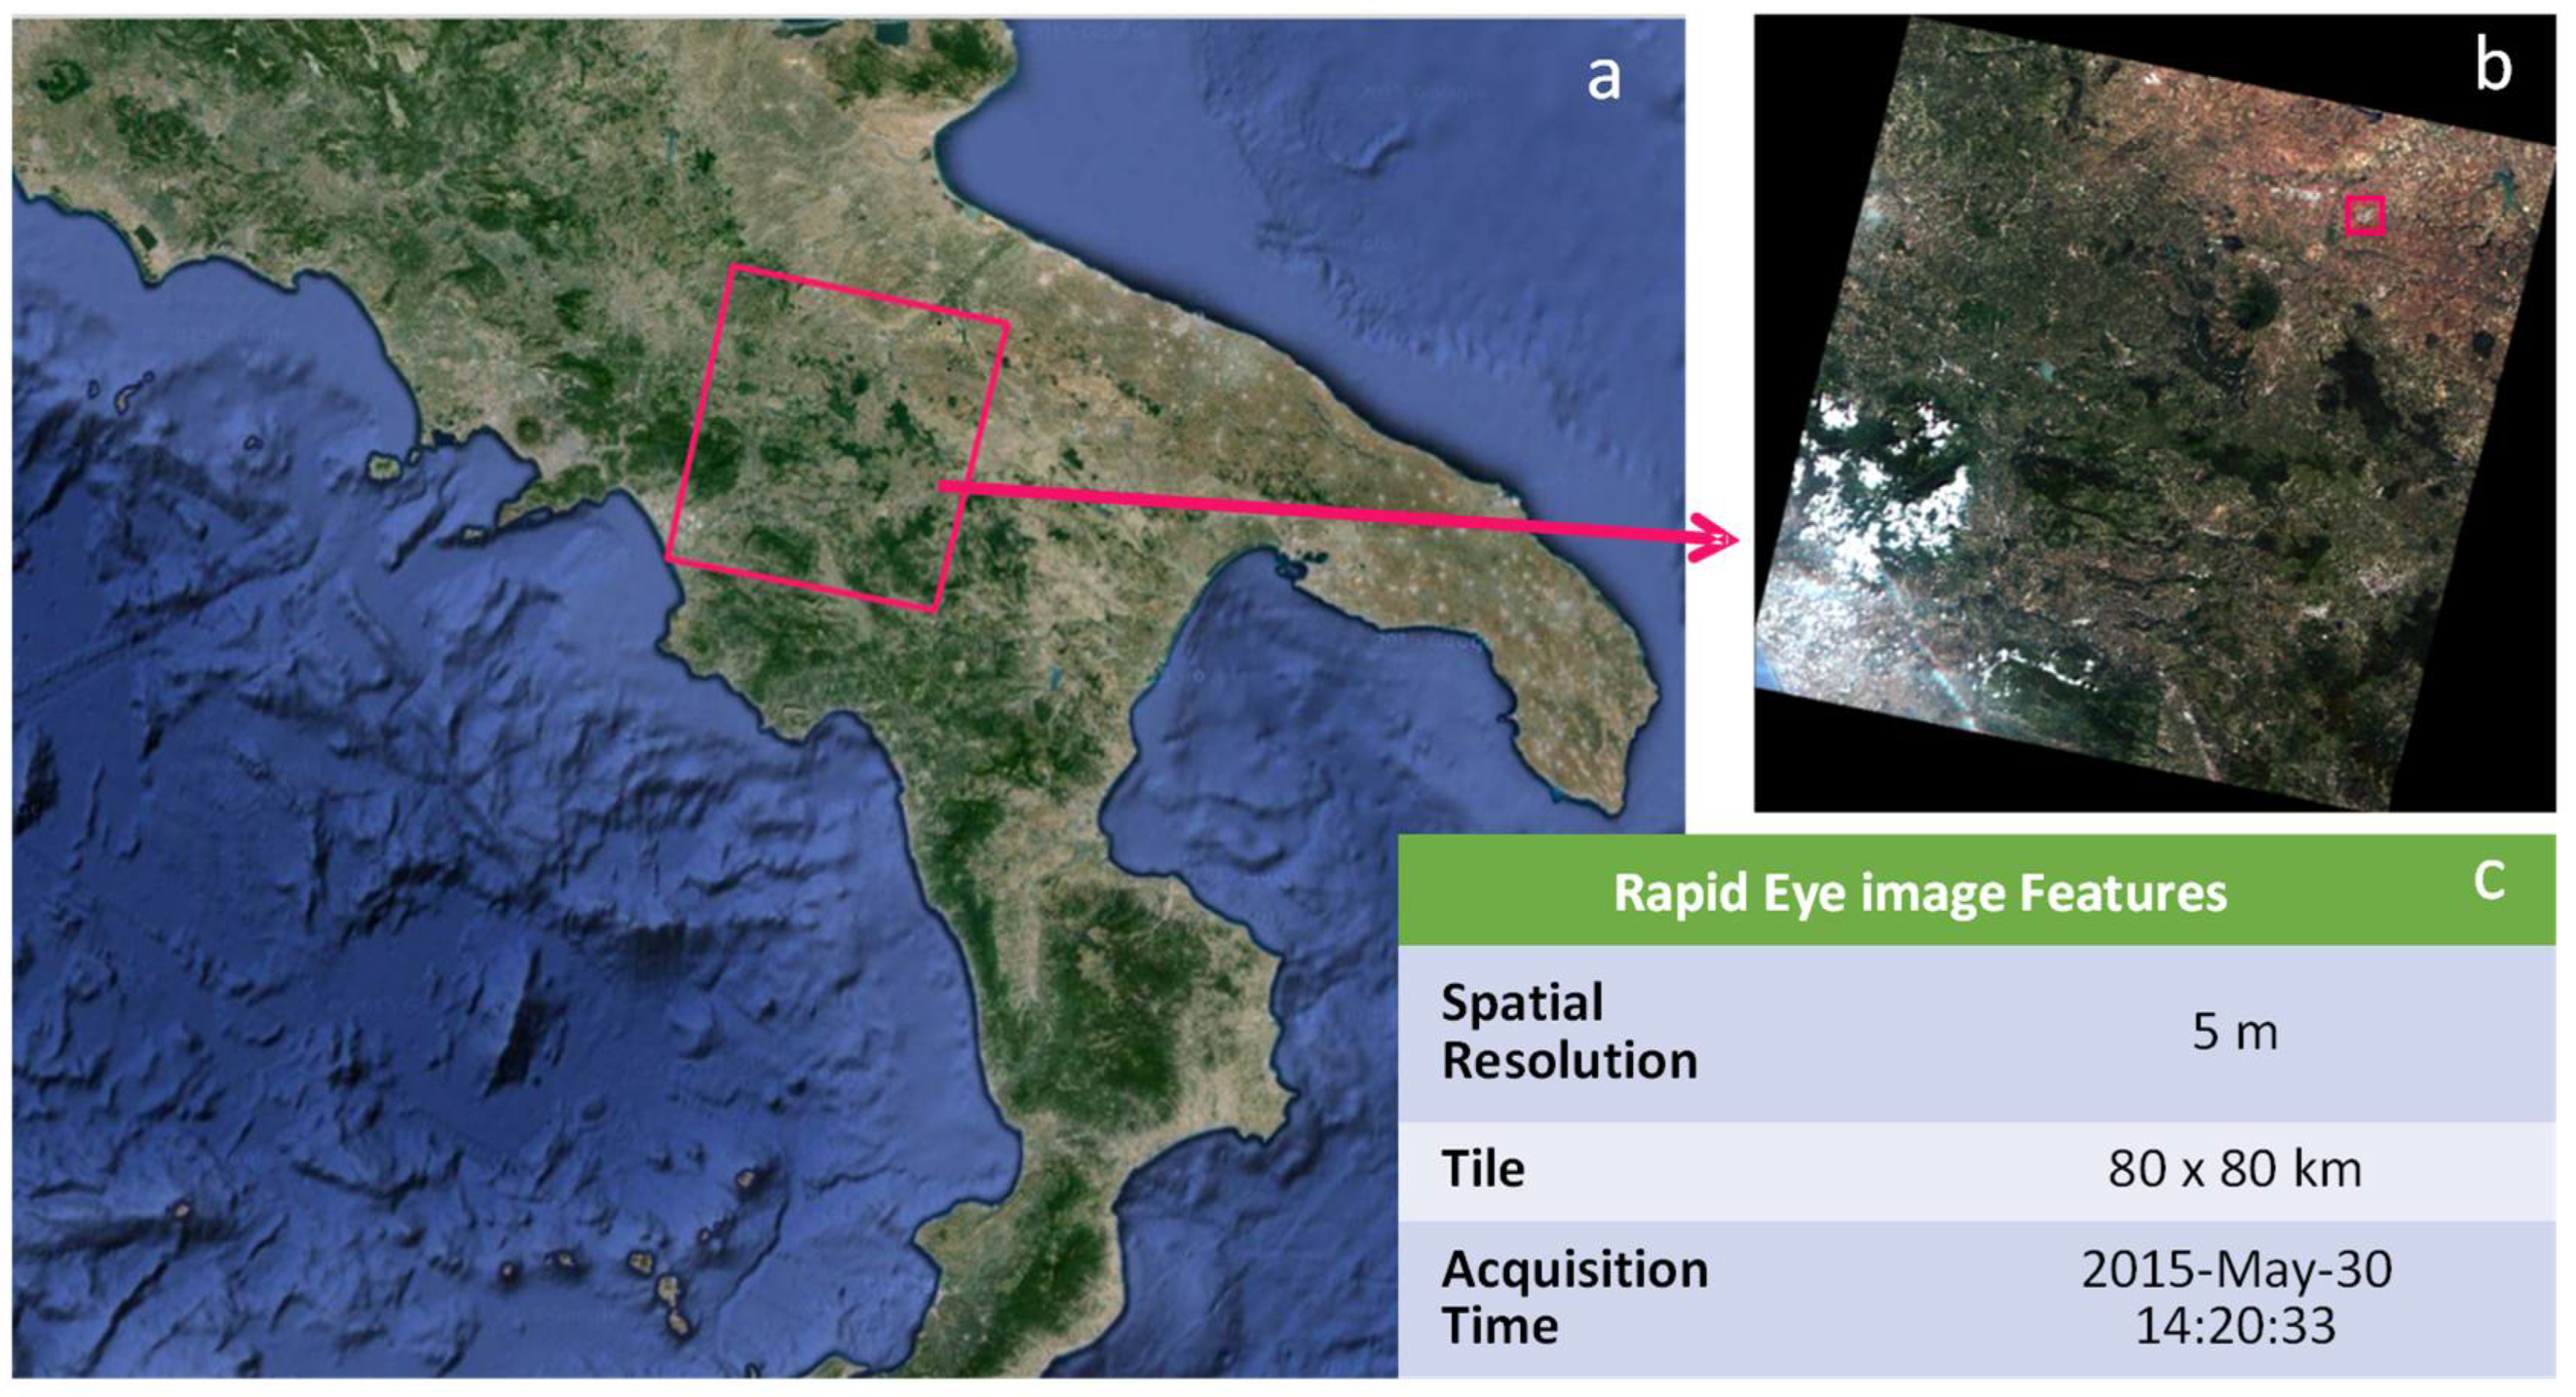
To analyze the wheat plant biomass, a high-resolution RapidEye image, taken when it was cloud-free over the study areas, was acquired on 30 May 2015 during the top peak of the phenological stage of the cereal crops in the examined fields. The peak occurs in correspondence with the earing and flowering phases of the wheat (phases 7 and 8 in Figure 4). The characteristics of the acquired satellite image and the corresponding tile are shown in Figure 5.
RapidEye is a constellation of five satellites providing imagery at 630 km in sun-synchronous orbit, each of them carrying an identical multispectral push broom imager. RapidEye was the first commercial imagery (available since August 2008) to supply an individual band in the red edge wavelengths (Figure 6), which is linked to critical crop parameters such as chlorophyll content, biomass, and water content. Actually, RapidEye data have been conceived mainly for use in agriculture and forestry [50,51].
The RapidEye sensor acquires from the visible to the near infrared wavelengths in five spectral bands as follows: B1 = blue (B), 440–510 nm; B2 = green (G), 520–590 nm; B3 = red (R), 630–685 nm; B4 = red edge (RE), 690–730 nm; and B5 = near infrared (NIR), 760–850 nm.
A radiometrically corrected and orthorectified (application of Toutin’s orbital model with 10–12 ground control points and the nearest neighbor resampling method) product (orto_3d_ATM product) was used in the WGS84 projection system at UTM zone 33 north with a 5-m pixel size. To estimate the biomass production and compare the wheat vegetation characteristics of the two sites, the multispectral RapiEye bands were combined to obtain various vegetation indices. A vegetation index is a linear (or nonlinear) combination of reflectance at different wavelengths to enhance or reveal specific and normally hidden information about vegetation (see, for example, [52]) starting from correctly preprocessed images [53]). Depending on the used spectral bands, some indices were correlated to the presence of particular chemical pigments (e.g., chlorophylls, carotenoids, or anthocyanins), other indices were correlated to the moisture content of the covers, and the remaining ones were correlated to the vegetation vigor and density. They were analyzed directly as proxy (surrogate) variables or adopted to implement models (mainly based on empirical regression techniques) for monitoring vegetation cover characteristics (see, for example, [54]).
For the purpose of this study (i.e., the evaluation of two diverse management regimes (conventional vs. conservative) and varieties (modern vs. ancient landrace)), we used vegetation indices as proxy variables to compare the plant vigor, biomass production, and chlorophyll content of the analyzed wheat fields. Based on these premises, we adopted the Normalized Difference Vegetation Index (NDVI) [55] and its Red-Edge NDVI version, considered to be reliable proxies for vegetative status evaluating plant biomass in natural [51] and agricultural ecosystems [52,56,57,58] and identifying vegetation stressed by soil contaminants [59,60,61] or meteo-climatic factors [62,63,64,65]. As they are sensitive to the level of photosynthetic activity, the biomass production refers to live mass residing above ground and able to implement the photosynthesis process. Additionally, for wheat plants, they showed a high correlation with the aboveground plant biomass and biomass vigor (see, for example, [66,67,68]). In addition, the NDVI acquired in the wheat flowering stage also had good correlation with the final yield [69]. The former index was estimated by adopting RapidEye bands 3 and 5 (RED and NIR), whereas bands 4 and 5 (RED-edge and NIR) were combined as follows for the latter index:
NDVI = ( NIR RED ) ( NIR + RED )   NDVIre = ( NIR REDedge ) ( NIR + REDedge )
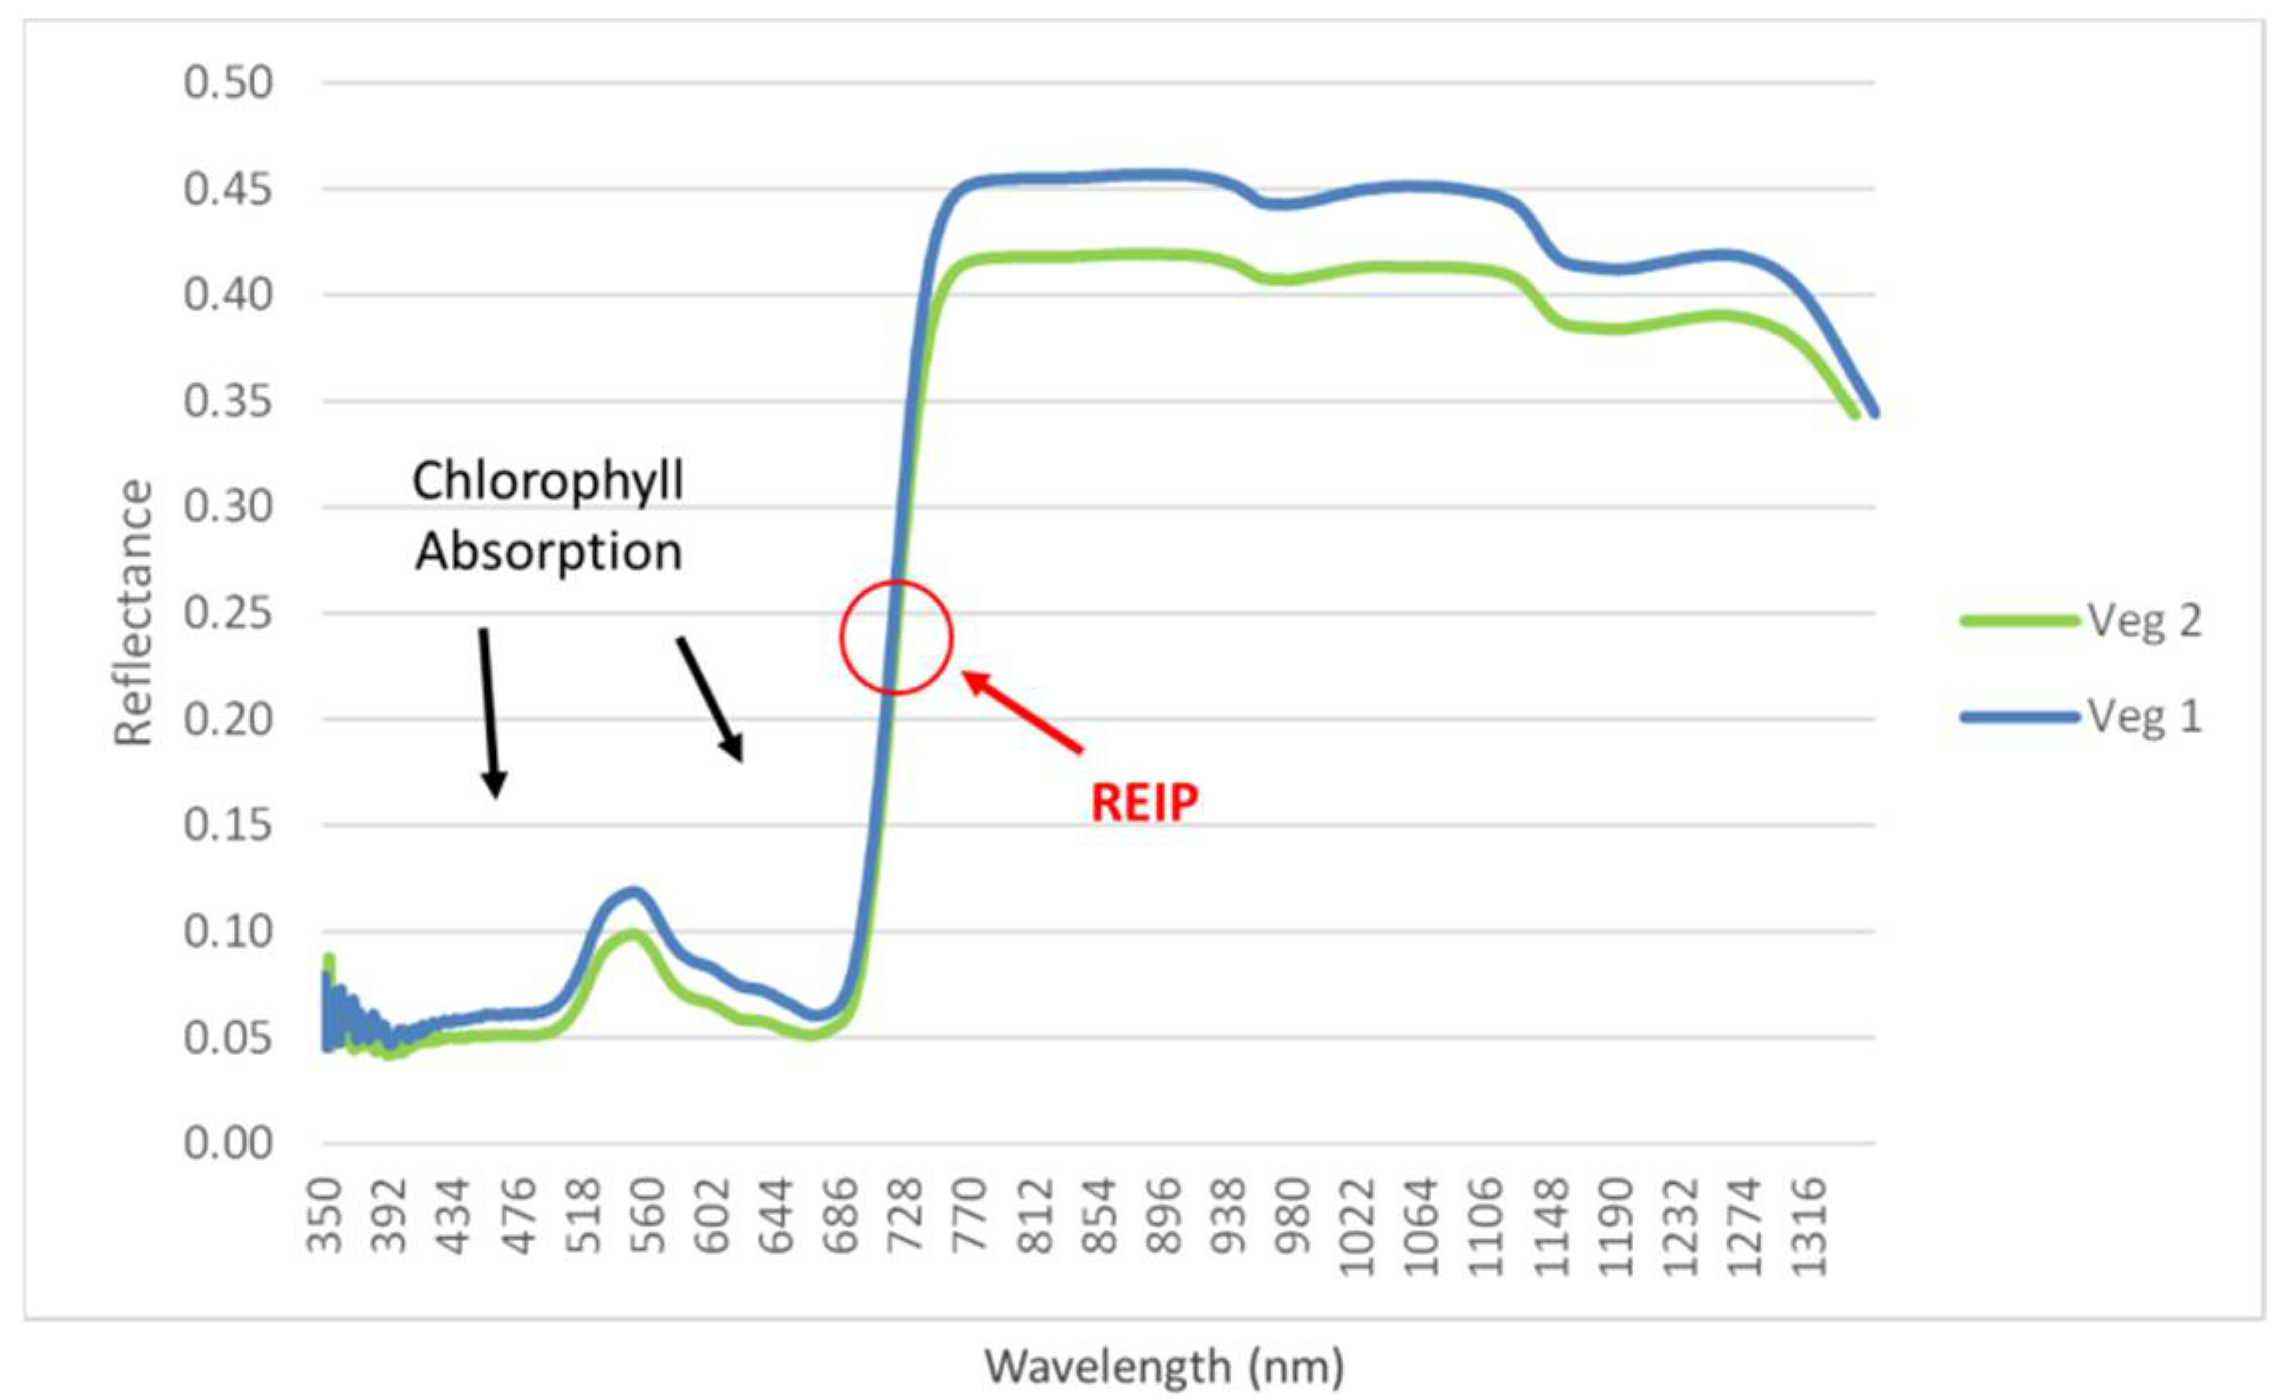
NDVIre was proposed to increase the sensitivity to the chlorophyll content and minimize the effects of a dense canopy [57]. Chlorophyll, as with other pigments, absorbs light at the blue and red wavelengths, whereas the scattering due to a leaf’s internal structure occurs in the NIR region. Thus, the red edge inflection point (REIP, Figure 7) was considered the optimal indicator of the chlorophyll content since it defined the limit of chlorophyll absorption. Indices based on the REIP were devised for sensors with very narrow bands. Even if the ted edge band (B5) of RapidEye was too wide to precisely identify the inflection point and estimate the chlorophyll content, it was proven to be useful for biomass estimation in the presence of high values of the leaf area index (LAI) because it reduced the saturation effect [57,68].
Chlorophyll is a proxy for the nitrogen content in crops, and for that, it has a crucial role in estimating crop yields by considering that the nitrogen-based fertilizers are costly inputs for agricultural management. Identifying the real needs of nitrogen-based fertilizers in farms has both an economic and an environmental scope. On the one hand, the use of unnecessary additional inputs is avoided, obtaining yields with minor costs. On the other hand, water degradation connected with an excessive intake of nitrogen due to runoff from treated soils is avoided [70]. To estimate the chlorophyll content in the analyzed crops by using a broad band sensor such as RapidEye, the Modified Chlorophyll Absorption Ratio Index (MCARI) [71] was elaborated upon as a modified version of the original chlorophyll absorption ratio index (CARI [72]), adapted from narrow to broad bands based on the following formula:
MCARI = [ ( ρ 700 ρ 670 ) 0.2 ρ 700 ρ 550 ) ] ( ρ 700 / ρ 670 )
In addition, we adopted the Modified Triangular Vegetation Index-1 (MTVI-1) as a proxy for the biomass density [73], and it was calculated as follows:
MTVI 1 = 1.2 [ 1.2 ( ρ 800 ρ 550 ) 2.5 ( ρ 670 ρ 550 ) ]

4. Results

4.1. Compositional Features of Soils

4.1.1. Grain Size Distribution

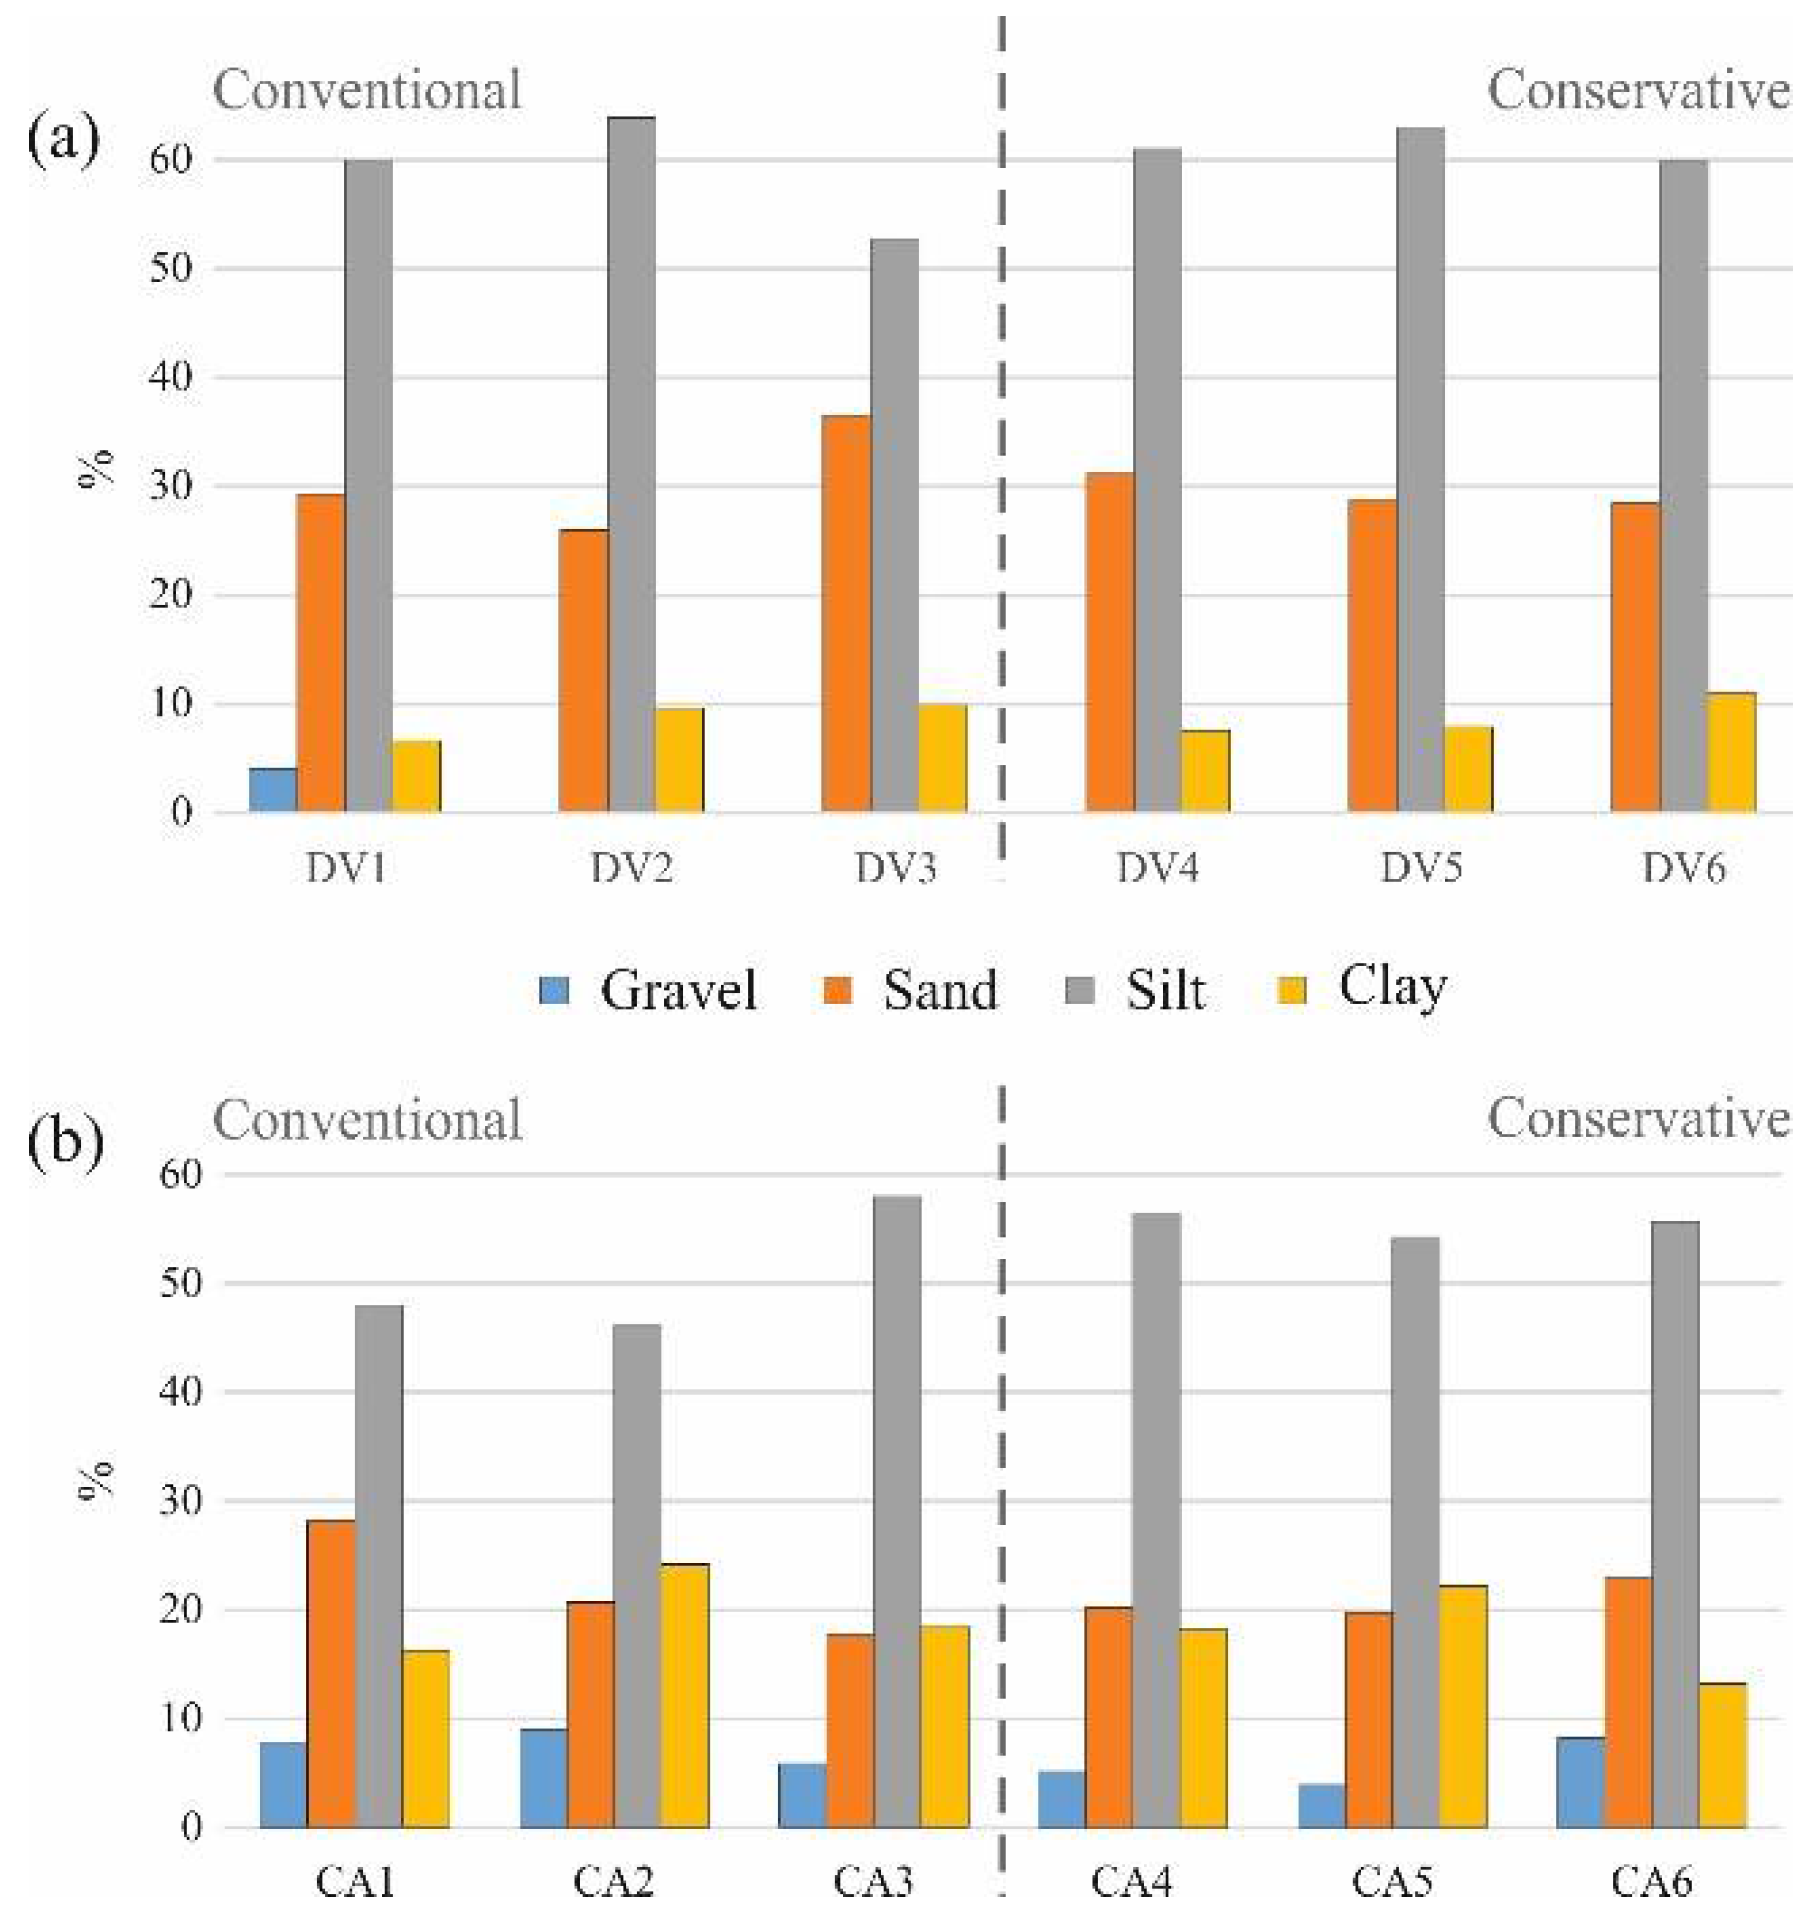
The results of the granulometric analysis revealed no significant differences in the pre-sowing conditions between the soils under conventional or conservative tillage practices. A very poor gravel component (4% in DV1 only) was characteristic of the DV samples (Figure 8a). Among the other grain size fractions, the silty one was the most abundant, with contents varying in a range between 53% and 64%. As for the sandy and clayey fractions, values ranged from 26% to 37% and from 7% to 11%, respectively. Based on this composition and following the Italian Geotechnical Society (AGI) classification criteria [74], the DV soils were classified as weakly clayey and sandy silt.
The granulometric composition of the CA soil samples differed from that of the DV samples mainly because of their higher amounts of gravel and clay components (Figure 8b). In the CA soils, the gravel content fluctuated from 4% to 8%, and the clay amount was stable in the range of 13–24%. The sand and silt fractions showed contents varying between 18% and 28% and from 46% to 58%, respectively. Such a grain size distribution suggests that the CA soils were made up of weakly gravelly, sandy, and clayey silt [74] that mirrored the lithological characters of the geological bedrock. No significant differences aere found between the soils devoted to conventional (deep tillage) and conservative (ripping) management. The grain size distribution did not represent an element inducing differential growth of wheat plants while comparing the two types of management practices in the respective sites.

4.1.2. Mineralogy

The XRD results suggest that the investigated soils had a similar mineralogical composition mainly consisting of phyllosilicates, quartz, calcite, plagioclase, K-feldspar, and dolomite. In all the samples, phyllosilicates were the most abundant mineralogical phases, with contents close to (or higher than) 50% of the total composition. Among carbonates, calcite was the prevalent mineral, while dolomite was observed in trace amounts. Quartz, plagioclase, and K-feldspar completed the mineralogical association without significant differences among the analyzed samples, both between the sites and between the tillage practices (Table 1).
The analysis performed on the <2-µm specimens documented how the investigated samples were characterized by a fine fraction mainly composed by expandable interlayered illite/smectite minerals, whose amounts were higher than those of the clay minerals and phyllosilicates such as illite, chlorite, and kaolinite. Different from the DV soils, only traces of chlorite and kaolinite were detected in the CA site.

4.1.3. Geochemistry

Based on the laboratory measurements of the pH and EC parameters and following the soil classification proposed by the United States Department of Agriculture [75], pre-seeding soils were classified as weakly alkaline (DV site) with a mean pH = 8.2 and quite neutral for the CA site, showing a mean pH = 7.7. By grouping the samples according to tillage practice (Table 2), the soils for conservative practice (CP) had mean pH values marginally higher than those devoted to conventional deep tillage (DT) which, in turn, had a wider pH variability (6.8–8.3). Similar to the pH, the electrical conductivity of the CP soils was generally higher than those recorded for the DT soils (641 vs. 280 µS/cm), but in this case, the CP soils showed a higher EC variability (ΔEC 575 µS/cm). The highest values were found in the DV sites, where no-tillage conservative practices were adopted. In particular, we found these values to be 898 µS/cm in DV4 and 703 µS/cm in DV6 (see Figure 3 for the sampling scheme). In the second sampling (i.e., after harvesting), the difference in pH (CP vs. DT) slightly increased due to a pH reduction in the DT soils (mean values from 7.9 to 7.3). Conversely, the EC was generally reduced in all the samples in soils managed with both conservative and conventional tillage practices.
By using ICP-OES analysis, the concentrations of Mg2+, Ca2+, Na+, and K+ in the investigated samples were the base of the (geo)chemical indexes delineating the most relevant geochemical properties of the investigated soils [76,77]. When comparing the data that refer to the two samples (before seeding vs. after harvest) and the tillage types (conservative vs. conventional), only a few changes of exchangeable cations were observed, although constant values for the CEC were detected. As shown in Figure 9, among the exchangeable cations, Ca was always the most exchangeable element, followed by Mg, K, and Na. The pre-sowing distribution of interchangeable cations was very similar for soils managed with conventional and conservative practices. Therefore, this ensured no influence on the availability of macronutrients for the cultivation of wheat plants within the subzones managed with the two different tillage practices.
The post-harvesting contents of the alkaline and earth alkaline cations were basically constant in the conservative soils, whereas they proved to be more variable in the conventional ones. The ECP decreased in conventional soils, whereas the EMP and EPP showed the reverse pattern. Such a behavior is explained by the higher absorption of Ca and lower absorption of Mg and other macro-nutrients, as shown by Pandino et al. [78] in durum wheat in conventional vs. conservative practices in Sicily. Such a behavior is dependent on the genotype [79], as confirmed by our results, where the reduction in ECP was higher for Saragolla Lucana (decreasing range in CA samples: 10–30%) than for Anco Marzio (decreasing range in DV samples: 2–10%) for the same conventional practice (deep tillage).

4.1.4. Remote Sensing

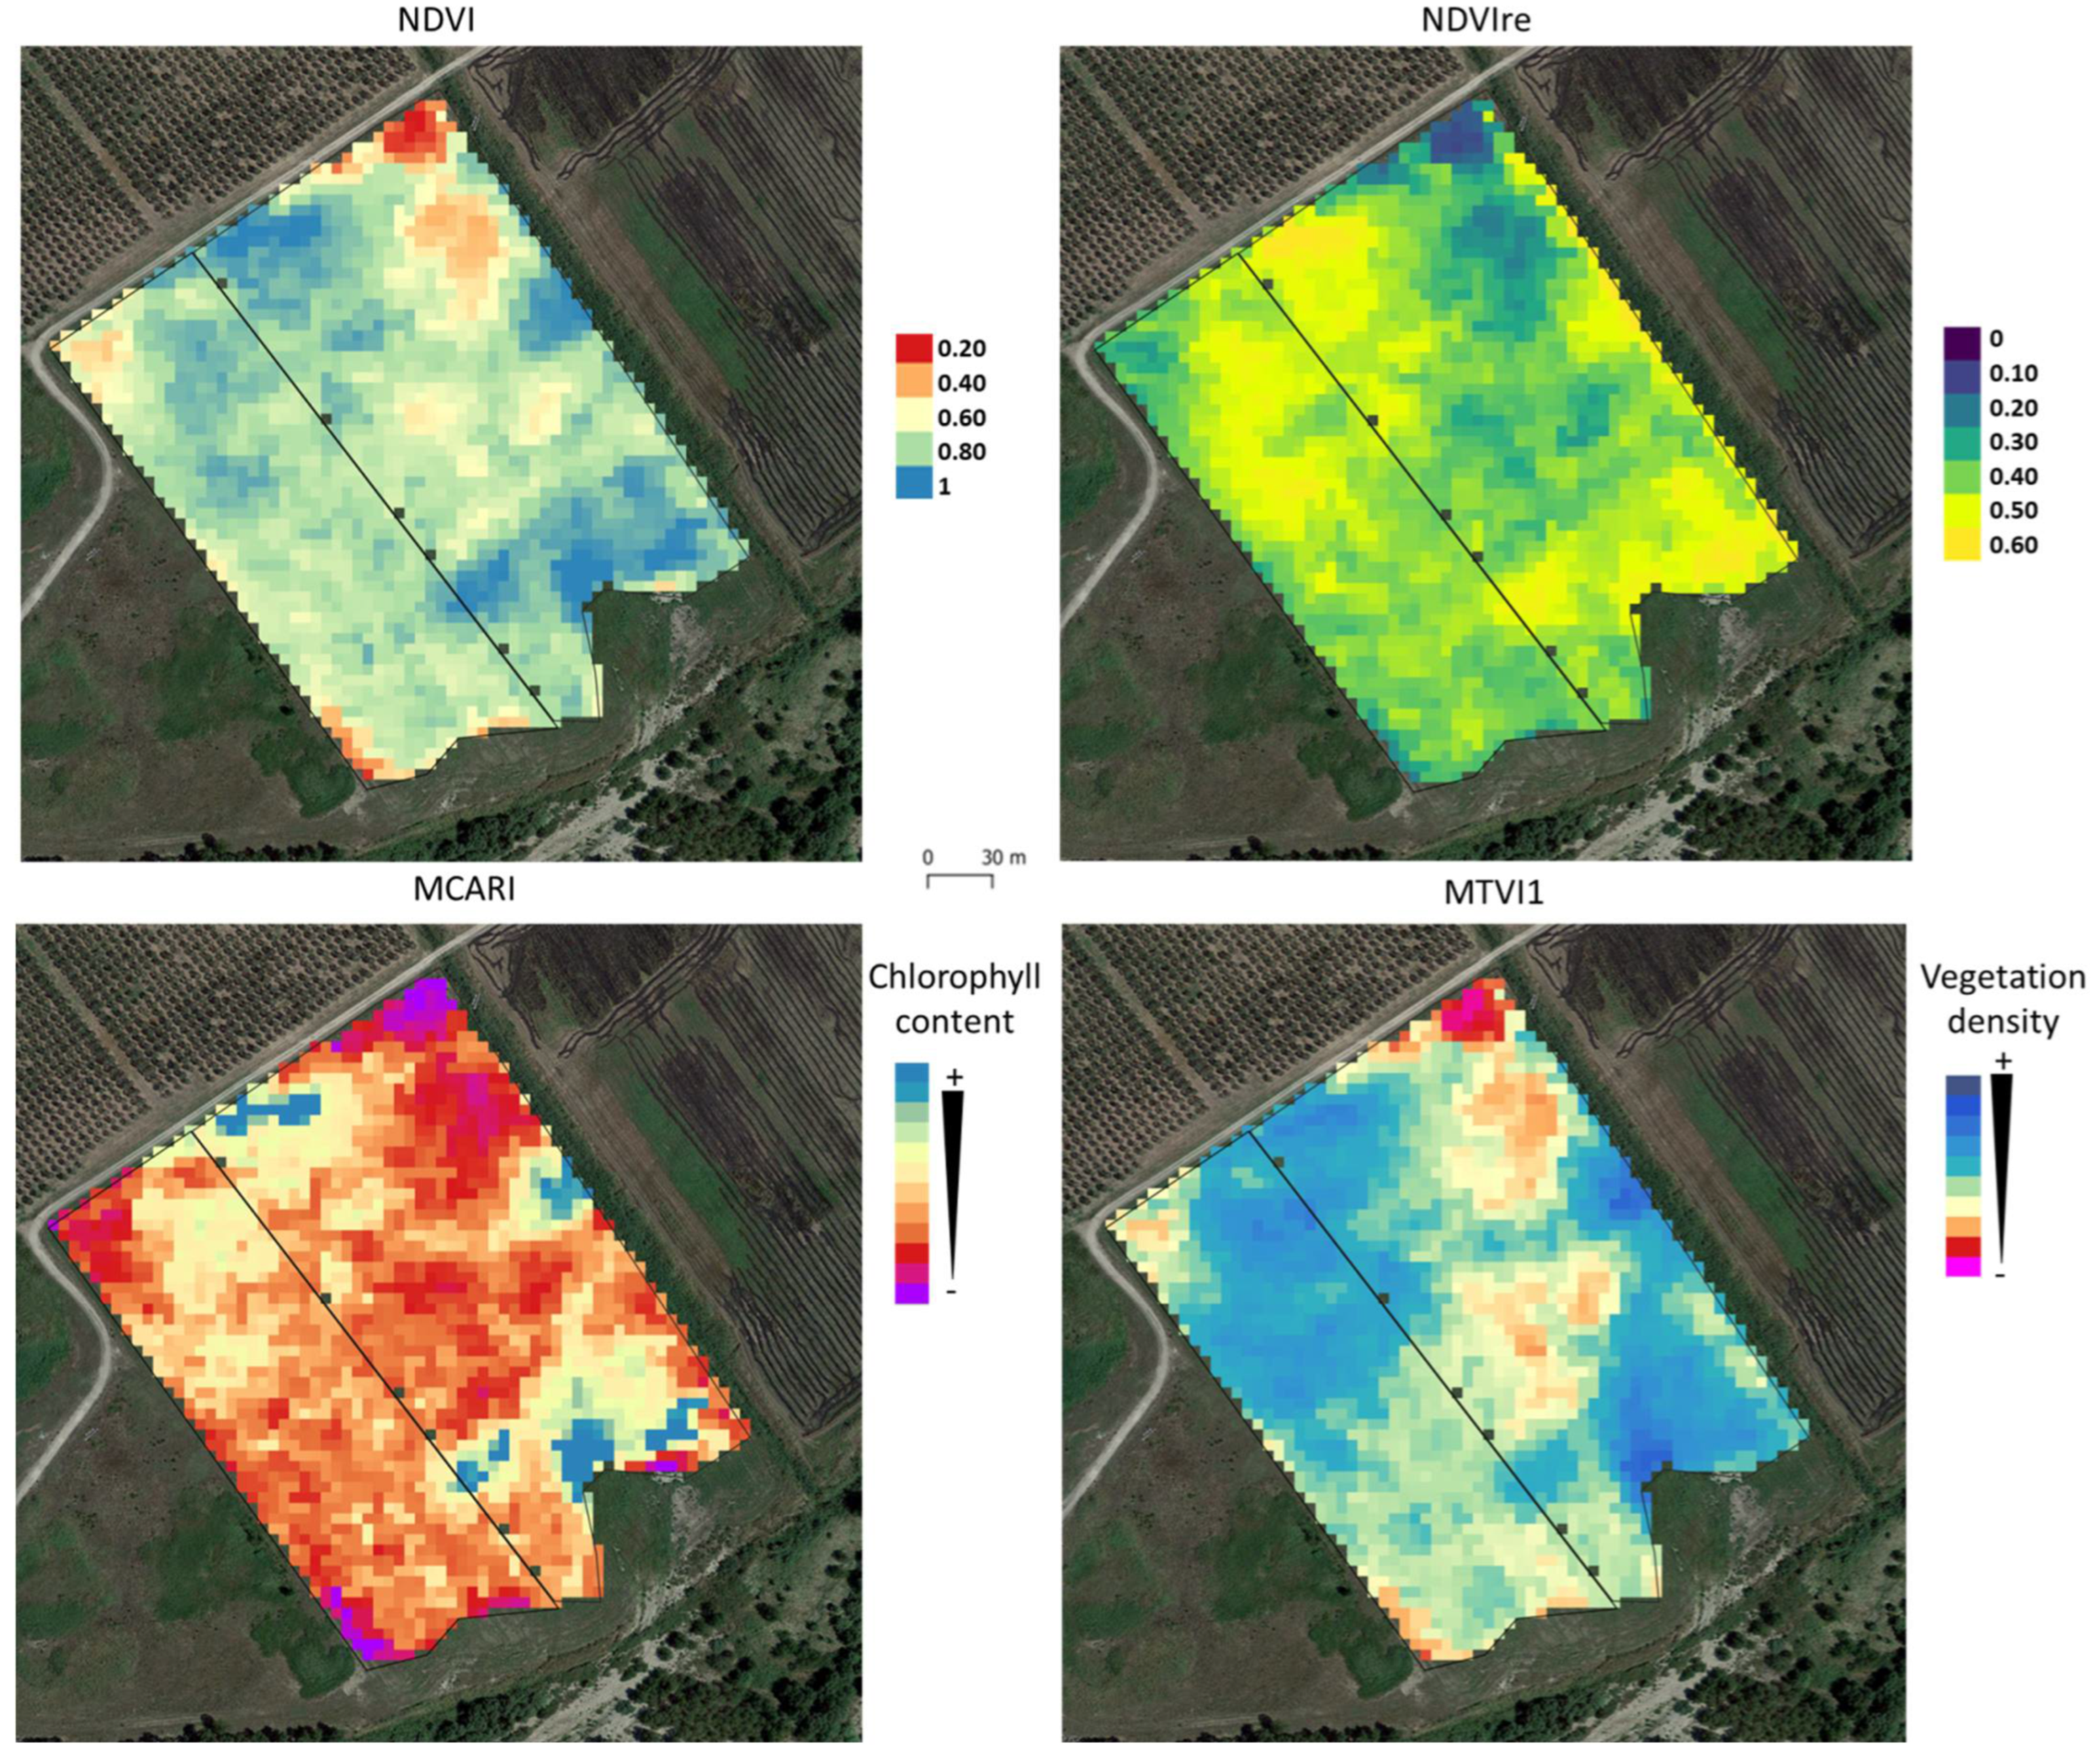
The NDVI, NDVIre, MCARI, and MTVI-1 maps clearly outlined the differentiation of crop growth in the DV and CA study sites and within the specific sub-areas (Figure 10 and Figure 11). Such variability profiles can be associated with different health states or phenological development stages and can be in turn associated with important factors of both human and natural origins, such as sources of seeds, the speed of the wind, sunshine, and air temperature. For the DV study site (Figure 10), all the biophysical variables showed heterogeneous phenological patterns. The values of each index were medium-high in both sub-areas (conservative and conventional tillage management). However, the NDVI, NDVIre, and MTVI-1 maps showed areas with low values mainly localized in the deep tillage side (especially on its border side and particularly marked around the upper-right corner). In these areas, low-density crop vegetation corresponding to low NDVI and MTVI-1 values was present. This was mainly linked to poor accessibility to the edge areas for agricultural machines, determining a sub-optimal distribution of the seeds during sowing. Similarly, in these areas, the MCARI showed low chlorophyll levels.
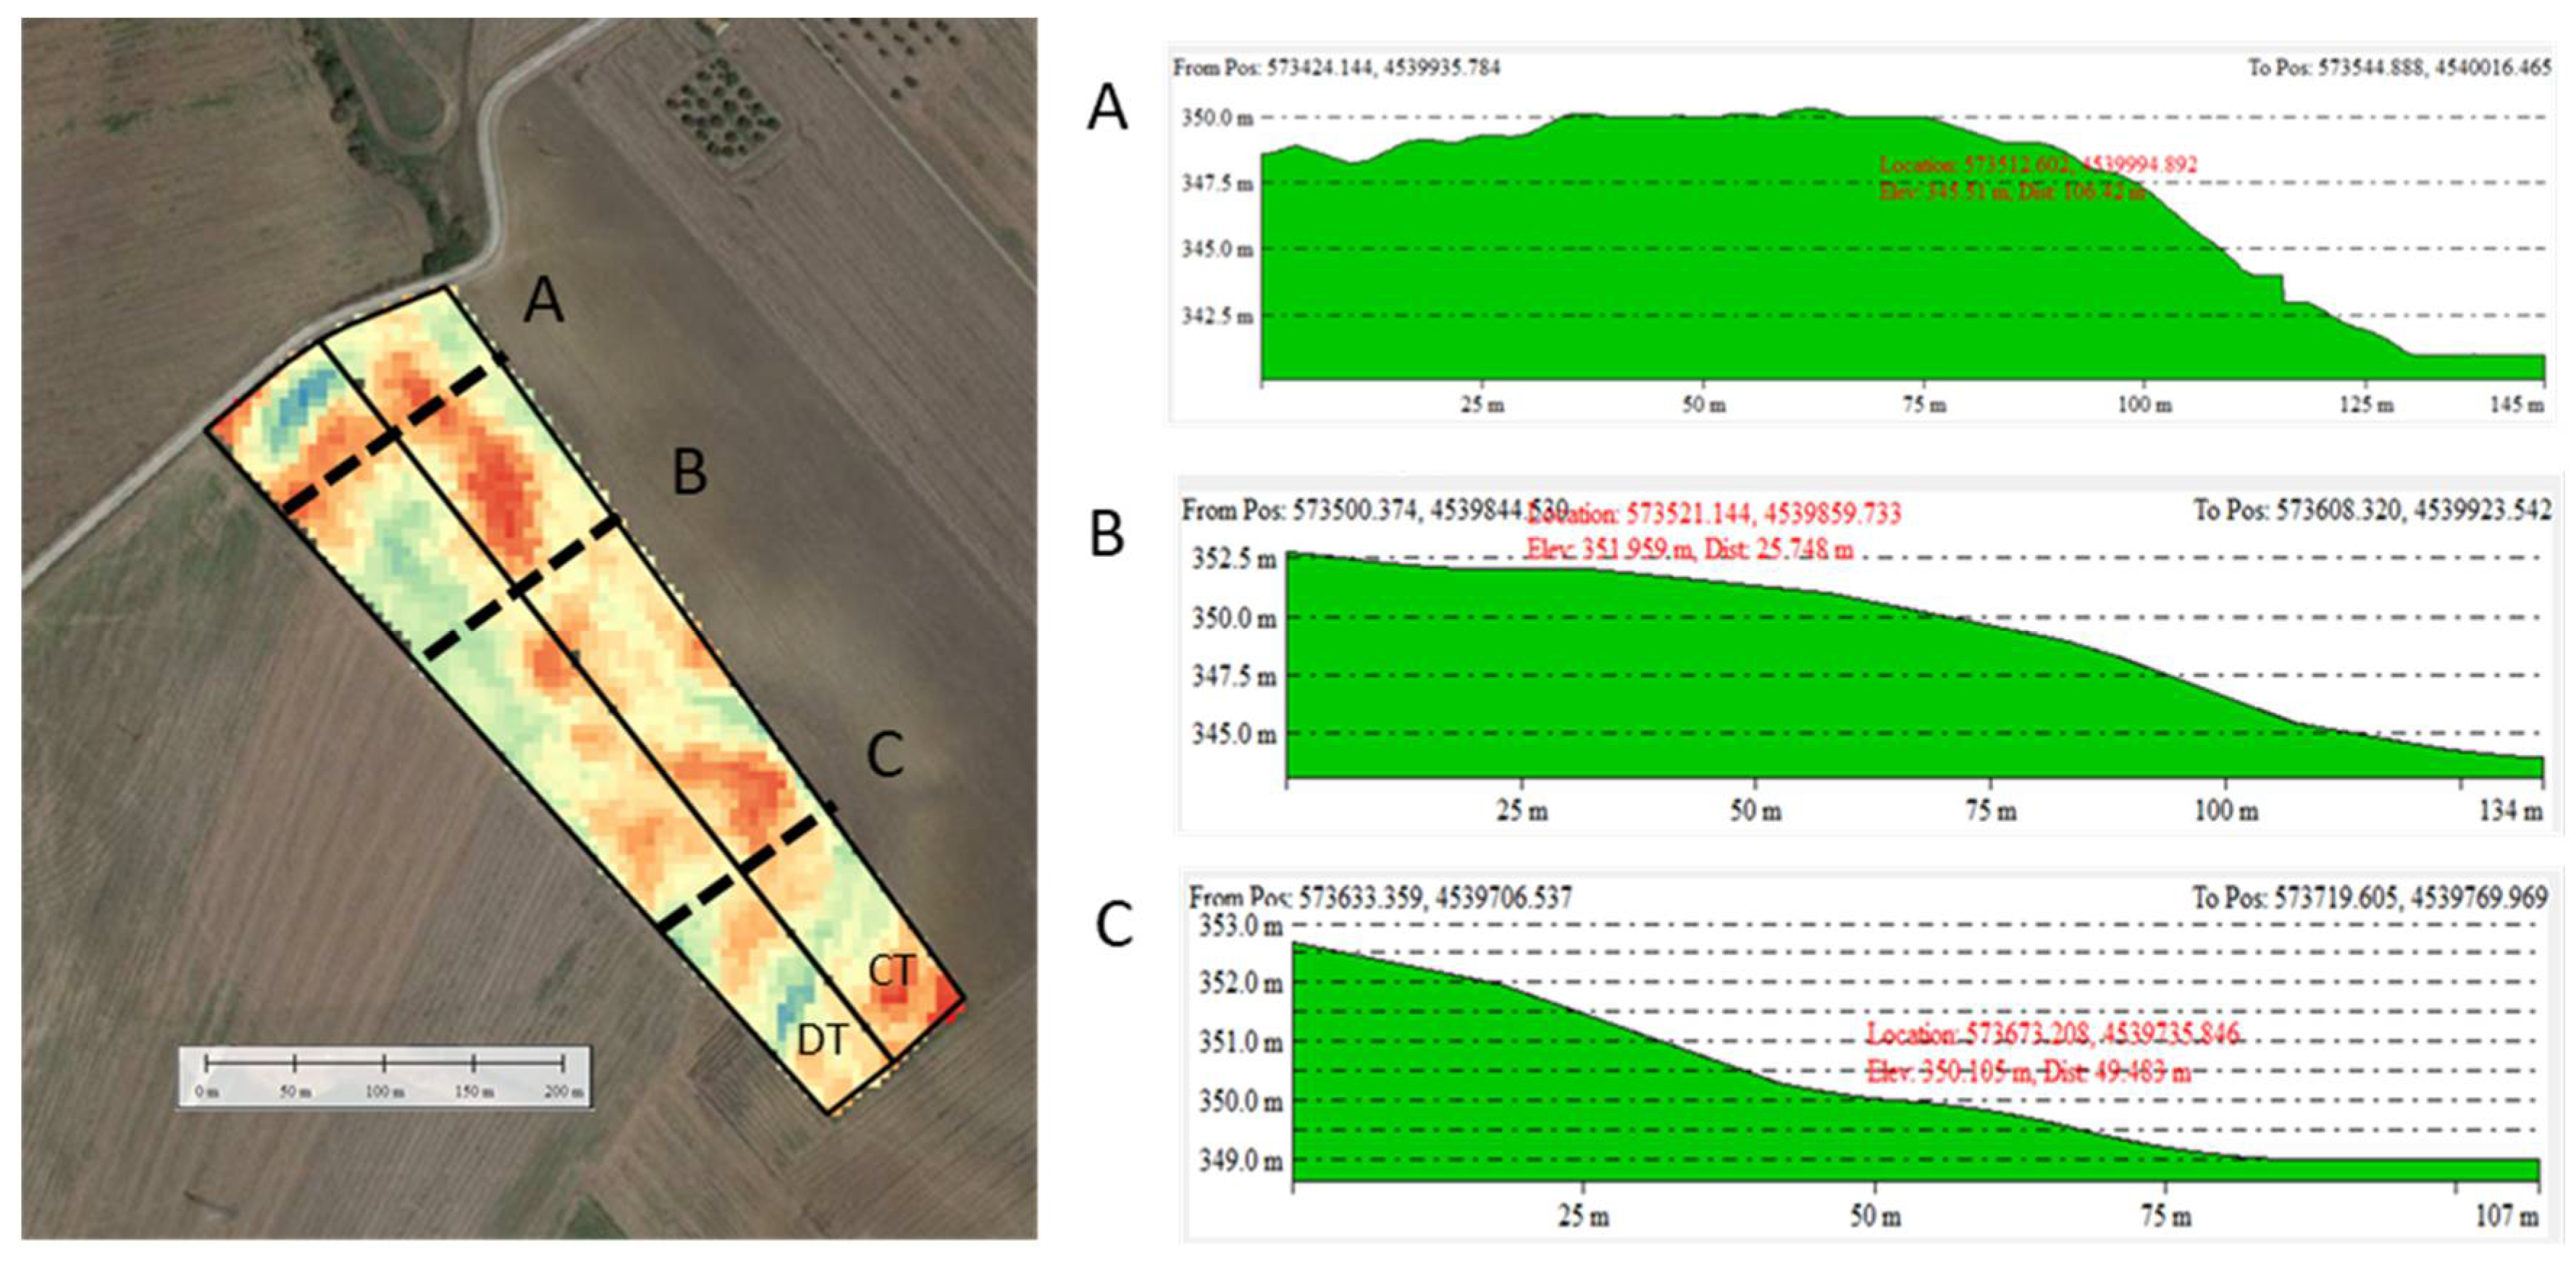
In the CA site, where the ancient variety (Saragolla Lucana) was planted, the NDVI, NDVIre, and MTVI-1 maps showed similar spatial patterns with heterogeneous values that were typically lower than in the DV site with the modern variety (Anco Marzio) (Table 3). The NDVI mean was <0.6 in CA and >0.75 in DV. Similarly, the NDVIre mean was <0.40 in CA and >0.40 in DV. These lower values in CA were particularly intense in the chlorophyll proxy map (MCARI < 20,000, with very few exceptions in the sub-area managed with deep-tillage; see Figure 11). Within the CA site, the sub-area under conservative ripping practice was characterized by an average crop density lower than the values in the deep tillage sub-area (NDVI difference of ~12%), documenting the presence of some environmental constraints. Similarly, the other indices delineated reduced values for the chlorophyll content and biomass production (Table 4). In such a case, these results may be associated to the irregular topography of the study area (Figure 12). The areas with very low NDVI, NDVIre, and MTVI-1 values were concentrated in the “upstream areas” and along the line circumscribing the two parcels.
For the DV study area with the modern Anco Marzio variety, the sub-area managed with conventional deep tillage had higher (~3%) average values for the NDVI and NDVIre compared with the untilled sub-area. This similarity in the mean values of the indices for the differently managed sub-areas originated from two different conditions. On the one side, the sub-area under deep tillage was more heterogeneous (from very low to very high scores), with the corresponding values of the vegetation indices fluctuating largely over time, while the sub-area under no tillage was more homogeneous, reaching medium-high values for the indices on average. Such behavior was also clearly identifiable in the map of the MCARI.
For the CA study area, the differences between the mean values of the adopted remote sensing indices were more evident when comparing the two management approaches (up to approximately −47% for the MCARI in favor of conventional practices; see Table 4). Compared with conservative practices, the conventional deep tillage sub-area reached the highest values for the NDVI (0.96 vs. 0.86), the largest range (0.70 vs. 0.62), and the highest variance (0.018 vs. 0.014), reflecting a greater heterogeneity typical of micro-conditions underlying such a practice.
As noted above, the biomass production in the DV site was substantially higher than in CA site, highlighting a greater production of Anco Marzio durum wheat with respect to Saragolla Lucana. Both the NDVI and NDVIre showed higher mean values for DV compared with CA (Figure 13). Within each site, the vegetative performance in soils managed with conventional deep tillage was higher than those obtained with conservative practices (~8%; see Table 4 for the other indices). Productivity data provided by the farmers (2.2 t/ha for conventional practices vs. 1.8 t/ha for conservative practices at the DV site and 2.0 t/ha for conventional practices vs. 1.4 t/ha for conservative practices at the CA site) confirmed the gap found with the satellite-derived vegetation indices between conventional and conservative tillage practices. Differences in the yields between tillage management types (conservative lower by about 0.5 t/ha than conventional) were in agreement with those found in Southern Italy [78,80] and, more specifically, in the close Collina Materana (Hills of Matera) district [81].
The obtained grain yields also supported the difference in biomass production found between the two sites, with a reduced amount of grain in CA for the landrace with respect to the modern varieties in DV for both conservative and conventional practices. The difference in favor of the modern Anco Marzio variety amounted to +0.2 t/ha for conventionally managed fields and increased up to +0.4 t/ha in the case of fields managed with conservative practices (Table 5).
Conversely, the difference (irrespective of site and variety) in the satellite-based biomass production for the three evaluated tillage practices (deep tillage, no tillage, and minimum tillage (i.e., soil ripping)) was not proportional to the grain yield (NDVI values for conventional deep tillage in CA were lower than conservative no tillage in DV). Such performances highlight a genotype dependency (lower vegetation indices for the Saragolla Lucana in CA than Anco Marzio in DV) together with an evident micro-climate influence and prove to affect durum wheat production in Southern Italy [79,82]. In particular, Saragolla Lucana with its medium-late cycle (contrary to the medium-early cycle of Anco Marzio) could not have already reached the phenology peak at the date of image acquisition, showing lower values for the vegetation indices.
Use of a REDedge band for analysis at the aggregate levels of biomass productivity did not add more specific information. The RapidEye REDedge band (B4) provided lower NDVI values (vs. RED B3) with a similar response pattern (Figure 10 and Figure 11). Conversely, in the assessment of spatial heterogeneity of the wheat vegetative status, the NDVI map based on the RED band showed a higher variance (mean of sub-areas = 0.014) compared with the map based on REDedge (mean of sub-areas = 0.005). However, such a higher variability induced the saturation of some pixels on the map of the standard NDVI (mainly in the DV area, about 3%), as highlighted for crops with dense canopies such as maize and soybeans [57,83]. Therefore, the usefulness of the REDedge band from sensors with broad spectral acquisitions such as RapidEye was strictly analyses-dependent for crops with a reduced canopy density, such as durum wheat.

5. Discussion

This study evaluated the performance of a modern (Anco Marzio) and ancient landrace (Saragolla Lucana) variety of durum wheat (Triticum turgidum spp. durum) by adopting conventional deep tillage and environmentally sustainable practices. The empirical results documented a higher biomass production and vegetative vigor, as well as higher grain yields in soils managed with conventional deep tillage compared with farms adopting conservative practices, as is generally found in the first years from the adoption of conservative techniques [84]. Higher yields with conservation practices are usually reached over the long term thanks to the improvement of soil conditions. However, other studies have shown a variability in yield performances between wet and dry years, with an advantage to conservative practices in dry conditions [81,85,86,87].
The vegetation indices derived from the RapidEye optical imager suggest that for low-density canopy cultivations (such as durum wheat), the adoption of sensors with narrow spectral acquisitions in the REDedge band (e.g., on emerging UAV sensors for field assessment [88,89]) is useful for assessing the spatial heterogeneity of the vegetative status. The use of a hyperspectral satellite such as PRISMA with a high signal-to-noise ratio [90,91] is more appropriate for large-scale assessments.
Although the empirical survey was carried out over a 1-year field campaign, the results of exchangeable macro-nutrients showed a reduction in the ECP in soil managed with conventional deep tillage and an increase in the EMP. Similar results were obtained for durum wheat in Sicily, where the comparison between conventional versus conservative practices showed a higher absorption of Ca and lower absorption of Mg and other macro-nutrients [78]. In addition, the observations of a pool of Italian durum wheat varieties showed a significant influence from environmental factors [82] and the wheat genotype [79] on the concentration of mineral elements. Our findings are in agreement with the genotype dependence hypothesis. With the same conventional practice (deep tillage) and distribution of exchangeable cations in the soils before seeding, the comparison of pre-sowing and post-harvesting showed a reduction in the ECP which was higher for Saragolla Lucana (10–30%) than for Anco Marzio (<10%). Other studies also showed a genotype dependency for micro-nutrients, where conservative managements for durum wheat cultivation (Claudio and Saragolla varieties) had the higher values of Fe, Mn, and Zn [78]. Further investigations are required to better define the genotype dependency for biomass production and vegetation vigor derived from satellite data. Some differences in rainfall distribution during the grain-filling period (less homogenous rainfall in CA vs. DV) and in granulometric composition (higher amounts of gravel and clay components in CA vs. DV) could have also influenced the yields in the two sub-areas managed with the same tillage practice [92,93].
The grain yields do not support the adoption of conservative practices, even considering the reduction in production costs (less labor hours, fuel, and fertilizers). For the same agricultural campaign (2014–2015), a study of farms specialized in durum wheat cultivation with conventional tillage, minimum tillage, and no tillage in an area close to our study sites (Collina Materana) documented a negative cash flow for all the tillage systems in the absence of CAP payments, with minor losses for no tillage in an area [81]. Moreover, in a 3-year assessment, the no-tillage cash flow became the most economically viable, as the grain yield was demonstrated to be more stable in rainfall variability.
Use of the traditional landrace Saragolla Lucana may support differentiated farm strategies in highly competitive and demanding markets. Thanks to globalization and the homogenization of food and fiber products, consumers are becoming more and more demanding of higher quality, safe, and tasteful (traditional) goods [94,95]. Consumers associate tradition with native varieties of durum wheat and recognize traditional pasta made from landrace varieties worthy of higher economic value [96]. Before the COVID-19 pandemic hit, the EU food industries were already subject to changing consumer behaviors, and these emerging trends—the Farm to Fork strategy and the general awareness of the need for a higher degree of sustainability and healthy and nutritious food—are forcing suppliers to adapt [97].

6. Conclusions

The implementation of more systematic field sampling is necessary to identify the best agronomic practices for the Saragolla Lucana variety, aimed at diversifying productions and increasing local competitiveness. As stated by the United Nations Development Programme (UNDP), the current COVID pandemic offers a tremendous opportunity for reaching the 2030 Agenda and the Sustainable Development Goals (SDGs). The FAO estimates for global wheat production in 2020–2021 have been valued at 776 million tons, which is 2.1% above the previous year’s production. Wheat trade is forecasted to further expand by 1.8 percent in 2021–2022 [98]. An increase in agricultural areas for the sowing of cereals is expected in Italy [99]. Together with more general evidence concerning the importance of traditional farming, these trends delineate a fundamental opportunity to support the choice of economical and environmentally sustainable agronomic practices that reinforce the resilience of rural districts. Wide-ranging practices are especially needed in terms of both agricultural techniques and landraces and may bridge the gap in crop yield between conventional practices and modern wheat varieties.

Author Contributions

Conceptualization and methodology, T.S. and V.S.; performed soil samples in the field V.S., M.D., V.I. and R.C.; analysis of in situ data, V.S. and R.S.; analysis of satellite data, V.I., T.S. and R.C.; writing—original draft preparation, R.C., R.S., V.I., T.S. and V.S.; writing—review and editing, R.C., R.S., L.S., T.S., V.I. and V.S.; funding acquisition, T.S. All authors have read and agreed to the published version of the manuscript.

Funding

This study is part of a broader project called “REACT—Rivisitazione e validazione di conoscenze tradizionali per la conservazione del suolo nelle aree cerealicole lucane (Reinterpretation and validation of traditional knowledge for soil conservation in Lucanian cereal areas)”, funded by the Rural Development Programme—European Agricultural Fund for Rural Development (PSR FEASR) Basilicata 2007–2013.

Institutional Review Board Statement

Not applicable.

Informed Consent Statement

Not applicable.

Data Availability Statement

The data presented in this study are available on request from the corresponding author.

Acknowledgments

We would thank the Lucan Agency of Innovation and Development in Agriculture (ALSIA) for providing the meteorological data.

Conflicts of Interest

The authors declare no conflict of interest. The funders had no role in the design of the study; in the collection, analyses, or interpretation of data; in the writing of the manuscript, or in the decision to publish the results.

References

  1. Colglazier, W. Sustainable development agenda: 2030. Science 2015, 349, 1048–1050. [Google Scholar] [CrossRef]
  2. Giannakis, E.; Bruggeman, A. Regional disparities in economic resilience in the European Union across the urban–rural divide. Reg. Stud. 2020, 54, 1200–1213. [Google Scholar] [CrossRef]
  3. European Commission. The European Green Deal; Communication from the Commission to the European Parliament, The European Council, The Council, The European Economic and Social Committee and The Committee of the Regions; European Commission: Brussels, Belgium, 2019. [Google Scholar]
  4. Latocha, A.; Szymanowski, M.; Jeziorska, J.; Stec, M.; Roszczewska, M. Effects of land abandonment and climate change on soil erosion—An example from depopulated agricultural lands in the Sudetes Mts., SW Poland. CATENA 2016, 145, 128–141. [Google Scholar] [CrossRef]
  5. Quaranta, G.; Salvia, R.; Salvati, L.; Paola, V.D.; Coluzzi, R.; Imbrenda, V.; Simoniello, T. Long-term impacts of grazing management on land degradation in a rural community of Southern Italy: Depopulation matters. Land Degrad. Dev. 2020, 31, 2379–2394. [Google Scholar] [CrossRef]
  6. Salvia, R.; Quaranta, G. Place-based rural development and resilience: A lesson from a small community. Sustainability 2017, 9, 889. [Google Scholar] [CrossRef] [Green Version]
  7. Bajocco, S.; Ceccarelli, T.; Smiraglia, D.; Salvati, L.; Ricotta, C. Modeling the ecological niche of long-term land use changes: The role of biophysical factors. Ecol. Indic. 2016, 60, 231–236. [Google Scholar] [CrossRef]
  8. Database—Eurostat. Available online: https://ec.europa.eu/eurostat/web/main/data/database (accessed on 28 April 2021).
  9. Lucatelli, S. La strategia nazionale, il riconoscimento delle aree interne. Territorio 2015, 74, 80–86. [Google Scholar] [CrossRef]
  10. Basile, G.; Cavallo, A. Rural identity, authenticity, and sustainability in Italian inner areas. Sustainability 2020, 12, 1272. [Google Scholar] [CrossRef] [Green Version]
  11. Carlucci, F.; Cirà, A.; Forte, E.; Siviero, L. Infrastructure and logistics divide: Regional comparisons between North Eastern & Southern Italy. Technol. Econ. Dev. Econ. 2017, 23, 243–269. [Google Scholar] [CrossRef] [Green Version]
  12. ISTAT—Italian National Institute of Statistics. 2020. Available online: https://www.istat.it/en/ (accessed on 7 February 2022).
  13. Statistiche Istat. Available online: http://dati-censimentoagricoltura.istat.it/Index.aspx (accessed on 28 April 2021).
  14. Istat.it—9° Censimento Industria e Servizi 2011. Available online: https://www.istat.it/it/censimenti-permanenti/censimenti-precedenti/industria-e-servizi/imprese-2011 (accessed on 28 April 2021).
  15. Salvati, L.; Serra, P. Estimating rapidity of change in complex urban systems: A multidimensional, local-scale approach. Geogr. Anal. 2016, 48, 132–156. [Google Scholar] [CrossRef]
  16. Caloiero, T.; Veltri, S.; Caloiero, P.; Frustaci, F. Drought analysis in Europe and in the Mediterranean basin using the Standardized Precipitation Index. Water 2018, 10, 1043. [Google Scholar] [CrossRef] [Green Version]
  17. Coluzzi, R.; Fascetti, S.; Imbrenda, V.; Italiano, S.S.P.; Ripullone, F.; Lanfredi, M. Exploring the use of sentinel-2 data to monitor heterogeneous effects of contextual drought and heatwaves on Mediterranean forests. Land 2020, 9, 325. [Google Scholar] [CrossRef]
  18. Lanfredi, M.; Coluzzi, R.; Imbrenda, V.; Macchiato, M.; Simoniello, T. Analyzing space–time coherence in precipitation seasonality across different European climates. Remote Sens. 2020, 12, 171. [Google Scholar] [CrossRef] [Green Version]
  19. Ummenhofer, C.C.; Meehl, G.A. Extreme weather and climate events with ecological relevance: A review. Philos. Trans. R. Soc. B Biol. Sci. 2017, 372, 20160135. [Google Scholar] [CrossRef]
  20. Rahmstorf, S.; Coumou, D. Increase of extreme events in a warming world. Proc. Natl. Acad. Sci. USA 2011, 108, 17905–17909. [Google Scholar] [CrossRef] [PubMed] [Green Version]
  21. Duvernoy, I.; Zambon, I.; Sateriano, A.; Salvati, L. Pictures from the other side of the fringe: Urban growth and peri-urban agriculture in a post-industrial city (Toulouse, France). J. Rural. Stud. 2018, 57, 25–35. [Google Scholar] [CrossRef]
  22. Carone, M.T.; Simoniello, T.; Manfreda, S.; Caricato, G. Watershed influence on fluvial ecosystems: An integrated methodology for river water quality management. Environ. Monit. Assess 2008, 152, 327. [Google Scholar] [CrossRef]
  23. De Santis, F.; Giannossi, M.L.; Medici, L.; Summa, V.; Tateo, F. Impact of physico-chemical soil properties on erosion features in the Aliano Area (Southern Italy). Catena 2010, 81, 172–181. [Google Scholar] [CrossRef]
  24. Imbrenda, V.; D’Emilio, M.; Lanfredi, M.; Macchiato, M.; Ragosta, M.; Simoniello, T. Indicators for the estimation of vulnerability to land degradation derived from soil compaction and vegetation cover. Eur. J. Soil Sci. 2014, 65, 907–923. [Google Scholar] [CrossRef] [Green Version]
  25. Carone, M.T.; Guisan, A.; Cianfrani, C.; Simoniello, T.; Loy, A.; Carranza, M.L. A multi-temporal approach to model endangered species distribution in europe. The case of the Eurasian otter in Italy. Ecol. Model. 2014, 274, 21–28. [Google Scholar] [CrossRef]
  26. Imbrenda, V.; D’Emilio, M.; Lanfredi, M.; Ragosta, M.; Simoniello, T. Indicators of Land Degradation Vulnerability Due to Anthropic Factors: Tools for An Efficient Planning. Available online: www.igi-global.com/chapter/indicators-of-land-degradation-vulnerability-due-to-anthropic-factors/95002 (accessed on 27 April 2021).
  27. Zambon, I.; Benedetti, A.; Ferrara, C.; Salvati, L. Soil matters? A multivariate analysis of socioeconomic constraints to urban expansion in Mediterranean Europe. Ecol. Econ. 2018, 146, 173–183. [Google Scholar] [CrossRef]
  28. Zambon, I.; Colantoni, A.; Carlucci, M.; Morrow, N.; Sateriano, A.; Salvati, L. Land quality, sustainable development and environmental degradation in agricultural districts: A computational approach based on entropy indexes. Environ. Impact Assess. Rev. 2017, 64, 37–46. [Google Scholar] [CrossRef]
  29. Salvati, L.; Gemmiti, R.; Perini, L. Land degradation in Mediterranean urban areas: An unexplored link with planning? Area 2012, 44, 317–325. [Google Scholar] [CrossRef]
  30. Salvati, L.; Zitti, M. Territorial disparities, natural resource distribution, and land degradation: A case study in Southern Europe. GeoJournal 2007, 70, 185–194. [Google Scholar] [CrossRef]
  31. Smiraglia, D.; Ceccarelli, T.; Bajocco, S.; Salvati, L.; Perini, L. Linking trajectories of land change, land degradation processes and ecosystem services. Environ. Res. 2016, 147, 590–600. [Google Scholar] [CrossRef]
  32. Nickayin, S.S.; Coluzzi, R.; Marucci, A.; Bianchini, L.; Salvati, L.; Cudlin, P.; Imbrenda, V. Desertification risk fuels spatial polarization in ‘affected’ and ‘unaffected’ landscapes in Italy. Sci. Rep. 2022, 12, 747. [Google Scholar] [CrossRef]
  33. Coluzzi, R.; Bianchini, L.; Egidi, G.; Cudlin, P.; Imbrenda, V.; Salvati, L.; Lanfredi, M. Density matters? Settlement expansion and land degradation in peri-urban and rural districts of Italy. Environ. Impact Assess. Rev. 2022, 92, 106703. [Google Scholar] [CrossRef]
  34. Lanfredi, M.; Egidi, G.; Bianchini, L.; Salvati, L. One size does not fit all: A tale of polycentric development and land degradation in Italy. Ecol. Econ. 2022, 192, 107256. [Google Scholar] [CrossRef]
  35. Imbrenda, V.; Quaranta, G.; Salvia, R.; Egidi, G.; Salvati, L.; Prokopovà, M.; Coluzzi, R.; Lanfredi, M. Land degradation and metropolitan expansion in a peri-urban environment. Geomat. Nat. Hazards Risk 2021, 12, 1797–1818. [Google Scholar] [CrossRef]
  36. Evenson, R.E.; Gollin, D. Assessing the impact of the green revolution, 1960 to 2000. Science 2003, 300, 758–762. [Google Scholar] [CrossRef] [PubMed] [Green Version]
  37. Marzario, S.; Logozzo, G.; David, J.L.; Zeuli, P.S.; Gioia, T. Molecular genotyping (SSR) and agronomic phenotyping for utilization of durum wheat (Triticum Durum Desf.) ex situ collection from Southern Italy: A combined approach including pedigreed varieties. Genes 2018, 9, 465. [Google Scholar] [CrossRef] [PubMed] [Green Version]
  38. Padalino, L.; Mastromatteo, M.; Lecce, L.; Spinelli, S.; Contò, F.; Nobile, M.A.D. Effect of durum wheat cultivars on physico-chemical and sensory properties of spaghetti. J. Sci. Food Agric. 2014, 94, 2196–2204. [Google Scholar] [CrossRef] [PubMed]
  39. Beck, H.E.; Zimmermann, N.E.; McVicar, T.R.; Vergopolan, N.; Berg, A.; Wood, E.F. Present and future Köppen-Geiger climate classification maps at 1-km resolution. Sci. Data 2018, 5, 180214. [Google Scholar] [CrossRef] [Green Version]
  40. Lanfredi, M.; Coppola, R.; D’Emilio, M.; Imbrenda, V.; Macchiato, M.; Simoniello, T. A geostatistics-assisted approach to the deterministic approximation of climate data. Environ. Model. Softw. 2015, 66, 69–77. [Google Scholar] [CrossRef]
  41. Incerti, G.; Feoli, E.; Salvati, L.; Brunetti, A.; Giovacchini, A. Analysis of bioclimatic time series and their neural network-based classification to characterise drought risk patterns in South Italy. Int. J. Biometeorol. 2007, 51, 253–263. [Google Scholar] [CrossRef]
  42. Summa, V. Analisi granulometrica dei sedimenti. In Incontri Scientifici; Fiore, S., Ed.; INdAM: Rome, Italy, 2000; Volume II, pp. 19–29. [Google Scholar]
  43. Moore, M.; Reynolds, R.C. X-ray Diffraction and the Identification and Analysis of Clay Minerals, 2nd ed.; Oxford University Press: Oxford, UK; New York, NY, USA, 1997; ISBN 978-0-19-508713-0. [Google Scholar]
  44. Biscaye, P.E. Mineralogy and sedimentation of recent deep-sea clay in the Atlantic Ocean and adjacent seas and oceans. GSA Bull. 1965, 76, 803–832. [Google Scholar] [CrossRef]
  45. Krumm, S. WINFIT 1.2, Version of November 1996; The Erlangen Geological and Mineralogical Software Collection of “WINFIT 1.0: A Public Domain Program for Interactive Profile-Analysis under WINDOWS”. In Proceedings of the XIII Conference on clay mineralogy and petrology, Prague, Czech Republic, 29 August 1994; Volume 8, pp. 253–261. [Google Scholar]
  46. Laviano, R. Analisi mineralogica di argille mediante diffrattometria dei raggi, X. In Procedure Di Analisi Di Materiali Argillosi; ENEA: Rome, Italy, 1987; pp. 215–234. [Google Scholar]
  47. Chapman, H.D. Cation-exchange capacity. In Methods of Soil Analysis; John Wiley & Sons, Ltd.: Hoboken, NJ, USA, 1965; pp. 891–901. ISBN 978-0-89118-204-7. [Google Scholar]
  48. Summa, V.; Tateo, F.; Medici, L.; Giannossi, M.L. The role of mineralogy, geochemistry and grain size in badland development in Pisticci (Basilicata, Southern Italy). Earth Surf. Processes Landf. 2007, 32, 980–997. [Google Scholar] [CrossRef]
  49. Summa, V.; Margiotta, S.; Colaiacovo, R.; Giannossi, M.L. The influence of the grain-size, mineralogical and geochemical composition on the Verdesca landslide. Nat. Hazards Earth Syst. Sci. 2015, 15, 135–146. [Google Scholar] [CrossRef] [Green Version]
  50. Filella, I.; Penuelas, J. The red edge position and shape as indicators of plant chlorophyll content, biomass and hydric status. Int. J. Remote Sens. 1994, 15, 1459–1470. [Google Scholar] [CrossRef]
  51. Karydas, C.; Iatrou, M.; Iatrou, G.; Mourelatos, S. Management zone delineation for site-specific fertilization in rice crop using multi-temporal RapidEye imagery. Remote Sens. 2020, 12, 2604. [Google Scholar] [CrossRef]
  52. Coluzzi, R.; D’Emilio, M.; Imbrenda, V.; Giorgio, G.A.; Lanfredi, M.; Macchiato, M.; Ragosta, M.; Simoniello, T.; Telesca, V. Investigating climate variability and long-term vegetation activity across heterogeneous basilicata agroecosystems. Geomat. Nat. Hazards Risk 2019, 10, 168–180. [Google Scholar] [CrossRef] [Green Version]
  53. Simoniello, T.; Cuomo, V.; Lanfredi, M.; Lasaponara, R.; Macchiato, M. On the relevance of accurate correction and validation procedures in the analysis of AVHRR-NDVI time series for long-term monitoring. J. Geophys. Res. Atmos. 2004, 109. [Google Scholar] [CrossRef] [Green Version]
  54. Xue, J.; Su, B. Significant remote sensing vegetation indices: A review of developments and applications. J. Sens. 2017, 2017, e1353691. [Google Scholar] [CrossRef] [Green Version]
  55. Rouse, J.W. Monitoring the Vernal Advancement and Retrogradation (Greenwave Effect) of Natural Vegetation; NASA/GSFC, Type III; Texas A & M University, Remote Sensing Center: Greenbelt, MA, USA, 1974; p. 371. [Google Scholar]
  56. Simoniello, T.; Coluzzi, R.; Imbrenda, V.; Lanfredi, M. Land cover changes and forest landscape evolution (1985–2009) in a typical Mediterranean agroforestry system (high Agri Valley). Nat. Hazards Earth Syst. Sci. 2015, 15, 1201–1214. [Google Scholar] [CrossRef] [Green Version]
  57. Kross, A.; McNairn, H.; Lapen, D.; Sunohara, M.; Champagne, C. Assessment of RapidEye vegetation indices for estimation of leaf area index and biomass in corn and soybean crops. Int. J. Appl. Earth Obs. Geoinf. 2015, 34, 235–248. [Google Scholar] [CrossRef] [Green Version]
  58. Bajocco, S.; De Angelis, A.; Salvati, L. A satellite-based green index as a proxy for vegetation cover quality in a Mediterranean region. Ecol. Indic. 2012, 23, 578–587. [Google Scholar] [CrossRef]
  59. D’Emilio, M.; Coluzzi, R.; Macchiato, M.; Imbrenda, V.; Ragosta, M.; Sabia, S.; Simoniello, T. Satellite data and soil magnetic susceptibility measurements for heavy metals monitoring: Findings from Agri Valley (Southern Italy). Environ. Earth Sci. 2018, 77, 63. [Google Scholar] [CrossRef]
  60. Imbrenda, V.; Coluzzi, R.; Lanfredi, M.; Loperte, A.; Satriani, A.; Simoniello, T. Analysis of landscape evolution in a vulnerable coastal area under natural and human pressure. Geomat. Nat. Hazards Risk 2018, 9, 1249–1279. [Google Scholar] [CrossRef] [Green Version]
  61. D’Emilio, M.; Macchiato, M.; Ragosta, M.; Simoniello, T. A method for the integration of satellite vegetation activities observations and magnetic susceptibility measurements for monitoring heavy metals in soil. J. Hazard. Mater. 2012, 241, 118–126. [Google Scholar] [CrossRef] [PubMed]
  62. Salvati, L.; Petitta, M.; Ceccarelli, T.; Perini, L.; Battista, F.D.; Scarascia, M.E.V. Italy’s renewable water resources as estimated on the basis of the monthly water balance. Irrig. Drain. 2008, 57, 507–515. [Google Scholar] [CrossRef]
  63. Scarascia, M.E.V.; Battista, F.D.; Salvati, L. Water resources in Italy: Availability and agricultural uses. Irrig. Drain. 2006, 55, 115–127. [Google Scholar] [CrossRef]
  64. Greco, S.; Infusino, M.; De Donato, C.; Coluzzi, R.; Imbrenda, V.; Lanfredi, M.; Simoniello, T.; Scalercio, S. Late spring frost in Mediterranean beech forests: Extended crown dieback and short-term effects on moth communities. Forests 2018, 9, 388. [Google Scholar] [CrossRef] [Green Version]
  65. Simoniello, T.; Lanfredi, M.; Liberti, M.; Coppola, R.; Macchiato, M. Estimation of vegetation cover resilience from satellite time series. Hydrol. Earth Syst. Sci. 2008, 12, 1053–1064. [Google Scholar] [CrossRef] [Green Version]
  66. Ónodi, G.; Kertész, M.; Kovács-Láng, E.; Ódor, P.; Botta-Dukát, Z.; Lhotsky, B.; Barabás, S.; Mojzes, A.; Kröel-Dulay, G. Estimating aboveground herbaceous plant biomass via proxies: The confounding effects of sampling year and precipitation. Ecol. Indic. 2017, 79, 355–360. [Google Scholar] [CrossRef] [Green Version]
  67. Condorelli, G.E.; Maccaferri, M.; Newcomb, M.; Andrade-Sanchez, P.; White, J.W.; French, A.N.; Sciara, G.; Ward, R.; Tuberosa, R. Comparative aerial and ground based high throughput phenotyping for the genetic dissection of NDVI as a proxy for drought adaptive traits in durum wheat. Front. Plant Sci. 2018, 9, 893. [Google Scholar] [CrossRef] [PubMed]
  68. Dong, T.; Liu, J.; Shang, J.; Qian, B.; Ma, B.; Kovacs, J.M.; Walters, D.; Jiao, X.; Geng, X.; Shi, Y. Assessment of red-edge vegetation indices for crop leaf area index estimation. Remote Sens. Environ. 2019, 222, 133–143. [Google Scholar] [CrossRef]
  69. Duan, T.; Chapman, S.C.; Guo, Y.; Zheng, B. Dynamic monitoring of NDVI in wheat agronomy and breeding trials using an unmanned aerial vehicle. Field Crops Res. 2017, 210, 71–80. [Google Scholar] [CrossRef]
  70. Khan, M.N.; Mohammad, F. Eutrophication: Challenges and solutions. In Eutrophication: Causes, Consequences and Control: Ansari, A.A., Gill, S.S., Eds.; Springer: Dordrecht, The Netherlands, 2014; pp. 1–15. ISBN 978-94-007-7814-6. [Google Scholar]
  71. Daughtry, C.S.T.; Walthall, C.L.; Kim, M.S.; de Colstoun, E.B.; McMurtrey, J.E. Estimating corn leaf chlorophyll concentration from leaf and canopy reflectance. Remote Sens. Environ. 2000, 74, 229–239. [Google Scholar] [CrossRef]
  72. Kim, M.S.; Daughtry, C.S.T.; Chappelle, E.W.; McMurtrey, J.E.; Walthall, C.L. The use of high spectral resolution bands for estimating absorbed photosynthetically active radiation (A Par). In Proceedings of the 6th International Symposium on Physical Measurements and Signatures in Remote Sensing, Val D’Isere, France, 17–21 January 1994; pp. 299–306. [Google Scholar]
  73. Haboudane, D.; Miller, J.R.; Pattey, E.; Zarco-Tejada, P.J.; Strachan, I.B. Hyperspectral vegetation indices and novel algorithms for predicting green LAI of crop canopies: Modeling and validation in the context of precision agriculture. Remote Sens. Environ. 2004, 90, 337–352. [Google Scholar] [CrossRef]
  74. AGI—Associazione Geotecnica Italiana. Raccomandazioni Sulla Programmazione Ed Esecuzione Delle Indagini Geotecniche; AGI: Roma, Italy, 1977. [Google Scholar]
  75. U.S. Department of Agriculture. Soil Survey Manual—Ch. 3. Examination and Description of Soil Profiles. Selected Chemical Properties. Reaction; U.S. Department of Agriculture: Washington, DC, USA, 1993.
  76. Summa, V.; Margiotta, S.; Medici, L.; Tateo, F. Compositional characterization of fine sediments and circulating waters of landslides in the Southern Apennines—Italy. Catena 2018, 171, 199–211. [Google Scholar] [CrossRef]
  77. Summa, V.; Margiotta, S.; Tateo, F. Correlation between geochemical, mineralogical and physical characters of sediments and salinization phenomena in a pilot area in the Ionian Plain (Southern Italy). Geomat. Nat. Hazards Risk 2019, 10, 1139–1154. [Google Scholar] [CrossRef] [Green Version]
  78. Pandino, G.; Mattiolo, E.; Lombardo, S.; Lombardo, G.M.; Mauromicale, G. Organic cropping system affects grain chemical composition, rheological and agronomic performance of durum wheat. Agriculture 2020, 10, 46. [Google Scholar] [CrossRef] [Green Version]
  79. Ficco, D.B.M.; Riefolo, C.; Nicastro, G.; De Simone, V.; Di Gesù, A.M.; Beleggia, R.; Platani, C.; Cattivelli, L.; De Vita, P. Phytate and mineral elements concentration in a collection of Italian durum wheat cultivars. Field Crops Res. 2009, 111, 235–242. [Google Scholar] [CrossRef]
  80. Quaranta, F.; Amoriello, T.; Aureli, G.; Belocchi, A.; D’Egidio, M.G.; Fornara, M.; Melloni, S.; Desiderio, E. Grain yield, quality and deoxynivalenol (DON) contamination of durum wheat (Triticum Durum Desf.): Results of national networks in organic and conventional cropping systems. Ital. J. Agron. 2010, 5, 353–366. [Google Scholar] [CrossRef]
  81. Vastola, A.; Zdruli, P.; D’Amico, M.; Pappalardo, G.; Viccaro, M.; Di Napoli, F.; Cozzi, M.; Romano, S. A Comparative multidimensional evaluation of conservation agriculture systems: A case study from a Mediterranean area of Southern Italy. Land Use Policy 2017, 68, 326–333. [Google Scholar] [CrossRef]
  82. Figliuolo, G.; Mazzeo, M.; Greco, I. Temporal variation of diversity in Italian durum wheat germplasm. Genet. Resour. Crop Evol. 2007, 54, 615–626. [Google Scholar] [CrossRef]
  83. Xie, Q.; Dash, J.; Huang, W.; Peng, D.; Qin, Q.; Mortimer, H.; Casa, R.; Pignatti, S.; Laneve, G.; Pascucci, S.; et al. Vegetation indices combining the red and red-edge spectral information for leaf area index retrieval. IEEE J. Sel. Top. Appl. Earth Obs. Remote Sens. 2018, 11, 1482–1493. [Google Scholar] [CrossRef] [Green Version]
  84. Soane, B.D.; Ball, B.C.; Arvidsson, J.; Basch, G.; Moreno, F.; Roger-Estrade, J. No-till in Northern, Western and South-Western Europe: A review of problems and opportunities for crop production and the environment. Soil Tillage Res. 2012, 118, 66–87. [Google Scholar] [CrossRef] [Green Version]
  85. Acar, M.; Çelik, İ.; Günal, H. Effects of long-term tillage systems on soil water content and wheat yield under Mediterranean conditions. J. New Theory 2017, 17, 98–108. [Google Scholar]
  86. Amato, G.; Ruisi, P.; Frenda, A.S.; Miceli, G.D.; Saia, S.; Plaia, A.; Giambalvo, D. Long-term tillage and crop sequence effects on wheat grain yield and quality. Agron. J. 2013, 105, 1317–1327. [Google Scholar] [CrossRef]
  87. Baiamonte, G.; Novara, A.; Gristina, L.; D’Asaro, F. Durum wheat yield uncertainty under different tillage management practices and climatic conditions. Soil Tillage Res. 2019, 194, 104346. [Google Scholar] [CrossRef]
  88. Adewopo, J.; Peter, H.; Mohammed, I.; Kamara, A.; Craufurd, P.; Vanlauwe, B. Can a combination of UAV-derived vegetation indices with biophysical variables improve yield variability assessment in smallholder farms? Agronomy 2020, 10, 1934. [Google Scholar] [CrossRef]
  89. Gano, B.; Dembele, J.S.B.; Ndour, A.; Luquet, D.; Beurier, G.; Diouf, D.; Audebert, A. Using UAV borne, multi-spectral imaging for the field phenotyping of shoot biomass, leaf area index and height of West African sorghum varieties under two contrasted water conditions. Agronomy 2021, 11, 850. [Google Scholar] [CrossRef]
  90. Pignatti, S.; Acito, N.; Amato, U.; Casa, R.; de Bonis, R.; Diani, M.; Laneve, G.; Matteoli, S.; Palombo, A.; Pascucci, S.; et al. Development of algorithms and products for supporting the Italian Hyperspectral PRISMA Mission: The SAP4PRISMA Project. In Proceedings of the IGARSS 2012 IEEE International Geoscience and Remote Sensing Symposium, Munich, Germany, 22–27 July 2012; pp. 127–130. [Google Scholar]
  91. Pignatti, S.; Acito, N.; Amato, U.; Casa, R.; Castaldi, F.; Coluzzi, R.; De Bonis, R.; Diani, M.; Imbrenda, V.; Laneve, G.; et al. Environmental products overview of the Italian Hyperspectral Prisma Mission: The SAP4PRISMA Project. In Proceedings of the IGARSS 2015 IEEE International Geoscience and Remote Sensing Symposium, Milan, Italy, 26–31 July 2015; pp. 3997–4000. [Google Scholar]
  92. Dinelli, G.; Marotti, I.; Silvestro, R.D.; Bosi, S.; Bregola, V.; Accorsi, M.; Loreto, A.D.; Benedettelli, S.; Ghiselli, L.; Catizone, P. Agronomic, nutritional and nutraceutical aspects of durum wheat (Triticum Durum Desf.) cultivars under low input agricultural management. Ital. J. Agron. 2013, 8, e12. [Google Scholar] [CrossRef]
  93. Miller, M.P.; Singer, M.J.; Nielsen, D.R. Spatial variability of wheat yield and soil properties on complex hills. Soil Sci. Soc. Am. J. 1988, 52, 1133–1141. [Google Scholar] [CrossRef]
  94. Altamore, L.; Ingrassia, M.; Columba, P.; Chironi, S.; Bacarella, S. Italian consumers’ preferences for pasta and consumption trends: Tradition or innovation? J. Int. Food Agribus. Mark. 2020, 32, 337–360. [Google Scholar] [CrossRef]
  95. Varia, F.; Macaluso, D.; Vaccaro, A.; Caruso, P.; Guccione, G.D. The adoption of landraces of durum wheat in sicilian organic cereal farming analysed using a system dynamics approach. Agronomy 2021, 11, 319. [Google Scholar] [CrossRef]
  96. Contò, F.; Antonazzo, A.P.; Conte, A.; Cafarelli, B. Consumers perception of traditional sustainable food: An exploratory study on pasta made from native ancient durum wheat varieties. Ital. Rev. Agric. Econ. 2016, 71, 325–337. [Google Scholar] [CrossRef]
  97. Vet, J.M.D.; Nigohosyan, D.; Ferrer, J.N.; Gross, A.-K.; Kuehl, S.; Flickenschild, M. Impacts of the COVID-19 Pandemic on EU Industries; European Parliament: Strasbourg, France, 2021. [Google Scholar]
  98. FAO Cereal Supply and Demand Brief. World Food Situation. Food and Agriculture Organization of the United Nations. Available online: http://www.fao.org/worldfoodsituation/csdb/en/ (accessed on 28 April 2021).
  99. ISMEA—Istituto di Servizi per il Mercato Agricolo Alimentare. 2020. Available online: http://www.Ismeamercati.It (accessed on 28 April 2021).
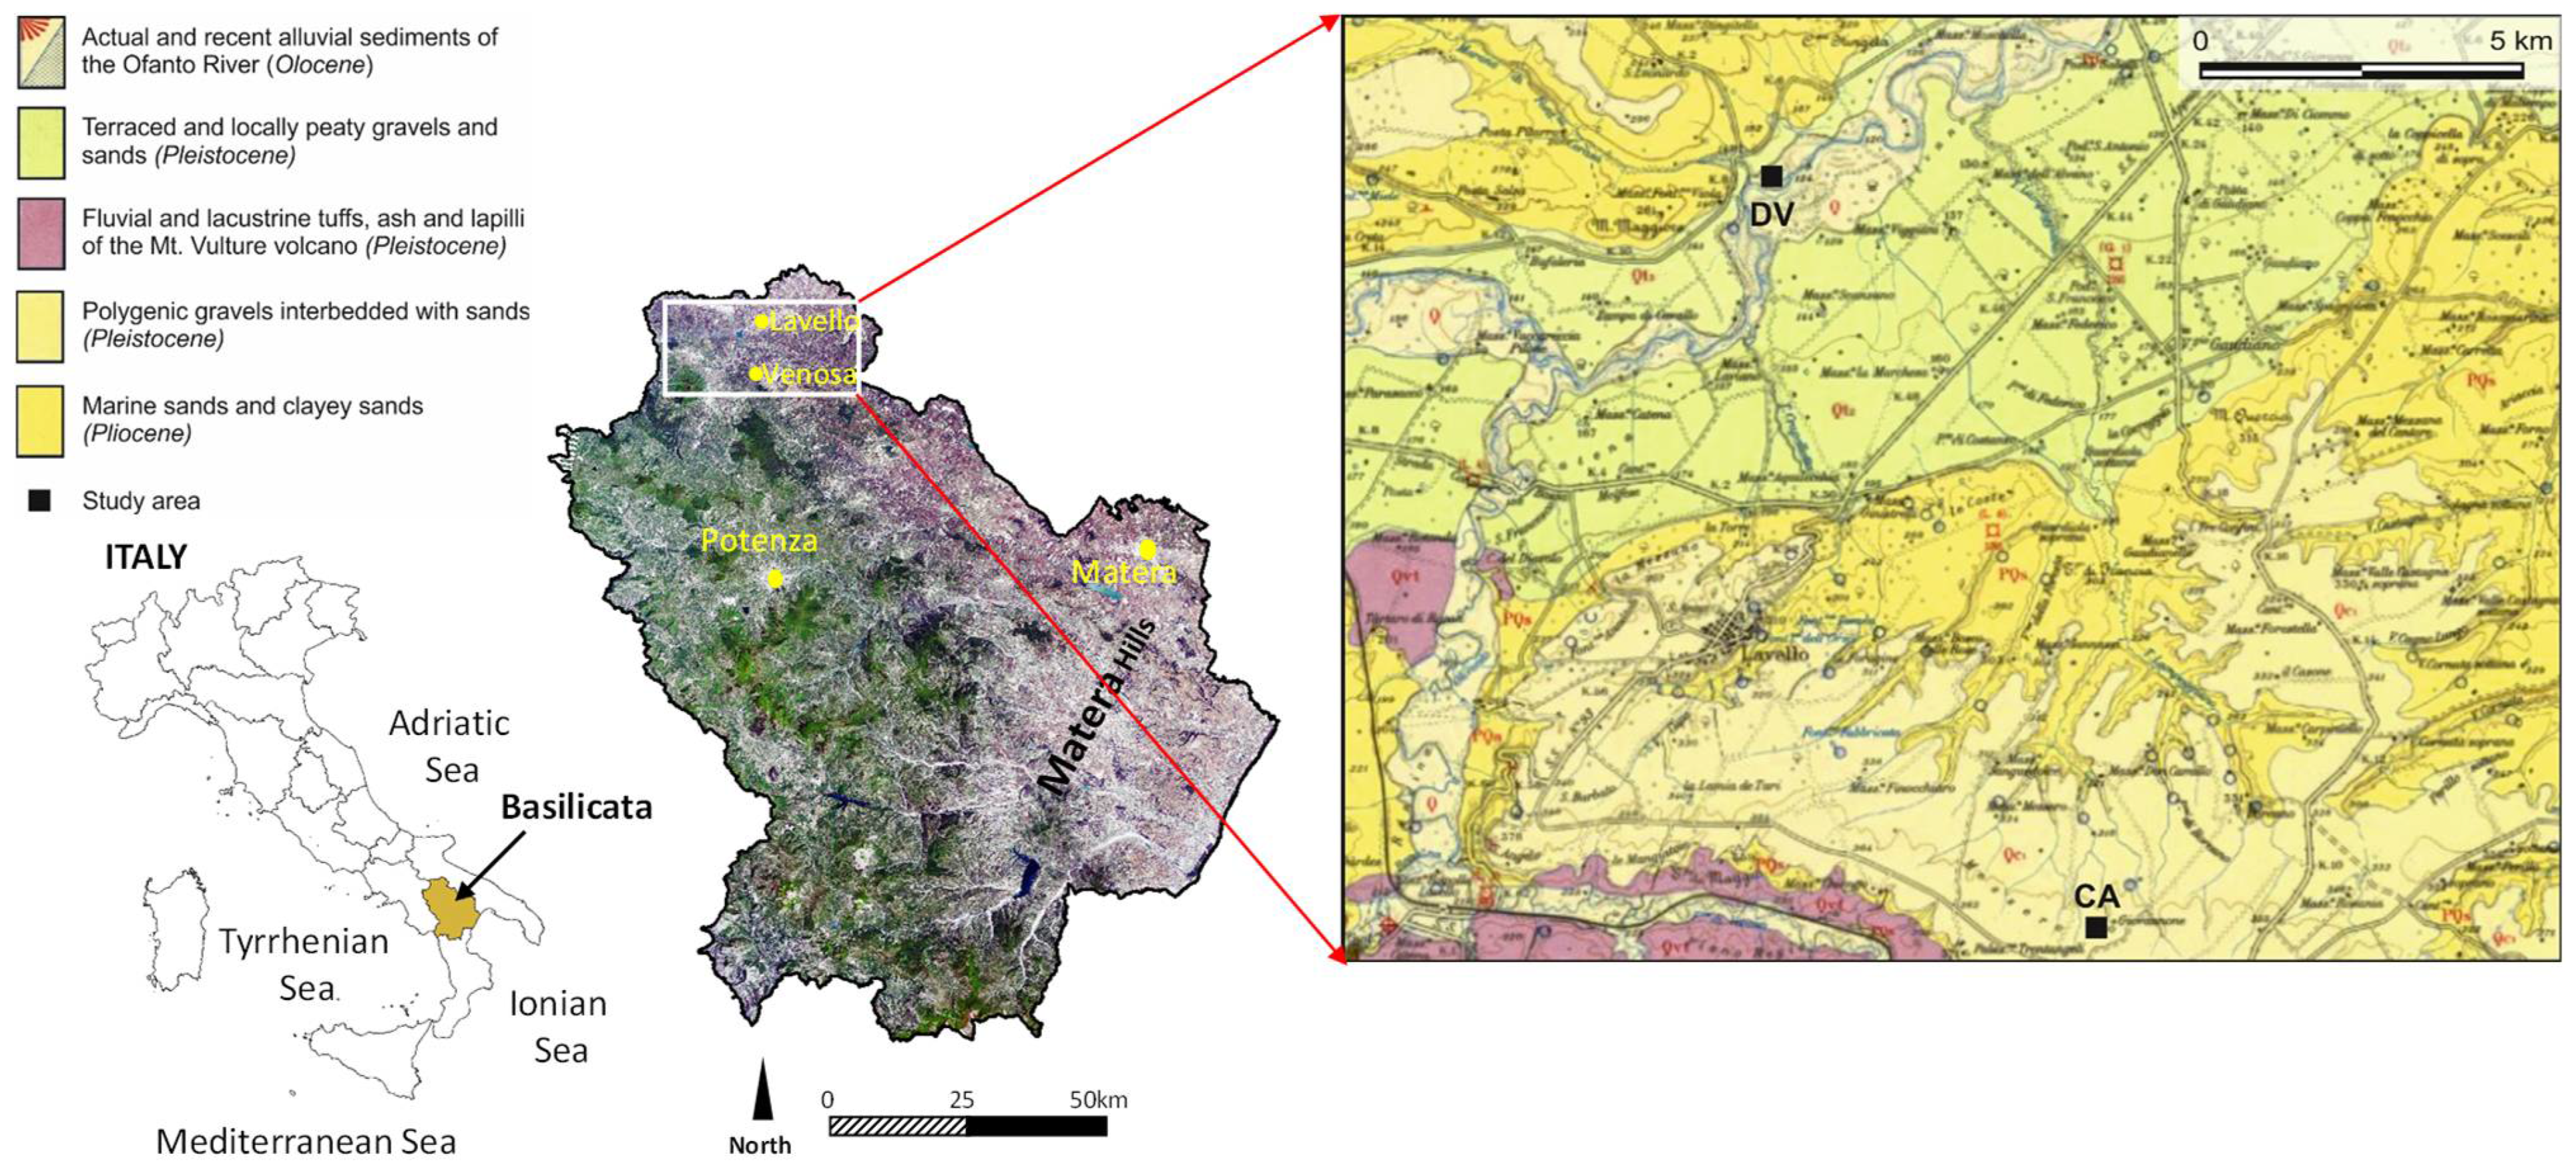
Figure 1. Geological map of northern Basilicata, displaying the positions of the two investigated sites (DV and CA). Modeled after FOGLIO n. 175—Carta Geologica d’Italia alla scala, 1:100,000 (Geological map of Italy, 1:100,000 scale).
Agronomy 12 00597 g001
Figure 2. Daily data of rainfall (mm) and mean air temperature (°C) recorded for the year 2015 at the weather stations of (a) Lavello (location of DV study site) and (b) Venosa (location of CA study site) (source: ALSIA network of Basilicata).
Agronomy 12 00597 g002
Figure 3. Distribution of sampling points (red points) within each area managed with different agronomic techniques. (a) DV study site with deep tillage (DT) and no tillage as conservative agronomic practices (CP). (b) CA study site with deep tillage (DT) and ripping technique as conservative practices (CP) (background image from Google Earth).
Agronomy 12 00597 g003
Figure 4. Phenology of wheat (https://terraevita.edagricole.it, last access 7 February 2022).
Agronomy 12 00597 g004
Figure 5. Rapid Eye image characteristics: (a) framing of the image tile, (b) location of the study sites within the tile, and (c) principal features of the acquired image.
Agronomy 12 00597 g005
Figure 6. RapidEye spectral features and spectral signatures of soil, vital vegetation, and dry vegetation.
Agronomy 12 00597 g006
Figure 7. Spectral response of vegetation with the position of red edge inflection point (REIP) (Source of spectra: ASD FieldSpec Spectroradiometer acquisitions by CNR-IMAA).
Agronomy 12 00597 g007
Figure 8. Distribution of grain size fractions in the samples collected in the study sites. (a) DV field in a soil developed above the Olocene terraced alluvial sediments of the Ofanto River. (b) CA field in a soil formed on the Pleistocene terraced deposits, mainly consisting of polygenic conglomerates locally embedded with sandy levels.
Agronomy 12 00597 g008
Figure 9. ECP, EMP, EPP, and ESP mean values of conservative and conventional soils in the first (before seeding) and second (after harvest) sampling.
Agronomy 12 00597 g009
Figure 10. Maps of multispectral indices obtained from elaboration of the RapidEye satellite data for the DV site (municipality of Lavello) with the Anco Marzio durum wheat cultivation for the NDVI, NDVI-RE, MCARI, and MTVI1. The black line circumscribes the sub-areas managed with conservative (no tillage, left side) and conventional (deep tillage, right side) practices.
Agronomy 12 00597 g010
Figure 11. Maps of multispectral indices obtained from elaboration of the RapidEye satellite data for the CA site (municipality of Venosa) with Saragolla Lucana durum wheat cultivation for the NDVI, NDVI-RE, MCARI, and MTVI1. The black line circumscribes the sub-areas managed with conservative (soil ripping, right side) and conventional (deep tillage, left side) practices.
Agronomy 12 00597 g011
Figure 12. Elevation profiles of the CA site, obtained by orthogonally sectioning the overall area.
Agronomy 12 00597 g012
Figure 13. Comparison of vegetation indices for conventional (deep tillage) and conservative practices (no tillage at the DV site and soil ripping at the CA site).
Agronomy 12 00597 g013
Table 1. Mean mineralogical composition of the bulk (Qtz to Tot Phy) and <2 µm fractions (I-M to Kao) of the studied samples grouped by tillage practice (Qtz = quartz; Cal = calcite; Dol = dolomite; K-fld = K-feldspar; Plg = plagioclase; Tot Phy = total phyllosilicates; I-M = illite-mica; I/S = illite/smectite; Chl = chlorite; Kao = kaolinite; tr = 0 ÷ 3%; + = 3 ÷ 10%; ++ = 10 ÷ 20%; +++ = 20 ÷ 40%; ++++ = 40 ÷ 70%; and +++++ = 70 ÷ 100%).
Tillage PracticeQtzCalDolK-fldPlgTot PhyI-MI/SChlKao
Conservative++++tr+++++++++++++++
Conventional+++tr+++++++++++++++++
Table 2. pH and EC values (Min = minimum, Max = maximum, Mean, and SD = standard deviation) of DV and CA topsoil collected during the first (before seeding) and second (after harvest) sampling campaigns.
Tillage Practice Before Seeding
(First Sampling)
After Harvest
(Second Sampling)
pHEC
µS/cm
pHEC
µS/cm
Conservative (CP)Min8.13238.1316
Max8.28988.2409
Mean8.26418.2355
SD0.1238.80.142.1
Conventional (DT)Min6.81956.596
Max8.34718.1280
Mean7.92807.3189
SD0.196.60.8715
Table 3. Average values and standard deviation (SD) of vegetation indices by DV (with modern Anco Marzio variety and CA with old Saragolla Lucana landrace) and type of tillage management (conventional and conservative), as well as the respective grain yield.
NDVINDVIreMCARIMTVI1Yield (t/ha)
DV fields
Modern Variety
ConventionalMean0.7830.442120,777.22451.422.2
SD0.130.078413,825.23146.78
ConservativeMean0.7590.42833,390.763448.431.8
SD0.0990.05624,873.96112.55
CV fields
Ancient Variety
ConventionalMean0.5880.3609368.96238.662.0
SD0.1350.0710,273.4280.71
ConservativeMean0.5220.3206363.84198.061.4
SD0.1260.063794.3171.83
Table 4. Performance of conservative tillage management (no tillage and ripping) with respect to conventional deep tillage for the different vegetation indices and grain yields.
Conservative vs. Conventional
NDVINDVIreMCARIMTVI1ΔYield (t/ha)
DV Site: Modern Variety−3.2%−3.3%−261.7%−0.7%−0.4
CA Site: Ancient Variety−12.6%−12.5%−47.2%−20.5%−0.6
Average−7.9%−7.9%−154.5%−10.6%−0.5
Table 5. Performances of the modern wheat variety (Anco Marzio) with respect to the ancient landrace variety (Saragolla Lucana).
Modern vs. Ancient
NDVINDVIreMCARIMTVI1ΔYield (t/ha)
Conventional+24.9%+18.6%+92.2%47.1%+0.2
Conservative+31.2%+25.2%+80.9%55.8%+0.4
Average+28.1%+21.9%+86.6%51.5%+0.3
Publisher’s Note: MDPI stays neutral with regard to jurisdictional claims in published maps and institutional affiliations.