Article

Reduction of Evapotranspiration in Microenvironment Conditions of Table Grape Vineyards Protected by Different Types of Plastic Covers

1
Department of Science of Agriculture, Food, Natural Resources and Engineering (DAFNE), University of Foggia, Via Napoli 25, 71122 Foggia, Italy
2
Department of Agriculture and Environment Science (DiSAAT), University of Bari, Via Amendola 165/A, 70126 Bari, Italy
3
Department of Agricultural, Forestry and Food Sciences (DISAFA), Largo P. Braccini 2, 10095 Grugliasco, Italy
*
Authors to whom correspondence should be addressed.
Agronomy 2022, 12(3), 600; https://doi.org/10.3390/agronomy12030600
Submission received: 25 January 2022 / Revised: 16 February 2022 / Accepted: 21 February 2022 / Published: 28 February 2022
(This article belongs to the Special Issue Sustainable Viticulture and Vineyard Management on Table Grape)

Abstract

:
Saving water is a major challenge to increase environmental sustainability, particularly in semi-arid regions where most table grapes are produced. Water use is driven by atmospheric demand, which combines effects of solar radiation (prominent factor), wind, air temperature and humidity. Covering table grapes with transparent plastics is spread in many regions. Covers lower incoming solar radiation and wind speed, changing air temperature and humidity. This study assessed the effects of two plastic covers on reference evapotranspiration (ET0) in comparison to the open field. For two years, two vineyards (cv. Victoria) trained to overhead trellis systems (tendone) were covered with two transparent polyethylene sheets: an agrotextile fabric (C), and a commercial film (S). The sheet spectrophotometric properties were analyzed and the radiometric coefficients calculated. Micrometeorological data were recorded in the covered vineyards and in a nearby uncovered one. ET0 was calculated for June and July using the simplified Penman–Monteith equation. The coefficient of transmissivity to total photosynthetic radiation, a proxy of net radiation, was 73% for cover C and 83% for cover S. On average, ET0 decreased by 35% under cover C and 31% under cover S. Hence, in addition to providing protection from external agents, covers represent a valid tool for saving water in table grape viticulture; nevertheless, their radiometric properties should be considered and optimized to better achieve this goal.

Graphical Abstract

1. Introduction

Saving water resources to cope with its scarcity is one of the major challenges for the sustainability of agriculture, which is the largest user of water worldwide with over 70% of total withdrawals. Current global warming increases water scarcity since it accentuates atmospheric water demand, namely evapotranspiration (ET), and summer drought frequency, causing yield loss, particularly in the semi-arid zones such as those in which most table grapes are produced. The consequences are directly reflected in the quantitative and qualitative characteristics of the grapes [1,2,3,4]. Italy is one of the major table grape producers and currently supplies about 1.1 million tons almost exclusively from its southern regions [5]. Grapevine cultivation in south Italy is exposed to a high drought risk during the flowering-veraison phenophase: for this period, it has been assessed the occurrence of a crop water stress index (1 − ETactual:ETmax)-higher than 0.5, which leads to a potential yield loss rate of about 30–60% [6].
Growing grapevine under protecting structures, such as plastic sheets and nets, is a possible tool for limiting water use driven by atmospheric demand [7], which related to the available amounts of solar radiation, wind speed, air temperature and humidity and to air turbulence features, all modified by plastic screens [8,9,10,11,12].
Covering table grape vineyards with transparent plastic sheets is a standard practice in south Italy. Three covering techniques have been adapted to different purposes: (i) “early covering”, aimed at advancing berry ripening by advancing bud-break. For this purpose, after the chilling requirement is satisfied, the vineyard top and sides are wrapped with plastic sheets: the greenhouse effect generated inside the structure accelerates the accumulation of growing degree hours needed for sprouting. Around flowering, side sheets are wound up or removed to avoid overheating; (ii) “late covering”, aimed at delaying harvest. With this technique, the top of the vineyard is covered with plastic sheets at the beginning of veraison to protect shoots and bunches from external agents, so as to reduce abiotic and biotic damages and prolong the healthy life of the grapes on the vine. Nevertheless, the screen reduces the incoming solar radiation and modifies its spectrum, thus it changes the energetic and microenvironment conditions slowing down the grape maturation process itself [13]; (iii) “after-sprouting covering”, aimed at protecting shoot and bunches from external biotic and abiotic agents, without seeking early or late grape harvest. In this case, the top of the vineyard is covered with plastic sheets when all buds have already sprouted. The protection provided by the screen, primarily from rain and excess sunlight, reduces the attacks of pathogens and the amount of chemicals sprayed, and also improves the appearance of the berries. The top sheets of all types of coverings are removed or “closed” at the end of the growing season.
To be suitable for growing purposes, plastic sheets require certain radiometric properties. A high transmissivity to solar radiation (~200–2500 nm) is a general prerequisite, and a high ability to transmit photosynthetic light (400–700 nm) is always desirable (ideally 100%, realistically 80–90%) for its positive effect on plant physiology. Differently, a high transmissivity to near infrared radiation (760–3000 nm) is suitable for advancing bud-break but not for other aims, since this radiative range does not have a direct influence on the plant physiology but, representing 50% of total incident energy [14], gives a great heating contribution [15]. Unfortunately, additives capable of blocking near infrared radiations are expensive or not very effective, therefore rarely used [16]. The cover ability to diffuse the incident solar radiation should be also considered: it allows the canopy to receive sufficient amount of light while reducing temperature peaks [17]. At the opposite side of the solar spectrum, the ultraviolet rays (320–400 nm) degrade plastic polymers, thus, anti-actinic compounds are added to the plastic mix [15]. Ultraviolet rays damage also nucleic acids, proteins and photosynthetic pigments, but stimulate the synthesis of carotenoids and phenols which have sun-protection and antioxidant properties; therefore, they improve fruit color and richness in bio-active compounds, especially in flavonoids of both red and white grape berries [18,19]. Therefore, screens should allow a good amount of UV rays to enter. Finally, for the “early covering” technique, a low transmissivity (20–60%) to the heating terrestrial long infrared radiation is required in order to increase the greenhouse effect by reducing radiative thermal losses [15].
The radiometric properties of plastic screens exert a paramount influence on the microenvironment inside the structure, thus they affect evapotranspiration. Many studies refer to the influence of plastic cover on vineyard microclimate, vine physiology and grape quality [20,21,22,23,24,25,26], while a limited number of studies are focused on the effects of plastic coverings on evapotranspiration of table grape vineyards [9,27,28,29] and, moreover, no one considers possible effects of sheets having different radiometric properties. The first aim of the present work was to estimate, in the environmental conditions of south Italy, the reference evapotranspiration that occurs during the warmest summer months under plastic sheets that cover table grape vineyards, in comparison with an open field. The second aim was to test the influence of different types of plastic covers on the evaporative demand. The ultimate goal was to acquire information to be used as a starting point to better exploit the potential of these protective screens for saving water resources.

2. Materials and Methods

The trial was carried out at a privately owned vineyard (Laporta Farm) located in Trinitapoli (BT province, Apulia region) 41°18′28.2″ N-16°00′50.1″ E, altitude 66 m a.s.l. The area has a warm-temperate climate classified as Csa (hot and dry summer Mediterranean conditions) according to Köppen and Geiger (1936) [30]. The average temperature is 16.7 °C; the average rainfall is 566 mm with precipitations mainly concentrated in winter. Summer climatic conditions last from June to September. July and August are the hottest months (avg. max. temp. 29.6 and 30.0 °C) and the least rainy ones (22 and 20 mm); July has the lowest air relative humidity (57.83%) and the number of rainy days (3.5) (Table 1). The area totalizes about 2170 Growing Degree Days (IV region of the Winkler scale) [31,32].
The site involved in the trial is located on a soil unit resting on a substrate of terraced marine deposits. The soils are calcareous, have a scarcely stony surface, medium texture, good drainage, good depth and low presence of skeleton [33]; a common reference value for a fairly deep soil is 60–90 cm, while a low presence of skeleton commonly refers to less than 5%.
In two consecutive years (2015 and 2016), two adjacent 1 hectare vineyards of ‘Victoria’ (Vitis vinifera L.) vines grafted onto ‘1103 Paulsen’ rootstock were involved in the trial. ‘Victoria’ is one of the main seeded table grape varieties grown in the area. Another nearby vineyard of the cv. Victoria was not protected either by plastic sheets or by anti-hail nets. Vines were 5–6 year old, spaced at 2.4 m × 2.4 m and trained to overhead trellis system (tendone) pruned to 2–3 canes per vine (~10 buds/cane). The standard viticultural practices adopted by the farm were applied in all the vineyards, including cluster thinning (to 1.5 bunch/shoot), leaf thinning (4 interventions), mineral nutrition (fertilizer units: 135 N, 57 P2O5, 115 K2O, 80 CaO, 25 MgO) provided partly by soil distribution and partly by fertigation, and irrigation provided by sub-surface system (2000 m3/year as total amount of annual delivered water). Biostimulants were also applied to counteract biotic and abiotic stresses [35]. Grapes under covers were harvested in the last ten days of July; harvest in open field started 15 days later. The vineyards achieved similar berry quality (berry weight about 11.5 g, juice total soluble solids 16 °Brix, titratable acidity 3.4–3.8 g/L) and productivity (about 23.5 t/ha as average of the two years).
The early covering technique was applied. In March, to October, the vineyards were protected by plastic sheets (Figure 1).
Plastic sheets that covered the vineyard sides were made of a not transparent low-cost woven fabric, according to the farm practice, while those that covered the top of the vineyards consisted of two types of plastic, one per vineyard, both made of 200 μm thick low density polyethylene, transparent to solar radiation. They were (Figure 2): (i) cover C (Coverlys® agrotextile, 165 g/m2, Beaulieu Technical Textiles, Comines-Warneton, Belgium), that was experimented for the first time on table grapes; (ii) Cover S (Serrosol film, 170 g/m2, Serroplast, Rutigliano, BA, Italy), which was already renowned in the growing area. The former is totally recyclable, the latter is 60% recyclable. Both plastic materials were realized by adding classified compounds to improve their performance, especially as concerns thermal, anti-UV, antistatic, anti-drop effects. The covers and the vineyards were, respectively, labeled as C and S.
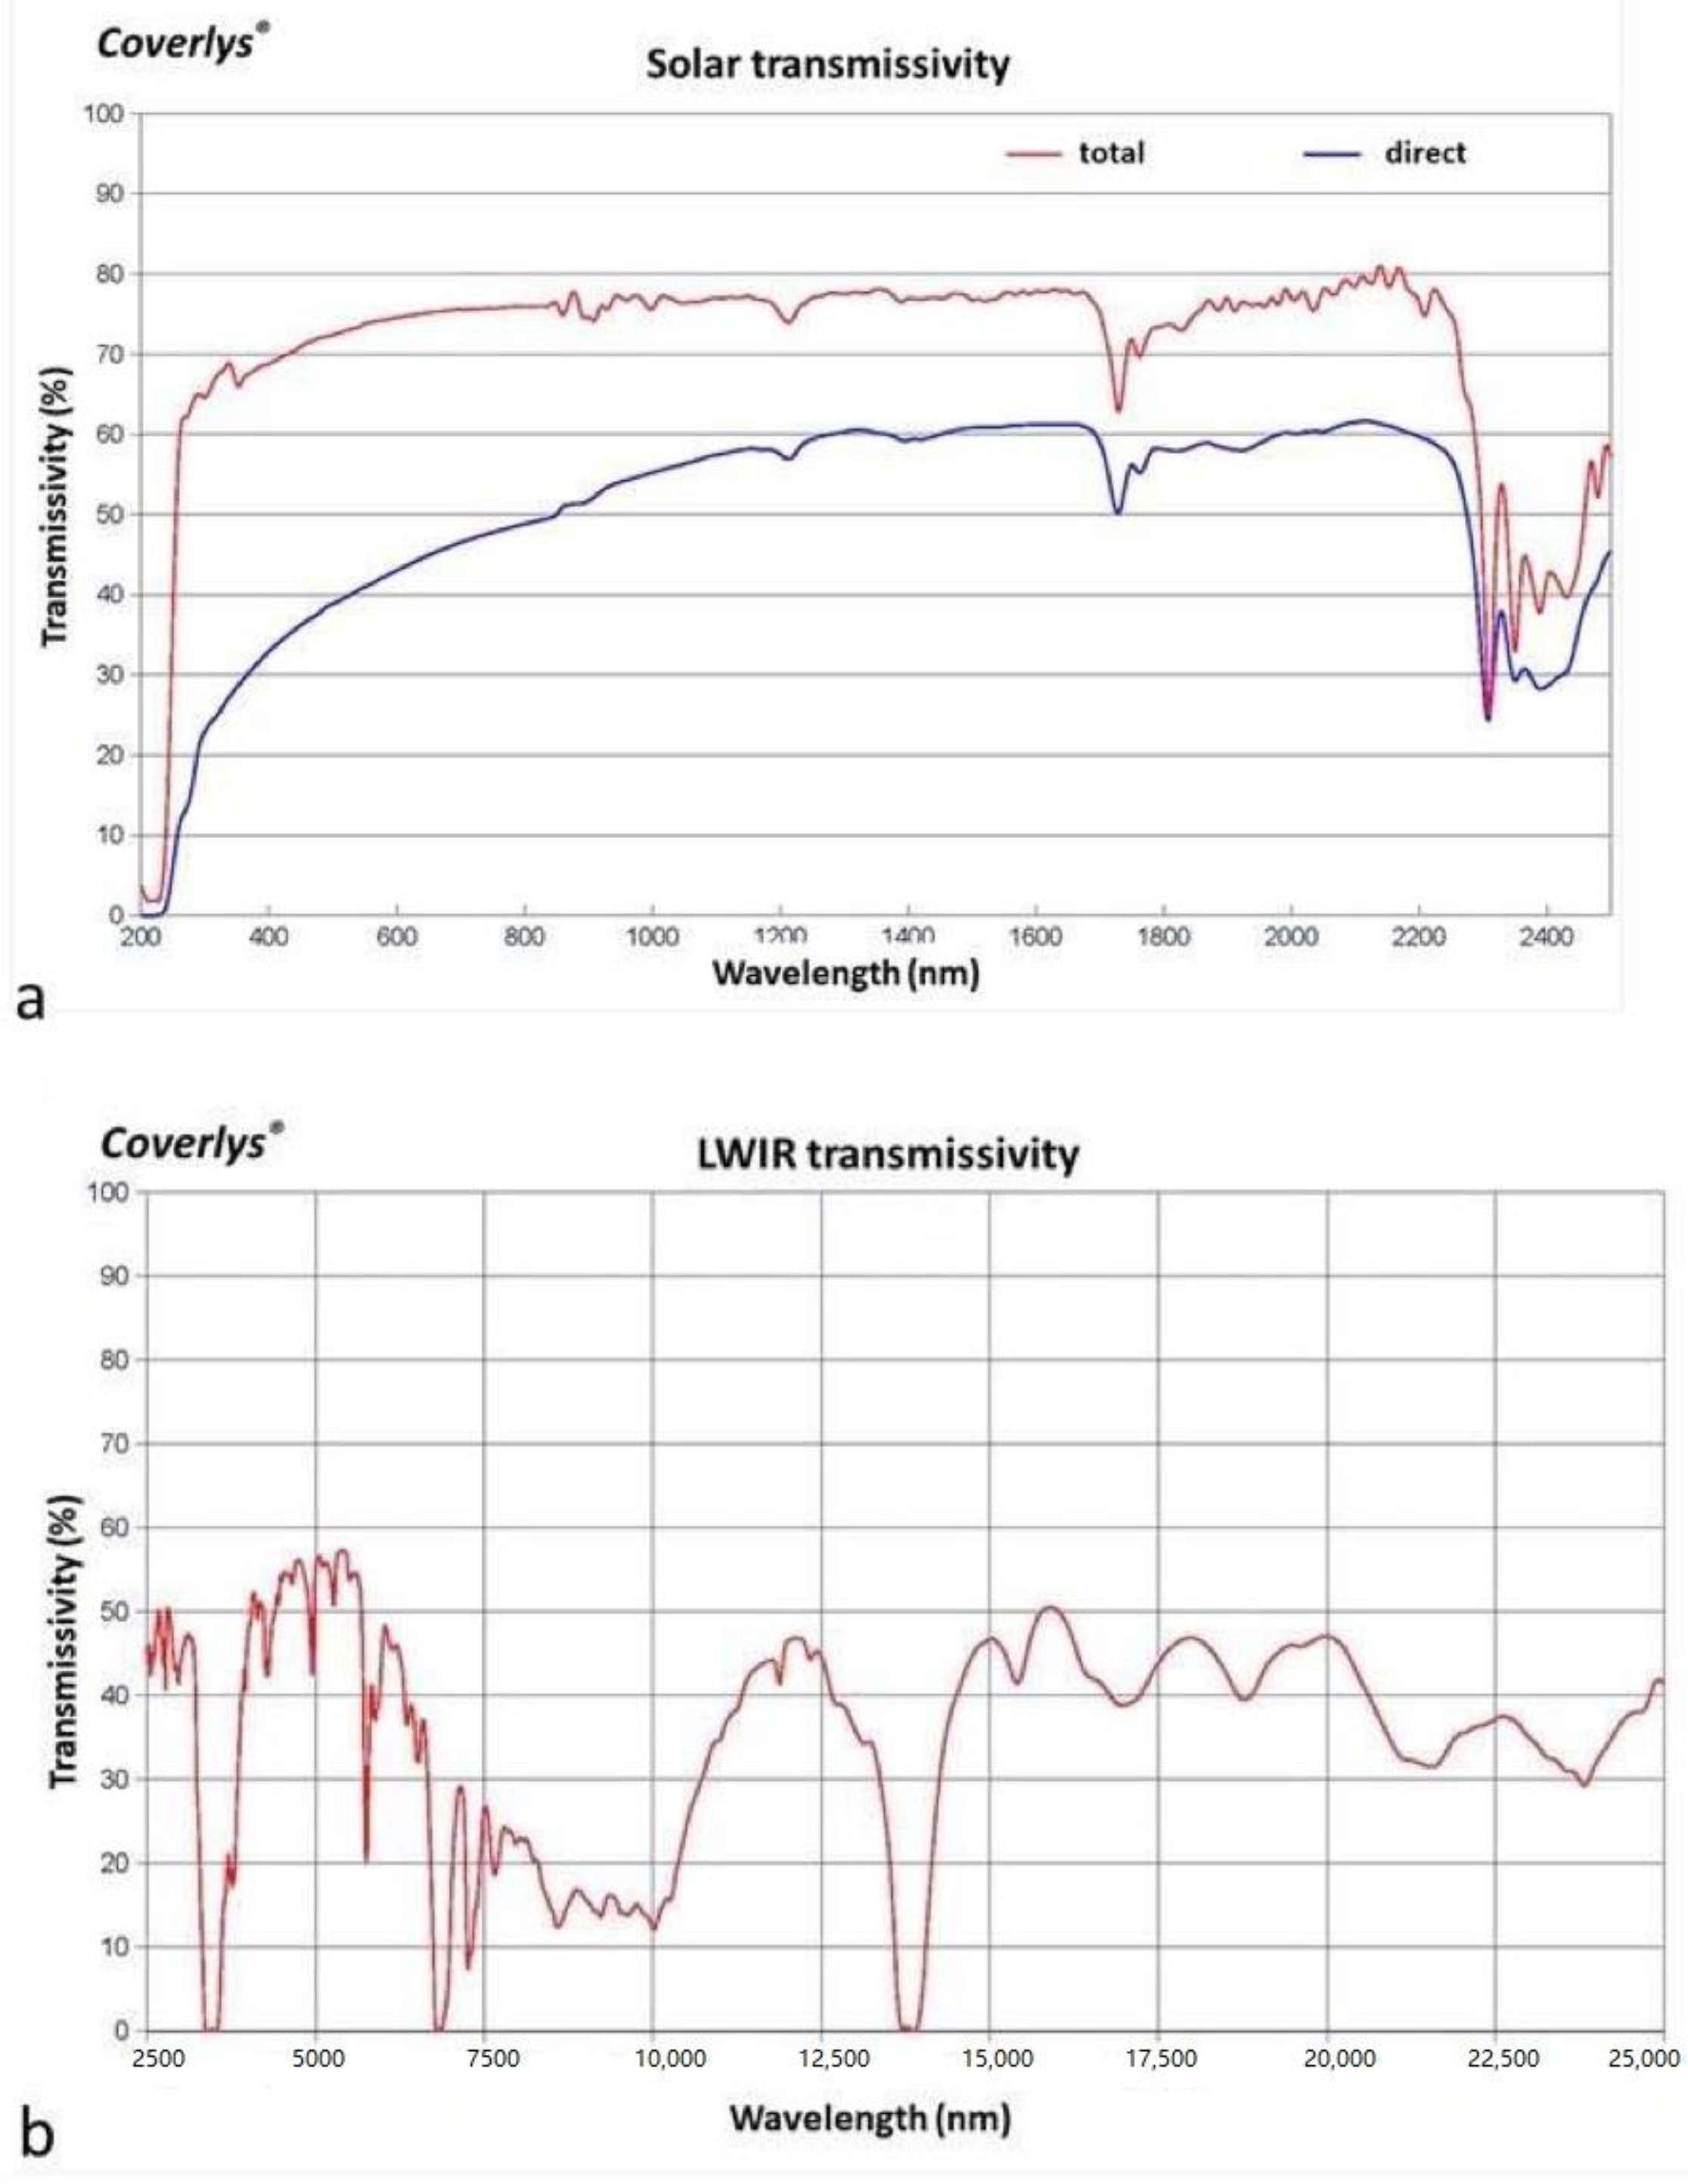
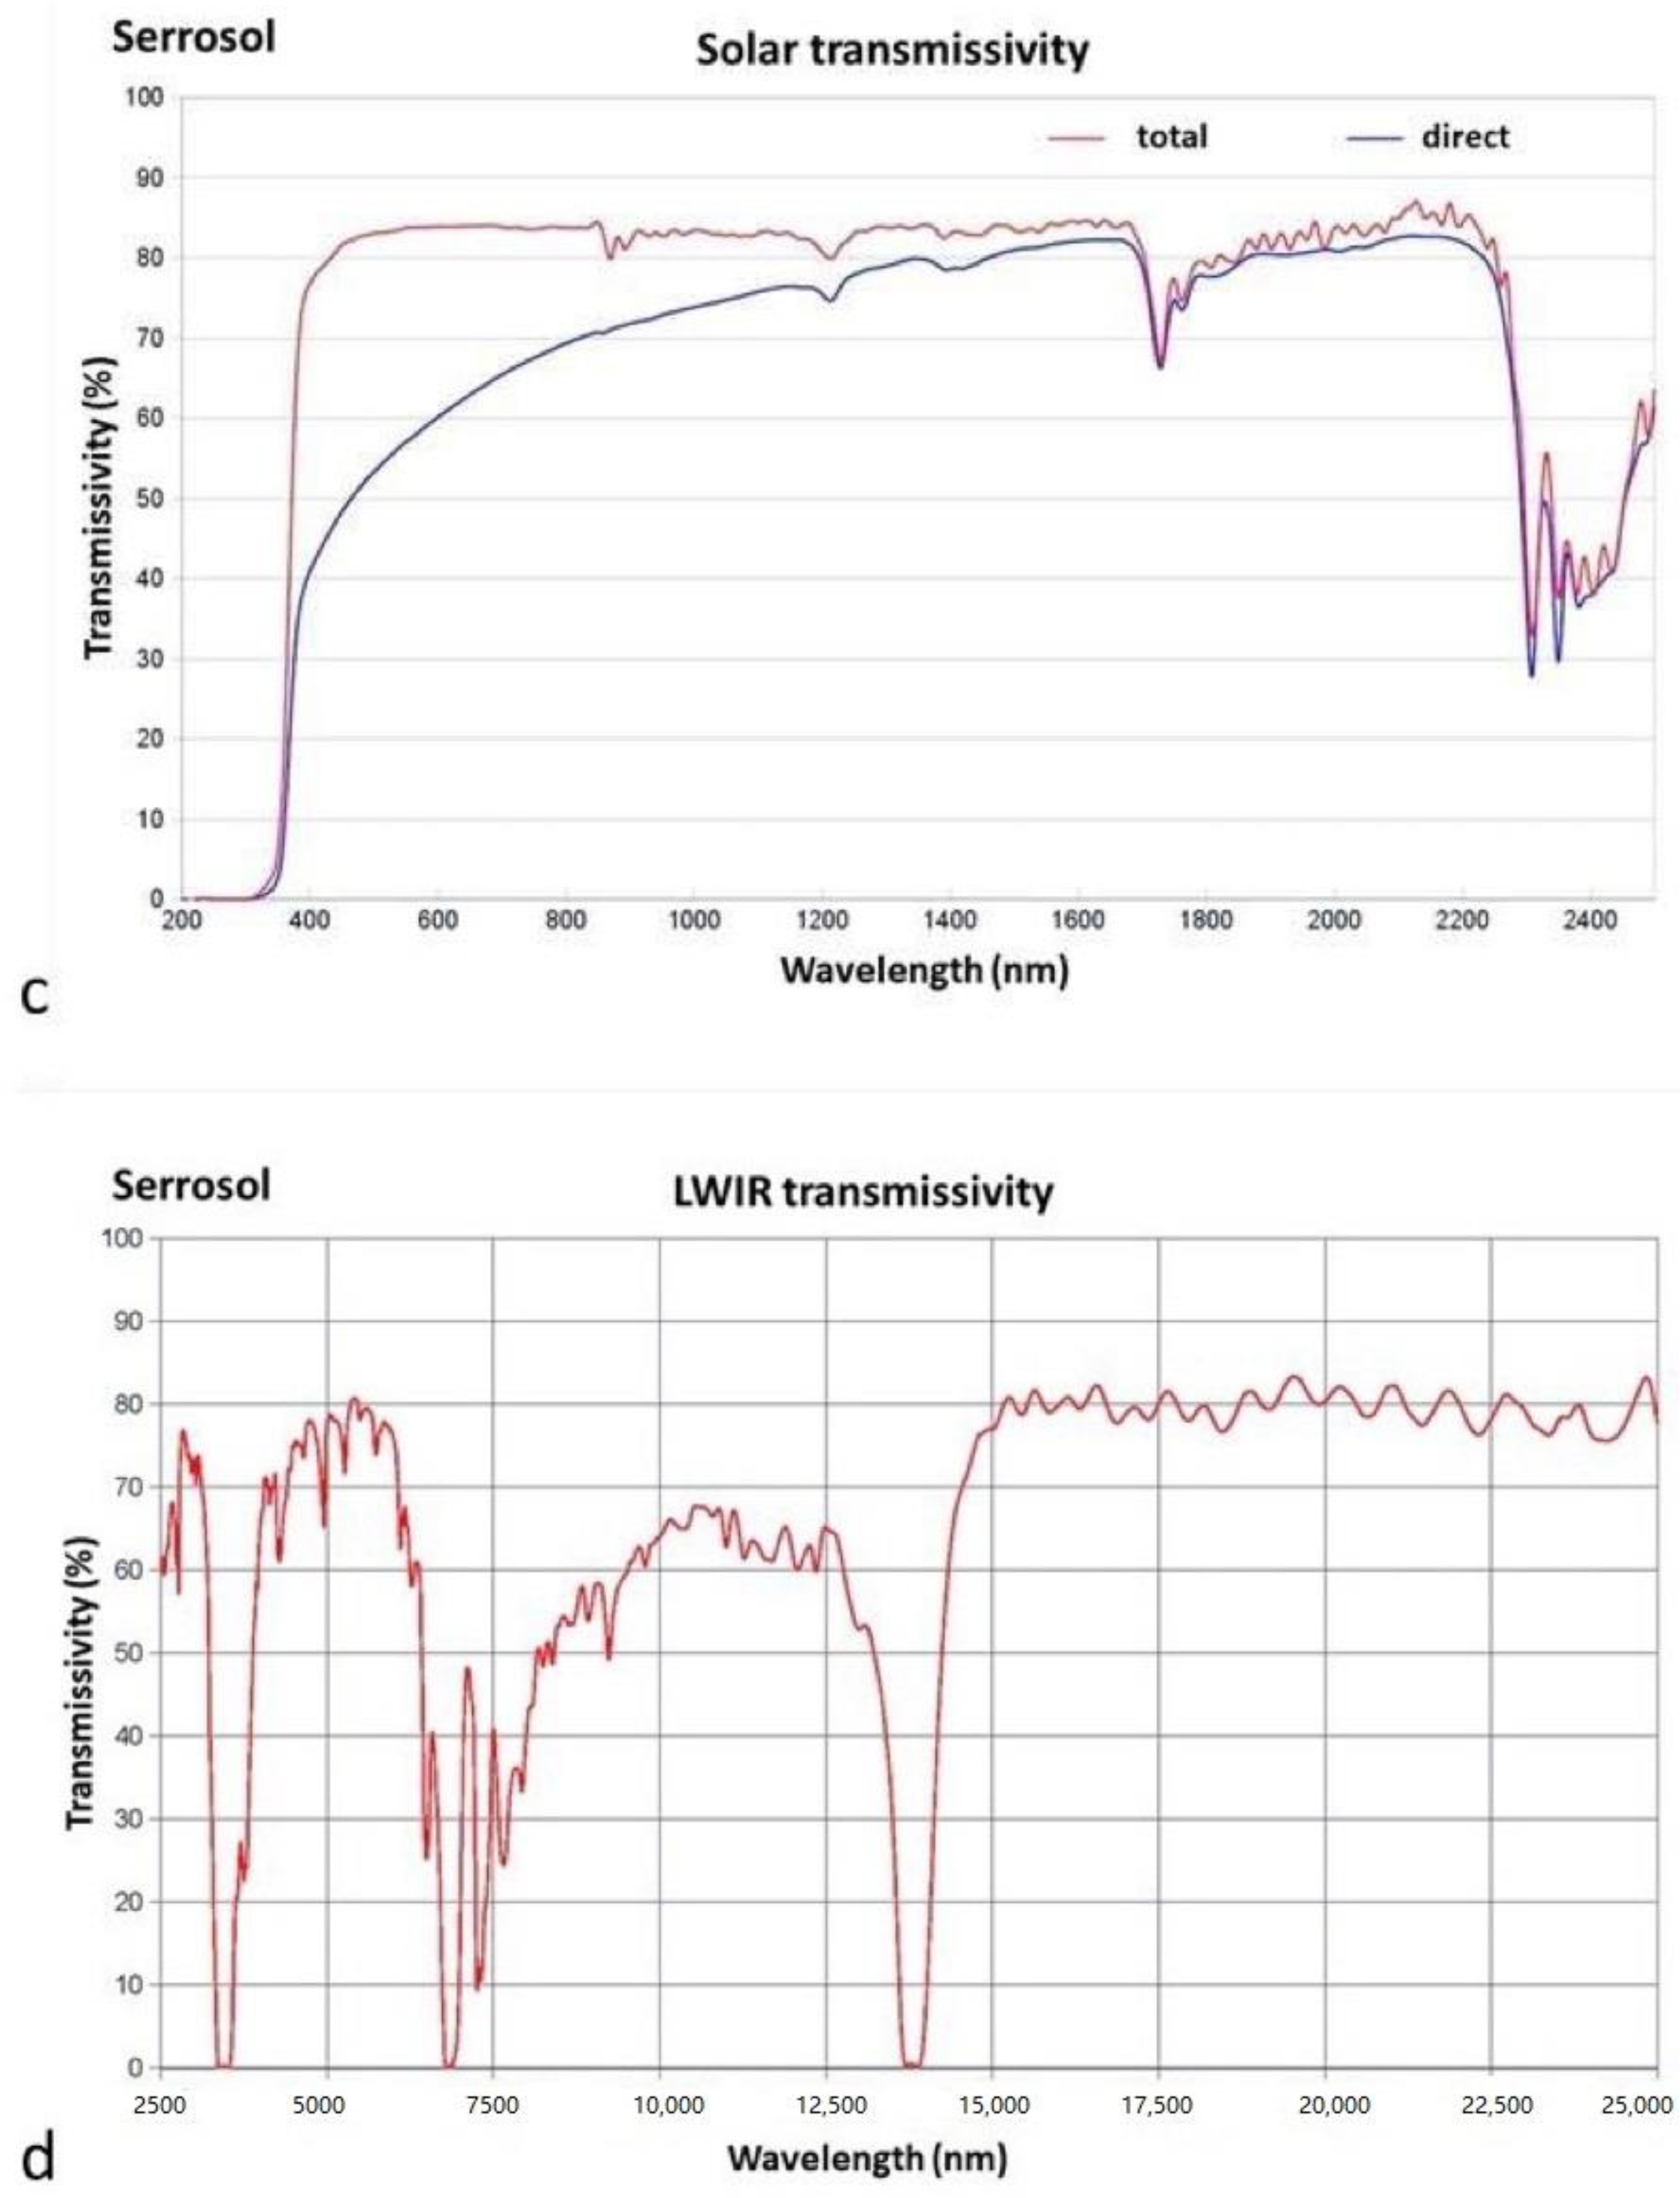
The spectroradiometric properties of the two plastic sheets were tested in the wavelength range of solar radiation (200–2500 nm), photosynthetic active radiation (PAR, 400–700 nm), near infrared short radiation (NIR, 700–2500 nm), and Long Wave Infrared radiation (LWIR, 7500–12,500 nm) [17]. Briefly, direct transmissivity to solar radiation having perpendicular ray incidence was measured (10 nm step) using a UV VIS-NIR spectrophotometer (Lambda 950 Perkin Elmer, Waltham, MA, USA); total transmissivity was assessed by means of an integrating sphere; diffuse transmissivity was calculated as a difference between total and direct transmissivity. Transmissivity coefficients (τ) were calculated, according to Vox and Schettini (2007) [36], as weighted average values of spectral transmissivity. Transmissivity to LWIR was measured (4 cm−1 step), with direct perpendicular ray incidence, using a Perkin-Elmer FT-IR 1760 X spectrophotometer; τ was calculated, according to Schettini and Vox (2012) [37], as average transmissivity. The samples were taken in four different positions of the top plastic sheets: two on the east-facing sheet side and two on the west-facing sheet side. For each position, five specimens (50 × 70 mm) were tested. The radiometric coefficients were calculated using the average values of the measurements.
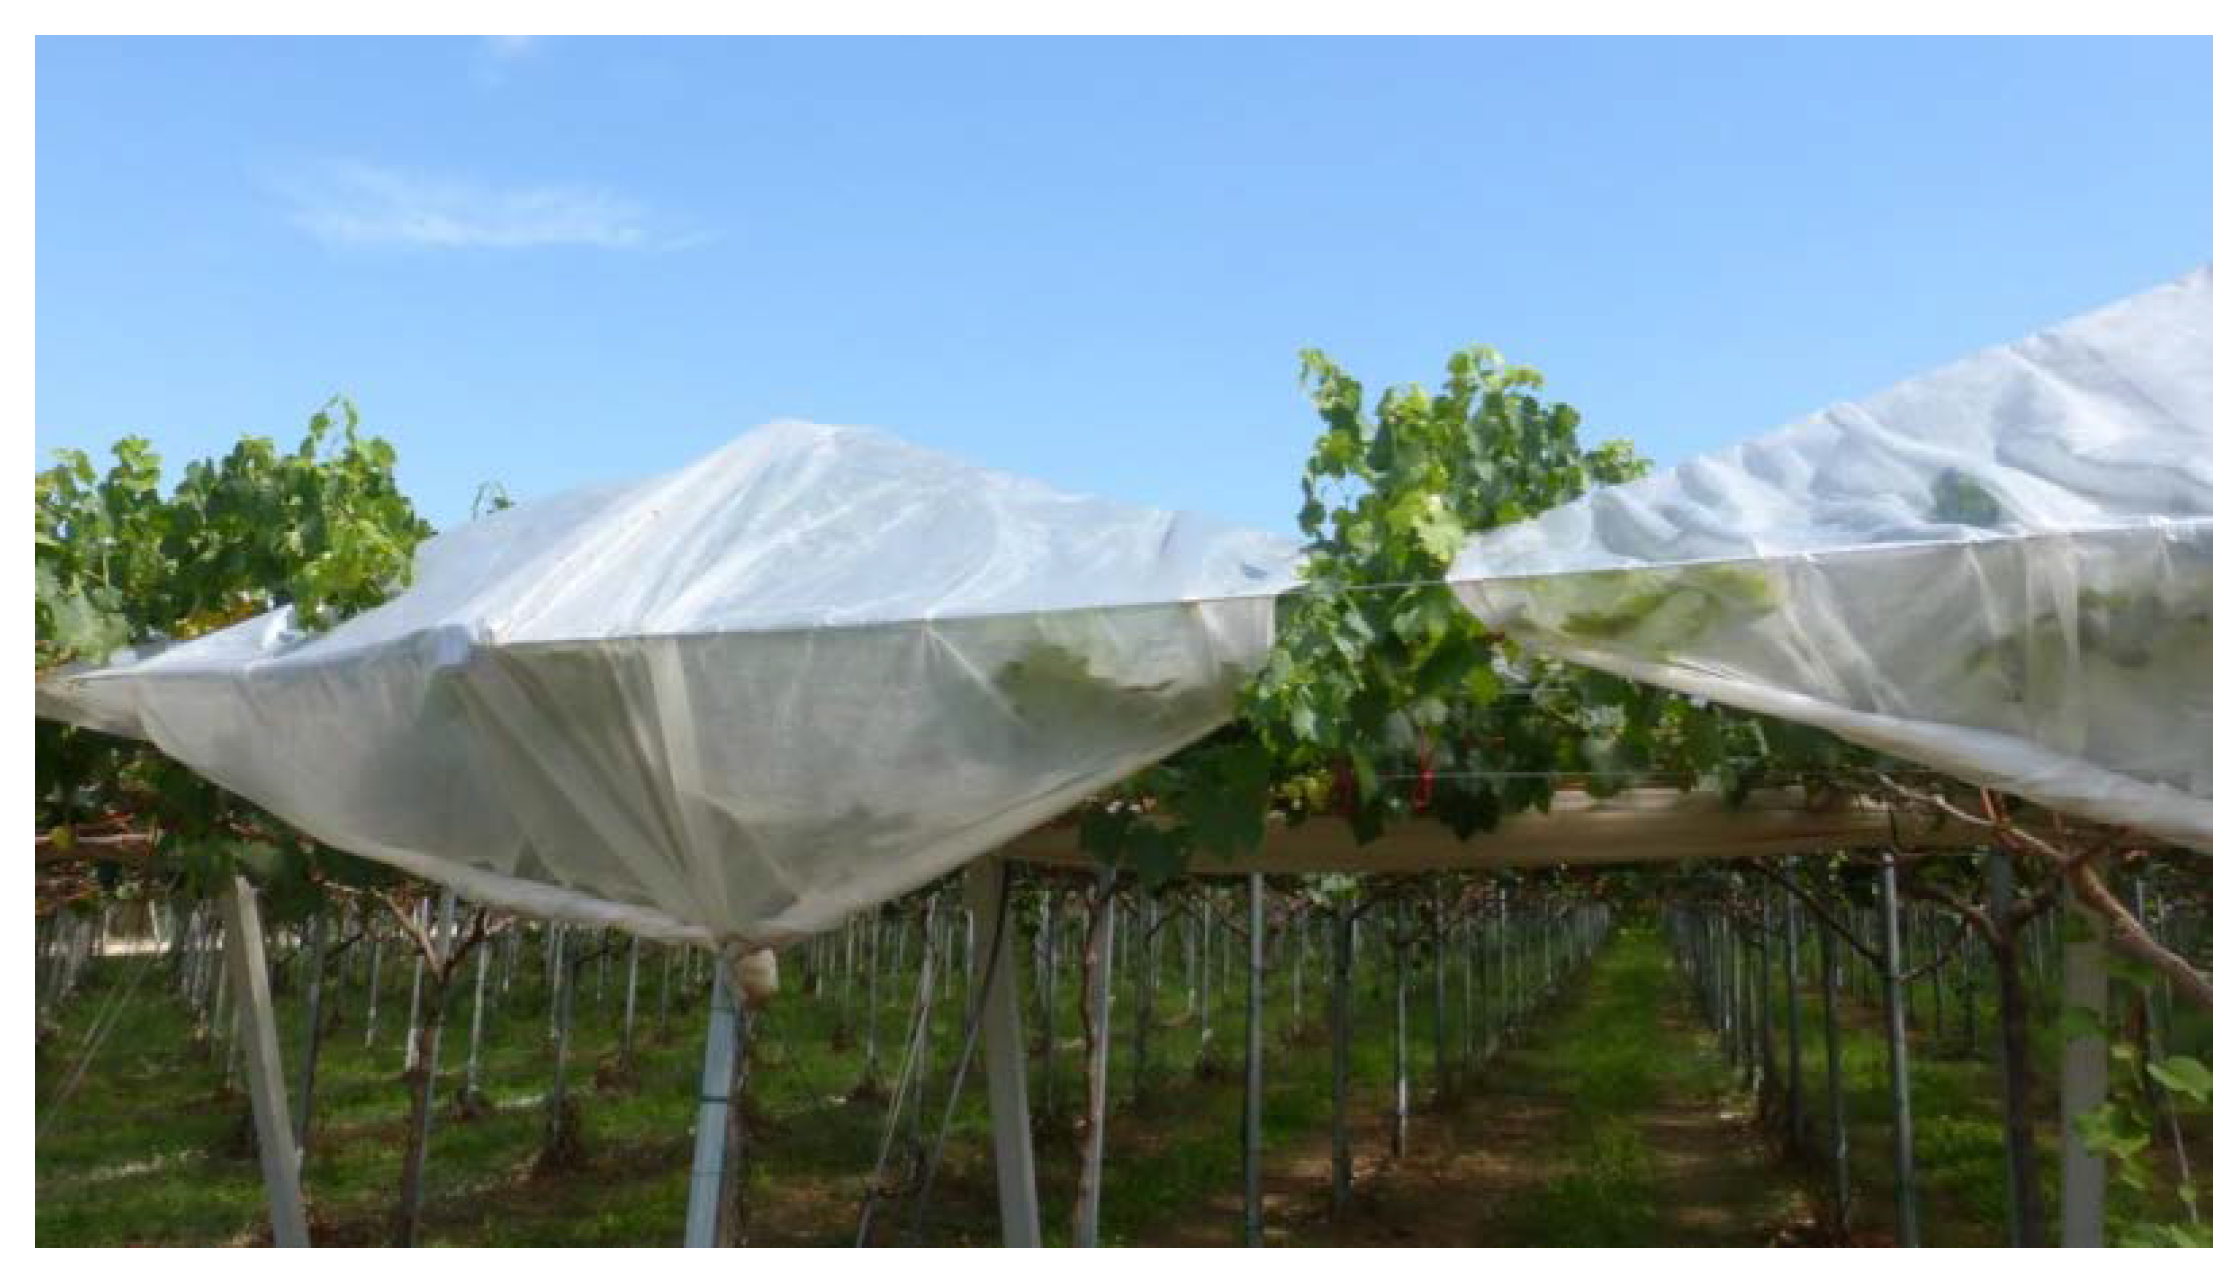
In June and July, the hottest period before grape harvest, the side plastic sheets of the vineyards were removed to improve air circulation and reduce overheating, so vines remained covered only by the top plastic sheets (Figure 3).
The microenvironment conditions were monitored under the two covers and in the open air (2 stations per vineyard) as previously described [38]. Briefly, the following parameters were assessed at 2 m height: over-canopy photosynthetic photon flux (PPF), air temperature and relative humidity (RH), and wind speed (Decagon Devices’s sensors and data loggers); data were recorded at 15′ frequency. The reference evapotranspiration (ET0) was estimated as standardized reference evapotranspiration (ETsz, Equation (1)) using the Penman–Monteith simplified model according to indications of the Environmental and Water Resources Institute of the American Society of Civil Engineers:
ET sz = 0.48   Δ   ( R n G ) + γ   C n T + 273   u 2   ( e s e a ) Δ + γ   ( 1 + C d   u 2 )
where Δ is the slope of saturation vapor pressure-temperature curve, Rn is the net radiation, G is the soil heat flux density, γ is the psychrometric constant, Cn is the numerator constant (1600 for tall crops), Cd is the denominator constant (0.38 for tall crops), T is the mean daily air temperature at 1.5 to 2.5 m height, u2 is the wind speed at 2 m height, es is the saturation vapor pressure at 1.5 to 2.5 m height, ea is the mean saturation vapor pressure at 1.5 to 2.5 m height. All the parameters of Equation (1) that were not measured were calculated as suggested by ASCE-EWRI (2005) [39]. The net radiation, that is the main ET0 driving force [40,41,42,43], was derived from PAR values using Equation (2):
R n = PAR   × 0.219 × 0.0864  
Microenvironment data recorded under the coverings and in open field were downloaded using the ECH2O program. Daily and monthly average values were calculated, and graphs of daily average values were elaborated by means of the Statistical Analysis System version 9.4, SAS Institute, Cary, NC, USA. Standard errors were calculated for the monthly averages. Linear regressions between daily ET0 in open air and ET0 under each cover were obtained by applying the REG procedure and the PLOT procedure of the above mentioned statistical package.

3. Results

3.1. Sheet Radiometric Properties

The spectrophotometric analyses of the plastic covers highlighted their different radiometric properties (Figure 4). Cover S had more transmissivity to total and direct PAR (10% and 16% more, respectively), but lower diffusivity (6% less) than cover C (Table 2). Cover S showed also a greater transmissivity to the NIR range, either in terms of total radiation or, even more, in terms of direct radiation (8% and 20% more, respectively), but showed lower diffusivity (13% less). On the other hand, it resulted to have a higher transmissivity in the LWIR range, hence, during the night, was able to dissipate more heat than cover C. The latter proved to have much greater transmissivity to UV radiations, i.e., almost double in terms of direct radiation and more than double in terms of total and diffuse radiation; however, this wavelength range has a negligible contribution to the thermal balance of plastic coverings.

3.2. Microenvironment Conditions

3.2.1. First Year of Trial

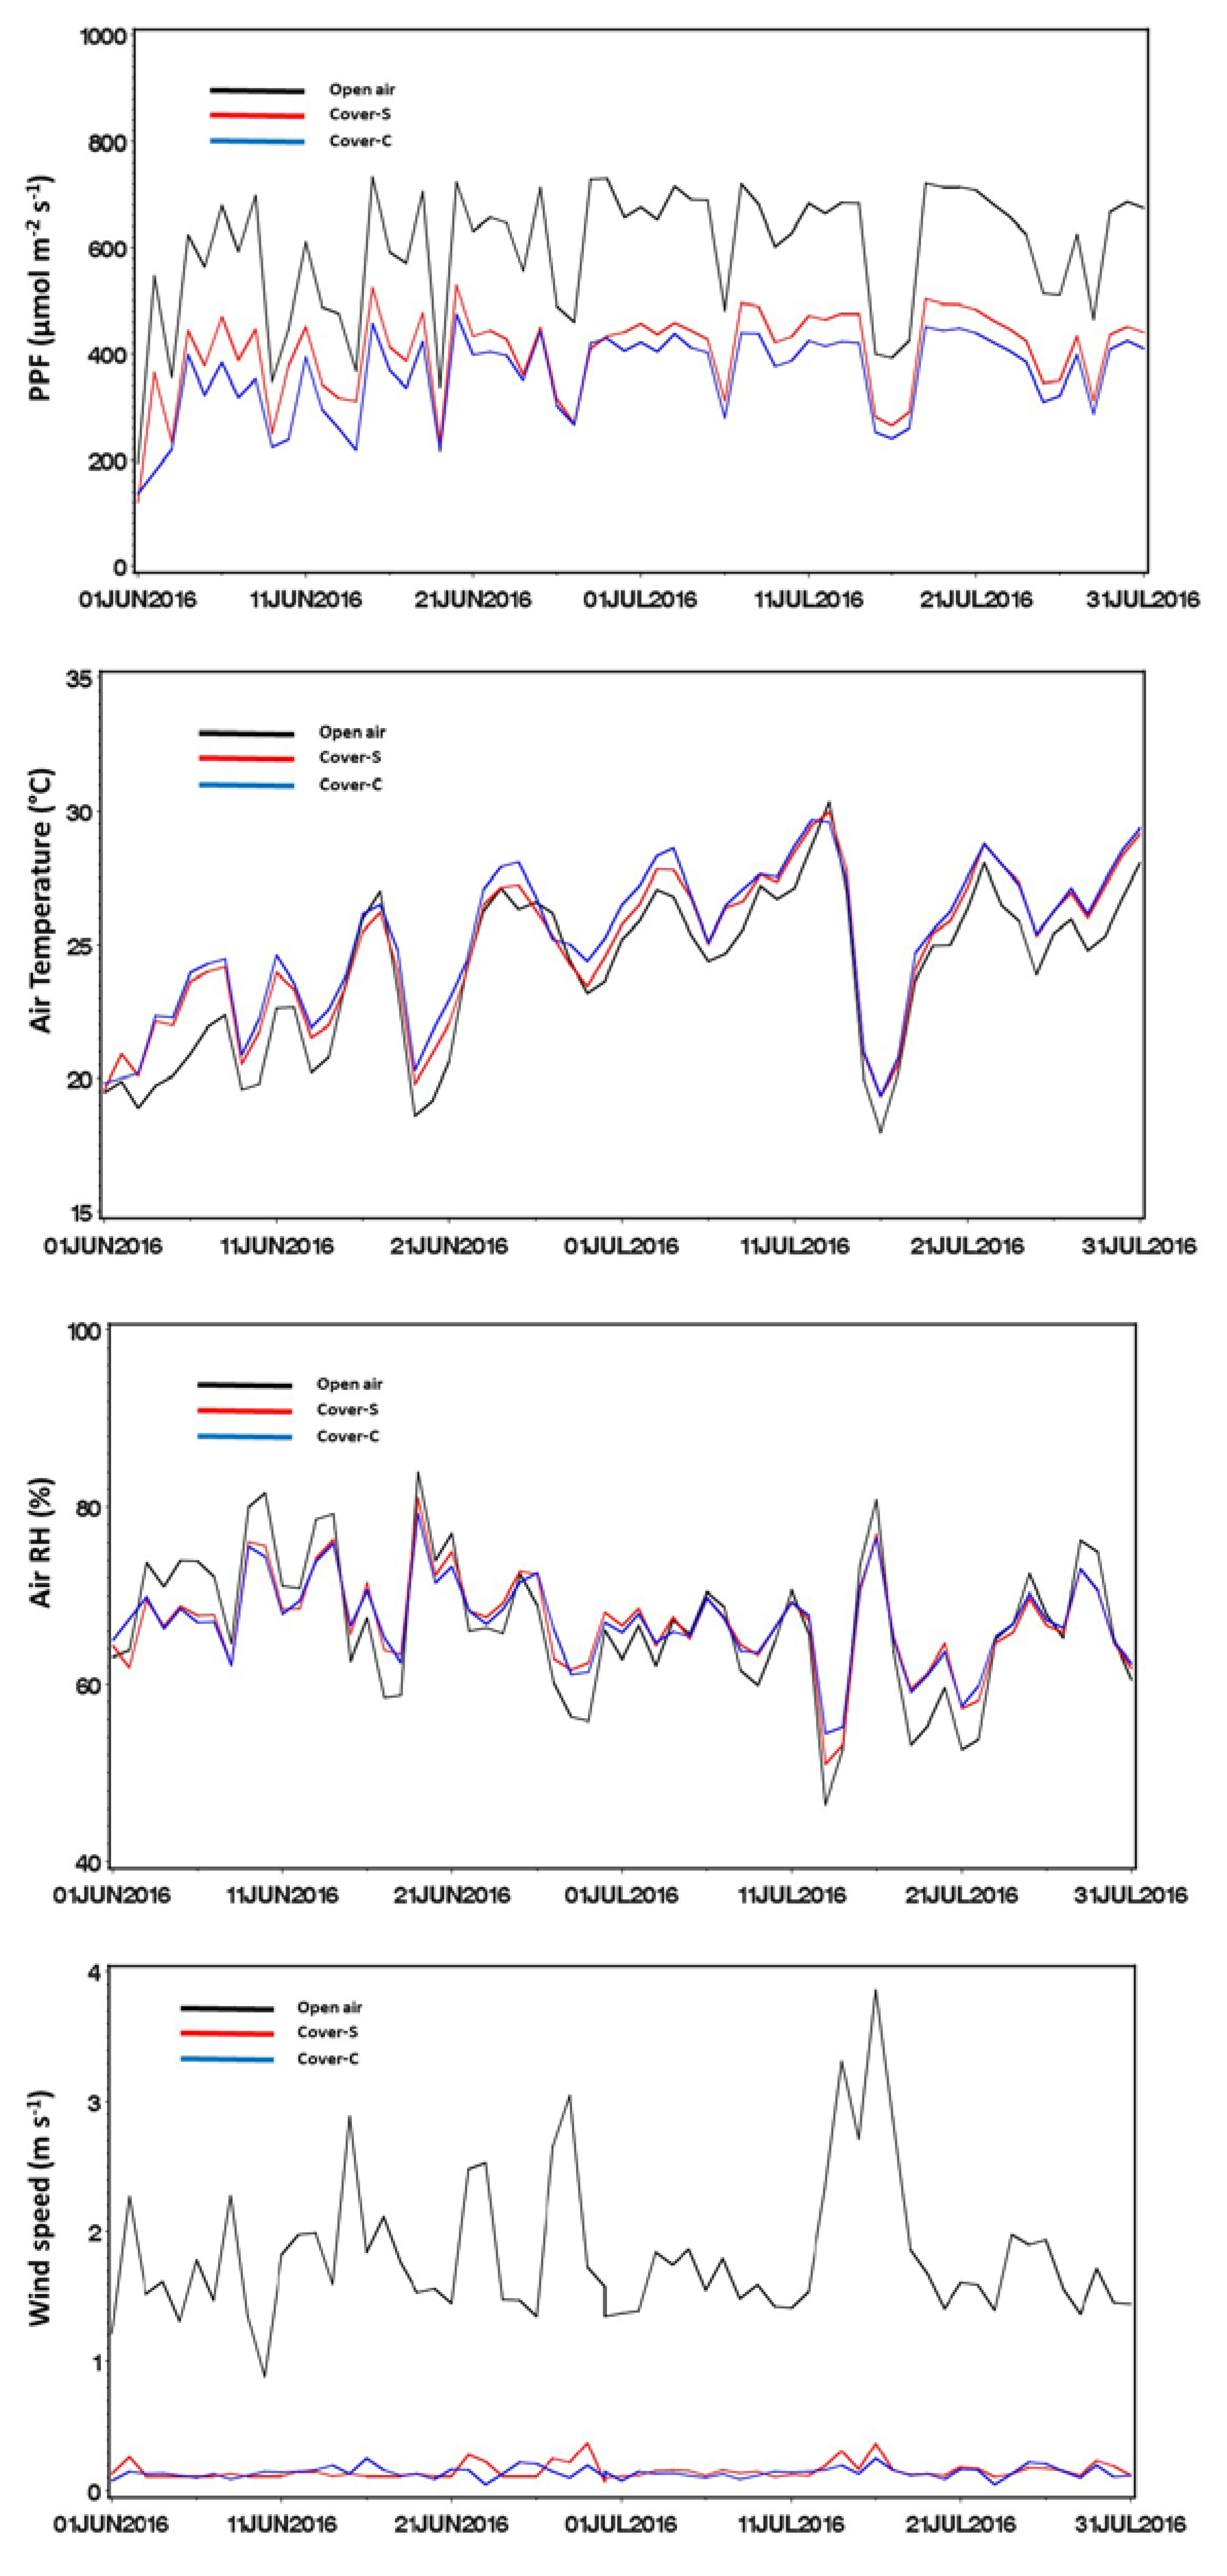
Agrometeorological data recorded in the first year showed that the monthly average of daily photosynthetic photon flux in the open field was about 543 ± 11.37 μmol m−2 s−1 in June and 664 ± 8.52 μmol m−2 s−1 in July. The sheets induced a reduction of average PPF equal to −29% (cover S) and −31% (cover C) in June, and of −35% (for both covers) in July. The patterns of PPF intercepted under the sheets followed that of values recorded in the open field (Figure 5). However, the difference of PPF available outside and under the sheets was not constant over time, since it was influenced by the sky conditions, being greater with clear skies. The irradiance intercepted under the two covers was quite similar: the biggest differences were around 16% in June and 6% in July; cover C showed a tendency for smaller values than cover S, as expected based on the radiometric properties of the two sheets.
The monthly average of daily temperatures in the open air was 22.50 ± 0.33 °C in June and 27.12 ± 0.34 °C in July. The pattern of temperatures under the sheets followed that found in the open field, but reached higher values either in June (1.5 °C to 3.5 °C more) or in July (0.7 °C to 2.0 °C more). The air temperature under the two covers was very similar, with a slight tendency to higher values under cover S: the maximum difference between the covers was 0.8 °C.
The monthly average of daily air relative humidity in the open field was 65.67 ± 1.58% in June. The values recorded under the coverings sometimes coincided with those in the open air, but more often they were lower; the maximum decrement was about −9% under cover S and −4% under cover C. In July, RH in open air felt to a mean value of about 59.0 ± 0.87%. Under the covers, the RH values incremented up to +21%.
The monthly average of daily wind speed in the open air were slightly greater in June (1.82 ± 0.07 m s−1) than in July (1.65 ± 0.05 m s−1). The covers induced a decrement of windiness by about −90%. Small differences were observed between the mean wind speed under cover S (0.17 ± 0.01 m s−1) and cover C (0.14 ± 0.01 m s−1).

3.2.2. Second Year of Trial

Agrometeorological data recorded in the second year (Figure 6) showed that the monthly average of daily PPF available in open air was about 519 ± 15.92 μmol m−2 s−1 in June and 627 ± 18.11 μmol m−2 s−1 in July, therefore, it was similar to that found in the previous year; also, the reduction of solar radiation passing through the sheets was very close to that previously found (−30% with cover C and −38% with cover S, respect to open field).
The monthly average of the daily temperature outside the plastic sheets was 20.99 ± 0.45 °C in June and 25.51 ± 0.45 °C in July, which is about 2 degrees below that recorded in the first year. Plastic covers increased the air temperature up to about 2.5 °C in June and 1.0 °C July; a very slight tendency to higher values was noticed under the cover S respect to cover C (max. +0.2 °C in June and +0.8 °C in July). Hence, all the trends that had emerged in the first year were confirmed.
The monthly average of daily RH in open air was 69.06 ± 0.86% in June and 64.25 ± 1.39 % in July. Until mid-June, the plastic covers reduced RH with a maximum decrement of about 6% and 9% with cover C and cover S, respectively, while they had the opposite effect for the next 45 days, as already observed in July of the first year.
The monthly average of daily wind speed was very close to that recorded in the same period of the previous year, either in open air (1.84 ± 0.09 m s−1 in June, 1.82 ± 0.10 m s−1 in July) or under cover S (0.15–0.16 ± 0.10 m s−1 in June and July) and cover C (0.14 ± 0.01 m s−1 in both months). Therefore, the reduction in windiness due to the plastic sheets was again about −90%. Wind speed was the parameter that manifested the greatest difference between the external and internal microenvironment.

3.3. Estimated ET0

The monthly average of daily ET0 estimated in open air was about 4.6 and 4.1 mm d−1 in June of the first year and of the second year, respectively; in July, it increased, reaching about 5.1 and 4.7 mm d−1. The average daily ET0 under covers followed the same trends seen in open field (Figure 7), but, as presumable on the basis of the microenvironment data previously discussed, it was considerably lower: the effect of the plastic sheets was to reduce the monthly average of daily ET0 by 27–30% in June and 34–35% in July of the first year, and by 30–37% in June and 32–38% in July of the second year of trial.
The average values of daily ET0 estimated under the sheets were slightly lower for cover C than for cover S which had the greater total transmittance to PAR (+10%) and to NIR (+8). The mean differences of daily ET0 between covers were minimal in the first year (−4% in June and −1% in July), greater in the second year (−10% in June, −9% in July).
On a monthly basis, the ET0 cumulated in the open field in June and July was, respectively, about 138 and 157 mm in the first year and 122 and 147 mm in the second year (Table 3).
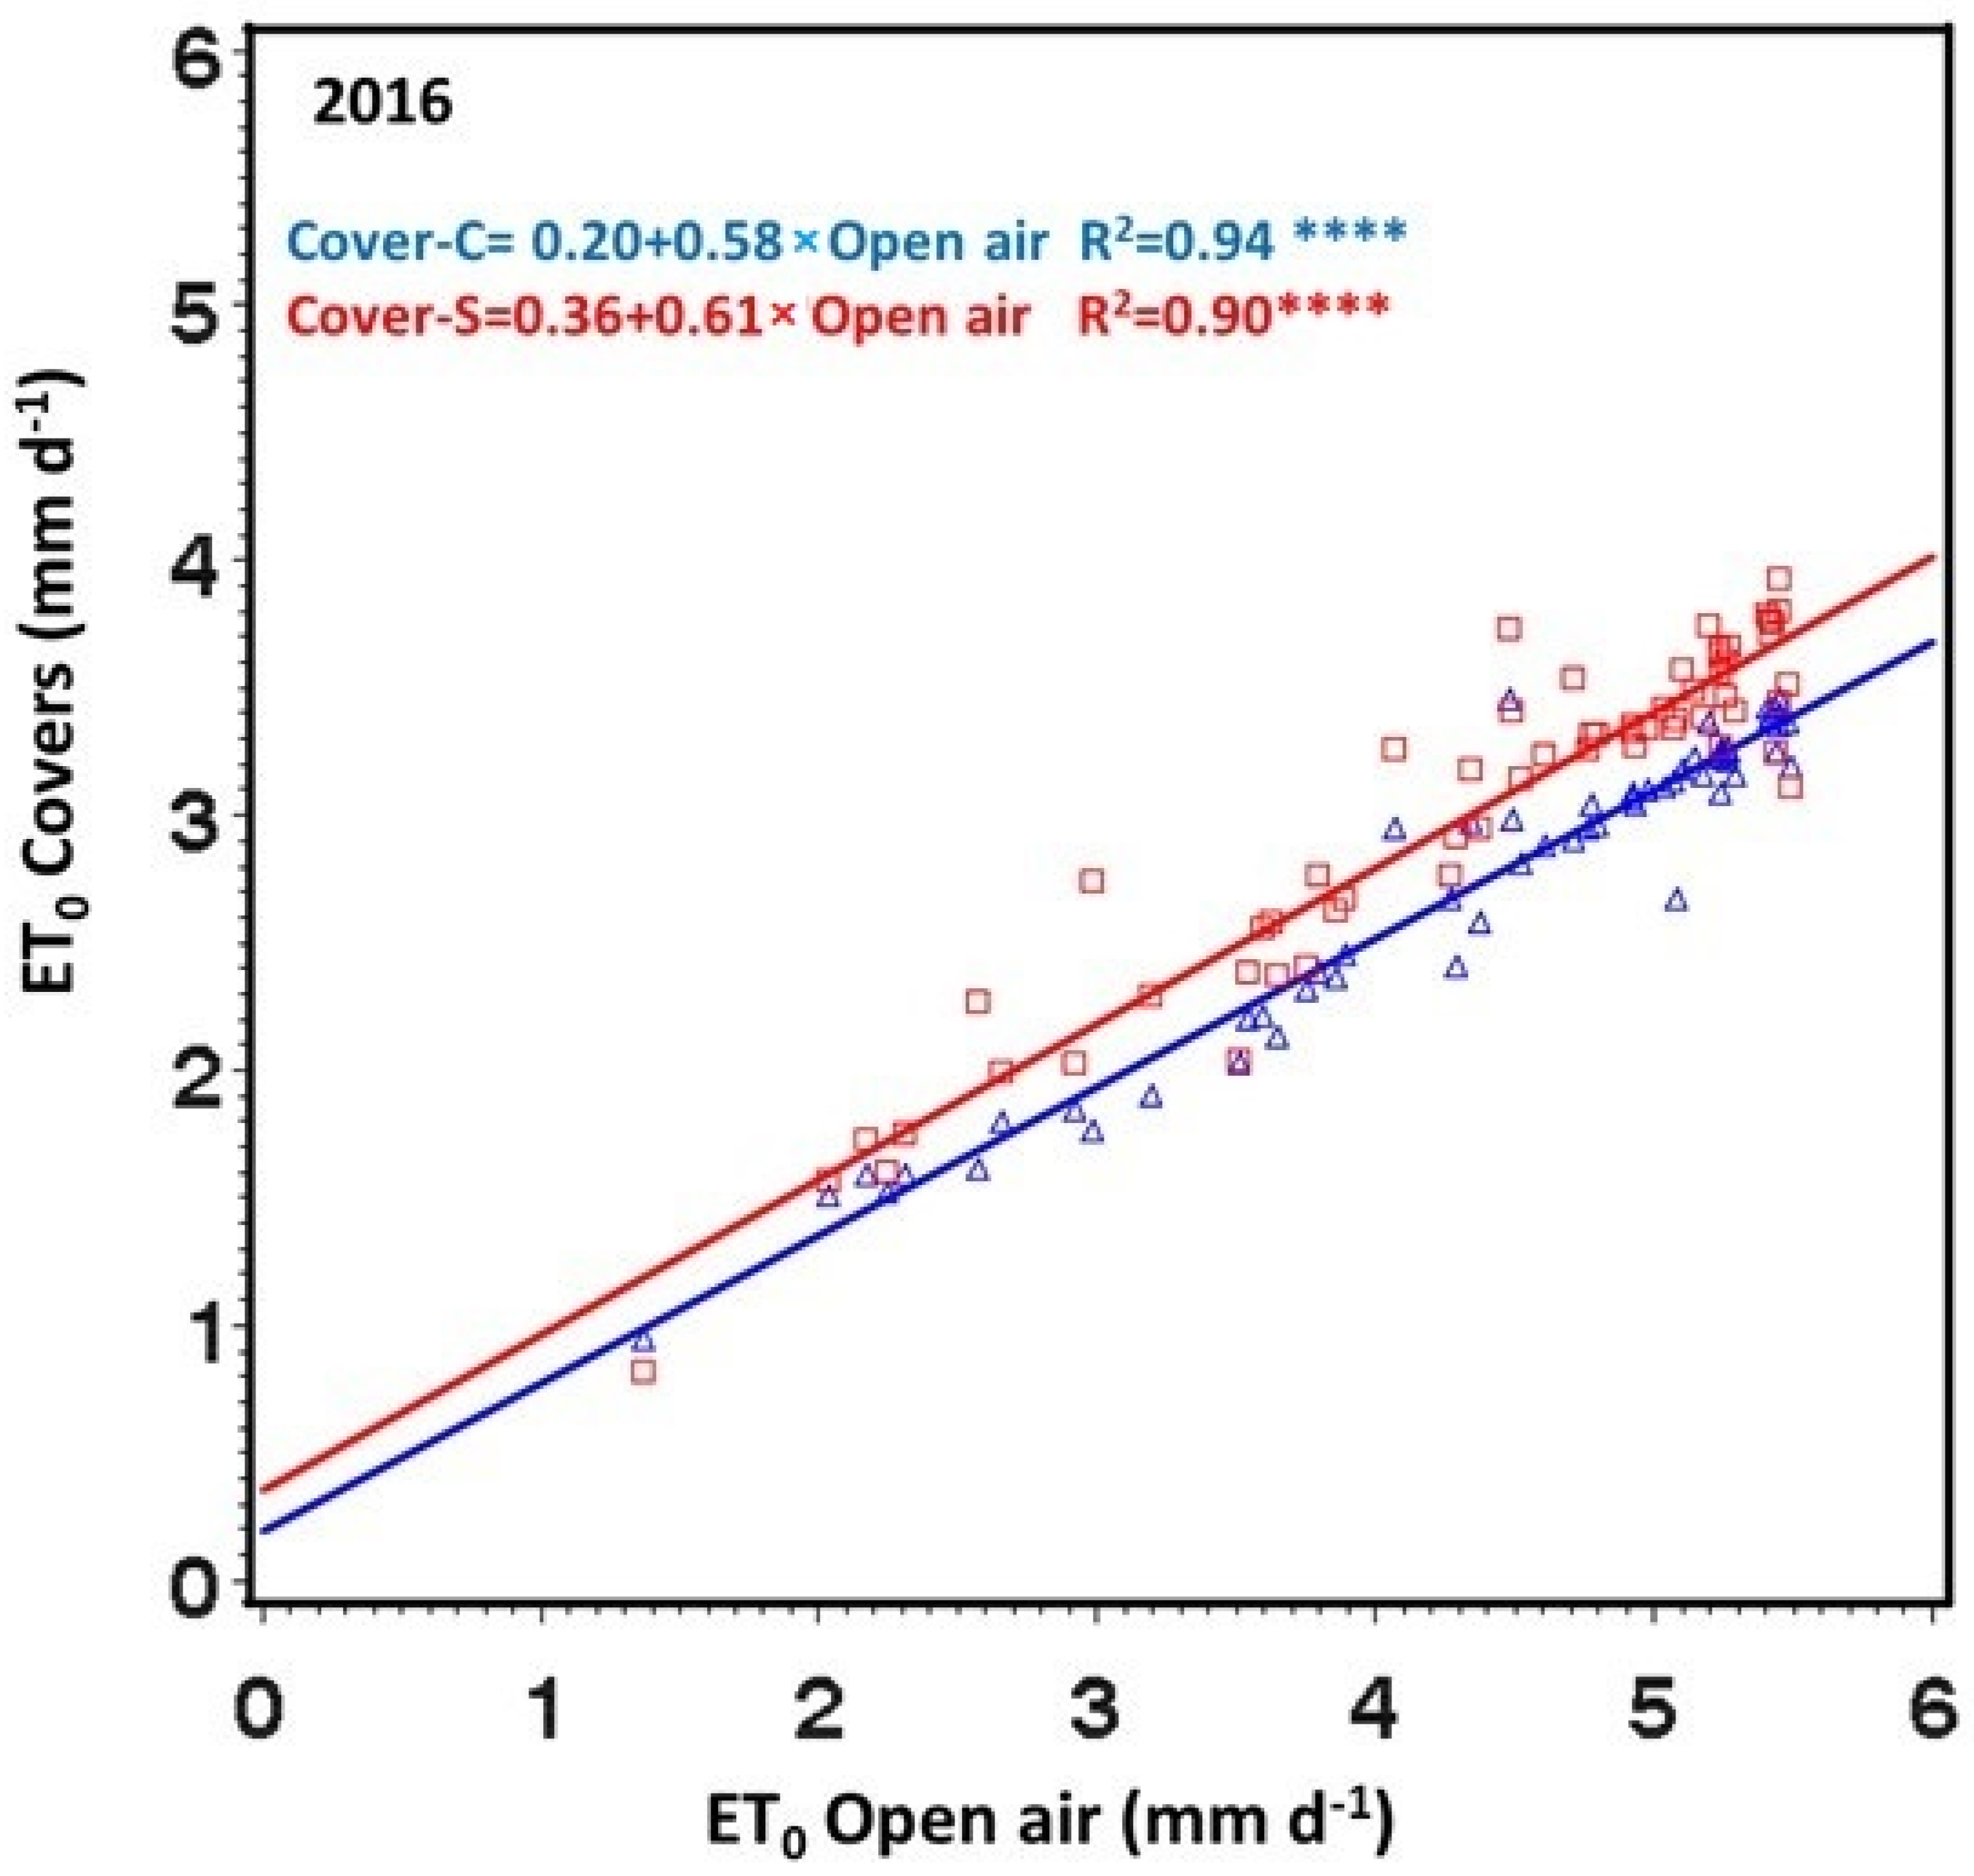
The relationship between daily ET0 in open air and under cover C or cover S in June and July of the second year of trial (Figure 8) shows linear regressions with highly significant R2 for both covers. According to the angular coefficients of the regression lines, in this two-month period, the decrease of ET0 under cover C and cover S compared to the external environment was 58% and 61%, respectively.

4. Discussion

Both covers, in terms of transmissivity to solar radiation, PAR and LWIR, showed the optimal characteristics required for crop protection and “precociation”. According to the radiometric coefficients (Table 2), the theoretical reduction of total photosynthetic solar radiation could be expected at about −17% with cover S and −27% with cover C. However, cover S reduced the incoming PAR more than expected. This result could have been affected by several factors reported in the literature [15,44], such as the degree of sheet tension and its resulting inclination with respect to sun’s rays, the amount of dust and/or humidity retained by the sheet surface, the opacification of the plastic material caused by the sun radiation exposure, etc.
Plastic covers increase the air temperature with respect to open fields, as they limit the heat dispersion [15,44]. This effect was found to be greater in the relatively fresher month, which was June, than in the warmer one, namely July. Comparing the two covers, the tendency shown by the cover S to induce slightly warmer air temperatures than cover C was evidently related to its higher transmissivity in the PAR and NIR wavelength ranges. However, since during all the test period the lateral sheets of the two coverings were open, the difference in air temperature between coverings was very little. The biggest differences occurred on days with very clear skies, i.e., when the direct component of solar radiation was high and therefore more heating.
The influence of the covers on air relative humidity changed over time. During most of June of the first year and during the first half of June of the second year, the RH inside the coverings was often lower than that in the open field, likely due to the higher thermal regime under cover. A generally opposite trend occurred in the remaining period of the trial, that is, when the differences between external and internal temperatures were smaller. In addition, it is to consider that, at that time of the season, the canopy of all the vineyards was fully expanded and, thus, the total amount of transpired water increased enriching the surrounding air with humidity which under the coverings was more retained, due to the scarce air movement that occurred in the protected environment.
The covers significantly slowed the wind speed inside the vineyard by acting as a physical barrier capable of extinguishing the gusts of air. Wind speed was the parameter that showed the greatest difference between the external and internal microenvironment in this trial. In addition to attenuating the wind speed near the crop, screens used for crop protection modify the characteristics of air turbulence and hence reduce the effect of the wind on the exchange of heat and water vapor between plant canopy and surrounding atmosphere [7].
The daily patterns of ET0 closely followed those of PAR, either in open field or inside the coverings (Figure 5 and Figure 6). Overall, the plastic sheets reduced ET0 between 27% (cover S in June) and 35% (cover C in July) in the first year and between 30% (cover S in June) and 38% (Cover C in June and July) in the second year. The range of these values is similar to that found by Cardoso et al. (2008) [25]. Therefore, plastic sheet coverings can give a significant contribution to the reduction of the atmospheric evaporative demand and, therefore, to the use of the water resource required by the table grape vineyard. The most pronounced differences between open air and protected environment occurred on days with clearer skies, warmer temperatures and lower relative humidity, while vice versa, the smaller differences occurred on cloudy days with relatively cooler temperatures and higher relative humidity, i.e., when the barrier effect exerted by the plastic sheets against incoming solar radiation was attenuated.
Cover C, which had the lower transmittance to PAR, NIR and total solar radiation, showed the tendency to induce lower ET0 compared to cover S. Depending on the environmental conditions, the differences between the two types of plastic sheets were almost zero or reached 9%, which is a value close to the difference between their coefficients of transmittance at PAR (10%) and NIR (7%).
The practice of growing fruit crops under plastic sheets is presently expanding and involves more crops, such as cherry, apple, kiwi, etc. These screens reliably transmit the spectral signals emitted by vegetation [45], so they do not hinder the application of the remote sensing techniques, which have also been implemented for monitoring evapotranspiration and enhancing the accuracy of input deliveries, and, thus, the sustainability of cultivation. It cannot be ignored that agricultural plastics are mostly derived from petrochemical sources; nevertheless, it is possible to provide their correct mapping, collection, disposal and recycling process at the end of the life cycle [44,46,47], improving their environmental sustainability.

5. Conclusions

In the present study, both the tested plastic coverings modified the microclimate by exerting a barrier effect against the incoming solar energy and wind speed, reducing the reference evapotranspiration by 30–38% with respect to open field. ET0 is known to be primarily affected by net radiation which, in this trial, had PAR as a reliable proxy. The inside air temperature and relative humidity variation, compared to the outside ones, had a lower effect on ET0 than net radiation.
In addition, this study showed that the specific radiometric properties of the two plastic sheets may influence the ET0 under coverings. In fact, the type of plastic sheet, with its different transmissivity to the wavelengths of the radiation spectrum, modulated the reduction of ET0 in the protected environment to a different extent. Therefore, aiming at maximizing the effect exerted by plastic coverings in reducing the evaporative demand, their radiometric properties should be also considered.

Author Contributions

Conceptualization, L.d.P. and V.N.; methodology, L.d.P., V.N., G.V. and E.S.; software, V.N., G.V. and E.S.; validation, L.d.P., V.N., G.V. and E.S.; formal analysis, L.d.P., V.N., G.V. and E.S.; investigation, L.d.P., V.N., G.V. and E.S.; resources, L.d.P., V.N., G.V. and E.S.; data curation, V.N. and G.V.; writing—original draft preparation, L.d.P. and V.N.; writing—review and editing, L.d.P., V.N., G.V. and E.S. All authors have read and agreed to the published version of the manuscript.

Funding

This research was partially supported by Beaulieu Technical Textiles (Comines-Warneton, Belgium), and partially carried out by means of staff and equipment made freeely available by the University of Foggia, University of Turin, OP Agritalia and University of Bari, in preparation for the Task 3.3 of the regional research project P.S.R. Puglia 2014/2020—Misura 16 Cooperazione—SM 16.2 “Sostegno a progetti pilota e allo sviluppo di nuovi prodotti, pratiche, processi e tecnologie”. Avviso Pubblico approvato con D.A.G. n. 194 del 12/09/2018. Progetto “Uve Apirene pugliesi dal campo alla tavola: innovazione, nutrizione, sostenibilità”—Acronimo: “UVAPULIA”—DDS N. 94250037606—CUP B49J20000130009. The first three partners are presently member of the GO (Operative Group) UVAPULIA.

Data Availability Statement

Not applicable.

Acknowledgments

The Authors thank Patrizio Limosani and Damiano Antoniciello (as fellows supported by the Giovanni Dalmasso Foundation of Turin) for their technical assistance, Laporta Farm for hosting the trial.

Conflicts of Interest

The authors declare no conflict of interest.

References

  1. Medrano, H.; Tomás, M.; Martorell, S.; Escalona, J.-M.; Pou, A.; Fuentes, S.; Flexas, J.; Bota, J. Improving water use efficiency of vineyards in semi-arid regions. A review. Agron. Sustain. Dev. 2015, 35, 499–517. [Google Scholar] [CrossRef] [Green Version]
  2. Mirás-Avalos, J.; Araujo, E. Optimization of Vineyard Water Management: Challenges, Strategies, and Perspectives. Water 2021, 13, 746. [Google Scholar] [CrossRef]
  3. Van Leeuwen, C.; Destrac-Irvine, A.; Dubernet, M.; Duchêne, E.; Gowdy, M.; Marguerit, E.; Pieri, P.; Parker, A.; De Rességuier, L.; Ollat, N. An Update on the Impact of Climate Change in Viticulture and Potential Adaptations. Agronomy 2019, 9, 514. [Google Scholar] [CrossRef] [Green Version]
  4. Cataldo, E.; Salvi, L.; Mattii, G.B. Effects of irrigation on ecophysiology, sugar content and thiol precursors (3-S-glutathionylhexan-1-ol) on cv. Sauvignon Blanc. Plant Physiol. Biochem. 2021, 164, 247–259. [Google Scholar] [CrossRef] [PubMed]
  5. OIV (International Organisation of Vine and Wine). Statistical Report on World Vitiviniculture. 2019. Available online: http://www.oiv.int/public/medias/6782/oiv-2019-statistical-report-on-world-vitiviniculture.pdf (accessed on 12 January 2021).
  6. Yang, C.; Menz, C.; Fraga, H.; Costafreda-Aumedes, S.; Leolini, L.; Ramos, M.C.; Molitor, D.; van Leeuwen, C.; Santos, J.A. Assessing the grapevine crop water stress indicator over the flowering-veraison phase and the potential yield lose rate in important European wine regions. Agric. Water Manag. 2021, 261, 107349. [Google Scholar] [CrossRef]
  7. OIV-International Organisation of Vine and Wine. Sustainable Use of Water in Winegrape Vineyards, 1st ed.; OIV Publications: Paris, France, 2021; ISBN 978-2-85038-023-5. Available online: https://www.oiv.int/en/viticulture/the-sustainable-use-of-water-in-winegrape-vineyards (accessed on 1 November 2021).
  8. Novello, V.; de Palma, L.; Tarricone, L. Influence of girdling and plastic covering on leaf gas exchange, water potential and viticultural performance of table grape cv. Matilde. Vitis 1991, 38, 51–58. [Google Scholar]
  9. Rana, G.; Katerji, N.; Introna, M.; Hammami, A. Microclimate and plant water relationship of the “overhead” table grape vineyard managed with three different covering techniques. Sci. Hortic. 2004, 102, 105–120. [Google Scholar] [CrossRef]
  10. Teitel, M.; Wenger, E. The Effect of Screenhouse Roof Shape on the flow Patterns-Cfd simulations. Acta Hortic. 2012, 927, 603–610. [Google Scholar] [CrossRef]
  11. Pirkner, M.; Dicken, U.; Tanny, J. Penman-Monteith approaches for estimating crop evapotranspiration in screenhouses—A case study with table-grape. Int. J. Biometeorol. 2014, 58, 725–737. [Google Scholar] [CrossRef] [PubMed]
  12. De Almeida, L.V.B.; Rodrigues, W.; da Silva, J.R.; Figueiredo, F.A.M.M.D.A.; Deus, B.C.D.S.D.; Ruas, K.F.; Ferraz, T.M.; Martins, A.D.O.; Griffin, K.L.; Bressan-Smith, R.; et al. Transparent polyethylene covering film in tropical grapevines does not alter photosynthesis, plant growth, fruit quality or yield. Theor. Exp. Plant Physiol. 2020, 32, 255–270. [Google Scholar] [CrossRef]
  13. Novello, V.; De Palma, L. Growing Grapes under cover. Acta Hortic. 2008, 785, 353–362. [Google Scholar] [CrossRef]
  14. Duffie, J.A.; Beckman, W.A. Solar Engineering of Thermal Processes, 2nd ed.; Wiley: New York, NY, USA, 1980. [Google Scholar]
  15. Papadakis, G.; Briassoulis, D.; Scarascia-Mugnozza, G.; Vox, G.; Feuilloley, P.; Stoffers, J. Review Paper (SE—Structures and Environment): Radiometric and Thermal Properties of, and Testing Methods for, Greenhouse Covering Materials. J. Agric. Eng. Res. 2000, 77, 7–38. [Google Scholar] [CrossRef]
  16. Espí, E.; Salmerón, A.; Fontecha, A.; García, Y.; Real, A.I. PLastic Films for Agricultural Applications. J. Plast. Film Sheeting 2006, 22, 85–102. [Google Scholar] [CrossRef]
  17. Vox, G.; Schettini, E.; Scarascia Mugnozza, G.; Tarricone, L.; de Palma, L. Covering plastic films for vineyard protected cultivation. Acta Hortic. 2014, 1037, 897–904. [Google Scholar] [CrossRef]
  18. Joubert, C.; Young, P.R.; Eyéghé-Bickong, H.A.; Vivier, M.A. Field-Grown Grapevine Berries Use Carotenoids and the Associated Xanthophyll Cycles to Acclimate to UV Exposure Differentially in High and Low Light (Shade) Conditions. Front. Plant Sci. 2016, 7, 786. [Google Scholar] [CrossRef] [Green Version]
  19. Koyama, K.; Ikeda, H.; Poudel, P.; Goto-Yamamoto, N. Light quality affects flavonoid biosynthesis in young berries of Cabernet Sauvignon grape. Phytochemistry 2012, 78, 54–64. [Google Scholar] [CrossRef] [PubMed]
  20. Çoban, H. Effects of Plastic Covering on Yield, Physical and Chemical Characteristics of Some Table Grapes (Vitis vinifera L.). Asian J. Chem. 2007, 19, 4052–4058. [Google Scholar]
  21. Hernandes, J.L.; Júnior, M.J.P.; Blain, G.C.; Rolim, G.D.S. Comportamento produtivo da videira ’Niagara Rosada’ em diferentes sistemas de condução, com e sem cobertura plástica, durante as safras de inverno e de verão. Rev. Bras. de Frutic. 2013, 35, 123–130. [Google Scholar] [CrossRef] [Green Version]
  22. Tarricone, L.; Di Gennaro, D.; Amendolagine, A.; Notarangelo, L.; De Palma, L.; Vox, G.; Schettini, E. Effects of water regimes on vine performance and quality of ’sublima’ seedless table grape covered with plastic film to advance grape ripening. Acta Hortic. 2014, 1038, 593–599. [Google Scholar] [CrossRef]
  23. Deus, B.C.D.S.D.; Figueiredo, F.A.M.M.D.A.; De Almeida, L.V.B.; Ferraz, T.M.; Martins, A.O.; Rodrigues, W.P.; Viana, L.H.; Esteves, B.D.S.; Campostrini, E. Photosynthetic capacity of ’Niagara Rosada’ grapes grown under transparent plastic covering. Ciência Rural 2016, 46, 950–956. [Google Scholar] [CrossRef] [Green Version]
  24. Fidelibus, M.W.; Vasquez, S.J.; Kurtural, S.K. Late-season Plastic Canopy Covers Affect Canopy Microclimate and Fruit Quality of ‘Autumn King’ and ‘Redglobe’ Table Grapes. HortTechnology 2016, 26, 141–147. [Google Scholar] [CrossRef] [Green Version]
  25. Holcman, E.; Sentelhas, P.C.; Conceição, M.A.F.; Couto, H.T.Z. Vineyard microclimate and yield under different plastic covers. Int. J. Biometeorol. 2017, 62, 925–937. [Google Scholar] [CrossRef] [PubMed] [Green Version]
  26. Leitão, M.D.M.V.B.R.; De Azevedo, P.V.; Lima, P.C.D.S.; De Oliveira, G.M.; Dos Santos, C.A.C. Influence of Plastic Covering on the Microclimate in Vineyards in the São Francisco River Valley Region. Rev. Bras. Meteorol. 2017, 32, 399–407. [Google Scholar] [CrossRef] [Green Version]
  27. Cardoso, L.S.; Bergamaschi, H.; Comiran, F.; Chavarria, G.; Marodin, G.A.B.; Dalmago, G.A. Alterações micrometeorológicas em vinhedos pelo uso de coberturas de plástico. Pesqui. Agropecuária Bras. 2008, 23, 441–447. [Google Scholar] [CrossRef]
  28. Monteiro, R.; Rusin, C.; Fagherazzi, A.; Monteiro, P. Irrigation and Fertigation Management on Table Grape Under Plastic Cover in Serra Gaucha Region. In Proceedings of the Anais do II Inovagri International Meeting-2014; INOVAGRI/INCT-EI/INCTSal: Fortaleza, Ceará, Brazil, 2014; pp. 730–738. Available online: http://www.bibliotekevirtual.org/index.php/2013-02-07-03-02-35/simposios/221-ii-inovagri-2014/1413-ii-inovagri-2014-a098.html (accessed on 23 January 2022).
  29. Conceição, M.A.F.; De Souza, R.T.; Zeoli, J.D.J.S.; De Paula, M.V.B. Coeficiente de cultura (Kc) para videira com e sem cobertura vegetal no solo. Embrapa Uva E Vinho-Artig. Em Periódico Indexado 2018, 1, 234. [Google Scholar] [CrossRef] [Green Version]
  30. Koppen, W. Das geographisca System der Klimate. In Handbuch der Klimatologie; Koppen, W., Geiger, G., Eds.; Gerbuder Borntraeger: Berlin, Germany, 1936; pp. 1–44. [Google Scholar]
  31. Winkler, A.J.; Cook, J.A.; Kliewer, W.M.; Lider, L.A. General Viticulture; Univ. of California Press: Berkley, CA, USA, 1974. [Google Scholar]
  32. Blanco-Ward, D.; Queijeiro, J.G.; Jones, G.V. Spatial climate variability and viticulture in the Miño River Valley of Spain. VITIS 2007, 46, 63. [Google Scholar] [CrossRef]
  33. PTCP Piano di Coordinamento della Provincia di Foggia. Analisi Fisica Integrata del Territorio Della Provincia di Foggia. Available online: http://territorio.provincia.foggia.it/sites/default/files/3%20Analisi%20fisica.pdf (accessed on 1 November 2021).
  34. Climate-Data. Org. Clima: Puglia. Available online: https://it.climate-data.org/europa/italia/puglia-454/ (accessed on 1 November 2021).
  35. Cataldo, E.; Fucile, M.; Mattii, G.B. Biostimulants in Viticulture: A Sustainable Approach against Biotic and Abiotic Stresses. Plants 2022, 11, 162. [Google Scholar] [CrossRef]
  36. Vox, G.; Schettini, E. Evaluation of the radiometric properties of starch-based biodegradable films for crop protection. Polym. Test. 2007, 26, 639–651. [Google Scholar] [CrossRef]
  37. Schettini, E.; Vox, G. Effects of Agrochemicals on the Radiometric Properties of Different ANTI-UV Stabilized eva plastic films. Acta Hortic. 2012, 956, 515–522. [Google Scholar] [CrossRef]
  38. De Palma, L.; Limosani, P.; Vox, G.; Schettini, E.; Antoniciello, D.; LaPorta, F.; Brossé, V.; Novello, V. Technical properties of new agrotextile fabrics improving vineyard microclimate, table grape yield and quality. Acta Hortic. 2020, 1276, 271–278. [Google Scholar] [CrossRef]
  39. Allen, R.G.; Walter, I.A.; Elliott, R.L.; Howell, T.A.; Itenfisu, D.; Jensen, M.E.; Snyder, R.L. (Eds.) The ASCE Standardized Ref-erence Evapotranspiration Equation; American Society of Civil Engineers: Reston, VA, USA, 2005. [Google Scholar] [CrossRef]
  40. Dennehy, K.F.; McMahon, P.B. Microclimate and actual evapotranspiration in a humid coastal-plain environment. J. Hydrol. 1987, 93, 295–312. [Google Scholar] [CrossRef]
  41. Williams, L.E. Grapevine water relations. In Raisin Production Manual; Christensen, L.P., Ed.; DANR Publications, University California: Oakland, CA, USA, 2000; pp. 121–126. [Google Scholar]
  42. Gao, Y.; Long, D.; Li, Z. Estimation of daily actual evapotranspiration from remotely sensed data under complex terrain over the upper Chao river basin in North China. Int. J. Remote Sens. 2008, 29, 3295–3315. [Google Scholar] [CrossRef]
  43. Wang, Q.; Wang, J.; Zhao, Y.; Li, H.; Zhai, J.; Yu, Z.; Zhang, S. Reference evapotranspiration trends from 1980 to 2012 and their attribution to meteorological drivers in the three-river source region, China: Reference Evapotranspiration Trends and its Attribution Analysis. Int. J. Clim. 2016, 36, 3759–3769. [Google Scholar] [CrossRef]
  44. Scarascia-Mugnozza, G.; Sica, C.; Russo, G. Plastic Materials in European Agriculture: Actual Use and perspectives. J. Agric. Eng. 2012, 42, 15–28. [Google Scholar] [CrossRef]
  45. Borgogno-Mondino, E.; De Palma, L.; Novello, V. Investigating Sentinel 2 Multispectral Imagery Efficiency in Describing Spectral Response of Vineyards Covered with Plastic Sheets. Agronomy 2020, 10, 1909. [Google Scholar] [CrossRef]
  46. Picuno, P.; Sica, C.; Laviano, R.; Dimitrijevic, A.; Scarascia-Mugnozza, G. Experimental tests and technical characteristics of regenerated films from agricultural plastics. Polym. Degrad. Stab. 2012, 97, 1654–1661. [Google Scholar] [CrossRef]
  47. Blanco, I.; Loisi, R.V.; Sica, C.; Schettini, E.; Vox, G. Agricultural plastic waste mapping using GIS. A case study in Italy. Resour. Conserv. Recycl. 2018, 137, 229–242. [Google Scholar] [CrossRef]
Figure 1. Adjacent vineyards protected with plastic sheets (left), uncovered vineyard (right) at the beginning of the second year of trial.
Agronomy 12 00600 g001
Figure 2. Polyethylene plastic sheets covering the top of vineyard C (Coverlys® agrotextile, (a)) and vineyard S (Serrosol film, (b)).
Agronomy 12 00600 g002
Figure 3. Vineyard after removing the side plastic sheets in order to improve air circulation and reduce overheating of air and vine organs.
Agronomy 12 00600 g003
Figure 4. Total and direct spectral transmissivity to solar radiation (in the wavelength range 200–2500 nm) and to long infrared radiation (in the wavelength range 2500–25,000 nm) of cover C (Coverlys® agrotextyle, (a,b)) and cover S (Serrosol film (c,d)).
Agronomy 12 00600 g004aAgronomy 12 00600 g004b
Figure 5. Course of average daily photosynthetic photon flux (PPF), air temperature, air relative humidity and wind speed recorded in June and July of the first year of trial, in open field and under plastic covers C (Coverlys® agrotextile) and S (Serrosol film).
Agronomy 12 00600 g005
Figure 6. Course of average daily photosynthetic photon flux (PPF), air temperature, air relative humidity and wind speed recorded in June and July of the second year of trial, in open field and under plastic covers C (Coverlys® agrotextile) and S (Serrosol film).
Agronomy 12 00600 g006
Figure 7. Course of average daily reference evapotranspiration (ET0) estimated in June and July of the first (a) and the second (b) year of trial, in open field and under plastic covers C (Coverlys® agrotextile) and S (Serrosol film).
Agronomy 12 00600 g007
Figure 8. Linear regressions between daily reference evapotranspiration (ET0) in open air and ET0 under cover C (Coverlys® agrotextile) or cover S (Serrosol film) in June and July of the second year of trial (**** indicates p < 0.0001).
Agronomy 12 00600 g008
Table 1. General climate features of the trial area (avg. 1999–2019, Climate-Data.Org) [34].
JanFebMarAprMayJunJulAugSepOctNovDec
Mean Temp. (°C)8.68.911.414.518.723.225.92621.917.913.89.9
Avg. Min. Temp. (°C)5.85.87.910.614.71921.621.818.414.710.97.1
Avg. Max. Temp. (°C)11.712.215.118.322.526.929.73025.421.41712.8
Rainfall (mm)585356523629222052606464
Avg. Air RH (%)757271706762586066737475
Rainy days (n)776754336668
Sunny hours (n)6.37.08.710.412.013.012.912.010.18.17.06.3
Table 2. Radiometric coefficients of cover C (Coverlys® agrotextile) and cover S (Serrosol film).
Wavelength RangeTransmissivity (%)
Cover CCover S
TotalDirectDiffuseTotalDirectDiffuse
Total Solar (200–2500 nm)754827826417
PAR (400–700 nm)734132835726
NIR (700–2500 nm)765423837310
UV (280–380 nm)682938301515
LWIR (7500–12,500 nm) 27 58
Table 3. Average data of daily and monthly ET0 estimated in open air and under plastic covers C (Coverlys® agrotextile) and S (Serrosol film) in the two years of trial.
MonthYearCoverET0 (mm d−1)ET0 (mm mo−1)
Open air4.59 ± 0.13137.64
June1stCover S3.37 ± 0.09100.96
Cover C3.23 ± 0.0997.01
Open air5.07 ± 0.06157.21
July1stCover S3.33 ± 0.06103.10
Cover C3.29 ± 0.05102.01
Open air4.05 ± 0.20121.56
June2ndCover S2.84 ± 0.1385.15
Cover C2.55 ± 0.1374.06
Open air4.73 ± 0.16146.79
July2ndCover S3.24 ± 0.10100.43
Cover C2.95 ± 0.0991.47
Publisher’s Note: MDPI stays neutral with regard to jurisdictional claims in published maps and institutional affiliations.