Article

Salinity Tolerance Characteristics of Marginally Located Rice Varieties in the Northernmost Rice-Growing Area in Europe

1
Research Centre for Irrigation and Water Management, Institute of Environmental Sciences, Hungarian University of Agriculture and Life Sciences, Anna-Liget u. 35, H-5540 Szarvas, Hungary
2
Cereal Research Non-Profit Company, H-6726 Szeged, Hungary
*
Author to whom correspondence should be addressed.
Agronomy 2022, 12(3), 652; https://doi.org/10.3390/agronomy12030652
Submission received: 8 December 2021 / Revised: 23 February 2022 / Accepted: 6 March 2022 / Published: 8 March 2022
(This article belongs to the Section Crop Breeding and Genetics)

Abstract

:
Detailed experiments were performed to investigate the effects of the marginal cultivation of temperate japonica rice on salinity tolerance in different developmental stages and to detect new genetic resources for further research and breeding projects. Eight rice varieties were screened for salinity tolerance in a greenhouse at two developmental stages. During seedling-stage screening, stress was induced with a 12 dS m−1 NaCl solution. For reproductive-stage analysis, we applied continuous salinity stress (8.39 dS m−1 of soil extract at 25 °C (EC25)). We compared the marginal rice genotypes (japonica_1) to widely grown controls (those being Mediterranean japonica genotypes, referred as the japonica_2 group, which also included one indica genotype). Without stress, marginally cultivated genotypes had significantly higher potassium storage capacity (406 µmol g−1) in flag leaves than did japonica_2 (347) or indica (267). Moreover, the seeds contained twice as much sodium (5.27) as did the others (2.19 and 2.00). Based on root-to-grain allocation, we identified two sodium excluders (‘Dular’ and ‘Dáma’) and six includers under constant salinity stress. Among the includers, we found that ‘M488’ had extremely high sodium concentration in both the flag leaves (250.54 µmol g−1) and the grains (13.57 µmol g−1). Rice varieties bred for the edge of their habitat show special physiological patterns. The differences are mainly manifested as lower levels of antioxidant pigments, higher amounts of potassium in flag leaves, and higher sodium levels in grains under normal conditions. With the onset of stress, higher tillering ability, enhanced antioxidant pigment synthesis, and rapid potassium translocation from the root are the key mechanisms which help the plants to avoid serious damage caused by salinity.

1. Introduction

Rice production in many countries similar to Hungary is threatened by several factors, including soil degradation by secondary salinisation. Since rice is more sensitive to salinity than the other cereal crops [1], it is necessary to screen available genetic backgrounds to find the best sources which are useable for breeding activities. Screening under field conditions is difficult due to environmental stress complexity [2]; however, greenhouse experiments may provide reliable estimations for the distribution of sodium and potassium content, except in the case of yield and yield-related parameters [3].
A number of traits have been identified which are important components of salt tolerance in rice and which can be used in screening programmes [4]. The most common traits are Na+ concentration and Na+ based values (Na/K ratio, K/Na, or K/Na selectivity) [5,6]. In most cases, these traits are only detected in shoot or leaf samples, especially in flag leaves, but it is also necessary to check the concentration of Na+ and K+ in the roots to determine the sodium transport and health of the plant [3,7].
Hungary is one of the northernmost European rice-growing countries; hence, the main limiting factors are the environmental extremes. In general, the most stressful conditions are found at the edge of the habitat [8], so good physiological tolerance under stressful conditions (cold, salinity, and drought) is necessary for successful production. Based on a genome-wide association mapping study [9], the salinity-tolerant varieties were found to be the indica checks (‘Pokkali’, ‘BRRI dhan 47’, and ‘Nona Bokra’), but the second-most tolerant variety was a Hungarian rice variety (‘Rotondus’). This result predicts the potential of the varieties, which are able to grow in marginal habitats. Our aim was to understand the stress-tolerance processes of varieties adapted to extreme climatic conditions. This may provide a promising background for the breeding of new stress-tolerant varieties and for further genetic studies.
We focused on a comparison of selected local, temperate, japonica varieties with some Mediterranean rice varieties and one indica rice variety because it is well known that the indica varieties are more tolerant to salinity than the japonicas [10]. Since rice plants respond differently to salinity depending on water regime, soil pH, humidity, solar radiation, and temperature [11], our hypothesis was that, if the marginal habitat had any influence on physiological tolerance, then we could detect it by morphological or physiological parameters.

2. Materials and Methods

The plant materials were selected from the Rice Variety Collection (Table S1) maintained by MATE ÖVKI Galambos Rice Research Station (46°52′17.5″ N 20°31′37.5″ E, Szarvas, Hungary). Five Hungarian japonica-type varieties (‘Dunghan Shali’ [12], ‘Risabell’, ‘M488’, ‘Janka’ [13], and ‘Dáma’(HSC-2) [14]) designated as the japonica_1 group, two Mediterranean japonicas (‘Nembo’ and ‘Sprint’) [9] designated as the japonica_2 group, and one indica (‘Dular’) [15,16] were chosen to test salt tolerance. Two Italian varieties were chosen on the basis of their salinity performance: ‘Sprint’ is a tolerant check variety, and ‘Nembo’ is a sensitive one [9].
In the present study, two experiments were carried out to determine the degree of salinity tolerance of the eight selected rice varieties.

2.1. Experiment 1: Screening the Salinity Stress Tolerance at the Seedling Stage

The seedling test was a greenhouse experiment based on the IRRI’s salinity screening manual [17]. Plants were grown in Yoshida nutrient solution, while the salinisation with 12 dS m1 NaCl solution took place at the four-leaf stage. According to the screening protocol, the test entries can be rated on the tenth day after salinisation. The measured parameters, their abbreviations, and the calculations can be seen in Table S2. To determine the membrane stability index (MSI), we followed the protocol of Mishra et al. [18]:
MSI = (1 − EC1/EC2) ∗ 100
where EC1 = Initial electrical conductivity of a fresh leaf sample; EC2 = Ion leakage of a fully injured leaf sample. The measurements were carried out with a WTW Inolab Cond Level 2p Conductivity Meter (Germany).
The determination of pigment content (chlorophyll/carotenoid and anthocyanins) was carried out according to Sims and Gamon [19]. For measurement, 25 mg leaf samples were taken, and we extracted the pigments via 8 mL cold 80% acetone. The absorbance of the extract solution was recorded at 537, 647, 663, and 470 nm. Sodium and potassium content was measured with a Thermo Scientific Solaar M6 atomic absorption spectrophotometer (Thermo Fisher, England; Acetylene–compressed air, with LiCl ionization buffer at 589 nm (Na+) and 766.5 nm (K+)). Based on the concentration of Na+ and K+, we calculated K/Na selectivity values [20] using the following equation:
SK+,Na+ = (K+ content/[K+] medium)/(Na+ content/[Na+] medium)
where SK+,Na+ represents K-Na selectivity; K+ content and Na+ content represent the concentrations (mmol kg−1 dry wt.) of K+ and Na+ in shoot.
Root viability index was calculated by the root’s dehydrogenase activity, based on the reaction of triphenyl tetrazolium chloride (TTC). The calibration curve was developed to determine the concentration of triphenyl formazan (TF) corresponding to an absorbance measurement at 484 nm (DR 4000 Spectrophotometer, Hach, Loveland, CO, USA).

2.2. Experiment 2: Screening the Constant Salinity Stress at the Reproductive Stage

The soil culture conditions were based on Gregorio et al. [17]. The pot experiment was conducted under greenhouse conditions. The study focused on varietal responses under constant stress. The salt tolerance during the whole life of rice is closer to production practice and has more practical significance than the results of individual differential developmental stages [21]. The large plastic pots were filled with 50 kg of paddy field soil (Vertisol, NPK content: 21,114 and 293 mg kg−1). The soil represented the salt-affected paddy fields in Hungary. We used this type of soil in the control treatment to simulate the performance of varieties in the field condition. The salinisation was carried out with twenty litres of saline water (NaCl) with 12 dS m1 electrical conductivity. Water level was maintained throughout the growing season at 1 cm above the soil surface. The soil and water characteristics are summarised in Table 1.
The electrical conductivity was measured every week from flooding water and in 1:5 soil/water samples. The calculation of conductivities of the samples to 25 °C were carried out using the following formula to reflect the soil salt content [22]:
EC25 = ECt × ft
where EC25 is the electrical conductivity of the sample at 25 °C, ECt is the measured electrical conductivity of the sample at t °C, and ft is the corrected value of electrical conductivity at t.
During the experiment, we measured vegetative- and yield-related parameters with five replications across both stages of salt treatment (Table S2). To evaluate some physiological changes, we determined the MSI and pigment content of the penultimate leaves, especially anthocyanins and carotenoids that may contribute to antioxidant capacity under salinity stress. At the ripening phase, we determined panicle length (PL), number of panicles per plant (NP), number of filled grains (NofF), number of unfilled grains (NoUF), fertility (F%), yield, yield-based stress tolerance index (YSTI), and kernel weight (KW). To indicate the salinity tolerance, we determined the Na+ and K+ content of root and flag leaves and the sodium content of grains, respectively.
Basic mathematical analyses were performed using Microsoft Excel 2016. Data were statistically analysed using “IBM SPSS 22” software. One-way ANOVA with Tukey and Games–Howell methods were used to test differences among treatments at a 5% level of probability. The significance of genotype, treatment and genotype × treatment interaction effects were tested by two-way ANOVA. Pearson’s correlation was calculated among parameters to estimate the relation among different traits and parameters. We used the DisplayR online source to visualise the correlation matrix.

3. Results

We analysed rice plants grown under high levels of NaCl (12 dS m1) applied in the seedling stage and the reproductive stage (from germination until maturity). The analysis of these two developmental stages showed a significantly different response among the varieties. The results of the combined analysis for all studied traits are shown in supplemented data.

3.1. Seedling Stage

The reaction of rice varieties to salinised nutrient solution showed extreme variability at the seedling stage (Table S3). Indica-type rice had a higher total biomass production (4.61 g) than japonica varieties (2.64 g). Furthermore, there were statistically significant differences between the two japonica groups (3.09 g—japonica_1 and 1.83 g—japonica_2). The MSI, which indicates ion leakage under salinity stress, was not significant among groups; however, we detected varietal differences. ‘Risabell’ had the lowest value (70.5), and ‘Dáma’ had the highest one (90.94). The root’s dehydrogenase activity was significantly higher in japonica_1 than in the others. We found the highest root viability in ‘Dunghan Shali’ (83.19). The total chlorophyll and carotenoid content was not significant between japonica_1 and indica, but japonica_2 had the lowest value. In contrast, the anthocyanin content was significantly lower in the japonica_1 group than in the other two groups.
The maximum accumulation of sodium was observed in the leaves of ‘Nembo’ (2.77 mmol g1). Besides high Na+ uptake, we also found low K+ concentration, and this led to the highest Na/K ratio (3.68). The most favourable Na/K ratio was found in ‘Dunghan Shali’ (1.17 mmol g1). Comparison among the groups showed that the japonica_2 had significantly higher Na+ and lower K+ concentrations than the japonica_1 and the indica. However, there was a different phenomenon in the root system. The highest Na/K ratio was found in case of ‘Dular’ (3.60), and the lowest in ‘Risabell’. ‘Dular’ could avoid the sodium transportation to leaves. ‘Risabell’, on the other hand, absorbed the least amount of sodium. This result was confirmed by root viability index, which registered at the second-highest level in the case of ‘Risabell’ (81.02).
According to the Pearson correlation matrix (Table S4), the biomass production of the varieties, especially the shoot biomass, was highly correlated with the potassium content of the shoot (0.864**), the chlorophyll content (0.794*), and the Na/K ratio (−0.718*). Root biomass also influenced the Na/K ratio of the root (0.772*), but it was not correlated with dehydrogenase activity (−0.093). We detected a medium, but not significant, correlation between root viability and Na+ (−0.532) and K+ (0.618) concentrations in the root. Figure 1 shows the relationship between root viability and Na+ and K+ concentrations in the leaves. Increasing root viability significantly correlated with sodium concentration in the leaves (−0.805*, R2 = 0.6645), but it did not affect the K+ concentration in the leaves.

3.2. Reproductive Stage

The detailed results of our analysis of variance for the studied traits are shown in Table S5. Our results showed that salinity has a significant effect on the examined parameters, except in regard to the number of panicles per plant. The influences of genotype and salinity × genotype interaction were also significant on all the studied traits.

3.2.1. Morphophysiological Parameters

Rice varieties under control conditions demonstrated normal growth with no symptoms of salt injury. Under these stressful conditions, plants tended to evidence decreased plant height and total biomass, and the greenness of the leaves was darker than in controls. The total biomass production under both treatments (control and saline) was the highest in the case of indica (Figure 2). However, differences in biomass between the treatment and control groups were the lowest in the japonica_1 group (Figure 2), especially in the case of ‘Dáma’ (31.60%).
The greatest shoot and root decrease was observed in japonica_2 (73.51% and 65.51%, respectively). The biomass-based stress tolerance index (BSTI) resulted in a similar outcome to the results of the biomass values. The plant height significantly (p < 0.001) decreased in the saline conditions. The varietal differences showed that the least reduction (2.62%) was in ‘Dáma’, and the highest was in ‘Janka’ (14.07%). However, there were no remarkable differences among the variety groups. Although there were significant differences between treatments (p < 0.05), the tillering ability under stress condition showed a wide range among the varieties. The japonica_1 group was able to maintain tillering ability under saline conditions; the values of indica and japonica_2 groups were 15% and 35% lower than the control, respectively. ‘M488’ produced more tiller (26.89%) under salinity stress than in the control condition. The days to flowering were also significantly delayed in all genotypes (p < 0.001). The shortest delay was observed in indica (3.45%), then japonica_2 (6.43%), and japonica_1 suffered the most noticeable delay (8.60%). The pigment content was consistent with visual observation. Anthocyanins, chlorophyll, and carotenoids all increased under salinity stress (p < 0.001). Most varietal differences were observed in the control treatment. Japonica_1 had significantly lower anthocyanins, chlorophyll, and carotenoid content, and these increased with treatment until reaching the levels of the other groups.

3.2.2. Yield Related Parameters

Salinity had a significant varietal and group effect on the number of panicles (Table S6). The indica (‘Dular’) was able to maintain the panicle number; the japonica_2 group produced 26.89% fewer panicles, but the japonica_1 produced 11.87% more panicles than the control. Moreover, the panicle number of ‘Dunghan Shali’ was 39.66% higher than in the control condition. The grain yield was statistically lower (p < 0.001) under salinity due to the decrease in fertility. Three varieties of japonica_1 group (‘M488’, ‘Janka’, and ‘Dáma’) did not show significant change in the number of unfilled grains. The highest change was detected in ‘Nembo’. However, its number of filled grains was not affected by salinity. According to the yield-based stress tolerance index, the tolerant variety was ‘Dular’ (1.61), and the sensitive ones were ‘Janka’ (0.57) and ‘Sprint’ (0.51). The kernel weight also significantly decreased (p < 0.001) under salinity. The indica lost the least weight (4.02%); however, the japonica_2 lost the most (26.09%).

3.2.3. Sodium and Potassium Concentration

The sodium content of the flag leaves was significantly increased by salinity (p < 0.001), except in three varieties (‘M488’, ‘Dáma’, and ‘Dular’). We detected extremely high sodium concentrations in the case of ‘M488’, both in the control (271.86 µmol g−1 DW) and saline conditions (250.54 µmol g−1 DW). (See Figure 3).
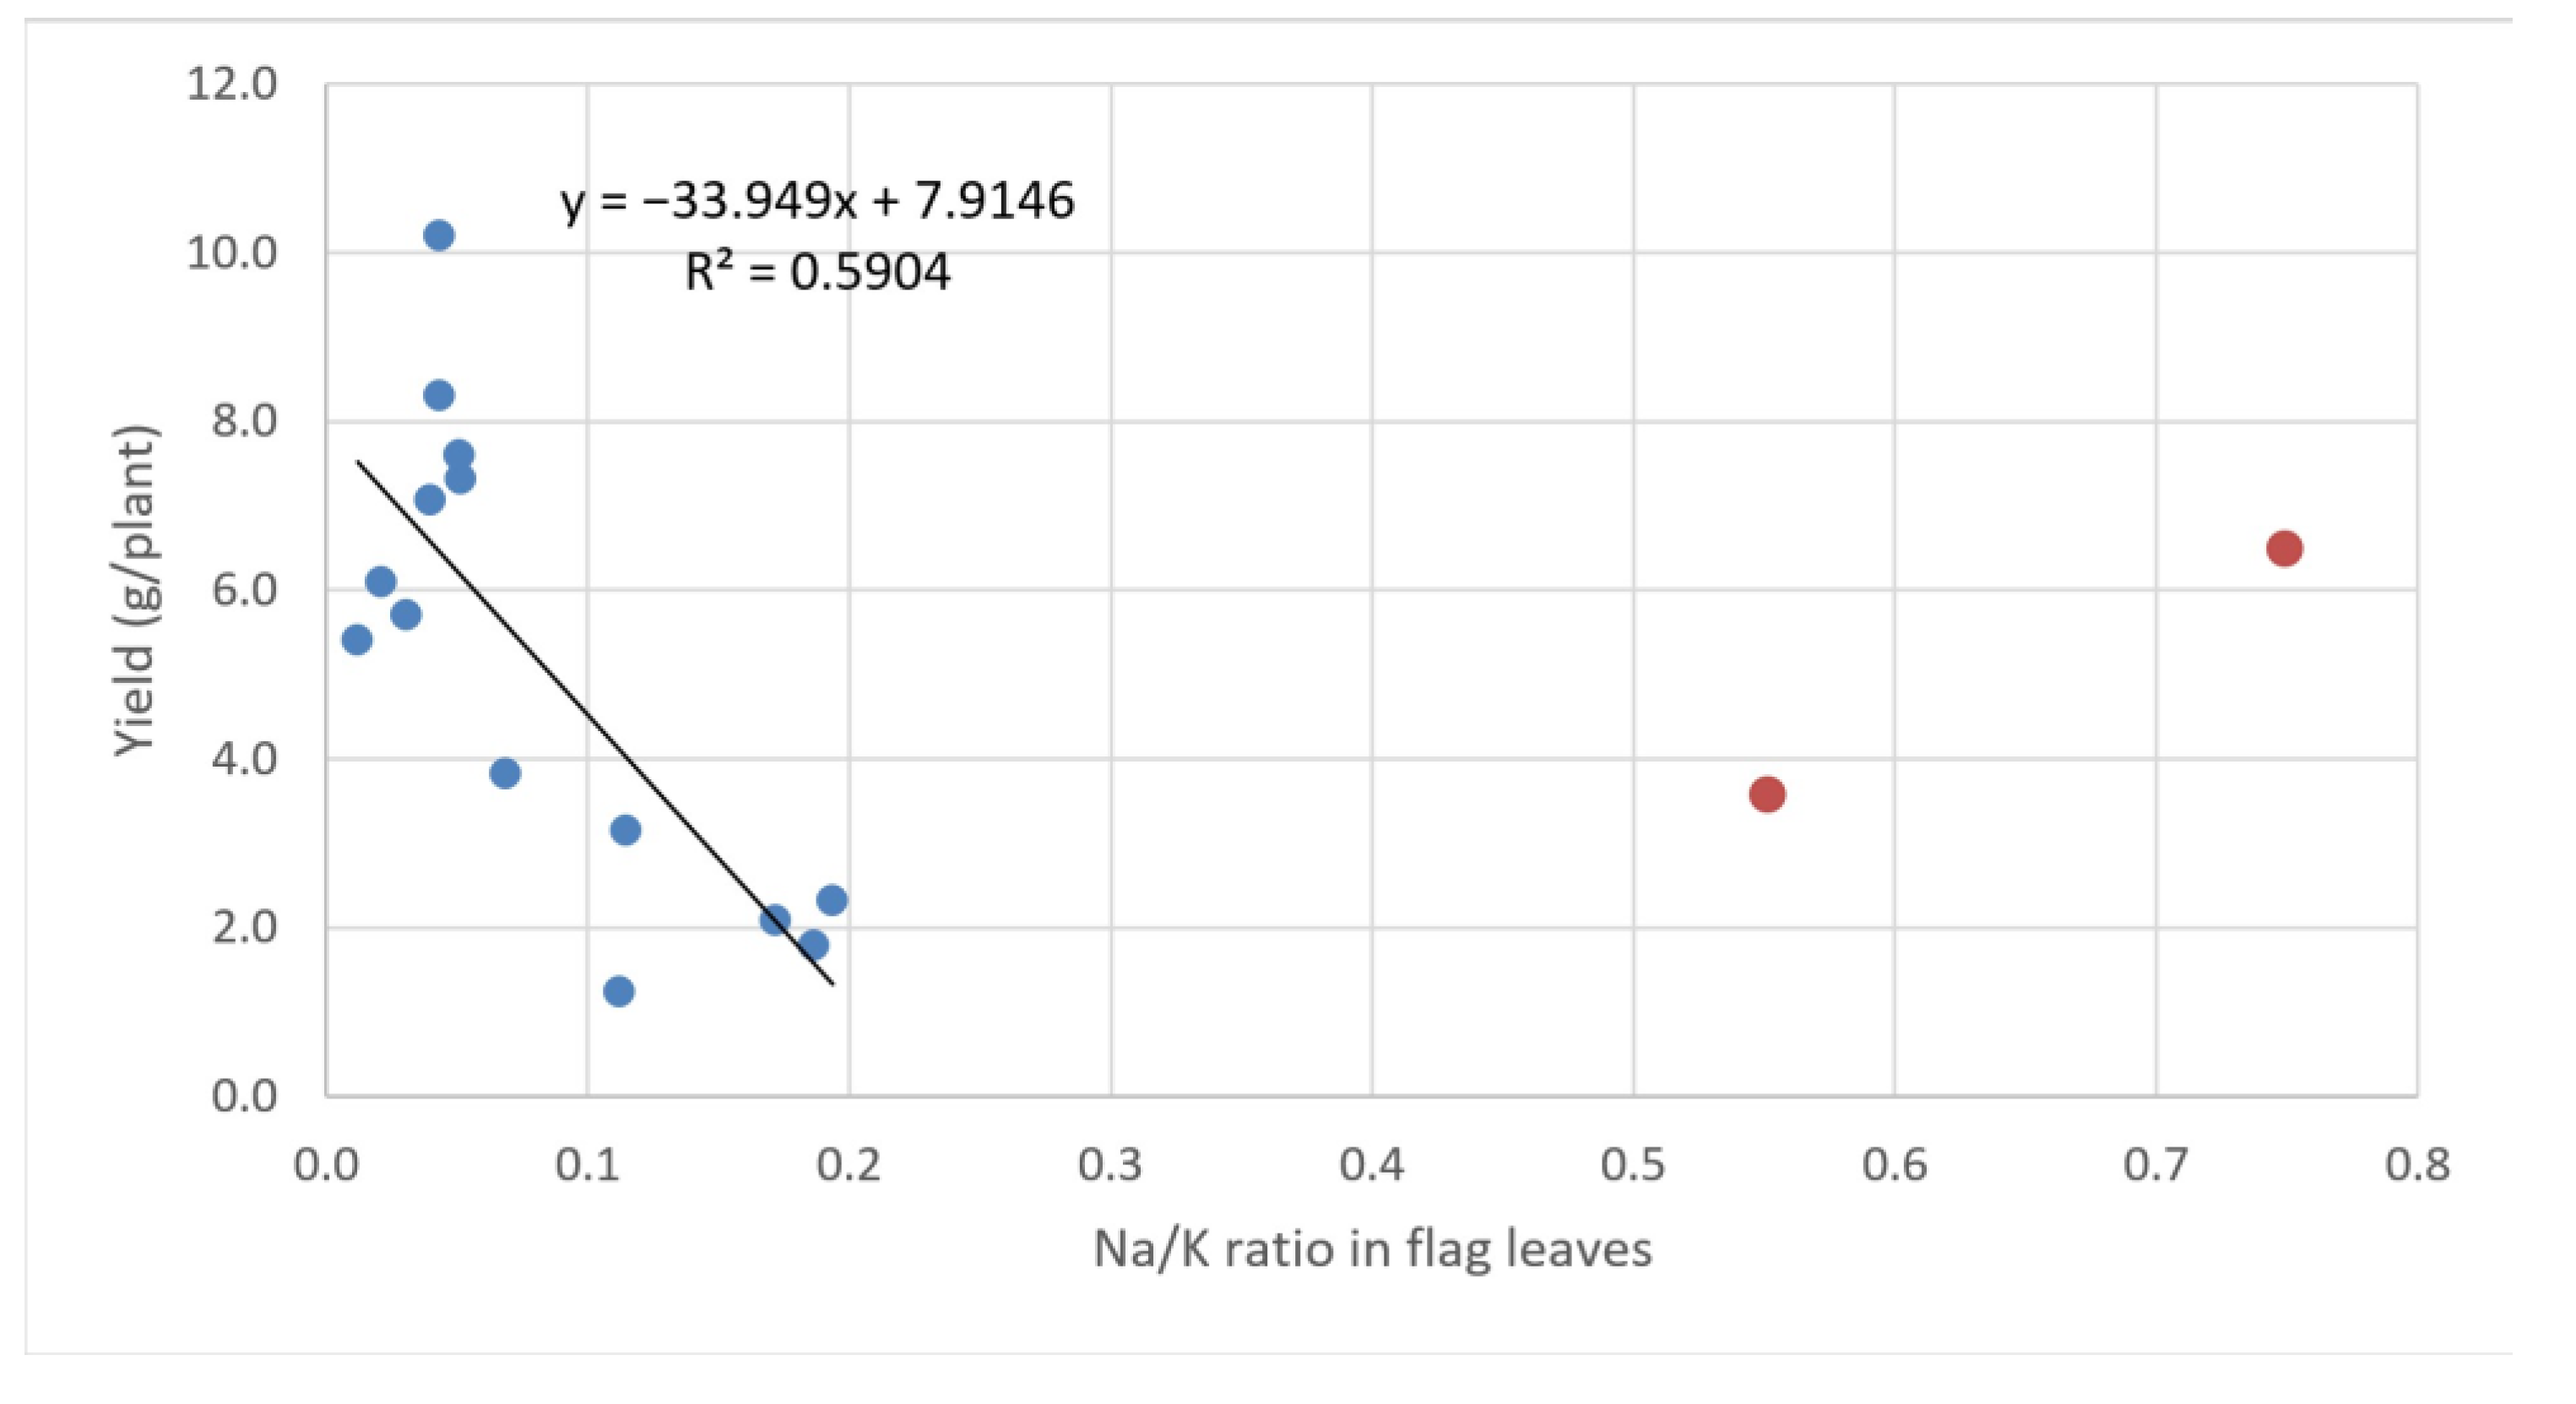
The largest amount of sodium accumulated in the japonica_2 group (8–9 times higher than the control). The potassium concentration was also significantly higher (p < 0.001) in the saline treatment than in the control. However, we also detected a wide range of values among the varieties. The potassium concentration was stable in the cases of ‘Dular’, ‘Sprint’, and ‘Dáma’, decreased in the cases of ‘Nembo’ and ‘Dunghan Shali’, and increased in ‘M488’, ‘Janka’, and ‘Risabell’. Therefore, the potassium concentration also had a remarkable influence on the molar-based Na/K ratio. ‘Dular’ and ‘Dáma’ had stable Na/K ratios, despite the high salinity. The other varieties had increased values of the ratio, while we observed a decreasing Na/K ratio in case of ‘M488’. The connection between sodium concentration and yield is shown in Figure 4. We found a negative correlation between the two parameters; higher sodium resulted in lower yield, except for in the ‘M488’ variety, which is highlighted by the red dots.
In the roots, the sodium concentration significantly decreased (p < 0.001) under salinity in all examined varieties, except for ‘Dáma’. This variety had a stable sodium and potassium concentration despite salinity stress. We also detected a decreasing trend in potassium content in the roots of the other varieties although there were no statistically significant differences among the varietal groups.
The sodium content of ripened grains was significantly higher under salinity stress (p < 0.001) than in the control condition. The lowest value was observed in indica (2.41 µmol g−1), the second-lowest was observed in the japonica_2 (3.39 µmol g−1), and the highest was observed in the japonica_1 group (7.17 µmol g−1) (See Figure 3). The varietal differences show that ‘Dunghan Shali’ had a stable sodium concentration, while the value of the others increased. The highest sodium content was detected in the case of ‘M488’ (13.57 µmol g−1).
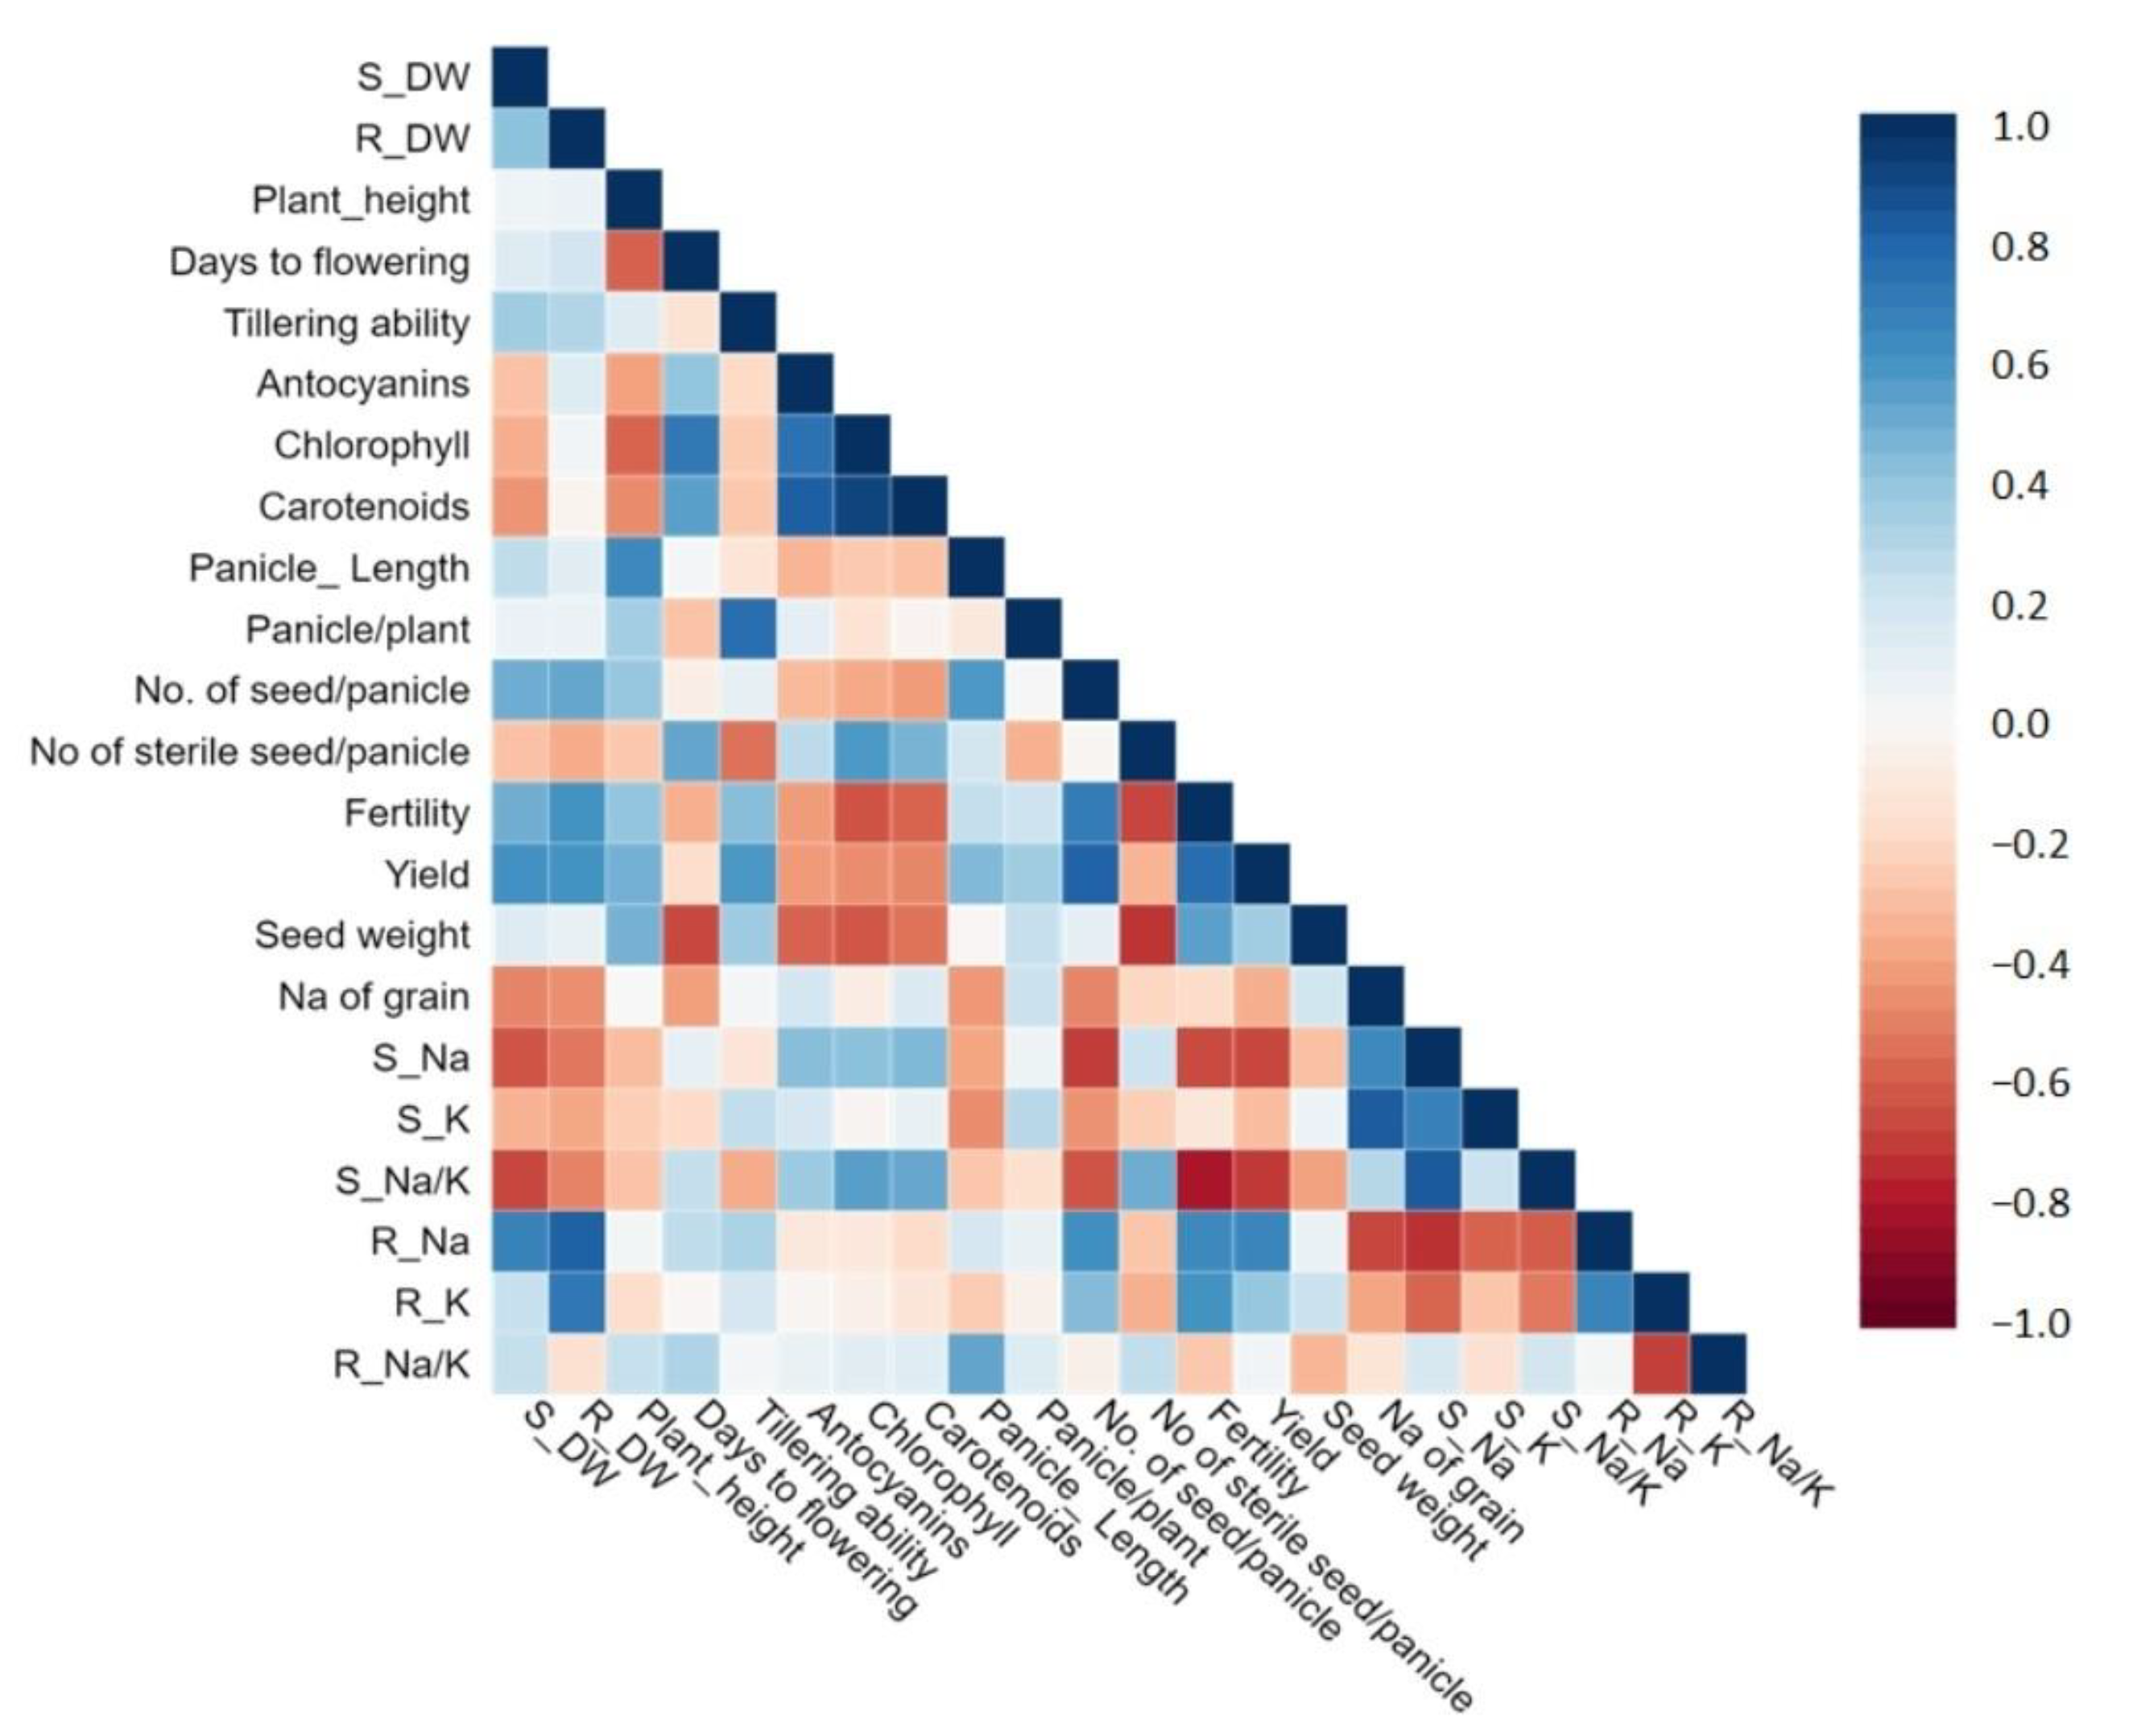
Pearson’s coefficients of correlation among studied parameters were calculated (Figure 5), and we determined their statistical significance at two significance levels (p < 0.05 and p < 0.001) (Table S7). Shoot dry weight correlates significantly negatively with the sodium content of flag leaves (−0.640) as well as with that of grains (−0.498). A similar relationship was detected in case of the roots. Between the biomass production and the yield, a positive trend exists (0.610 and 0.604, respectively). High sodium concentration in the flag leaves had a significant negative effect on the number of seeds (−0.714), fertility (−0.674), and yield (−0.683). A positive correlation was detected on the sodium content of grains (0.643).

4. Discussion

Soil salinity is an important environmental factor that is limits rice production worldwide. Therefore, the detection and development of new genetic resources are crucial for the sustainable utilization of marginal habitats. Significant salinity treatments were used in our experiments because mild salinity stress was reported to give no remarkable differences in indicas [9,23,24].
During the seedling stage, we found significant group differences in total biomass production, especially in the case of root dry weight. The RDW of the japonica_1 group was significantly higher than that of the japonica_2 group, and lower than that of the indica. This higher biomass value was associated with higher root viability, too. Generally, a higher RDW results in a higher salinity tolerance [25]. The highest SDW was measured in ‘Dunghan Shali’, and the highest RDW was detected in ‘Dular’ under the stress condition. Several authors have reported that high biomass production causes a dilution effect on Na+ concentration [26,27], and indeed we detected the lowest Na+ concentration in the case of ‘Dunghan Shali’. Since shoots are more sensitive to salinity stress than roots [28], and tolerant rice varieties sequester more sodium in the roots [29], the shoot/root ratio of sodium content (SNa+/RNa+) might be a good salinity tolerance indicator. Our seedling experimental results show that the SNa+/RNa+ is always higher than 1, even in the case of ‘Dular’. Only ‘Dunghan Shali’ had equal sodium concentrations in the root and shoot. Pires et al. [26] examined 56 varieties and reported a maximum of 1.8 mmol g1 leaf sodium content in the case of sensitive varieties under 12 dS m1. Surprisingly, in our experiment, the japonica_2 group (‘Sprint’ and ‘Nembo’) reached higher sodium concentrations (1.96 and 2.77 mmol g1, respectively) although ‘Sprint’ was tolerant under mild stress conditions (6 dS m1) [9]. The salinity injury score (SES score) is an indicator which is correlated significantly positively with leaf Na+ concentration [25]. Highly tolerant varieties (below four SES score) have 1.1–1.5 mmol g1 Na+ concentration in the leaf. According to our results, four varieties of the japonica_1 group (‘Dunghan Shali’, ‘Janka’, ‘Risabell’, and ‘Dáma’) belong to that interval. Based on Lee et al. [30], the K+ concentration of the shoot is not correlated with any biomass traits in japonica; however, our experiment revealed a strong, statistically significant, positive relationship between K+ concentration and root (0.743*) and shoot (0.864**) biomass production. This result confirms the result of Reddy et al. [31] In the case of the root, De Leon et al. [32] detected significant genotypic differences in neither Na+ nor K+ concentration under 12 dS m1. Our results do not confirm those results. We found genotypic differences inside and among the groups as well. Moreover, the average of K+ concentration of the roots was 0.6 ± 0.06 mmol g1 in our experiment, which is two times greater than that which Pires et al. [26] predicted (0.3 ± 0.1). Genotypes could be classified by K/Na selectivity and Na+ concentration into three groups [20]. Based on this system we could classify our data into tolerant (‘Dunghan Shali’ and Janka’); intermediate (‘M488’, ‘Dáma’, ‘Risabell’, and “Dular’); and sensitive varieties (‘Sprint’ and ‘Nembo’). However, the japonica_1 group does not significantly differ from indica in the case of the average of Na/K and K/Na selectivity of the shoot (Table S3).
Under constant stress until the reproductive stage, we also found a significant biomass decrease (both shoot and root). The highest biomass production was observed in indica, then the japonica_1 group, and finally the japonica_2 group. The plant height also decreased in all varieties, except ‘Dunghan Shali’. In case of tillering ability, we found an interesting response to salinity. The japonica_1 group’s value did not differ from the control; however, in the other groups, it decreased by 15.28–34.91%. This is the opposite of the results which several authors reported [33,34]. The pigment distribution was also unexpected. The chlorophyll, carotenoids, and anthocyanin contents increased under salinity, especially in the japonica_1 group. The japonica_1 group differed considerably from the other groups in the control conditions, but this difference was not significant under salinity. Kranto et al. [33] reported a similar observation under a similar experimental design. Moreover, Kanawapee et al. (2012) also found the same tendency in the case of 60 genotypes. As explained, the reason was the increasing chlorophyll-a content.
Salinity reduces yield and yield-related parameters [34,35], especially the percentage of filled grain [36]. According to Ali et al. [2], the panicle length decreased under 12 dS m1 by 2.87–14.6%. In our results, the japonica_1 group suffered the most remarkable decrease (16.64%), ‘Nembo’ did not change, and ‘Dular’ increased significantly. Tran Thi Huong Sen et al. [37] observed an 11.88–68.88% decrease in the number of filled grains, and the increase in unfilled grains was 12.95–57.95% under 8 dS m1. We detected the lowest decrease in filled grains in ‘Nembo’ (7.83%), and this was not different from the control condition. In case of the three varieties of japonica_1 group (‘M488’, ‘Janka’, and ‘Dáma’), the number of unfilled grains did not increase under the salinity stress. The panicle number was not affected by salinity on average in the examined varieties. While japonica_2 decreased, indica was stable, and the japonica_1 group increased by 11.87%, especially in the case of ‘Janka’ (26.43%) and ‘Dunghan Shali’ (39.46%). The cause might be the higher tillering ability under salinity. Yield and 100-kernel weight also significantly decreased under salinity (p < 0.001). The range was 28.23–74.81% and 4.02–31.32%, respectively. The most tolerant was the indica in both parameters, followed by the japonica_1 and the japonica_2. Under 8 dS m1, the yield decrease was 31% in a tolerant variety (‘Pokkali’) and 83% in the sensitive check (IR29) [37].
Under the stress condition, sodium and potassium concentration showed a wide range. Some authors have reported that increasing salinity enhanced Na+ concentration of the root [26,38] and decreased the concentration of potassium [38,39], or the potassium concentration remained stable [26]. Our data confirm the potassium decrease, but sodium also decreased despite the prediction. This phenomenon may be related to a long-term salinity response. One variety (‘Dáma’) was able to maintain optimal Na+ and K+ concentrations in the root, despite the high salinity level. None of the varieties was able to avoid potassium loss in the root, even though indica was also affected. In flag leaves, due to the transportation system, the Na+ concentration increased under salinity, with the exception of ‘Dáma’ and ‘Dular’. Their K+ concentrations were stable; there was no statistical difference compared to the control. According to Lee et al. [30], japonica does not have a high K-uptake mechanism. We also observed this phenomenon in japonica_2. The K concentration of the flag leaves was stable (‘Sprint’) or decreased (‘Nembo’). In contrast, we found an elevated K concentration in three japonica varieties (‘M488’, ‘Janka’, and ‘Risabell’) when compared to the control. This excess amount of potassium might be the result of the remobilisation of the roots’ potassium store. In fact, the K concentration of the roots were the lowest in these varieties. The highest Na+ concentration was observed in ‘M488’ under control and saline conditions as well (250–270 µmol g1). This interval seems to equal the sodium concentration of the third or fourth leaves [40]. Despite the high level of sodium, the flag leaves were intact; there were no symptoms of salt injury. It is possible that higher capacity of vacuolar compartmentalisation or further transportation distance to the grains is the reason for this phenomenon. Indeed, the sodium concentration of the seeds was higher in japonica_1. This group had double the sodium concentration in both the control and the saline conditions (5.27 µmol g1 and 7.17 µmol g1, respectively) than did the others (2.00–2.19 µmol g1 and 2.41–3.39 µmol g1, respectively). Moreover ’M488’ reached a sodium content level of 13.57 µmol g1.
When we compare the two developmental stages, the highest total biomass was detected in indica under salinity stress at the seedling and reproductive stages, which confirms the results of Lee et al. [30]. However, japonica_1’s value was closer to that of indica than to that of japonica_2 in every developmental stage. We also confirm the dilution effect of the biomass [31] on the sodium concentration in every stage (see Pearson coefficient of Tables S4 and S7). Varieties which had high biomass production—‘Dunghan Shali’ and ‘Dular’—had lower sodium concentrations. Although Aslam et al. [41] found a strong correlation between a seedling’s fresh weight and yield, both in a pot experiment (0.77) and in field conditions (0.78), Singh and Flowers [42] reported a non-significant correlation between the two developmental stages. However, based on the correlation of data of the two stages, we detected a significant correlation between seedling root dry weight and yield. Moreover, the seedling root viability also showed a positive trend with the potassium content of the flag leaves (Table S8). These results indicate that the root characteristics at the seedling stage could be more important than previous reports have suggested. For instance, salinity reduces tillering ability [34,43]; hence, even though there is a poor relationship between the vegetative and generative phases under salinity, the vegetative phase has an impact on yield in indirect way. Our results also suggested this because japonica_1 had a stable or increased tillering ability and less of a decrease in root dry weight under salinity (Table S6). Therefore, these two phenomena might be attributed to the strong correlation between the seedling and reproductive stages. Moreover, we detected a correlation between the sodium content of the root and the potassium content of the leaves at the seedling (0.527) and the reproductive stages (−0.593**). This result is also confirmed by the seedling stage results of De Leon et al. [32]

5. Conclusions

Soil salinity is an important environmental factor that limits rice production worldwide. Therefore, detecting and developing new genetic resources are crucial for the sustainable utilization of marginal habitats. In our study, we focused on the responses of marginal rice varieties to salinity stress. Based on short and long stress responses, we found different reactions to salinity, especially in the case of marginally located genotypes. The advantage of indica is considerable under constant stress, but there are some varieties in the japonica_1 group which are able to approach or surpass indica’s performance. We found an indica-equivalent genotype (‘Dáma’) which had a similar Na+ concentration in the flag leaves. However, its K concentration was significantly higher than that of the indica. We also found the same phenomenon in the case of roots. The elevated K content was generally observed in the japonica_1 group. The source of excess K may be the reserves of the root cells. That is probably the reason why we detected a lower level of K in the roots. The high K-uptake mechanism functions in japonica_1 under salinity stress.
The results highlighted that genotypes from marginal locations may be an important source of breeding activities. Beside the enhanced K content, we also observed an extremely high sodium-includer variety named ‘M488’, which accumulates more sodium, and its high concentration of sodium appears in seeds without any visible damage. These results from local varieties can offer ways to better understand the effect of the edge of the habitat on salinity tolerance and help us to select genotypes that can maintain salinity tolerance in both developmental stages.

Supplementary Materials

The following supporting information can be downloaded at: https://www.mdpi.com/article/10.3390/agronomy12030652/s1, Table S1: Varieties, Table S2: Indices and Parameters, Table S3: Seedling data, Table S4: Seedling Pearson correlation, Table S5: Reproductive_Anova, Table S6: Reproductive dataset, Table S7: Reproductive_Pearson, Table S8: Seedling-Reproductive.

Author Contributions

Á.S.: data analysis, statistical analysis, and writing—draft manuscript preparation; T.S.: data acquisition; J.P.: writing—revision for intellectual content; C.L.: writing— revision for intellectual content; M.I.: data acquisition and writing—language editing; M.J.: conception and design. All authors have read and agreed to the published version of the manuscript.

Funding

This research was financially supported by the Hungarian Ministry of Agriculture (OD002 project) and by the National Research, Development and Innovation Office (GINOP-2.3.3-15-2016-00042). The authors also appreciate the support of scientific projects (project numbers: TKP2020-NKA-21 and OTKA-FK_21-FK138042).

Institutional Review Board Statement

Not applicable.

Informed Consent Statement

Not applicable.

Data Availability Statement

All data generated or analysed during this study are included in this published article (and its supplementary information files).

Acknowledgments

The authors also thank Kornél Simon for language editing on this article.

Conflicts of Interest

The authors have no relevant financial or non-financial interests to disclose. The authors have no conflict of interest to declare that are relevant to the content of this article. All authors certify that they have no affiliations with, or involvement in, any organization or entity with any financial interest or non-financial interest in the subject matter or materials discussed in this manuscript. The authors have no financial or proprietary interests in any material discussed in this article.

References

  1. Maas, E.V.; Hoffman, G.J. Crop Salt Tolerance—Current Assessment. J. Irrig. Drain. Div. 1977, 103, 115–134. [Google Scholar] [CrossRef]
  2. Ali, Y.; Aslam, Z.; Awan, A.R.; Hussain, F.; Cheema, A.A. Screening Rice (Oryza sativa L.) Lines/Cultivars Against Salinity in Relation to Morphological and Physiological Traits and Yield Components. Int. J. Agric. Biol. 2004, 6, 572–575. [Google Scholar]
  3. Negrão, S.; Schmöckel, S.M.; Tester, M. Evaluating Physiological Responses of Plants to Salinity Stress. Ann. Bot. 2017, 119, 1–11. [Google Scholar] [CrossRef] [PubMed] [Green Version]
  4. Haque, M.A.; Rafii, M.Y.; Yusoff, M.M.; Ali, N.S.; Yusuff, O.; Datta, D.R.; Anisuzzaman, M.; Ikbal, M.F. Advanced Breeding Strategies and Future Perspectives of Salinity Tolerance in Rice. Agronomy 2021, 11, 1631. [Google Scholar] [CrossRef]
  5. Asch, F.; Dingkuhn, M.; Dörffling, K.; Miezan, K. Leaf K/Na Ratio Predicts Salinity Induced Yield Loss in Irrigated Rice. Euphytica 2000, 113, 109. [Google Scholar] [CrossRef]
  6. Mohammadi, R.; Mendioro, M.; Diaz, G.; Gregorio, G.; Singh, R. Genetic Analysis of Salt Tolerance at Seedling and Reproductive Stages in Rice (Oryza sativa). Plant Breed. 2014, 133, 548–559. [Google Scholar] [CrossRef]
  7. Chakraborty, K.; Chattaopadhyay, K.; Nayak, L.; Ray, S.; Yeasmin, L.; Jena, P.; Gupta, S.; Mohanty, S.K.; Swain, P.; Sarkar, R.K. Ionic Selectivity and Coordinated Transport of Na+ and K+ in Flag Leaves Render Differential Salt Tolerance in Rice at the Reproductive Stage. Planta 2019, 250, 1637–1653. [Google Scholar] [CrossRef]
  8. Normand, S.; Treier, U.A.; Randin, C.; Vittoz, P.; Guisan, A.; Svenning, J.-C. Importance of Abiotic Stress as a Range-Limit Determinant for European Plants: Insights from Species Responses to Climatic Gradients. Glob. Ecol. Biogeogr. 2009, 18, 437–449. [Google Scholar] [CrossRef]
  9. Frouin, J.; Languillaume, A.; Mas, J.; Mieulet, D.; Boisnard, A.; Labeyrie, A.; Bettembourg, M.; Bureau, C.; Lorenzini, E.; Portefaix, M.; et al. Tolerance to Mild Salinity Stress in Japonica Rice: A Genome-Wide Association Mapping Study Highlights Calcium Signaling and Metabolism Genes. PLoS ONE 2018, 13, e0190964. [Google Scholar] [CrossRef] [Green Version]
  10. Wankhade, S.; Bahaji, A.; Mateu-Andrés, I.; Cornejo, M.-J. Phenotypic Indicators of NaCl Tolerance Levels in Rice Seedlings: Variations in Development and Leaf Anatomy. Acta Physiol. Plant. 2010, 32, 1161–1169. [Google Scholar] [CrossRef] [Green Version]
  11. Hoang, T.M.L.; Tran, T.N.; Nguyen, T.K.T.; Williams, B.; Wurm, P.; Bellairs, S.; Mundree, S. Improvement of Salinity Stress Tolerance in Rice: Challenges and Opportunities. Agronomy 2016, 6, 54. [Google Scholar] [CrossRef]
  12. Abe, A.; Takagi, H.; Fujibe, T.; Aya, K.; Kojima, M.; Sakakibara, H.; Uemura, A.; Matsuoka, M.; Terauchi, R. OsGA20ox1, a Candidate Gene for a Major QTL Controlling Seedling Vigor in Rice. Theor. Appl. Genet. 2012, 125, 647–657. [Google Scholar] [CrossRef] [PubMed]
  13. Pauk, J.; Jancsó, M.; Simon-Kiss, I. Rice Doubled Haploids and Breeding. In Advances in Haploid Production in Higher Plants; Touraev, A., Forster, B.P., Jain, S.M., Eds.; Springer: Dordrecht, The Netherlands, 2009; pp. 189–197. ISBN 978-1-4020-8854-4. [Google Scholar]
  14. Heszky, L.E.; Simon-Kiss, I.; Binh, D.Q. Release of the Rice Variety Dama Developed by Haploid Somaclone Breeding. In Somaclonal Variation in Crop Improvement II; Bajaj, Y.P.S., Ed.; Biotechnology in Agriculture and Forestry; Springer: Berlin/Heidelberg, Germany, 1996; pp. 46–54. ISBN 978-3-642-61081-3. [Google Scholar]
  15. Székely, Á.; Szaloki, T.; Ibadzade, M.; Pauk, J.; Lantos, C.; Jancsó, M. Germination Dynamics of European Rice Varieties under Salinity Stress. Pak. J. Agric. Sci. 2021, 58, 1–5. [Google Scholar] [CrossRef]
  16. Narale, R.P.; Subramanyam, T.K.; Mukherjee, R.K. Influence of Salinity on Germination, Vegetative Growth, and Grain Yield of Rice (Oryza sativa Var. Dular)1. Agron. J. 1969, 61, 341–344. [Google Scholar] [CrossRef]
  17. Gregorio, G.; Senadhira, D.; Mendoza, R. Screening Rice for Salinity Tolerance. In IRRI Discussion Paper Series; International Rice Research Institute: Los Baños, Philippine, 1997. [Google Scholar]
  18. Mishra, S.S.; Behera, P.K.; Kumar, V.; Lenka, S.K.; Panda, D. Physiological Characterization and Allelic Diversity of Selected Drought Tolerant Traditional Rice (Oryza sativa L.) Landraces of Koraput, India. Physiol. Mol. Biol. Plants 2018, 24, 1035–1046. [Google Scholar] [CrossRef]
  19. Sims, D.A.; Gamon, J.A. Relationships between Leaf Pigment Content and Spectral Reflectance across a Wide Range of Species, Leaf Structures and Developmental Stages. Remote Sens. Environ. 2002, 81, 337–354. [Google Scholar] [CrossRef]
  20. Zeng, L. Exploration of Relationships between Physiological Parameters and Growth Performance of Rice (Oyza sativa L.) Seedlings under Salinity Stress Using Multivariate Analysis. Plant Soil 2005, 268, 51–59. [Google Scholar] [CrossRef]
  21. Qin, H.; Li, Y.; Huang, R. Advances and Challenges in the Breeding of Salt-Tolerant Rice. Int. J. Mol. Sci. 2020, 21, 8385. [Google Scholar] [CrossRef]
  22. Bado, S.; Forster, B.; Padilla Alvarez, R.; Resch, C.; Migliori, A.; Diawara, Y.; Jaksic, M.; Ali, A.; Ghanim, A.M.A.; Nielen, S.; et al. Prediction of Salt Tolerance in Rice (Oryza sativa) Based on Shoot Ion Content under Non-Stressed Conditions. J. Mater. Sci. Eng. A 2016, 6, 1–16. [Google Scholar] [CrossRef] [Green Version]
  23. Ahmadi, N.; Negrão, S.; Katsantonis, D.; Frouin, J.; Ploux, J.; Letourmy, P.; Droc, G.; Babo, P.; Trindade, H.; Bruschi, G.; et al. Targeted Association Analysis Identified Japonica Rice Varieties Achieving Na+/K+ Homeostasis without the Allelic Make-up of the Salt Tolerant Indica Variety Nona Bokra. Theor. Appl. Genet. 2011, 123, 881–895. [Google Scholar] [CrossRef]
  24. Rohila, J.S.; Edwards, J.D.; Tran, G.D.; Jackson, A.K.; McClung, A.M. Identification of Superior Alleles for Seedling Stage Salt Tolerance in the USDA Rice Mini-Core Collection. Plants 2019, 8, 472. [Google Scholar] [CrossRef] [PubMed] [Green Version]
  25. Platten, J.D.; Egdane, J.A.; Ismail, A.M. Salinity Tolerance, Na+ Exclusion and Allele Mining of HKT1;5 in Oryza sativa and O. glaberrima: Many Sources, Many Genes, One Mechanism? BMC Plant Biol. 2013, 13, 32. [Google Scholar] [CrossRef] [PubMed] [Green Version]
  26. Pires, I.; Negrao, S.; Oliveira, M.; Purugganan, M. Comprehensive Phenotypic Analysis of Rice (Oryza sativa) Response to Salinity Stress. Physiol. Plant. 2015, 155, 43–54. [Google Scholar] [CrossRef] [PubMed] [Green Version]
  27. Yeo, A.R.; Yeo, M.E.; Flowers, S.A.; Flowers, T.J. Screening of Rice (Oryza sativa L.) Genotypes for Physiological Characters Contributing to Salinity Resistance, and Their Relationship to Overall Performance. Theor. Appl. Genet. 1990, 79, 377–384. [Google Scholar] [CrossRef]
  28. Munns, R.; Tester, M. Mechanisms of Salinity Tolerance. Annu. Rev. Plant Biol. 2008, 59, 651–681. [Google Scholar] [CrossRef] [Green Version]
  29. Cotsaftis, O.; Plett, D.; Shirley, N.; Tester, M.; Hrmova, M. A Two-Staged Model of Na+ Exclusion in Rice Explained by 3D Modeling of HKT Transporters and Alternative Splicing. PLoS ONE 2012, 7, e39865. [Google Scholar] [CrossRef] [Green Version]
  30. Lee, K.-S.; Choi, W.-Y.; Ko, J.-C.; Kim, T.-S.; Gregorio, G. Salinity Tolerance of Japonica and Indica Rice (Oryza sativa L.) at the Seedling Stage. Planta 2003, 216, 1043–1046. [Google Scholar] [CrossRef]
  31. Reddy, I.N.B.L.; Kim, B.-K.; Yoon, I.-S.; Kim, K.-H.; Kwon, T.-R. Salt Tolerance in Rice: Focus on Mechanisms and Approaches. Rice Sci. 2017, 24, 123–144. [Google Scholar] [CrossRef]
  32. De Leon, T.B.; Linscombe, S.; Gregorio, G.; Subudhi, P.K. Genetic Variation in Southern USA Rice Genotypes for Seedling Salinity Tolerance. Front. Plant Sci. 2015, 6, 374. [Google Scholar] [CrossRef] [Green Version]
  33. Kranto, S.; Chankaew, S.; Monkham, T.; Theerakulpisut, P.; Sanitchon, J. Evaluation for Salt Tolerance in Rice Using Multiple Screening Methods. J. Agric. Sci. Technol. 2016, 18, 1921–1931. [Google Scholar]
  34. Zeng, L.; Shannon, M. Salinity Effects on Seedling Growth and Yield Components of Rice. Crop Sci. 2000, 40, 996–1003. [Google Scholar] [CrossRef] [Green Version]
  35. Rubel, M.; Hassan, L.; Islam, M.; Robin, A.; Alam, M. Evaluation of Rice Genotypes under Salt Stress at the Seedling and Reproductive Stages Using Phenotypic and Molecular Markers. Pak. J. Bot. 2014, 46, 423–432. [Google Scholar]
  36. Gerona, M.E.B.; Deocampo, M.P.; Egdane, J.A.; Ismail, A.M.; Dionisio-Sese, M.L. Physiological Responses of Contrasting Rice Genotypes to Salt Stress at Reproductive Stage. Rice Sci. 2019, 26, 207–219. [Google Scholar] [CrossRef]
  37. Sen, T.T.H.; Nhi, P.T.P.; Sen, T.T. Salinity Effect at Seedling and Flowering Stages of Some Rice Lines and Varieties (Oryza sativa L.). J. Agric. Sci. Technol. 2017, 7, 32–39. [Google Scholar] [CrossRef] [Green Version]
  38. Hakim, M.; Juraimi, A.; Hanafi, M.M.; Ismail, M.R.; Rafii, M.; Islam, M.; Selamat, A. The Effect of Salinity on Growth, Ion Accumulation and Yield of Rice Varieties. J. Anim. Plant Sci. 2014, 24, 874–885. [Google Scholar]
  39. Wang, H.; Takano, T.; Liu, S. Screening and Evaluation of Saline–Alkaline Tolerant Germplasm of Rice (Oryza sativa L.) in Soda Saline–Alkali Soil. Agronomy 2018, 8, 205. [Google Scholar] [CrossRef] [Green Version]
  40. Ahmadizadeh, M.; Vispo, N.A.; Calapit-Palao, C.D.O.; Pangaan, I.D.; Viña, C.D.; Singh, R.K. Reproductive Stage Salinity Tolerance in Rice: A Complex Trait to Phenotype. Ind. J. Plant Physiol. 2016, 21, 528–536. [Google Scholar] [CrossRef]
  41. Aslam, M.; Qureshi, R.H.; Ahmed, N. A Rapid Screening Technique for Salt Tolerance in Rice (Oryza sativa L.). Plant Soil 1993, 150, 99–107. [Google Scholar] [CrossRef]
  42. Singh, R.; Flowers, T.J. The Physiology and Molecular Biology of the Effects of Salinity on Rice. In Handbook of Plant and Crop Stress; CRC Press: Boca Raton, FL, USA, 2010; pp. 901–942. [Google Scholar]
  43. Kibria, M.G.; Hossain, M.; Murata, Y.; Hoque, M.A. Antioxidant Defense Mechanisms of Salinity Tolerance in Rice Genotypes. Rice Sci. 2017, 24, 155–162. [Google Scholar] [CrossRef]
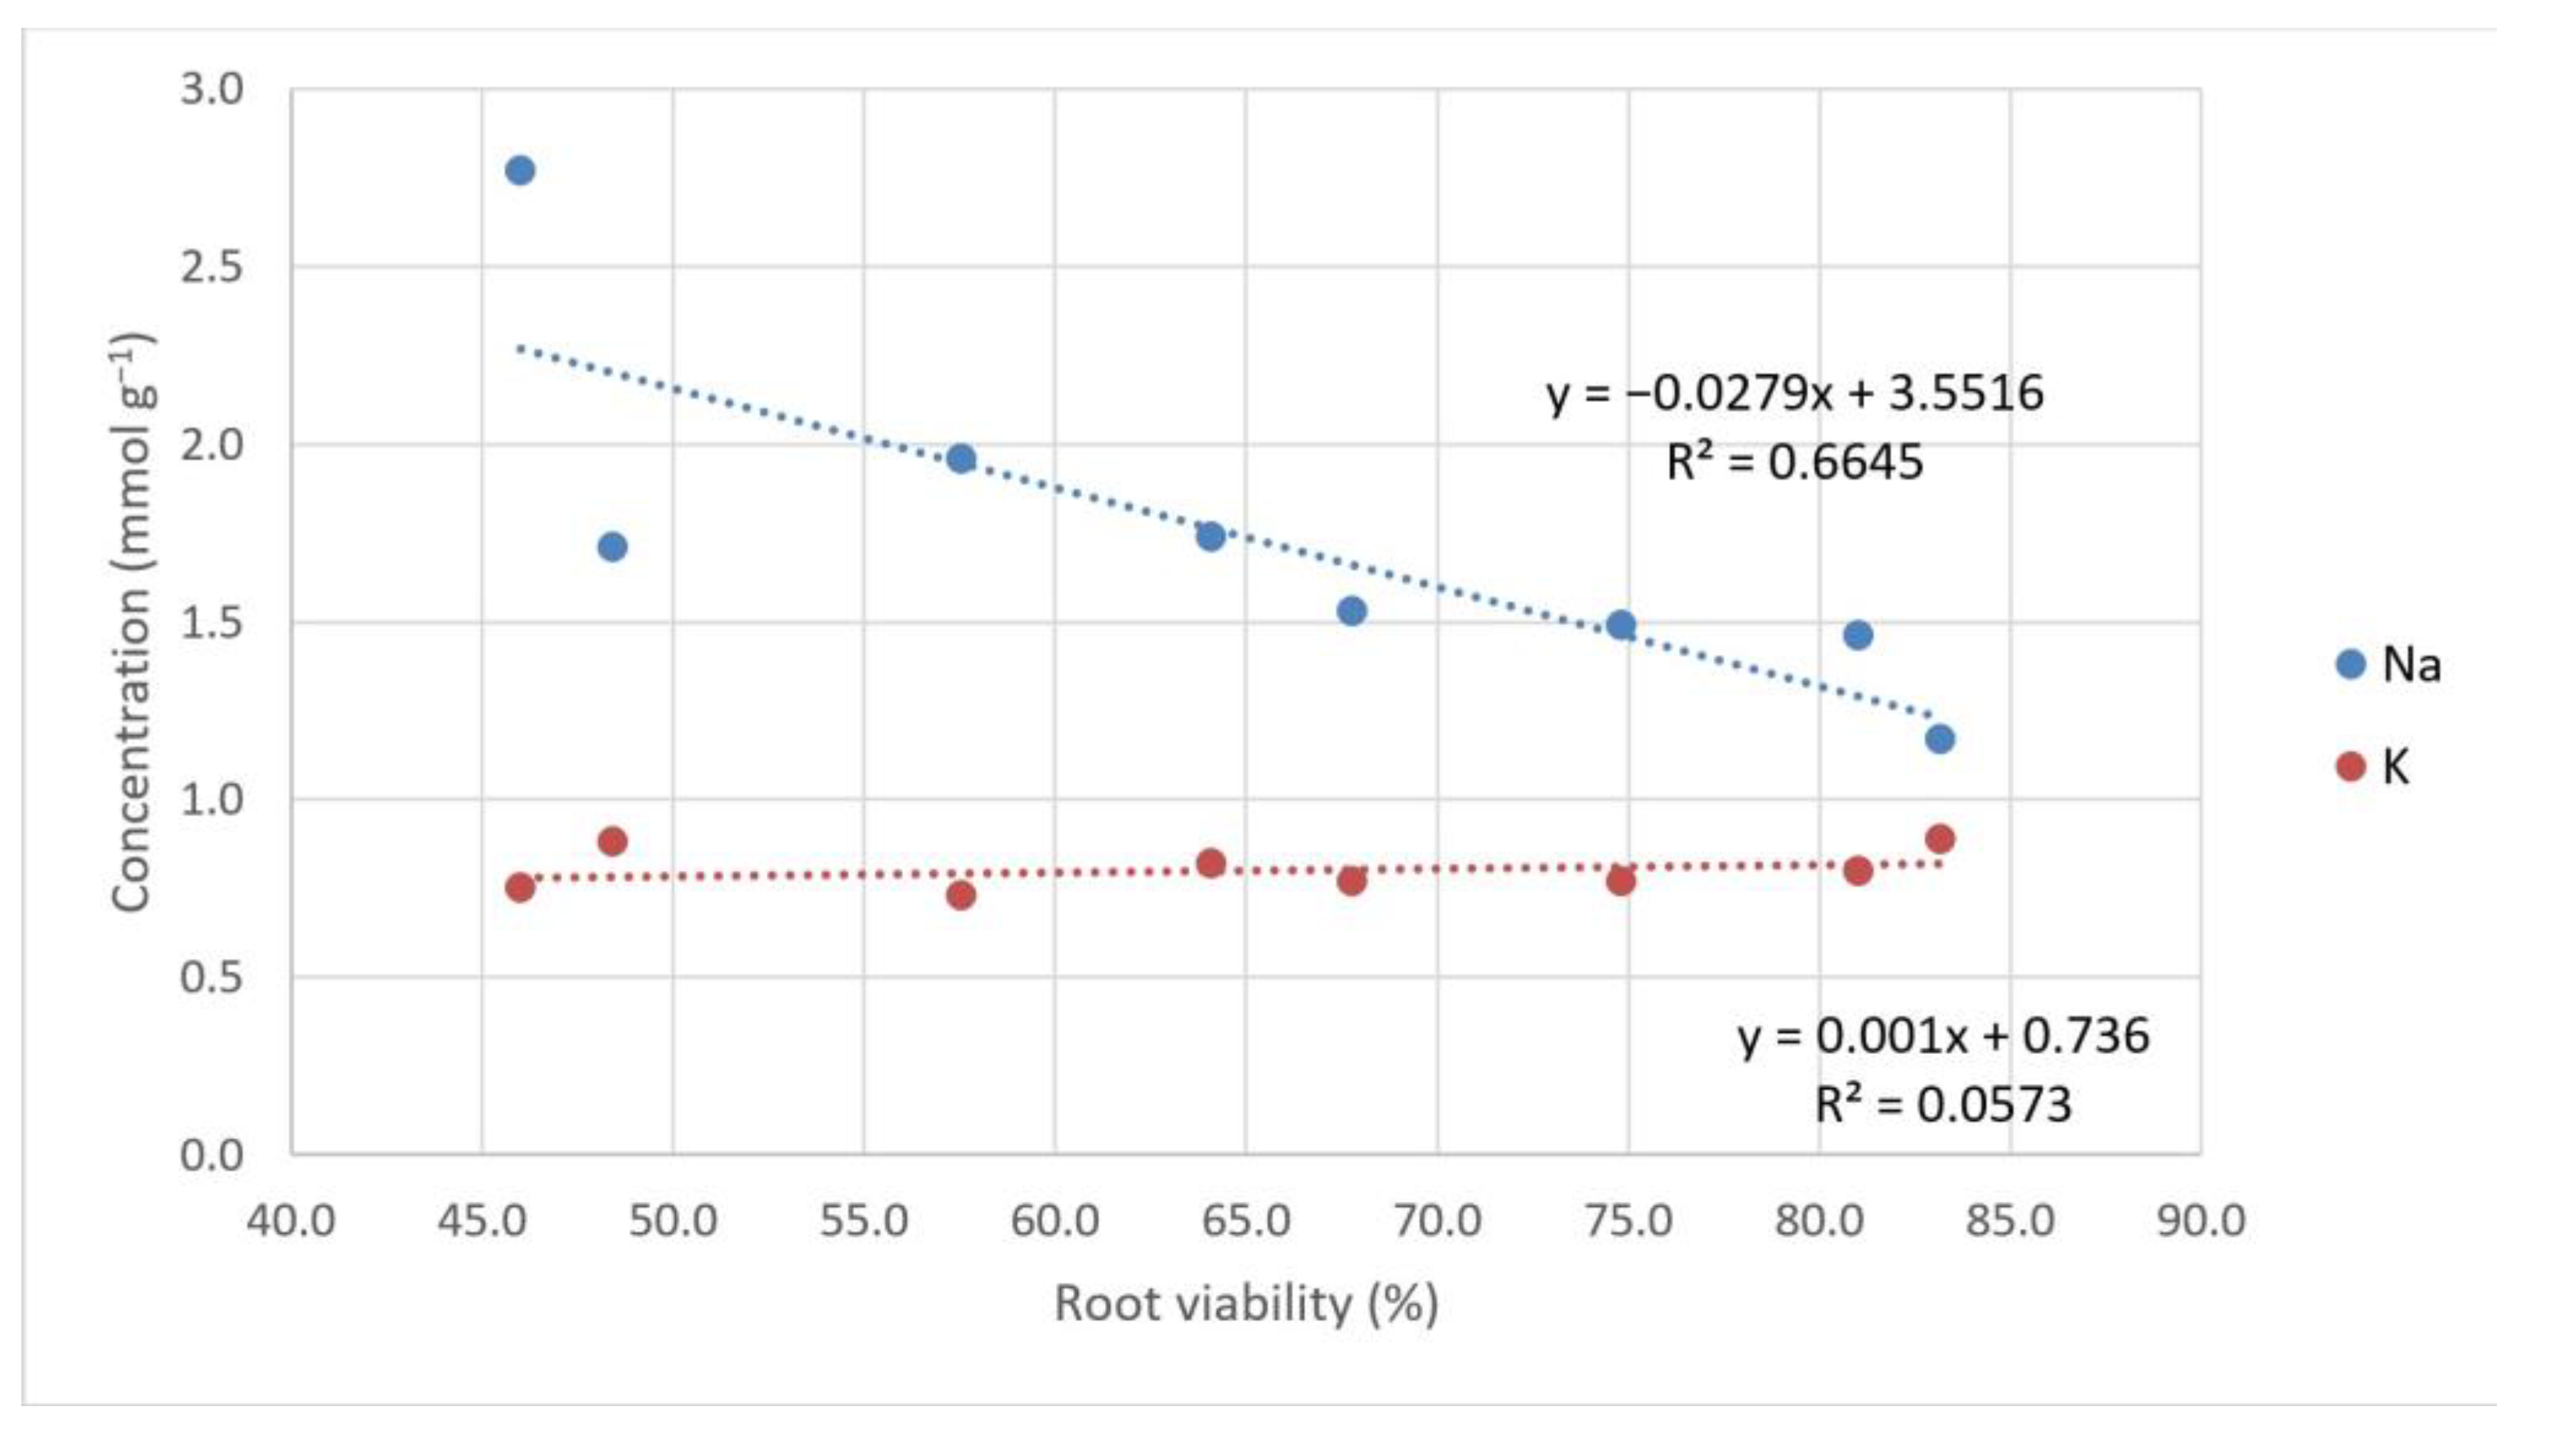
Figure 1. The interaction between root viability and the concentration of sodium and potassium in leaves of eight rice varieties at the seedling stage. The diagram contains all of the examined varieties. The dots represent the mean of three different measurements.
Agronomy 12 00652 g001
Figure 2. Total biomass production and tillering ability under control and saline treatment among rice varietal groups.
Agronomy 12 00652 g002
Figure 3. The sodium distribution in flag leaves and ripened seeds among the rice varietal groups. The dots are outliers which are belong to the M488 variety.
Agronomy 12 00652 g003
Figure 4. The relation between Na/K ratios in flag leaves and the yield of eight rice varieties under control and saline conditions. All dots show the average of three measurements. The red dots indicate the ‘M488’ variety.
Agronomy 12 00652 g004
Figure 5. Pearson correlation among studied parameters. The correlation matrix contains the mean of the rice varieties’ data together under control and saline conditions.
Agronomy 12 00652 g005
Table 1. The soil and water characteristics under control and saline conditions. EC25 is the electrical conductivity, which calculated to 25 °C from water and water/soil extracts in dS m−1.
WaterSoil
EC25 (dS m−1)EC25 (dS m−1)Sodium Content (mg kg−1)
ControlSalineControlSalineControlSaline
1.414.273.808.393441000
Publisher’s Note: MDPI stays neutral with regard to jurisdictional claims in published maps and institutional affiliations.