
Comparing Efficacy of Different Biostimulants for Hydroponically Grown Lettuce (Lactuca sativa L.)

 ,
,
Abstract
:1. Introduction
2. Materials and Methods
2.1. Experimental Design and Growth Conditions
2.2. Harvest and Sample Analysis
2.3. Data Analysis
3. Results
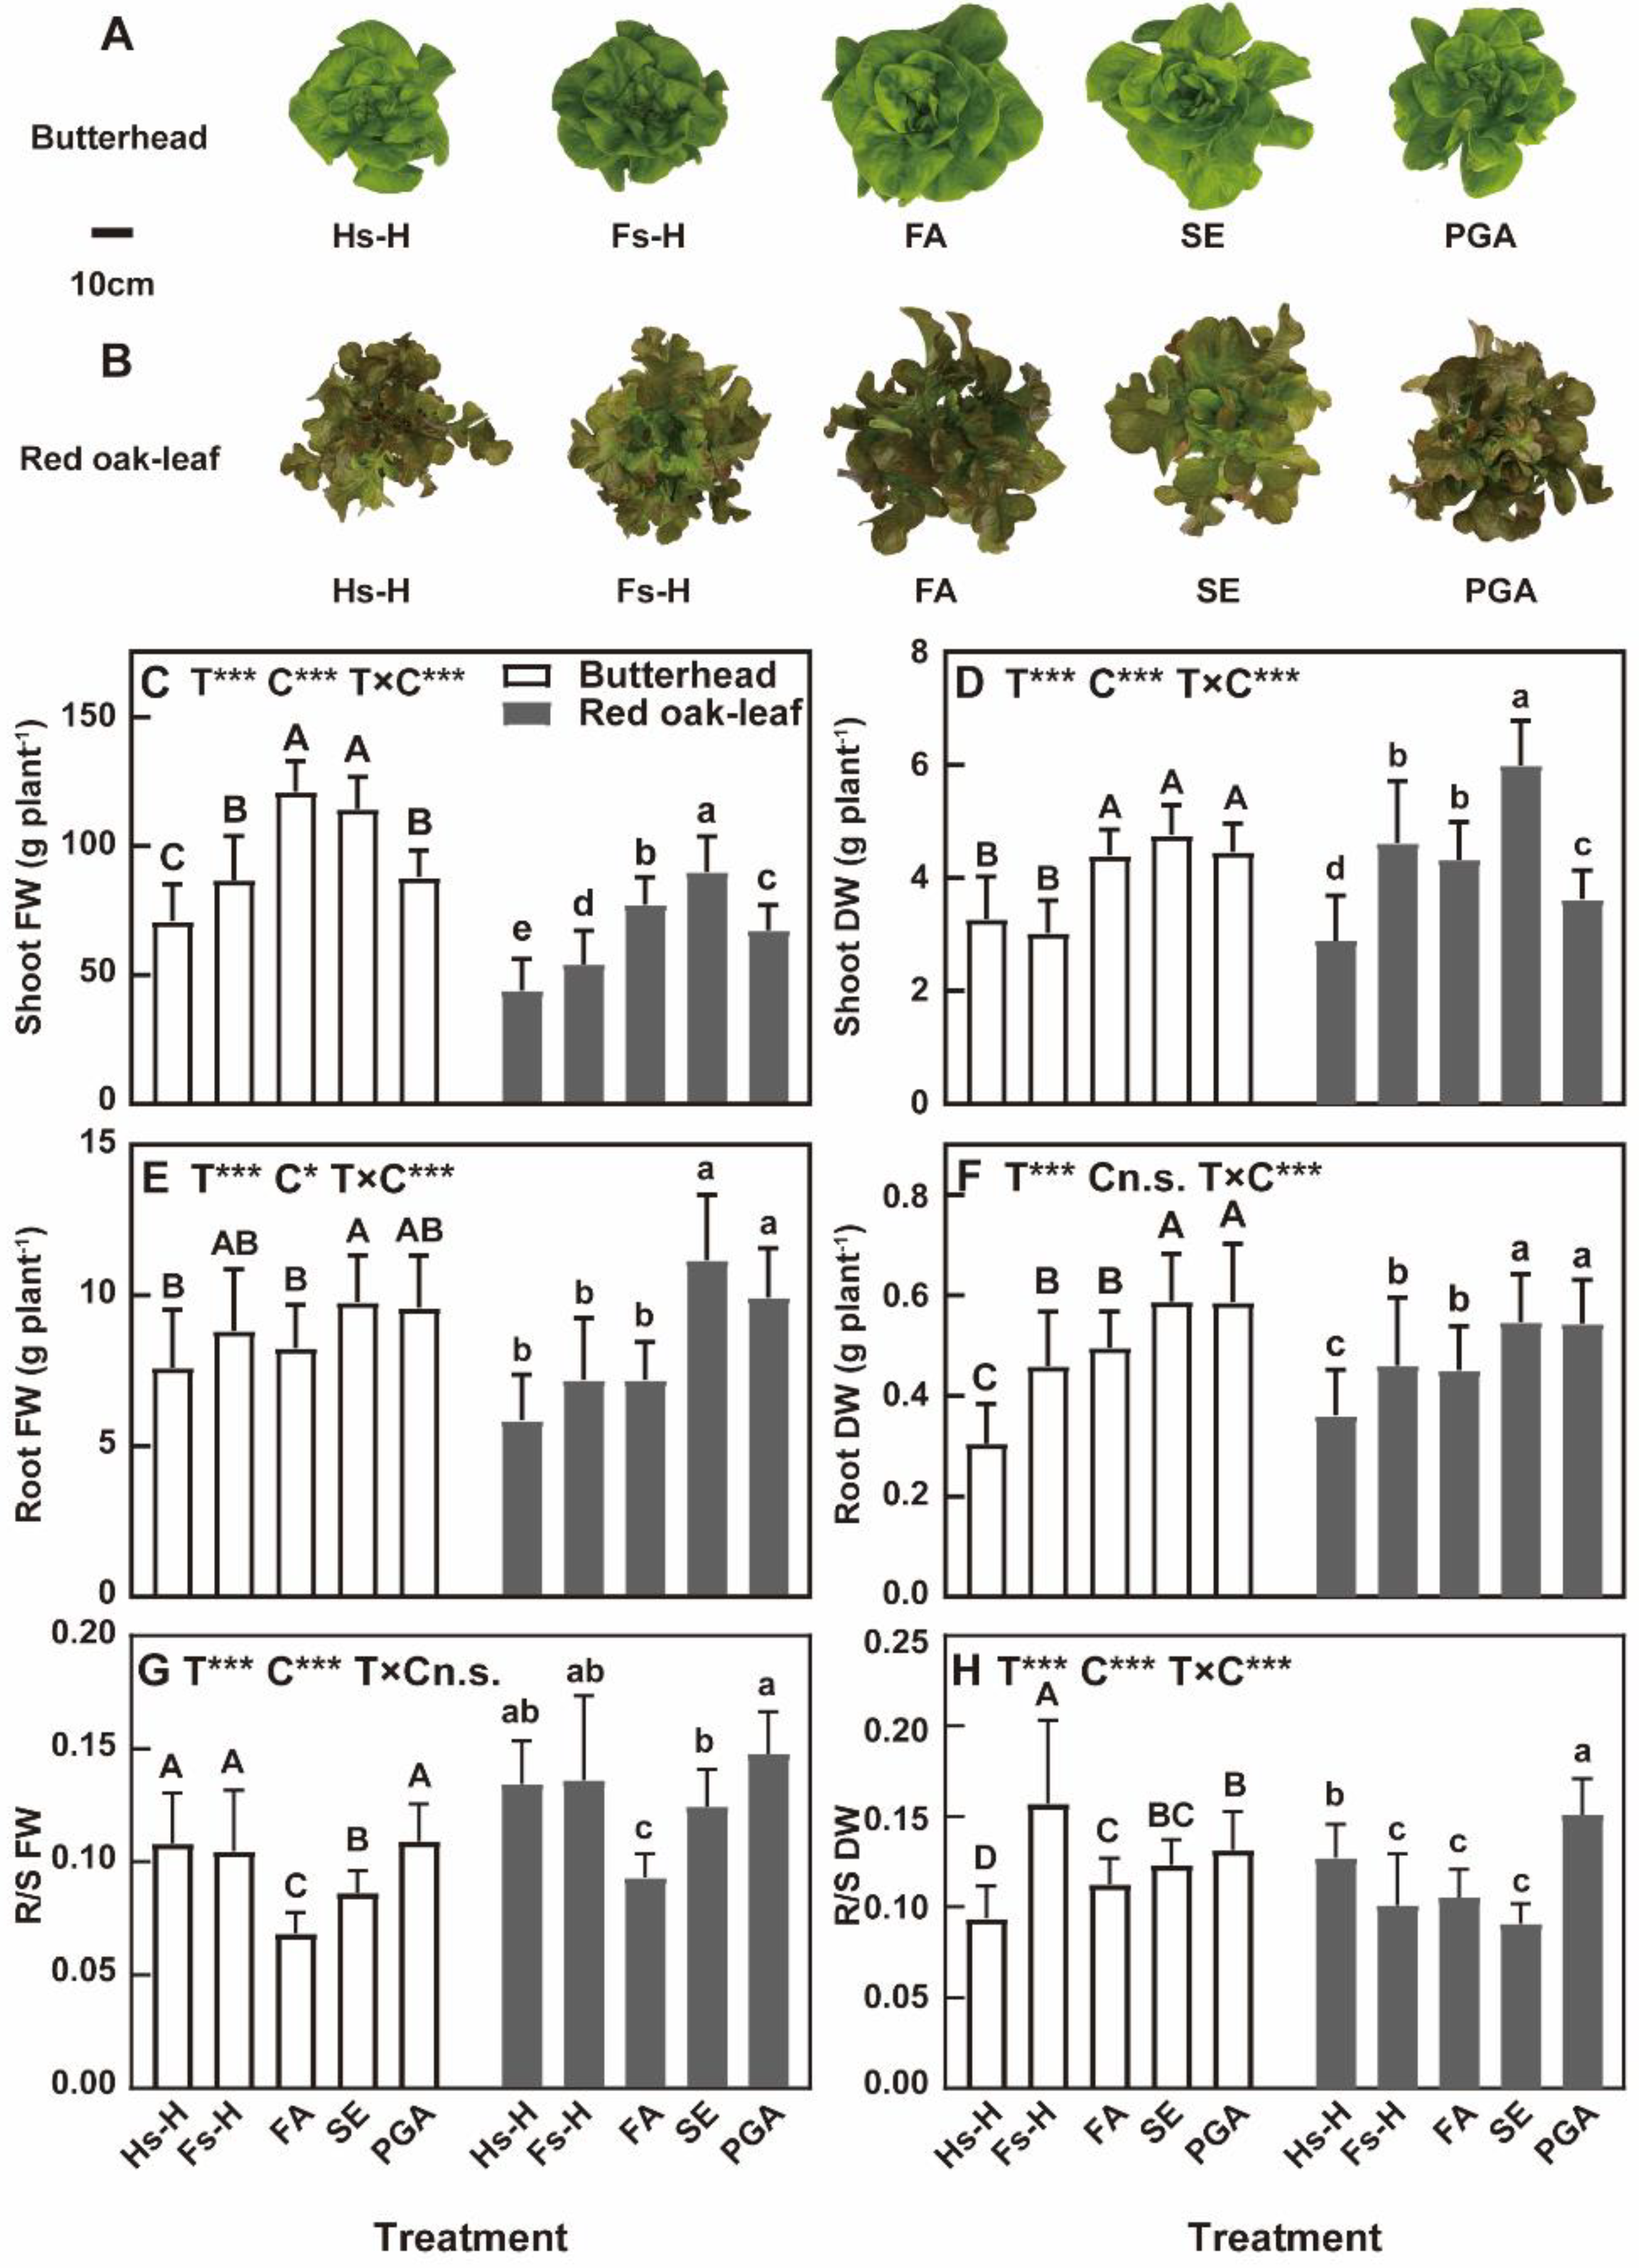
3.1. Biomass
3.2. Crop Quality
3.3. Nutrient Concentration and Content
3.4. Principal Component Analysis
4. Discussion
4.1. Biomass
4.2. Crop Quality
4.3. Nutrient Uptake
4.4. Mode of Action
5. Conclusions
Supplementary Materials
Author Contributions
Funding
Institutional Review Board Statement
Informed Consent Statement
Data Availability Statement
Acknowledgments
Conflicts of Interest
References
- United Nations, Department of Economic and Social Affairs. World Population Prospects. 2019. Available online: https://reliefweb.int/sites/reliefweb.int/files/resources/WPP2019_Highlights.pdf (accessed on 20 March 2022).
- Godfray, H.C.; Beddington, J.R.; Crute, I.R.; Haddad, L.; Lawrence, D.; Muir, J.F.; Pretty, J.; Robinson, S.; Thomas, S.M.; Toulmin, C. Food security: The challenge of feeding 9 billion people. Science 2010, 327, 812–818. [Google Scholar] [CrossRef] [PubMed] [Green Version]
- Wang, X.; Dou, Z.; Shi, X.; Zou, C.; Liu, D.; Wang, Z.; Guan, X.; Sun, Y.; Wu, G.; Zhang, B.; et al. Innovative management programme reduces environmental impacts in Chinese vegetable production. Nat. Food 2021, 2, 47–53. [Google Scholar] [CrossRef]
- Barbosa, G.L.; Gadelha, F.D.; Kublik, N.; Proctor, A.; Reichelm, L.; Weissinger, E.; Wohlleb, G.M.; Halden, R.U. Comparison of land, water, and energy requirements of lettuce grown using hydroponic vs. conventional agricultural methods. Int. J. Environ. Res. Public. Health 2015, 12, 6879–6891. [Google Scholar] [CrossRef] [PubMed] [Green Version]
- Putra, P.A.; Yuliando, H. Soilless Culture System to Support Water Use Efficiency and Product Quality: A Review. Agric. Agric. Sci. Procedia 2015, 3, 283–288. [Google Scholar] [CrossRef] [Green Version]
- Jones, J.B. Complete Guide for Growing Plants Hydroponically; CRC Press–Taylor & Francis Group: Boca Raton, FL, USA, 2014. [Google Scholar]
- Zheng, Y.; Graham, T.H.; Richard, S.; Dixon, M. Can Low Nutrient Strategies Be Used for Pot Gerbera Production in Closed-Loop Subirrigation? Acta Hortic. 2005, 691, 365–372. [Google Scholar] [CrossRef]
- Dufour, L.; Guérin, V. Nutrient solution effects on the development and yield of Anthurium andreanum Lind. in tropical soilless conditions. Sci. Hortic. 2005, 105, 269–282. [Google Scholar] [CrossRef]
- Siddiqi, M.Y.; Kronzucker, H.J.; Britto, D.T.; Glass, A.D.M. Growth of a tomato crop at reduced nutrient concentrations as a strategy to limit eutrophication. J. Plant Nutr. 1998, 21, 1879–1895. [Google Scholar] [CrossRef]
- Rouphael, Y.; Colla, G. The Influence of Drip Irrigation or Subirrigation on Zucchini Squash Grown in Closed-loop Substrate Culture with High and Low Nutrient Solution Concentrations. HortScience 2009, 44, 306–311. [Google Scholar] [CrossRef] [Green Version]
- Sonneveld, C.; Voogt, W. Nutrient solutions for soilless cultures. In Plant Nutrition of Greenhouse Crops; Springer: Dordrecht, The Netherlands, 2009; pp. 257–275. [Google Scholar]
- Walters, K.J.; Currey, C.J. Effects of Nutrient Solution Concentration and Daily Light Integral on Growth and Nutrient Concentration of Several Basil Species in Hydroponic Production. HortScience 2018, 53, 1319–1325. [Google Scholar] [CrossRef]
- Wada, T. Theory and Technology to Control the Nutrient Solution of Hydroponics. In Plant Factory Using Artificial Light; Anpo, M., Fukuda, H., Wada, T., Eds.; Elsevier: Amsterdam, The Netherland, 2019; pp. 5–14. [Google Scholar]
- Shahein, M.M.; Afifi, M.M.; Algharib, A.M. Assessing the effect of humic substances extracted from compost and biogas manure on yield and quality of lettuce (Lactuca sativa L.). J. Mater. Environ. Sci. 2014, 14, 996–1009. [Google Scholar]
- Guilayn, F.; Benbrahim, M.; Rouez, M.; Crest, M.; Patureau, D.; Jimenez, J. Humic-like substances extracted from different digestates: First trials of lettuce biostimulation in hydroponic culture. Waste Manag. 2020, 104, 239–245. [Google Scholar] [CrossRef] [PubMed]
- European Biostimulants Industry Council EBIC and Biostimulants in Brief. 2012. Available online: https://www.biostimulants.eu/ (accessed on 20 March 2022).
- Ertani, A.; Pizzeghello, D.; Altissimo, A.; Nardi, S. Use of meat hydrolyzate derived from tanning residues as plant biostimulant for hydroponically grown maize. J. Plant Nutr. Soil Sci. 2013, 176, 287–295. [Google Scholar] [CrossRef]
- Nanda, S.; Kumar, G.; Hussain, S. Utilization of seaweed-based biostimulants in improving plant and soil health: Current updates and future prospective. Int. J. Environ. Sci. Technol. 2021. [Google Scholar] [CrossRef]
- Smoleń, S.; Ledwożyw-Smoleń, I.; Sady, W. The role of exogenous humic and fulvic acids in iodine biofortification in spinach (Spinacia oleracea L.). Plant Soil 2015, 402, 129–143. [Google Scholar] [CrossRef]
- Du Jardin, P.; Xu, L.; Geelen, D. Agricultural functions and action mechanisms of plant biostimulants (PBs): An introduction. In The Chemical Biology of Plant Biostimulants; Geelen, D., Xu, L., Eds.; Wiley: Hoboken, NJ, USA, 2020; pp. 14–16. [Google Scholar]
- Wozniak, E.; Blaszczak, A.; Wiatrak, P.; Canady, M. Biostimulant Mode of Action: Impact of biostimulant on whole-plant level. In The Chemical Biology of Plant Biostimulants; Geelen, D., Xu, L., Eds.; Wiley: Hoboken, NJ, USA, 2020; pp. 205–227. [Google Scholar]
- Vernieri, P.; Borghesi, E.; Ferrante, A.; Magnani, G. Application of biostimulants in floating system for improving rocket quality. Int. J. Environ. Sci. Technol. 2005, 3, 86–88. [Google Scholar]
- Bulgari, R.; Cocetta, G.; Trivellini, A.; Vernieri, P.; Ferrante, A. Biostimulants and crop responses: A review. Biol. Agric. Hortic. 2014, 31, 1–17. [Google Scholar] [CrossRef]
- Calvo, P.; Nelson, L.; Kloepper, J.W. Agricultural uses of plant biostimulants. Plant Soil 2014, 383, 3–41. [Google Scholar] [CrossRef] [Green Version]
- Du Jardin, P. Plant biostimulants: Definition, concept, main categories and regulation. Sci. Hortic. 2015, 196, 3–14. [Google Scholar] [CrossRef] [Green Version]
- Yakhin, O.I.; Lubyanov, A.A.; Yakhin, I.A.; Brown, P.H. Biostimulants in plant science: A global perspective. Front. Plant Sci. 2017, 7, 2049. [Google Scholar] [CrossRef] [Green Version]
- Varanini, Z.; Pinton, R. Direct versus indirect effects of soil humic substances on plant growth and nutrition. In The Rhizosphere; Pinton, R., Varanini, Z., Nannipieri, P., Eds.; Marcel Dekker, Inc.: Basel, Switzerland, 2001; pp. 141–158. [Google Scholar]
- Dobbss, L.B.; Medici, L.O.; Peres, L.E.P.; Pino-Nunes, L.E.; Rumjanek, V.M.; Façanha, A.R.; Canellas, L.P. Changes in root development of Arabidopsis promoted by organic matter from oxisols. Ann. Appl. Biol. 2007, 151, 199–211. [Google Scholar] [CrossRef]
- Lei, P.; Xu, Z.; Ding, Y.; Tang, B.; Zhang, Y.; Li, H.; Feng, X.; Xu, H. Effect of Poly(gamma-glutamic acid) on the Physiological Responses and Calcium Signaling of Rape Seedlings (Brassica napus L.) under Cold Stress. J. Agric. Food Chem. 2015, 63, 10399–10406. [Google Scholar] [CrossRef] [PubMed]
- Lei, P.; Xu, Z.; Liang, J.; Luo, X.; Zhang, Y.; Feng, X.; Xu, H. Poly(γ-glutamic acid) enhanced tolerance to salt stress by promoting proline accumulation in Brassica napus L. Plant Growth Regul. 2015, 78, 233–241. [Google Scholar] [CrossRef]
- Xu, Z.; Lei, P.; Feng, X.; Xu, X.; Liang, J.; Chi, B.; Xu, H. Calcium involved in the poly(gamma-glutamic acid)-mediated promotion of Chinese cabbage nitrogen metabolism. Plant Physiol. Biochem. 2014, 80, 144–152. [Google Scholar] [CrossRef] [PubMed]
- Yang, X.; Cui, X.; Zhao, L.; Guo, D.; Feng, L.; Wei, S.; Zhao, C.; Huang, D. Exogenous glycine nitrogen enhances ac-cumulation of glycosylated flavonoids and antioxidant activity in lettuce (Lactuca sativa L.). Front. Plant Sci. 2017, 8, 2098. [Google Scholar] [CrossRef] [PubMed] [Green Version]
- Yang, X.; Wei, S.; Liu, B.; Guo, D.; Zheng, B.; Feng, L.; Liu, Y.; Tomas-Barberan, F.A.; Luo, L.; Huang, D. A novel integrated non-targeted metabolomic analysis reveals significant metabolite variations between different lettuce (Lactuca sativa. L) varieties. Hortic. Res. 2018, 5, 33. [Google Scholar] [CrossRef] [Green Version]
- FAO. FAOSTAT Database: Agriculture Production. Food and Agriculture Organization of the United Nations: Rome, Italy, 2019. Available online: https://www.oecd.org/gov/regulatory-policy/FAO_Full-Report.pdf (accessed on 20 March 2022).
- Hoagland, D.R.; Arnon, D.I. The water culture method for growing plants without soil. Calif. Agric. Exp. Stn. 1950, 347, 39. [Google Scholar]
- Djidonou, D.; Leskovar, D.I. Seasonal Changes in Growth, Nitrogen Nutrition, and Yield of Hydroponic Lettuce. HortScience 2019, 54, 76–85. [Google Scholar] [CrossRef] [Green Version]
- Gillespie, D.P.; Papio, G.; Kubota, C. High Nutrient Concentrations of Hydroponic Solution Can Improve Growth and Nutrient Uptake of Spinach (Spinacia oleracea L.) Grown in Acidic Nutrient Solution. HortScience 2021, 56, 687–694. [Google Scholar] [CrossRef]
- ÖZtekİN, G.B.; UludaĞ, T.; TÜZel, Y. Growing spinach (Spinacia oleracea L.) in a floating system with different concentrations of nutrient solution. Appl. Ecol. Environ. Res. 2018, 16, 3333–3350. [Google Scholar] [CrossRef]
- Manzocco, L.; Foschia, M.; Tomasi, N.; Maifreni, M.; Dalla Costa, L.; Marino, M.; Cortella, G.; Cesco, S. Influence of hydroponic and soil cultivation on quality and shelf life of ready-to-eat lamb’s lettuce (Valerianella locusta L. Laterr). J. Sci. Food Agric. 2011, 91, 1373–1380. [Google Scholar] [CrossRef]
- Cristofano, F.; El-Nakhel, C.; Rouphael, Y. Biostimulant substances for sustainable agriculture: Origin, operating mechanisms and effects on cucurbits, leafy greens, and nightshade vegetables species. Biomolecules 2021, 11, 1103. [Google Scholar] [CrossRef] [PubMed]
- Cataldo, D.A.; Maroon, M.; Schrader, L.E.; Youngs, V.L. Rapid colorimetric determination of nitrate in plant tissue by nitration of salicylic acid. Commun. Soil. Sci. Plan. 1975, 6, 71–80. [Google Scholar] [CrossRef]
- Ruuska, S.A.; Rebetzke, G.J.; van Herwaarden, A.F.; Richards, R.A.; Fettell, N.A.; Tabe, L.; Jenkins, C.L.D. Genotypic variation in water-soluble carbohydrate accumulation in wheat. Funct. Plant Biol. 2006, 33, 799–809. [Google Scholar] [CrossRef] [PubMed]
- Sedmak, J.J.; Grossberg, S.E. A rapid, sensitive, and versatile assay for protein using Coomassie brilliant blue G250. Anal. Biochem. 1977, 79, 544–552. [Google Scholar] [CrossRef]
- Kitson, R.; Mellon, M. Colorimetric determination of phosphorus as molybdivanadophosphoric acid. Ind. Eng. Chem. 1944, 16, 379–383. [Google Scholar] [CrossRef]
- Gent, M.P.N. Factors Affecting Relative Growth Rate of Lettuce and Spinach in Hydroponics in a Greenhouse. HortScience 2017, 52, 1742–1747. [Google Scholar] [CrossRef] [Green Version]
- Yang, T.; Samarakoon, U.; Altland, J.; Ling, P. Photosynthesis, Biomass Production, Nutritional Quality, and Flavor-Related Phytochemical Properties of Hydroponic-Grown Arugula (Eruca sativa Mill.) ‘Standard’ under Different Electrical Conductivities of Nutrient Solution. Agronomy 2021, 11, 1340. [Google Scholar] [CrossRef]
- Colla, G.; Hoagland, L.; Ruzzi, M.; Cardarelli, M.; Bonini, P.; Canaguier, R.; Rouphael, Y. Biostimulant action of protein hydrolysates: Unraveling their effects on plant physiology and microbiome. Front. Plant Sci. 2017, 8, 2202. [Google Scholar] [CrossRef] [Green Version]
- Sandepogu, M.; Shukla, P.S.; Asiedu, S.; Yurgel, S.; Prithiviraj, B. Combination of Ascophyllum nodosum extract and humic acid improve early growth and reduces post-harvest loss of lettuce and spinach. Agriculture 2019, 9, 240. [Google Scholar] [CrossRef] [Green Version]
- Sun, Q.; Ding, W.; Yang, Y.; Sun, J.; Ding, Q. Humic Acids Derived from Leonardite-Affected Growth and Nutrient Uptake of Corn Seedlings. Commun. Soil Sci. Plan. 2016, 47, 1275–1282. [Google Scholar] [CrossRef]
- Rose, M.T.; Patti, A.F.; Little, K.R.; Brown, A.L.; Jackson, W.R.; Cavagnaro, T.R. A Meta-Analysis and Review of Plant-Growth Response to Humic Substances: Practical Implications for Agriculture. Adv. Agron. 2014, 124, 37–89. [Google Scholar]
- Wang, Q.; Chen, S.; Zhang, J.; Sun, M.; Liu, Z.; Yu, Z. Co-producing lipopeptides and poly-gamma-glutamic acid by solid-state fermentation of Bacillus subtilis using soybean and sweet potato residues and its biocontrol and fertilizer synergistic effects. Bioresour. Technol. 2008, 99, 3318–3323. [Google Scholar] [CrossRef] [PubMed]
- Bian, Z.; Wang, Y.; Zhang, X.; Li, T.; Grundy, S.; Yang, Q.; Cheng, R. A Review of Environment Effects on Nitrate Accumulation in Leafy Vegetables Grown in Controlled Environments. Foods 2020, 9, 732. [Google Scholar] [CrossRef] [PubMed]
- Ertani, A.; Cavani, L.; Pizzeghello, D.; Brandellero, E.; Altissimo, A.; Ciavatta, C.; Nardi, S. Biostimulant activity of two protein hydrolyzates in the growth and nitrogen metabolism of maize seedlings. J. Soil Sci. Plant Nut. 2009, 172, 237–244. [Google Scholar] [CrossRef]
- Di Mola, I.; Cozzolino, E.; Ottaiano, L.; Giordano, M.; Rouphael, Y.; Colla, G.; Mori, M. Effect of vegetal- and seaweed extract-based biostimulants on agronomical and leaf quality traits of plastic tunnel-grown baby lettuce under four regimes of nitrogen fertilization. Agronomy 2019, 9, 571. [Google Scholar] [CrossRef] [Green Version]
- Cavani, L.; Margon, A.; Sciubba, L.; Ciavatta, C.; Marzadori, C. What we talk about when we talk about protein hydrolyzate-based biostimulants. AIMS Agric. Food 2017, 2, 221–232. [Google Scholar] [CrossRef]
- Lee, D.; Nishizawa, M.; Shimizu, Y.; Saeki, H. Anti-inflammatory effects of dulse (Palmaria palmata) resulting from the simultaneous water-extraction of phycobiliproteins and chlorophyll a. Food Res. Int. 2017, 100, 514–521. [Google Scholar] [CrossRef]
- Viršilė, A.; Brazaitytė, A.; Vaštakaitė-Kairienė, V.; Jankauskienė, J.; Miliauskienė, J.; Samuolienė, G.; Novičkovas, A.; Duchovskis, P. Nitrate, nitrite, protein, amino acid contents, and photosynthetic and growth characteristics of tatsoi cultivated under various photon flux densities and spectral light compositions. Sci. Hortic. 2019, 258, 108781. [Google Scholar] [CrossRef]
- Zhang, X.; Bian, Z.; Yuan, X.; Chen, X.; Lu, C. A review on the effects of light-emitting diode (LED) light on the nutrients of sprouts and microgreens. Trends Food Sci. Tech. 2020, 99, 203–216. [Google Scholar] [CrossRef]
- Grabowska, A.; Kunicki, E.; Sekara, A.; Kalisz, A.; Wojciechowska, R. The effect of cultivar and biostimulant treatment on the carrot yield and its quality. Veg. Crops Res. Bull. 2012, 77, 37–48. [Google Scholar] [CrossRef]
- Ali, O.; Ramsubhag, A.; Jayaraman, J. Biostimulant properties of seaweed extracts in plants: Implications towards sustainable crop production. Plants 2021, 10, 531. [Google Scholar] [CrossRef] [PubMed]
- Valdrighi, M.M.; Pera, A.; Agnolucci, M.; Frassinetti, S.; Lunardi, D.; Vallini, G. Effects of compost-derived humic acids on vegetable biomass production and microbial growth within a plant (Cichorium intybus)-soil system: A comparative study. Agric. Ecosyst. Environ. 1996, 58, 133–144. [Google Scholar] [CrossRef]
- Colla, G.; Nardi, S.; Cardarelli, M.; Ertani, A.; Lucini, L.; Canaguier, R.; Rouphael, Y. Protein hydrolysates as biostimu-lants in horticulture. Sci. Hortic. 2015, 196, 28–38. [Google Scholar] [CrossRef]
- Moe, L.A. Amino acids in the rhizosphere: From plants to microbes. Am. J. Bot. 2013, 100, 1692–1705. [Google Scholar] [CrossRef] [PubMed]
- Craigie, J.S. Seaweed extract stimuli in plant science and agriculture. J. Appl. Phycol. 2010, 23, 371–393. [Google Scholar] [CrossRef]
- Ertani, A.; Francioso, O.; Tinti, A.; Schiavon, M.; Pizzeghello, D.; Nardi, S. Evaluation of seaweed extracts from Laminaria and Ascophyllum nodosum spp. as biostimulants in Zea mays L. using a combination of chemical, biochemical and morphological approaches. Front. Plant Sci. 2018, 9, 428. [Google Scholar] [CrossRef]
- Mondal, D.; Ghosh, A.; Prasad, K.; Singh, S.; Bhatt, N.; Zodape, S.T.; Chaudhary, J.P.; Chaudhari, J.; Chatterjee, P.B.; Seth, A.; et al. Elimination of gibberellin from Kappaphycus alvarezii seaweed sap foliar spray enhances corn stover production without compromising the grain yield advantage. Plant Growth Regul. 2015, 75, 657–666. [Google Scholar] [CrossRef]
- Aguirre, E.; Lemenager, D.; Bacaicoa, E.; Fuentes, M.; Baigorri, R.; Zamarreno, A.M.; Garcia-Mina, J.M. The root application of a purified leonardite humic acid modifies the transcriptional regulation of the main physiological root responses to Fe deficiency in Fe-sufficient cucumber plants. Plant Physiol. Biochem. 2009, 47, 215–223. [Google Scholar] [CrossRef]
- Azcona, I.; Pascual, I.; Aguirreolea, J.; Fuentes, M.; García-Mina, J.M.; Sánchez-Díaz, M. Growth and development of pepper are affected by humic substances derived from composted sludge. J. Soil Sci. Plant Nut. 2011, 174, 916–924. [Google Scholar] [CrossRef]
- Chen, Y.; Magen, H.; Riov, J. Humic substances originating from rapidly decomposing organic matter: Properties and effects on plant growth. In Humic Substances in the Global Environment and Implication on Human Health; Senesi, N., Tiano, E.M., Eds.; Elsevier: Amsterdam, The Netherland, 1994; pp. 427–433. [Google Scholar]
- Yang, X.; Qin, W.; Wang, L.; Zhang, M.; Niu, Z. Long-term variations of surface solar radiation in China from routine meteorological observations. Atmos. Res. 2021, 260, 105715. [Google Scholar] [CrossRef]
- Gent, M.P.N. Effect of temperature on composition of hydroponic lettuce. Acta Hortic. 2016, 1123, 95–100. [Google Scholar] [CrossRef]
- Miller, A.; Langenhoven, P.; Nemali, K. Maximizing Productivity of Greenhouse-grown Hydroponic Lettuce during Winter. HortScience 2020, 55, 1963–1969. [Google Scholar] [CrossRef]
- Nair, P.; Kandasamy, S.; Zhang, J.; Ji, X.; Kirby, C.; Benkel, B.; Hodges, M.D.; Critchley, A.T.; Hiltz, D.; Prithiviraj, B. Transcriptional and metabolomic analysis of Ascophyllum nodosum mediated freezing tolerance in Arabidopsis thaliana. BMC Genom. 2012, 13, 643. [Google Scholar] [CrossRef] [PubMed] [Green Version]
- Colla, G.; Svecová, E.; Cardarelli, M.; Rouphael, Y.; Reynaud, H.; Canaguier, R.; Planques, B. Effectiveness of a Plant-Derived Protein Hydrolysate to Improve Crop Performances under Different Growing Conditions. Acta Hortic. 2013, 1009, 175–179. [Google Scholar] [CrossRef]
- Koukounaras, A.; Tsouvaltzis, P.; Siomos, A.S. Effect of root and foliar application of amino acids on the growth and yield of greenhouse tomato in different fertilization levels. J. Food Agric. Environ. 2013, 11, 644–648. [Google Scholar]
- Dunstone, R.L.; Richards, R.A.; Rawson, H.M. Variable responses of stomatal conductance, growth, and yield to fulvic acid applications to wheat. Aust. J. Agric. Res. 1988, 39, 547–553. [Google Scholar] [CrossRef]
- Michalak, I.; Chojnacka, K.; Dmytryk, A.; Wilk, R.; Gramza, M.; Roj, E. Evaluation of Supercritical Extracts of Algae as Biostimulants of Plant Growth in Field Trials. Front. Plant Sci. 2016, 7, 1591. [Google Scholar] [CrossRef] [Green Version]
- Cristofano, F.; El-Nakhel, C.; Pannico, A.; Giordano, M.; Colla, G.; Rouphael, Y. Foliar and Root Applications of Vegetal-Derived Protein Hydrolysates Differentially Enhance the Yield and Qualitative Attributes of Two Lettuce Cultivars Grown in Floating System. Agronomy 2021, 11, 1194. [Google Scholar] [CrossRef]


| Biostimulant | C (%) | N (%) | P (mg kg−1) | K (mg kg−1) | S (mg kg−1) | Ca (mg kg−1) | Mg (mg kg−1) | Fe (mg kg−1) | Mn (mg kg−1) | Cu (mg kg−1) | Zn (mg kg−1) |
|---|---|---|---|---|---|---|---|---|---|---|---|
| FA | 29.21 | 0.71 | 200.34 | 60,198.85 | 31,793.12 | 1054.90 | 1111.34 | 10,174.43 | 83.08 | 17.78 | 23.19 |
| SE | 27.26 | 0.86 | 64.50 | 83,309.58 | 35,666.93 | 242.19 | 425.13 | 1556.07 | 22.99 | 1.39 | 6.34 |
| PGA | 3.58 | 1.28 | 616.10 | 6137.83 | 1.88 | 7.88 | 105.56 | 7.60 | 0.34 | 0.23 | 0.49 |
| Treatment | Description | EC (mS cm−1) | Original pH |
|---|---|---|---|
| Hs-H | Half-strength Hoagland solution | 1.28 | 6.46 |
| Fs-H | Full-strength Hoagland solution | 2.74 | 5.94 |
| FA | Hs-H + 50 mg/L fluvic acid | 1.79 | 6.02 |
| SE | Hs-H + 334 mg/L seaweed extract | 1.88 | 6.92 |
| PGA | Hs-H + 5 ml/L gamma polyglutamic acid | 1.96 | 6.74 |
| Treatment | N (g kg−1) | P (g kg−1) | K (g kg−1) | S (g kg−1) | Ca (g kg−1) | Mg (g kg−1) | Fe (mg kg−1) | Mn (mg kg−1) | Cu (mg kg−1) | Zn (mg kg−1) |
|---|---|---|---|---|---|---|---|---|---|---|
| Butterhead | ||||||||||
| Hs-H | 33.1 ± 1.21 A | 9.9 ± 0.54 A | 79.2 ± 1.55 B | 2.45 ± 0.06 AB | 1.55 ± 0.04 A | 3.55 ± 0.03 A | 81.8 ± 4.75 A | 48.6 ± 0.29 C | 7.48 ± 0.32 AB | 54.1 ± 2.58 B |
| Fs-H | 31.7 ± 1.22 A | 10.1 ± 0.09 A | 80.3 ± 2.21 B | 3.09 ± 0.16 A | 1.14 ± 0.06 B | 3.20 ± 0.07 AB | 81.9 ± 6.93 A | 64.6 ± 2.42 B | 7.16 ± 0.50 AB | 51.3 ± 0.81 B |
| FA | 27.3 ± 3.46 B | 10.8 ± 0.19 A | 78.4 ± 3.91 B | 2.15 ± 0.21 B | 1.12 ± 0.01 B | 3.69 ± 0.17 A | 75.2 ± 4.94 A | 60.6 ± 2.29 B | 5.33 ± 0.43 B | 74.4 ± 1.19 A |
| SE | 24.7 ± 0.41 B | 10.1 ± 0.05 A | 107 ± 2.91 A | 1.64 ± 0.04 B | 1.37 ± 0.05 AB | 3.64 ± 0.12 A | 86.8 ± 0.15 A | 101 ± 2.72 A | 7.86 ± 0.19 A | 71.9 ± 3.37 A |
| PGA | 27.2 ± 0.74 B | 9.7 ± 0.40 A | 81.4 ± 1.65 B | 2.25 ± 0.01 B | 1.19 ± 0.02 B | 2.58 ± 0.31 B | 54.1 ± 2.61 B | 96.0 ± 0.68 A | 6.23 ± 0.28 B | 41.9 ± 2.37 C |
| Red oak-leaf | ||||||||||
| Hs-H | 24.5 ± 0.44 b | 12.6 ± 0.92 ab | 81.7 ± 2.79 c | 3.88 ± 0.43 a | 2.46 ± 0.14 a | 4.22 ± 0.11 a | 58.4 ± 2.93 b | 53.5 ± 0.29 c | 8.55 ± 0.74 a | 68.8 ± 1.68 b |
| Fs-H | 27.9 ± 1.11 b | 12.0 ± 0.41 b | 89.8 ± 0.89 b | 3.76 ± 0.21 a | 1.65 ± 0.06 c | 3.02 ± 0.11 bc | 68.7 ± 1.20 b | 55.2 ± 1.26 c | 6.69 ± 0.84 b | 70.9 ± 4.00 b |
| FA | 39.5 ± 1.14 a | 12.4 ± 0.52 ab | 84.5 ± 4.27 b | 1.96 ± 0.06 b | 1.57 ± 0.11 c | 3.33 ± 0.26 b | 67.0 ± 2.60 b | 55.0 ± 5.35 c | 4.21 ±0.10 c | 86.3 ± 5.89 a |
| SE | 40.3 ± 0.49 a | 13.6 ± 0.21 a | 118 ± 1.94 a | 2.09 ± 0.00 b | 2.14 ± 0.06 b | 3.53 ± 0.09 b | 96.4 ± 1.00 a | 95.6 ± 1.55 a | 5.30 ± 0.36 bc | 71.1 ± 3.09 b |
| PGA | 25.9 ± 1.72 b | 10.8 ± 0.33 b | 82.0 ± 2.29 b | 2.42 ± 0.13 b | 1.69 ± 0.10 c | 2.60 ± 0.27 c | 36.7 ± 3.47 c | 85.3 ± 1.06 b | 4.57 ± 0.48 c | 35.3 ± 3.69 c |
| Treatment | N (mg plant−1) | P (mg plant−1) | K (mg plant−1) | S (mg plant−1) | Ca (mg plant−1) | Mg (mg plant−1) | Fe (μg plant−1) | Mn (μg plant−1) | Cu (μg plant−1) | Zn (μg plant−1) |
|---|---|---|---|---|---|---|---|---|---|---|
| Butterhead | ||||||||||
| Hs-H | 107 ± 15.8 A | 31.9 ± 4.20 B | 255 ± 25.2 B | 7.89 ± 0.92 B | 4.99 ± 0.59 A | 11.5 ± 1.36 B | 265 ± 43.0 B | 157 ± 17.4 C | 24.0 ± 2.22 B | 174 ± 12.6 B |
| Fs-H | 116 ± 7.10 A | 36.7 ± 2.76 AB | 293 ± 27.2 B | 11.3 ± 1.37 A | 4.15 ± 0.23 A | 11.7 ± 0.71 B | 298 ± 27.2 B | 236 ± 17.2 BC | 26.2 ± 3.30 B | 187 ± 16.0 B |
| FA | 120 ± 3.76 A | 47.9 ± 4.39 AB | 348 ± 26.9 B | 9.53 ± 1.06 AB | 4.97 ± 0.50 A | 16.4 ± 1.43 AB | 336 ± 47.3 AB | 271 ± 38.9 B | 24.0 ± 4.48 B | 332 ± 36.2 A |
| SE | 128 ± 10.9 A | 52.4 ± 3.56 A | 554 ± 50.2 A | 8.54 ± 0.78 AB | 7.11 ± 0.60 A | 18.9 ± 1.50 A | 451 ± 32.4 A | 525 ± 25.9 A | 40.8 ± 3.26 A | 375 ± 42.2 A |
| PGA | 119 ± 6.28 A | 42.3 ± 4.36 AB | 356 ± 29.2 B | 9.84 ± 0.61 AB | 5.21 ± 0.40 A | 11.4 ± 2.05 B | 236 ± 7.36 B | 420 ± 28.6 A | 27.3 ± 2.98 B | 184 ± 22.1 B |
| Hs-H | 81.7 ± 10.7 c | 42.3 ± 7.26 b | 273 ± 39.2 b | 13.1 ± 2.89 b | 8.27 ± 1.47 ab | 14.1 ± 1.62 ab | 195 ± 28.7 b | 179 ± 22.6 c | 28.5 ± 4.57 ab | 230 ± 31.6 bc |
| Fs-H | 139 ± 12.4 b | 59.8±7.18 ab | 450±51.7 a | 18.9±2.78 a | 8.32±1.32 ab | 15.2±2.28 ab | 344±39.2 a | 277±40.1 bc | 33.2±4.04 a | 353±24.9 b |
| FA | 22 6± 18.9 a | 71.1 ± 6.18 a | 485 ± 51.6 a | 11.2 ± 0.80 b | 9.02 ± 1.13 ab | 19.2 ± 2.53 a | 384 ± 29.6 a | 315 ± 18.7 b | 24.1 ± 1.70 ab | 496 ± 61.9 a |
| SE | 186 ± 22.8 a | 63.0 ± 7.81 a | 545 ± 64.2 a | 9.64 ± 1.06 b | 9.87 ± 0.84 a | 16.3 ± 1.52 a | 446 ± 52.9 a | 442 ± 51.4 a | 24.7 ± 4.48 ab | 330 ± 50.8 b |
| PGA | 93.6 ± 2.81 c | 39.2 ± 2.78 b | 297 ± 19.5 b | 8.75 ± 0.59 b | 6.14 ± 0.63 b | 9.44 ± 1.36 b | 133 ± 16.7 b | 309 ± 13.9 b | 16.6 ± 2.27 b | 128 ± 18.2 c |
Publisher’s Note: MDPI stays neutral with regard to jurisdictional claims in published maps and institutional affiliations. |
© 2022 by the authors. Licensee MDPI, Basel, Switzerland. This article is an open access article distributed under the terms and conditions of the Creative Commons Attribution (CC BY) license (https://creativecommons.org/licenses/by/4.0/).
Share and Cite
Wang, Z.; Yang, R.; Liang, Y.; Zhang, S.; Zhang, Z.; Sun, C.; Li, J.; Qi, Z.; Yang, Q. Comparing Efficacy of Different Biostimulants for Hydroponically Grown Lettuce (Lactuca sativa L.). Agronomy 2022, 12, 786. https://doi.org/10.3390/agronomy12040786
Wang Z, Yang R, Liang Y, Zhang S, Zhang Z, Sun C, Li J, Qi Z, Yang Q. Comparing Efficacy of Different Biostimulants for Hydroponically Grown Lettuce (Lactuca sativa L.). Agronomy. 2022; 12(4):786. https://doi.org/10.3390/agronomy12040786
Chicago/Turabian StyleWang, Zheng, Rui Yang, Ying Liang, Shulan Zhang, Zejin Zhang, Chaohua Sun, Jing Li, Zhiyong Qi, and Qichang Yang. 2022. "Comparing Efficacy of Different Biostimulants for Hydroponically Grown Lettuce (Lactuca sativa L.)" Agronomy 12, no. 4: 786. https://doi.org/10.3390/agronomy12040786