Article

Identification and Fine Mapping of a Quantitative Trait Locus Controlling the Total Flower and Pod Numbers in Soybean

1
Key Laboratory of Soybean Molecular Design and Breeding, Northeast Institute of Geography and Agroecology, Chinese Academy of Sciences, Harbin 150081, China
2
Heilongjiang Academy of Agricultural Sciences, Mudanjiang Branch, Mudanjiang 157041, China
*
Author to whom correspondence should be addressed.
Agronomy 2022, 12(4), 790; https://doi.org/10.3390/agronomy12040790
Submission received: 21 February 2022 / Revised: 19 March 2022 / Accepted: 22 March 2022 / Published: 25 March 2022
(This article belongs to the Topic Plant Functional Genomics and Crop Genetic Improvement)

Abstract

:
Total flower and pod numbers (TFPN) and effective pod numbers per plant (PNPP) are among the most important agronomic traits for soybean production. However, the underlying genetic mechanism remains unclear. In this study, we constructed a recombinant inbred line population derived from a cross between JY73 (high TFPN) and TJSLH (low TFPN) to map loci for the two traits. In total, six QTL for TFPN and five QTL for PNPP were identified, among which a QTL on chromosome 4, named qFPN4, explained 9.2% and 9.6% of the phenotypic variation of TFPN and PNPP, respectively. Analysis of residual heterozygous lines for qFPN4 indicated that TFPN or PNPP was controlled by a single dominant gene at this locus and delimited the QTL into a ~2.62 Mb interval which tightly linked to an Indel marker C1-5. This mapping result was further confirmed by bulked segregant analysis (BSA) of the near isogenic lines. The genome-sequencing-based BSA also identified eight candidate genes carrying nonsynonymous SNPs and/or Indels; two genes, Glyma.04G176600 and Glyma.04G178900, were nominated as the most promising genes for qFPN4 based on additional expression and function analysis. These results improve our understanding of the genetic mechanism of TFPN and PNPP and indicate the potential for soybean yield improvement.

1. Introduction

Soybean (Glycine max (L.) Merrill) is an important seed crop containing approximately 40% editable oil and 20% high-quality protein in seeds. The protein contains a complete amino acid profile including eight amino acids essential for human health; a wide range of cultivation and high production make soybean a sustainable crop to secure the increasing need for plant protein based diets worldwide [1]. Therefore, yield has been a major goal for soybean improvement. However, soybean germplasm has a narrow genetic basis [2,3] and the yield increase does not keep pace with the growing need [4]. Better molecular strategies with practical markers/genes are needed to explore soybean full genetic potential [5]. A possible approach to increase yield is through trait dissection by breaking down the yield complex trait into major yield components.
Yield is a very complex trait, and many different components contribute to it such as pod numbers per plant (PNPP), seed numbers per pod, and hundred-grain weight, among which PNPP is an especially important factor in determining soybean yield [6], because it is strongly correlated with grain yield per plant (r = 0.84). For example, among the agronomic traits the number of three-seed pods showed the highest correlation with the yield per plant, suggesting the strong indirect effect on the total number of pods [7]. PNPP is mainly determined by multiple factors such as total flower and pod numbers (TFPN), pods produced per plant, and the abscission rate of flowers and pods. Studies have shown that the total number of flowers or pods or both could greatly enhance soybean yields [8,9]. Therefore, understanding the genetic mechanism of TFPN and PNPP will be helpful to elucidate how these traits genetically contribute to the yield, which is important for the development of high-yield soybean cultivars.
Many studies have mapped quantitative trait loci (QTL) for the related traits of flower or pod numbers with an aim to increase the breeding efficiency for higher yields. In all, five QTL for the number of one-seed pods (NOP), two QTL for the number of two-seed pods (NTP), three QTL for three-seed pods (NThP), six QTL for the number of four-seed pods (NFP), and nineteen QTL for PNPP have been mapped on chromosomes 1–4, 6–7, and 9–20, respectively, reflecting the complex mechanism of soybean yield traits. Previously, two QTL for PNPP were identified using the F7 and F8 RIL population that were derived from the cross between the varieties BARC-8 and Garimpo; the QTL were located on chromosomes 4 and 9 [9]. Another study identified 12 QTL for the number of main stem pods on chromosomes 1, 3, 6, 11, 13, and 16 using a F2:10 RIL population derived from a cross between Charleston and Dongnong 594 [10]. Zhang et al., (2010) detected three major QTL (qfn-Chr18-2, qfn-Chr19, and qfn-Chr20-1) on chromosomes 18, 19, and 20 for flower numbers and two main QTL (qpn-Chr11 and qpn-Chr20) chromosomes 11 and 20 for pod numbers [11]. About 10 QTL were detected on chromosomes 2, 3, 6, 7, 12, 14, 15, 17, and 19 in the F2 progenies of the diverse cross combinations between wild soybean (G. soja) and cultivated soybean (G. max) [12]. A further 12 pod-number-related QTL were identified from a population of introgression lines derived from Charleston and Dongnong 594 [13], including one QTL on chromosome 12 for NOP, one QTL on chromosome 2 for NTP, two QTL on chromosomes 5 and 9 for NThP, six QTL on chromosomes 11, 13, and 15 for NFP, and one QTL on chromosome 11 for PNPP. A similar study using two RIL populations found nine pod-number-related QTL, including four QTL on chromosomes 2, 4, 7, and 20 for NOP, one QTL on chromosome 18 for NTP, one QTL on chromosome 18 for NThP, three QTL on chromosomes 2, 14, and 18 for NFP [6]. Four QTL on chromosomes 4, 7, and 11 were detected in a RIL population of the cross between Zhonghuang 24 and Huaxia 3 in 2 years using the high-density genetic map [14]. To the best of our knowledge, none of these studies have been followed up to report the underlying genes; therefore, the underlying genes and the mechanism are largely unclear. Additionally, little information has been reported for QTL or genes controlling TFPN; therefore, a lack of available information for the molecular genes or markers limited soybean yield improvement from the perspectives of TFPN and PNPP in soybean.
As mentioned above, understanding the genetic mechanism of TFPN and PNPP is important for the development of molecular tools that can facilitate the breeding of high-yield soybean cultivars. Therefore, the objectives of this study are: (1) to detect high confident QTL associated with TFPN or PNPP using linkage mapping, (2) to finely map one major locus and identify the tightly linked molecular markers using the residual heterozygous lines (RHLs) strategy [15], and (3) to propose candidate gene(s) for major QTL. The results increase our understanding of the genetic mechanisms controlling TFPN and PNPP, which would be helpful for soybean yield improvement.

2. Materials and Methods

2.1. Plant Materials and Field Experiments

A segregating population of RILs consisting of 100 individuals was developed from the cross between soybean cultivar JY73 with an average of 232 flowers and pods at the R3 stage (more flowers and pods, MFP) and landrace TJSLH with an average of 154 flowers and pods at the R3 stage (less flowers and pods, LFP) (designated JT population for simplicity). The seeds of F2 or F5 RILs along with the parental lines were sown in the field at the Heilongjiang Academy of Agricultural Sciences, Mudanjiang Branch, Mudanjiang, China (44°60′ N, 129°58′ E), during the growing seasons (May–October) in 2015 and 2018, respectively. The F6 seeds for the RILs were developed by the single seed descent method [15]. The RHLs segregating family for the qFPN4 locus (Family #5) were selected from F6 RILs and planted in the growing season of 2018; the progenies and NILs were planted in rows on 14 May 2019, each line per row. Single seeds for all the hybrids or lines were planted in a 20 cm interval in 5 m rows and spaced 60 cm apart. All trials followed the standard management to control insects and weeds [15].

2.2. Construction of Linkage Map

The linkage map was constructed using Simple Sequence Repeats (SSRs) that were selected from an integrated soybean genetic linkage map [16,17] and insertion and deletion (Indel) markers (Supplementary Table S1) that were preserved from the Key Laboratory of Soybean Molecular Design and Breeding, Northeast Institute of Geography and Agroecology, Chinese Academy of Sciences. The total DNA of the two parental lines and the derived F2 and F6 population were extracted from freeze-dried leaf tissues using the cetyltrimethylammonium bromide (CTAB) method [18]. The PCR procedure and reaction setup followed the methods as described by Yang et al., (2013) [13] and was run on the MyCycler thermal cycler (Bio-Rad, Hercules, CA, USA) in a 20 µL reaction volume. The denatured PCR products were separated on 6% (w/v) denaturing polyacrylamide gel and visualized by ethidium bromide straining (Trigizano and Caetano-Anolles 1998). A genetic map was constructed using Map Manager QTXb20 [19] and JoinMap3 [20].

2.3. QTL Analysis

QTL were identified using multiple QTL model mapping of the MapQTL5 package [21]. The LOD threshold for declaring significant QTL was determined using a permutation test with a significance level of p < 0.05 (n = 1000).

2.4. Fine Mapping

A total of 19 Indel markers (Supplementary Table S2) were developed to identify the RILs carrying critical recombination and the derived NILs for qFPN4 locus. The Indel markers (C1-1–C1-10) were used to determine the genotype of the parental lines and recombinants at the locus.

2.5. Genome Resequencing Analysis

Based on a phenotypic investigation, DNAs from 30 individuals with MFP or LFP were pooled separately to build an MFP bulk and a LFP bulk, respectively. Each bulk was used to construct a library followed by whole genome sequencing on the Illumina HiSeqTM 2500 platform at the Shanghai Personal Biotechnology Co., Ltd., (Shanghai, China). The sequencing depth was approximately 30×.
For quality control, low-quality reads with quality scores <20 were filtered out and the adapters were trimmed. The saved reads were aligned to the Williams 82 reference genome (Wm82.a2.v1) using the Burrows–Wheeler Aligner [22]. The SAMtools [23] was used to mark duplicates and the GATK [24] was used for local realignment and base recalibration. An SNP was determined by the identification with both GATK and SAMtools via SNP calling using default parameters. The SNPs identified between the two BSA pools were used for association analysis using the Euclidean distance (ED) method [25]; in theory, the higher the ED value the closer to the QTL site [26]. The associated threshold value was determined based on ED + 3SD (standard deviation) [25]. The Indel-associated regions were obtained in a similar method as SNP-associated regions.

2.6. Identification of the Candidate Gene for qFPN4

The genes within the QTL interval were determined using the Phytozome 13.0 database (https://phytozome-next.jgi.doe.gov/info/Gmax_Wm82_a2_v1, accessed on 1 June 2020) and used as the source for candidate gene search. Function annotations for all candidate genes were identified using the soybean annotation file retrieved from the Phytozome database using default parameters.

2.7. Phenotype Statistics

Five R1-stage plants per row were surrounded with gauze cloth [27], ensuring that all the flowers and pods per plant were shed in a closed bag. The flowers and pods collected in the cloth were counted at the R3 stage to determine TFPN. PNPP, seed number per plant, and yield per plant were investigated at the R8 stage [10]. TFPN was calculated as the sum of the number of abscised flowers and pods and the number of pods per plant.
Chi-square (χ2) tests were performed to detect segregation distortion. A one-way analysis of variance (ANOVA) was used to identify significant marker–phenotype associations between polymorphic DNA markers and the investigated phenotypes.

3. Results

3.1. Phenotypic Identification of the Mapping Population

The parental lines TJSLH and JY73 exhibited significant differences in four traits including TFPN, PNPP, seed number per plant, and yield per plant. Briefly, the four phenotypic values were higher for JY73 than TJSLH (Figure 1). Correlation analysis among these traits (Table 1) indicates that TFPN showed the strongest positive correlation with PNPP (r = 0.903, p-value < 0.01), followed by the yield per plant and the seed number per plant (0.833 and 0.807, respectively, p-value < 0.01). Consistently, PNPP showed significant positive correlation with seed number per plant and yield per plant (r = 0.868 and 0.903, respectively, p-value < 0.01). These results showed that both TFPN and PNPP are important components for soybean yield, which may contribute to soybean production.
With one MFP cultivar (JY73) and one LFP landrace (TJSLH) as parental lines, we developed a RIL population consisting of 100 individuals in an effort to locate QTL controlling the flower- and pod-associated traits. The distribution of phenotypic values for the four traits are shown in Figure 1. Within the JT population, TFPN at the R3 and PNPP at the R8 stage varied greatly ranging from 50 to 300 and from 10 to 160, respectively. All the phenotypic values showed a wide range of distribution, suggesting that all the four traits are quantitatively controlled by multiple genes. Moreover, strong transgressive segregations for all four traits were observed in the population, suggesting that alleles with positive effects on the measured traits are distributed among the parents.

3.2. Multiple QTL Control TFPN and PNPP

A genetic linkage map consisted of 151 markers (138 SSRs, 13 Indels) was constructed and it covered all 20 chromosomes with a coverage length of 1351.5 cm and an average distance of 11.5 cm in the F2 TJ RILs. Based on 1000 permutations, a LOD score of 2.0 [28] was used as the threshold to determine QTL controlling TFPN and PNPP.
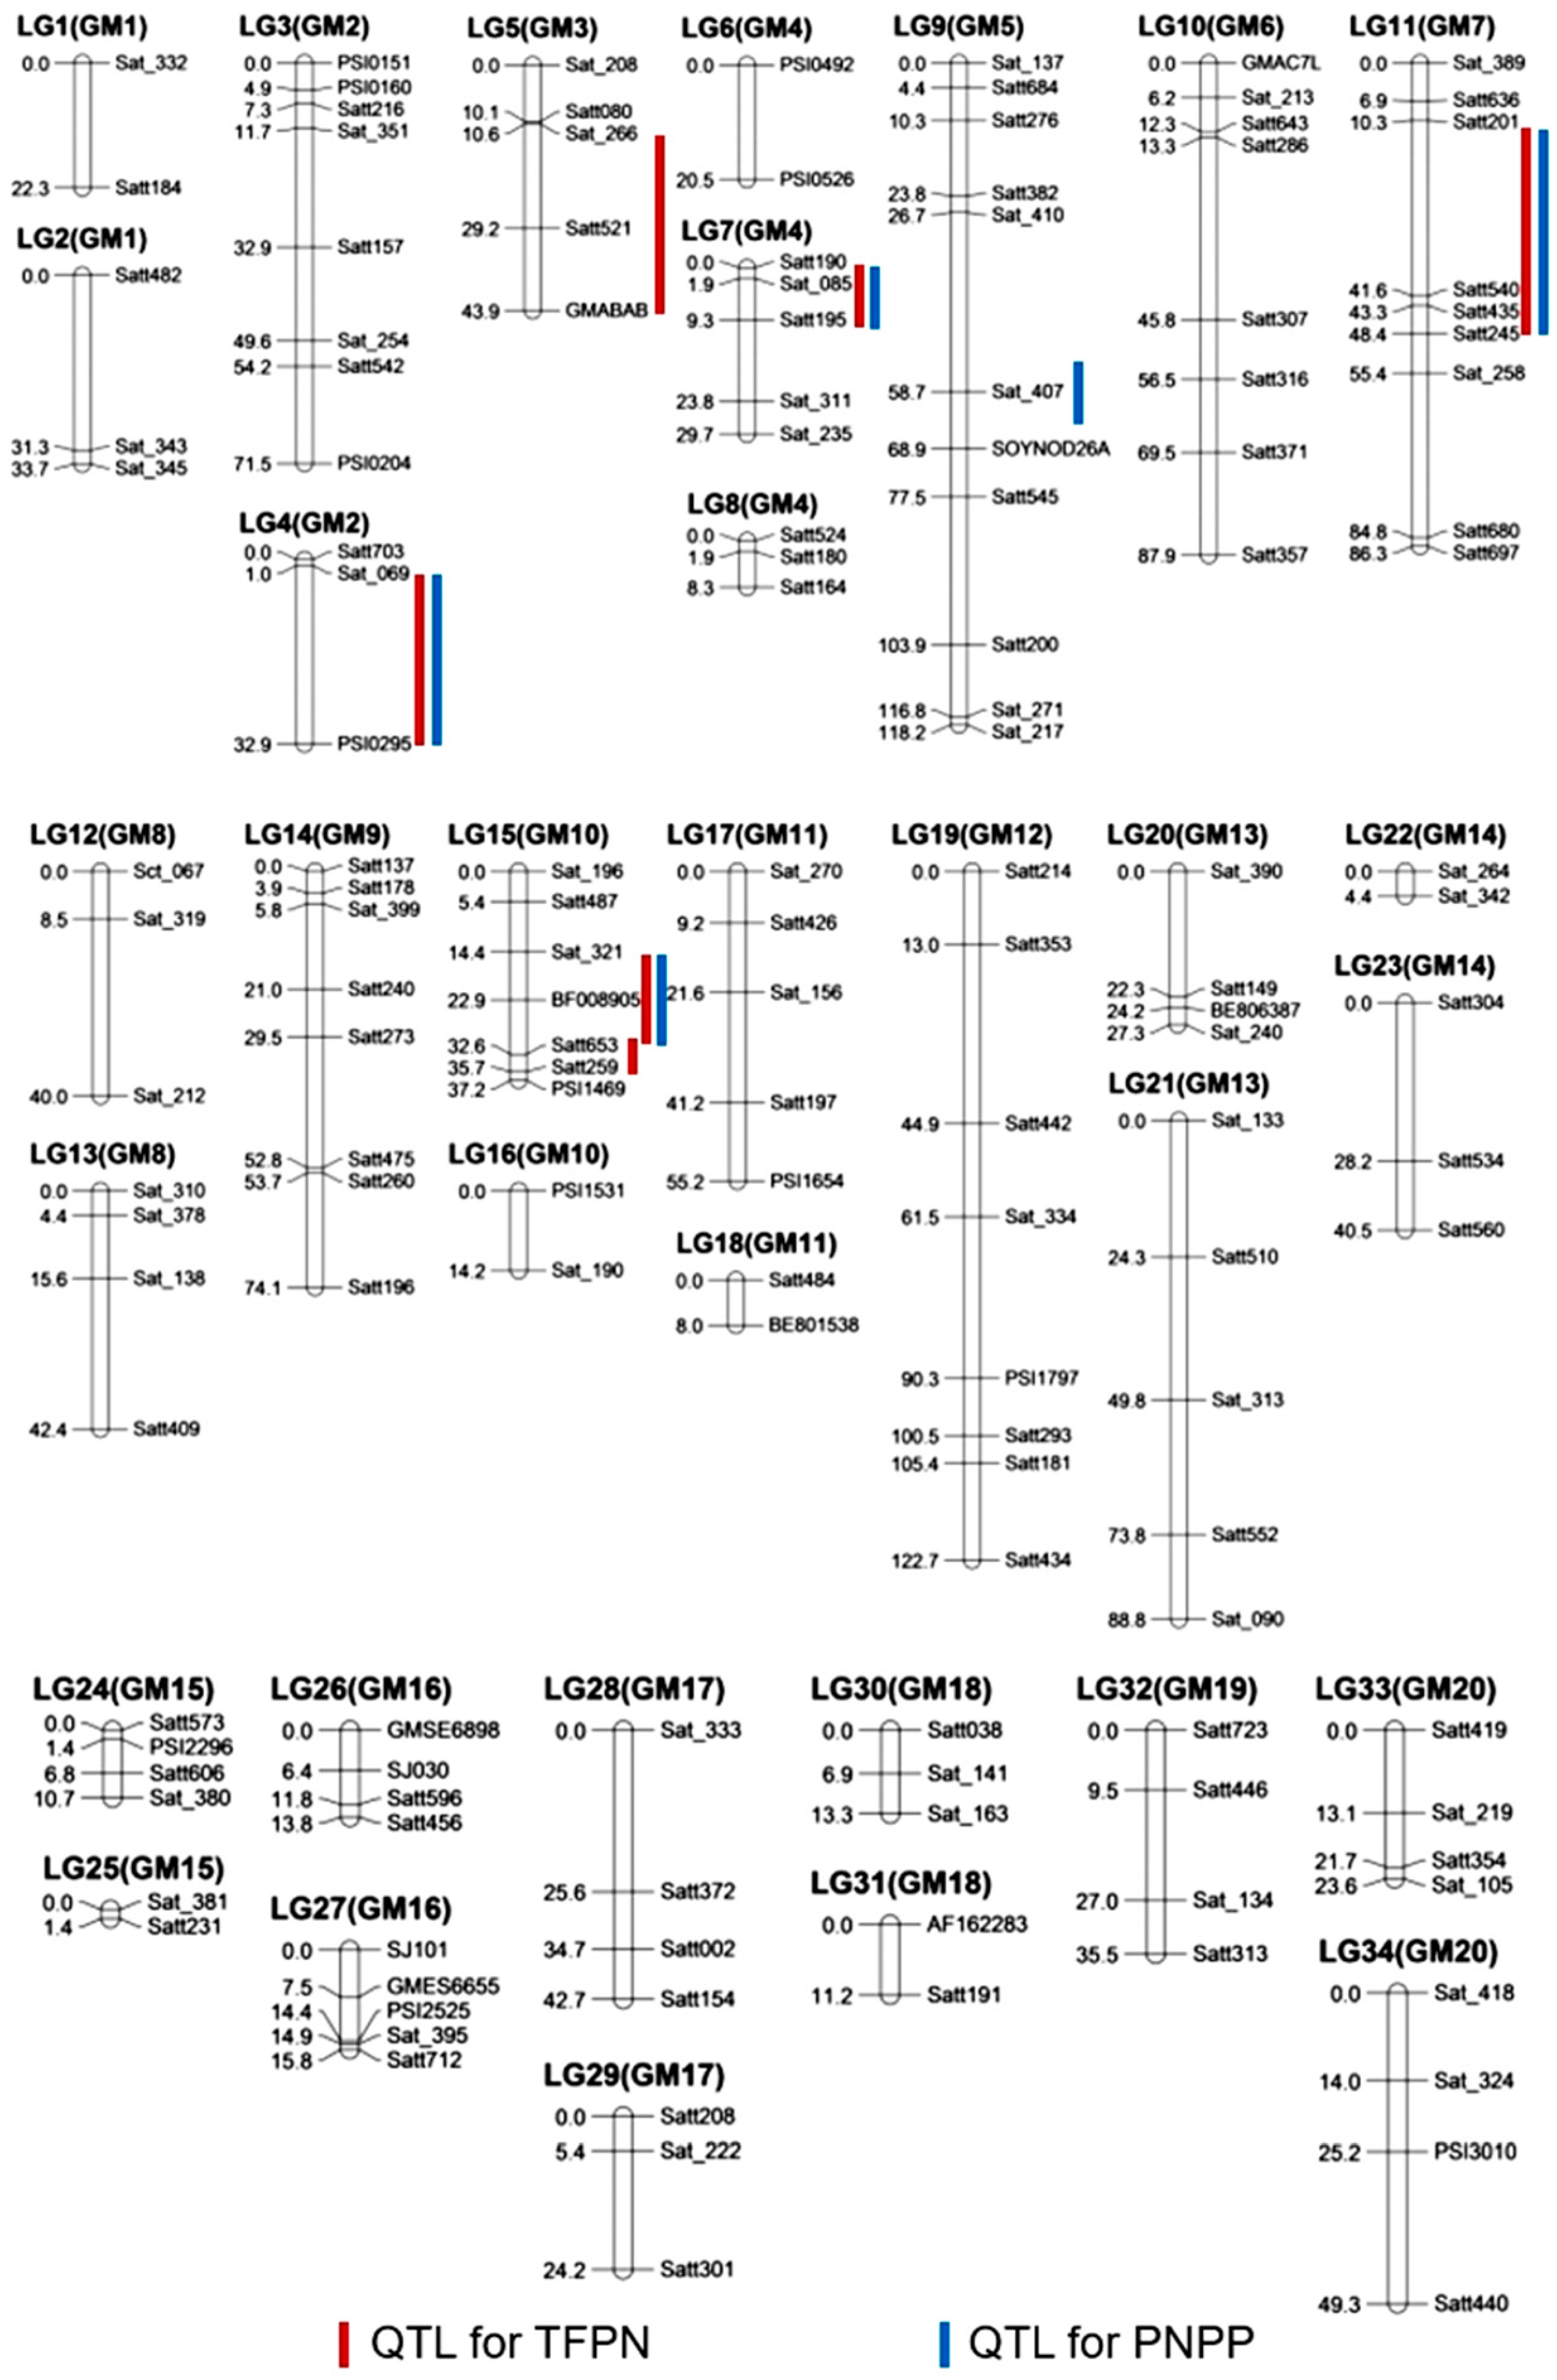
Using this genetic map and flower/pod number-related phenotypes in the JT population, a total of six QTL controlling TFPN were identified on chromosomes 2, 3, 4, 7, and 10, designated qFPN2, qFPN3, qFPN4, qFPN7, qFPN10-1, and qFPN10-2; five QTL for PNPP were detected on chromosomes 2, 4, 5, 7, and 10, named qPN2, qPN4, qPN5, qPN7, and qPN10 (Table 2, Figure 2). Among the QTL, qPN2, qPN7, and qPN10 were also identified in Kuroda et al., (2013) [12] and Ning et al., (2018) [6]. qPN5 was detected in Yang et al., (2013) [13], which was supportive of the results. Interestingly, qPN4 was evaluated in the interval of Satt190–Satt195, coinciding with the QTL on chromosome 4 detected by Vieira et al., (2006) [9], Liu et al., (2017) [14], and Ning et al., (2018) [6]. Identification of the QTL in multiple studies with different populations or environment conditions confirmed the robust expression of qPN4 and its important role for PNPP.
Furthermore, qPN4 explained 9.6% of the phenotypic variation of PNPP with an additive effect of 13.89; it also controlled TFPN and was designated qFPN4 that accounted for 9.2% of the observed variation of TFPN with an additive effect of 16.81 (Table 2). Therefore, the locus qPN4/qFPN4 controlled two highly correlated traits: PNPP and TFPN. To our best knowledge, no known genes in this interval controlling flower and pod related traits has been previously reported in soybean; therefore, qFPN4 is a novel locus for TFPN and we continued to study this locus.

3.3. Fine Mapping of qFPN4

To confirm qFPN4, 11 Indel markers polymorphic between the two parents were developed and used to screen the derived F6 RILs (Supplementary Table S2). As shown in Supplementary Table S3, the highest LOD score (4.64) for TFPN was detected near C1-7 (Chr.4: 44,383,419 bp), and the highest LOD score (5.05) for PNPP was detected near C1-5 (Chr.4: 44,330,411 bp). C1-7 and C1-5 accounted for 13.1% and 14.2% of the total phenotypic variance in the TFPN and PNPP, respectively. These results indicated that qFPN4 was likely located close to C1-7 and C1-5. The additive effects for the TJ allele for TFPN and PNPP was 16.2 and 17.0, respectively. Based on the two Indel markers and the nearby markers (ID41040 (Chr.4: 30,260,000 bp), C1-1 (Chr.4: 35,948,983 bp), C1-3 (Chr.4: 41,559,265 bp), C1-8 (Chr.4: 44,458,681 bp) and C1-10 (Chr.4: 45,438,062 bp)), one RHL family #5 heterozygous for qFPN4 was identified. The family #5 that produced 110 individuals that showed segregation for both TFPN and PNPP were used for fine mapping of qFPN4. Specifically, the progeny exhibited a bimodal distribution for both TFPN and PNPP and the population was clearly divided into two groups: a group with more TFPN and PNPP (n = 81) and a group of low TFPN and PNPP (n = 29). The observed frequency fits a monogenic 3:1 ratio (χ2 = 0.70, p = 0.98) (Supplementary Figure S1). These results confirmed the role of qFPN4 for both TFPN and PNPP and further indicated that a single gene in qFPN4 controls both traits.
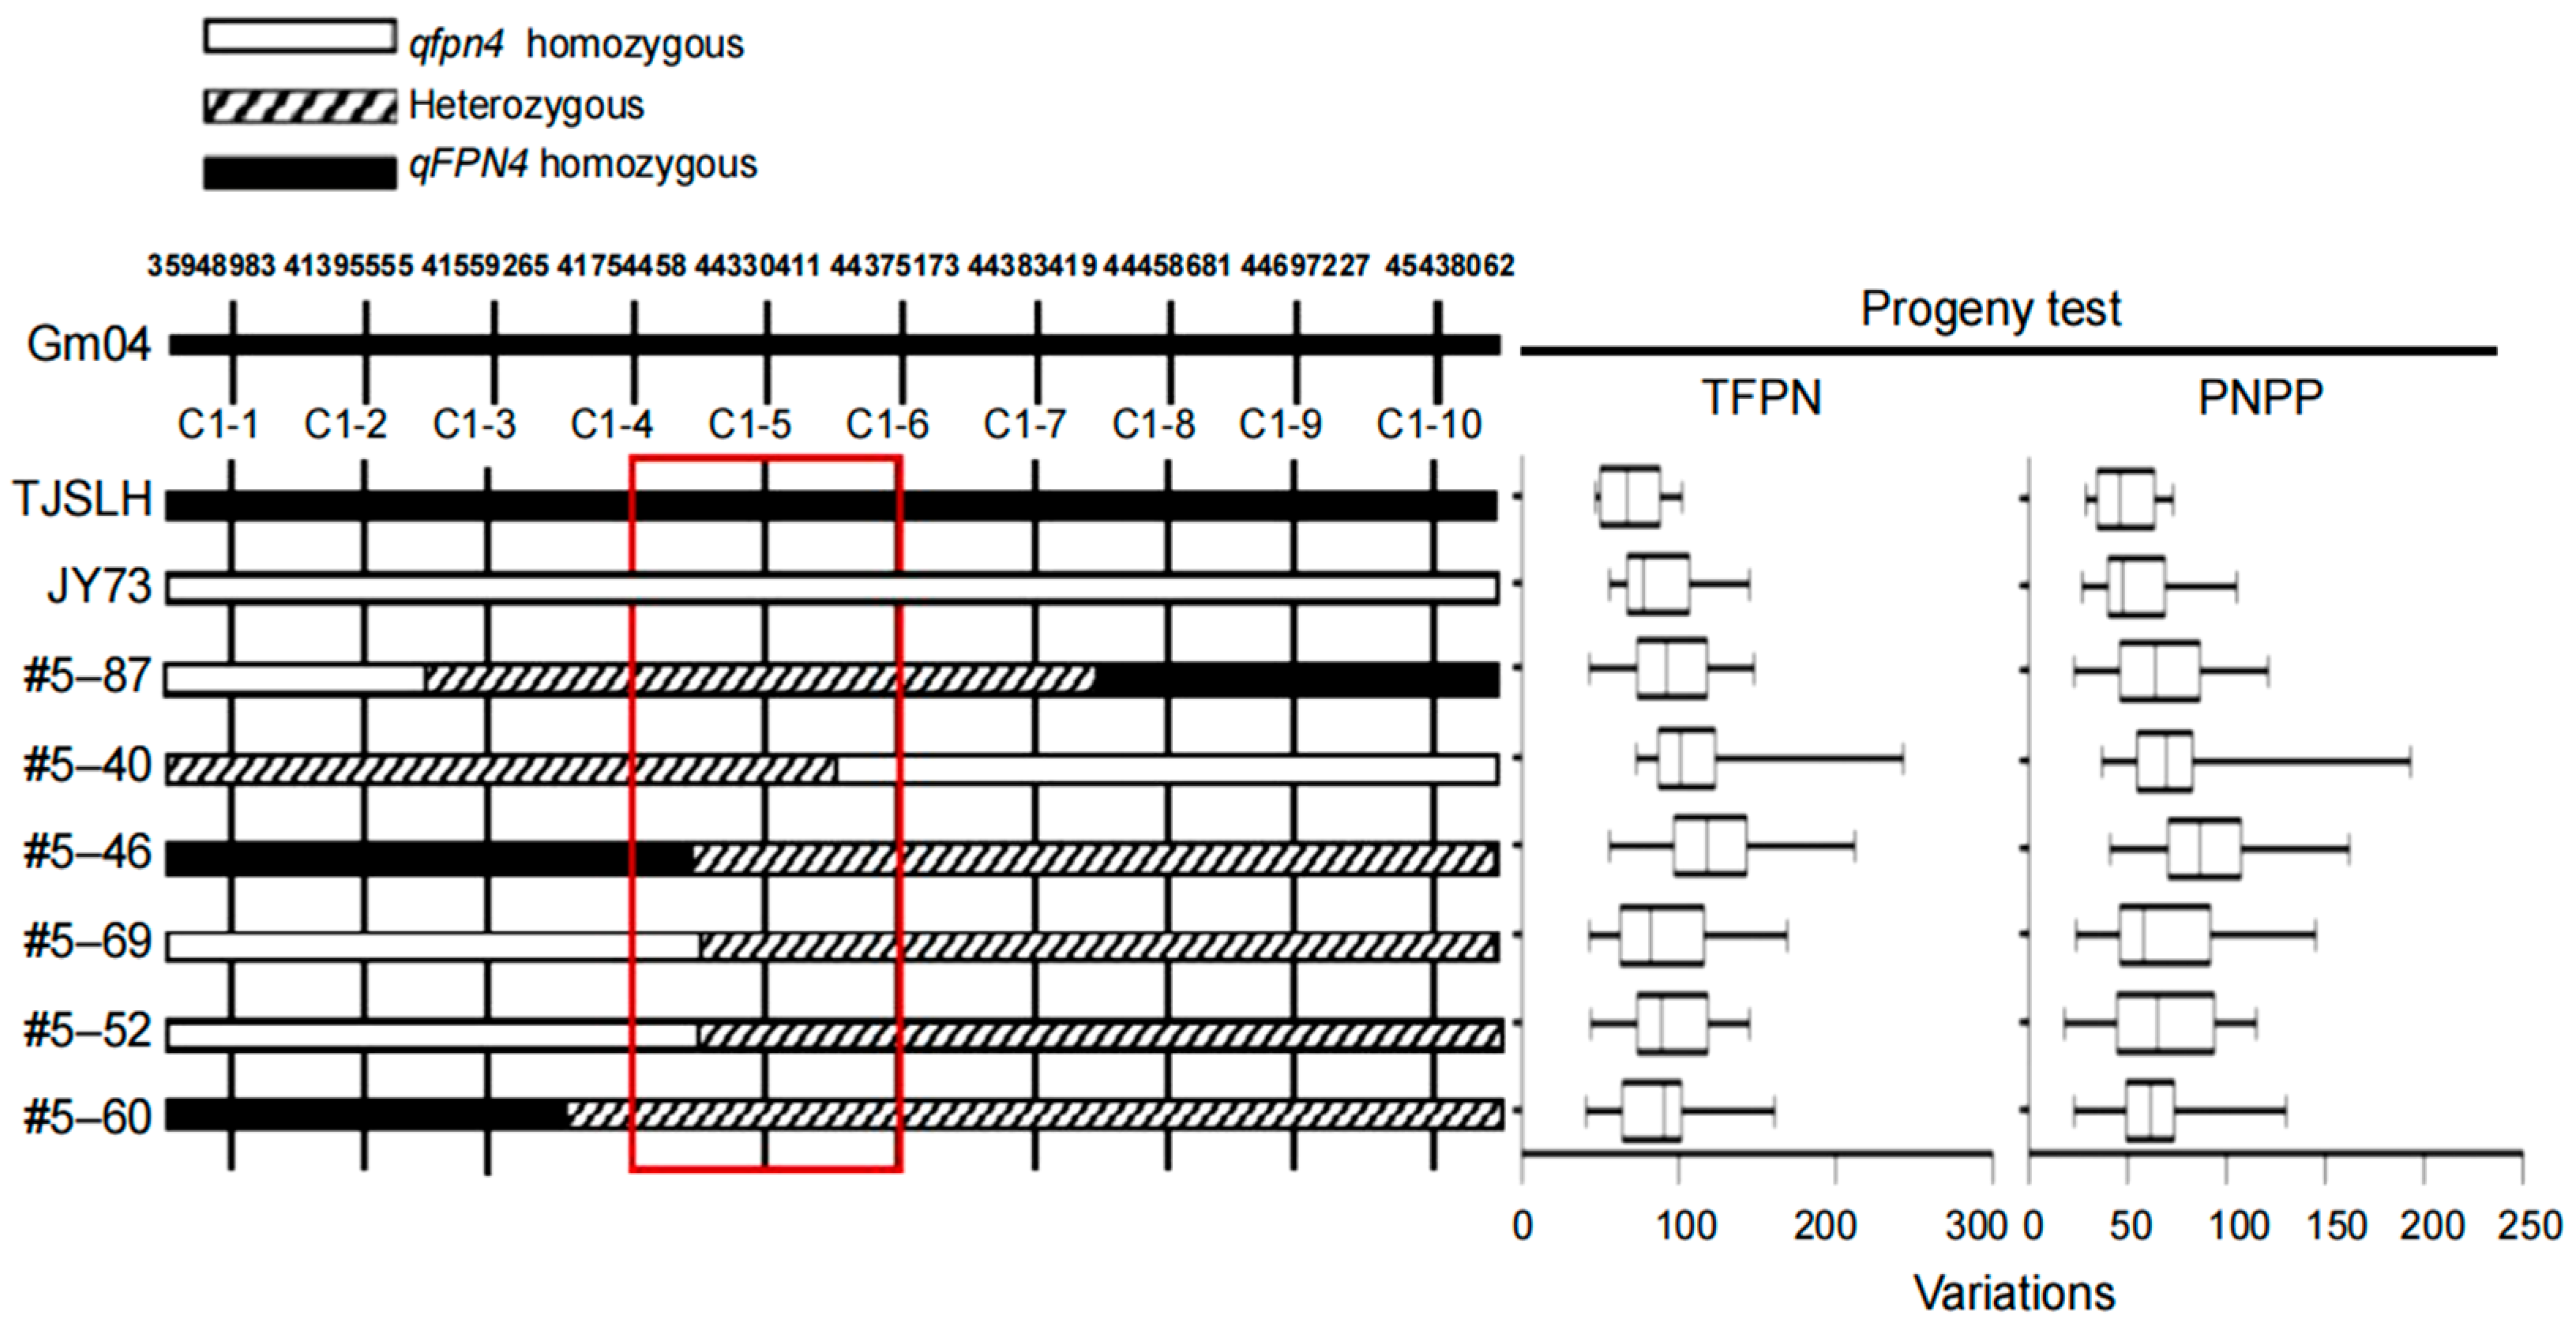
In total, six recombinants that carried critical recombination within the QTL interval of qFPN4 were identified (#5–87, #5–40, #5–46, #5–69, #5–52, and #5–60). Combined analysis with the segregation patterns of the markers in the recombinants and the correlation with the TFPN and PNPP values and qFPN4 was delimited to a genomic interval of ~2.62 Mb between markers C1-4 (Chr.4: 41,754,458 bp) and C1-6 (Chr.4: 44,375,173 bp) (Figure 3). Among the markers, the marker C1-5 (Chr.4: 44,330,411 bp) co-segregated with TFPN and PNPP, representing the most tightly linked molecular marker for TFPN and PNPP. Overall, these results confirmed the physical region of qFPN4 in a ~2.62-Mb genomic region (Chr.4: 41,754,458–44,375,173 bp) on chromosome 4.

3.4. qFPN4 Controls Low Number of Flowers and Pods

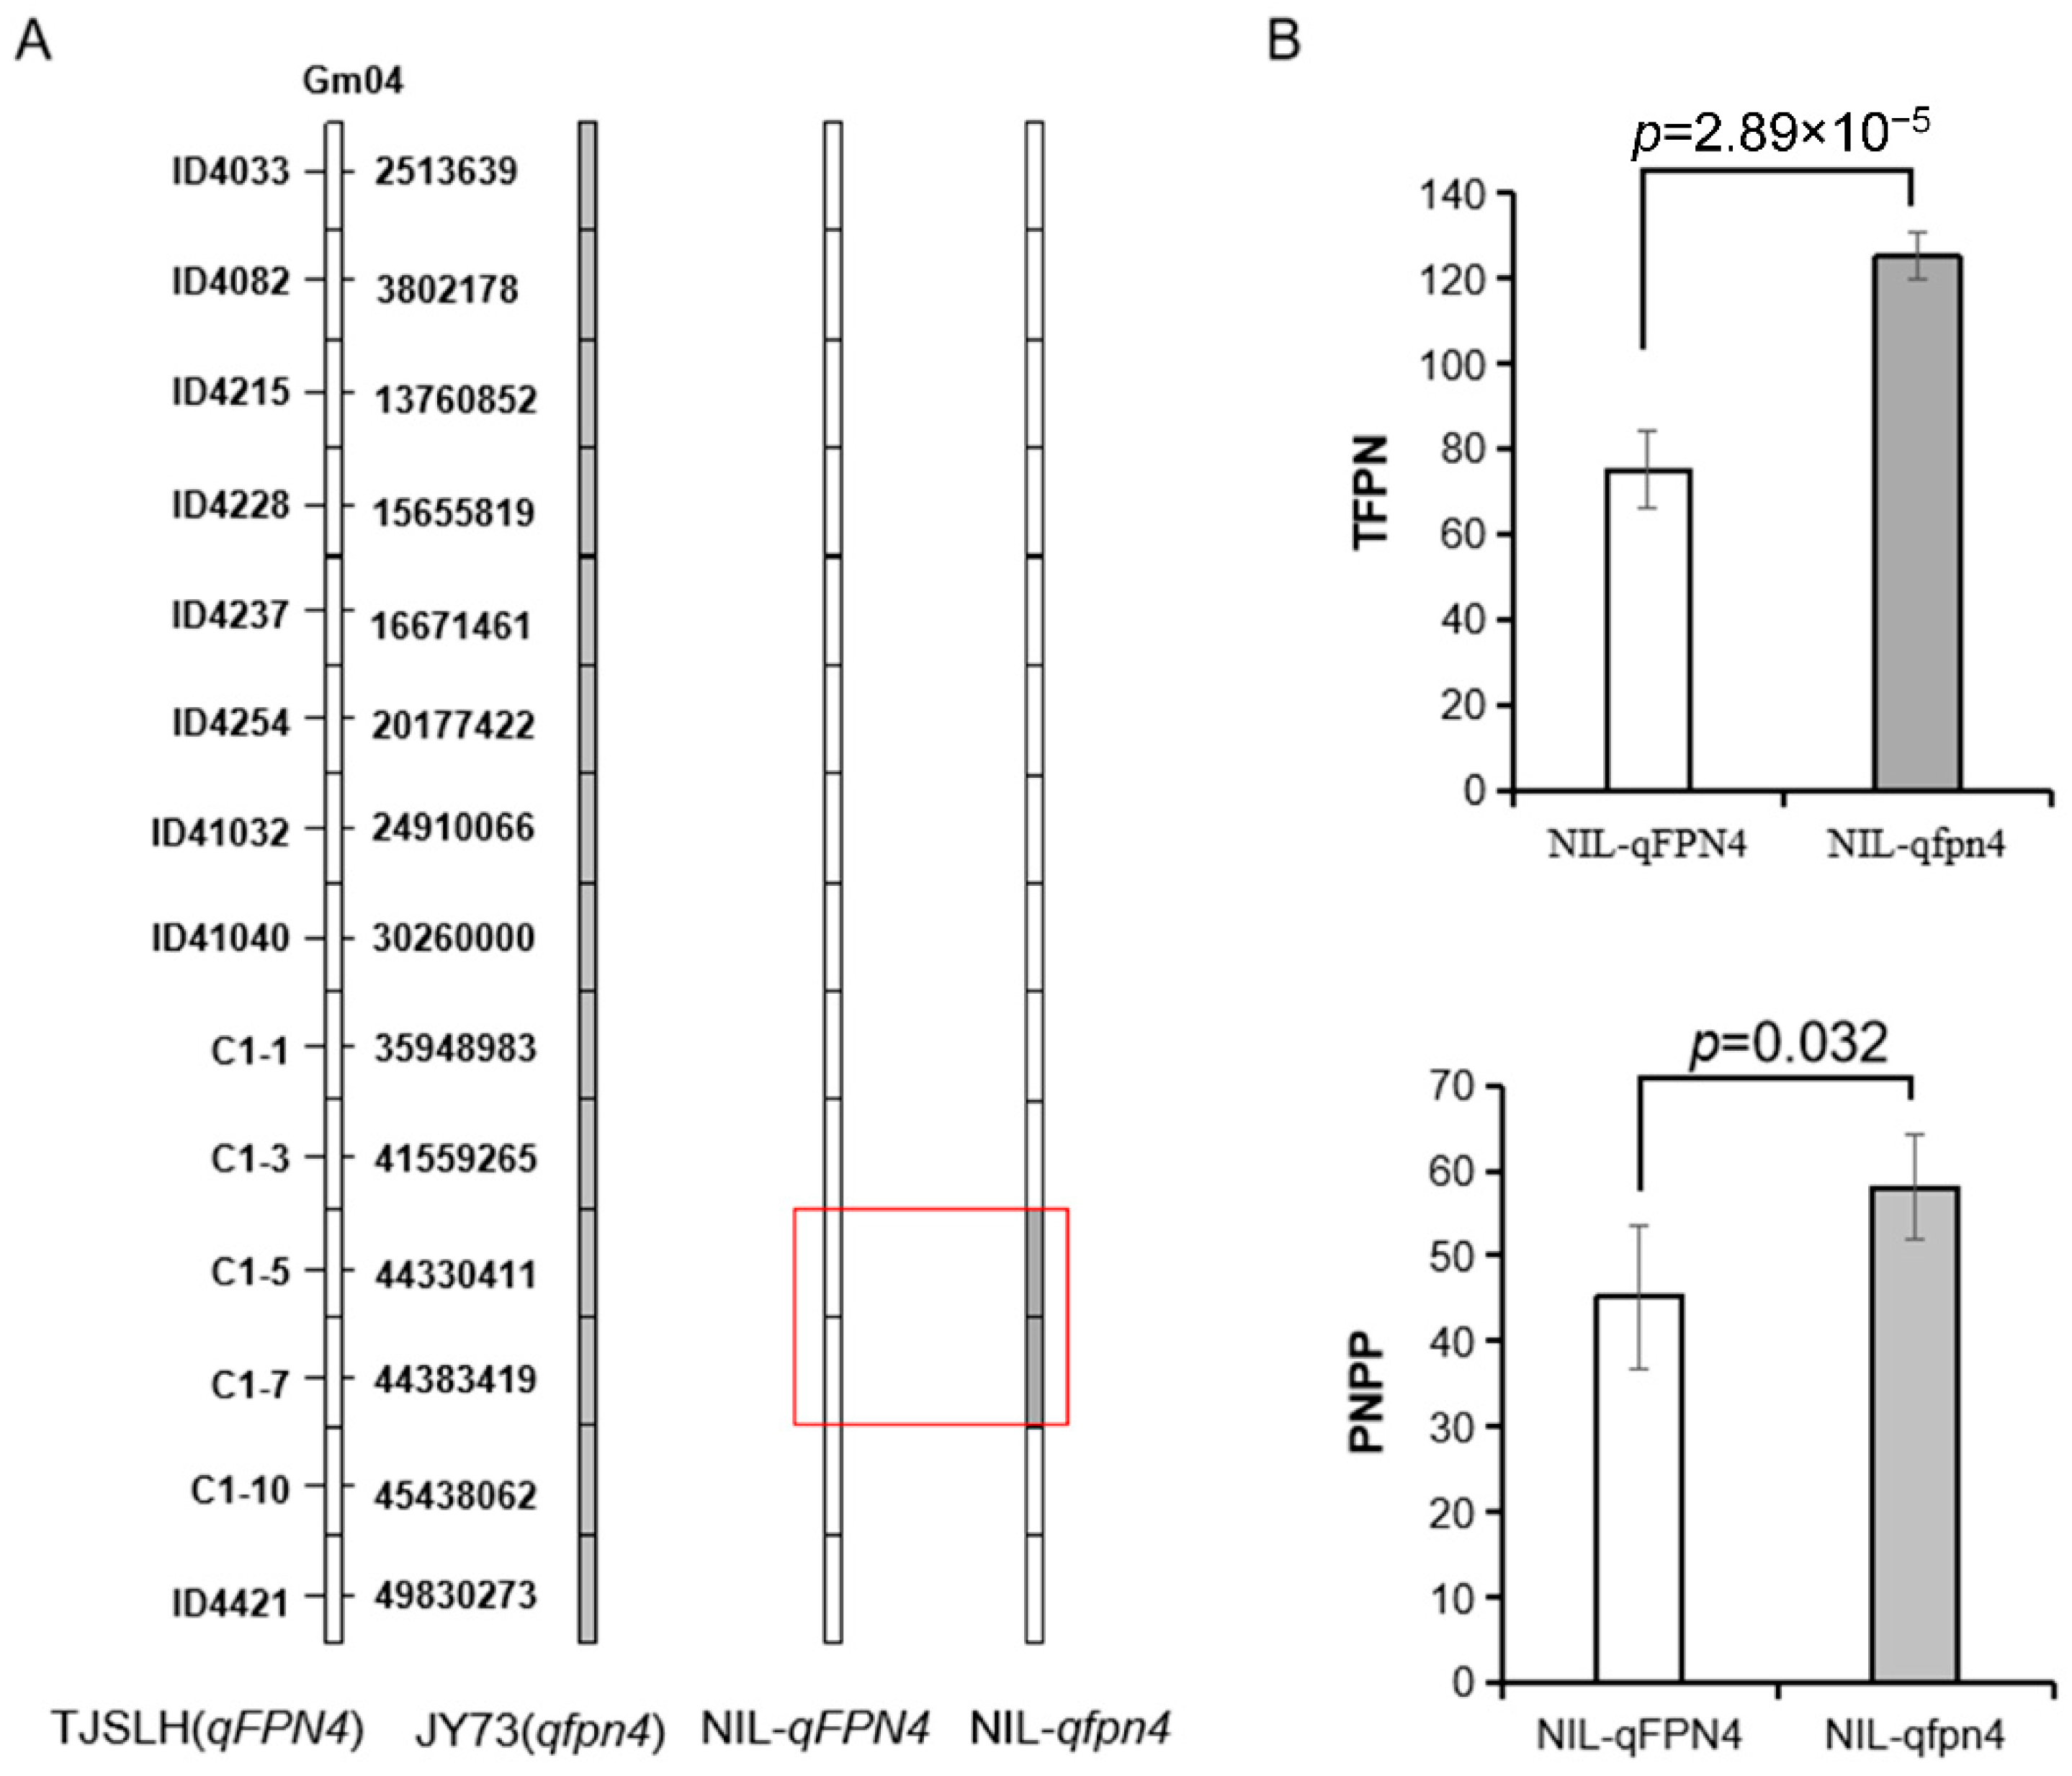
To further confirm the association between the genotype at qFPN4 and TFPN or PNPP, we identified a set of near-isogenic lines (NILs) from the homozygous progenies of RHL family #5 carrying the TJSLH allele (NIL-qFPN4) or the JY73 allele (NIL-qfpn4). As shown in Figure 4, field investigation indicated that TFPN and PNPP for NILs-qFPN4 individuals were on average 50 and 13 lower (p < 0.05) than NILs-qfpn4 individuals, respectively. This analysis confirmed that qFPN4 plays an important role in the regulation of TFPN and PNPP; of the two alleles, qFPN4 allele controls low TFPN and PNPP, whereas qfpn4 is responsible for high TFPN and PNPP.

3.5. Genome Sequencing Based BSA Analysis Confirmed qFPN4

To identify candidate genes for qFPN4, the progeny of NILs exhibiting extreme phenotypes for the NIL-qFPN4 and NIL-qfpn4 were used for BSA. To do this, DNA from 30 individuals with high TFPN and PNPP was pooled into the MFP bulk. Similarly, DNA from low TFPN and PNPP -individuals was mixed to build LFP bulk. To reveal critical variants at this locus, we applied high throughput whole genome sequencing for the two bulks. The sequencing produced a total of 33.28-Gb raw data with 93.44% of high-quality reads after quality control. Overall, 98.34% (208,615,358) and 98.67% (213,395,128) for MFP and LFP reads were mapped to the reference genome, respectively. The mapped reads covered an average coverage of 95.44% in the reference genome with an average sequencing depth of 26×.
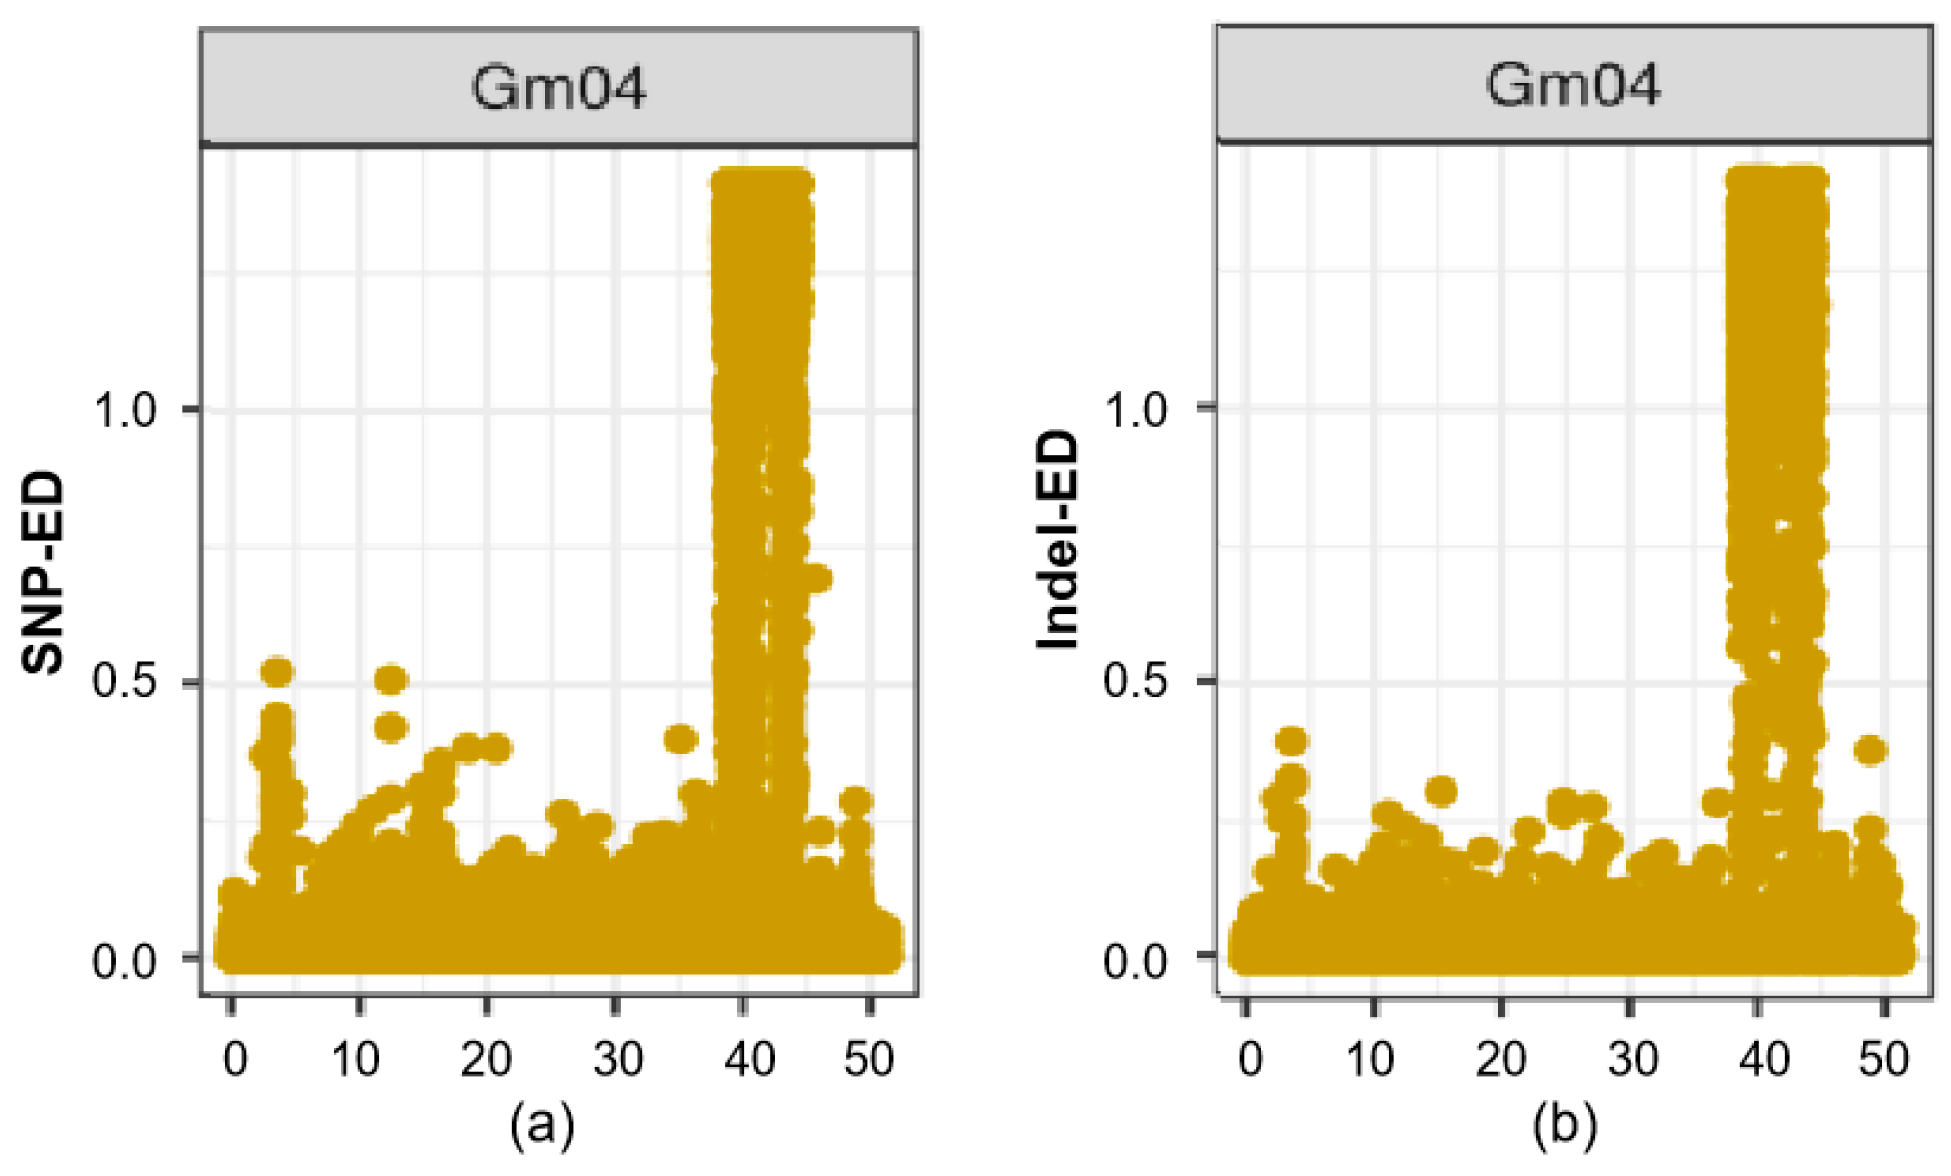
Sequence variation analysis identified a total of 1,697,533 SNPs and 352,416 Indels (size < 15 pb) between the two groups, which were used for association analysis. An ED algorithm [29] was used to determine the significant SNP/Indel trait association region between MFP and LFP. With the association threshold of 1.0, one genomic region with significant signals was identified on Chr.4: 39,889,438–45,442,849 bp, which was coincident with the physical location of qFPN4 (Chr.4: 41,754,458–44,375,173 bp) as determined by RHLs (Figure 5, Supplementary Figure S2). The variation as revealed in this region provides useful variation information to determine candidate genes.

3.6. Promising Genes for qFPN4

The SNP/Indel-based BSA analysis and fine-mapping result (Figure 3 and Figure 5) identified an intersecting region for qFPN4, which covered ~2.62 MB region on Gm04: 41,754,458–44,375,173 bp. According to the Williams 82 genome sequence, this region contained 127 genes, of which eight were identified carrying nonsynonymous-SNP or/and Indel mutations between the two bulks. The eight genes included one gene encoded fucosyltransferase 1 (Glyma.04G166600), one gene for photosynthetic NAD(P)H dehydrogenase subcomplex B4 (Glyma.04G167400), one gene for DDT domain superfamily protein (Glyma.04G176500), one gene for galactosyltransferase family protein (Glyma.04G176600), one gene for formin 8 (Glyma.04G177800), one gene for transducin/WD40 repeat-like superfamily protein (Glyma.04G178800), and two genes with unknown function (Glyma.04G176800 and Glyma.04G178900) (Table 3). Especially, the one-base insertion of Glyma.04G178900 led to the frameshift from the 5th amino in CDS region, resulting in a lack of domain (Supplementary Figure S3). The base mutations in the remaining seven genes caused amino acid replacement or deletion, which did not cause frameshift.
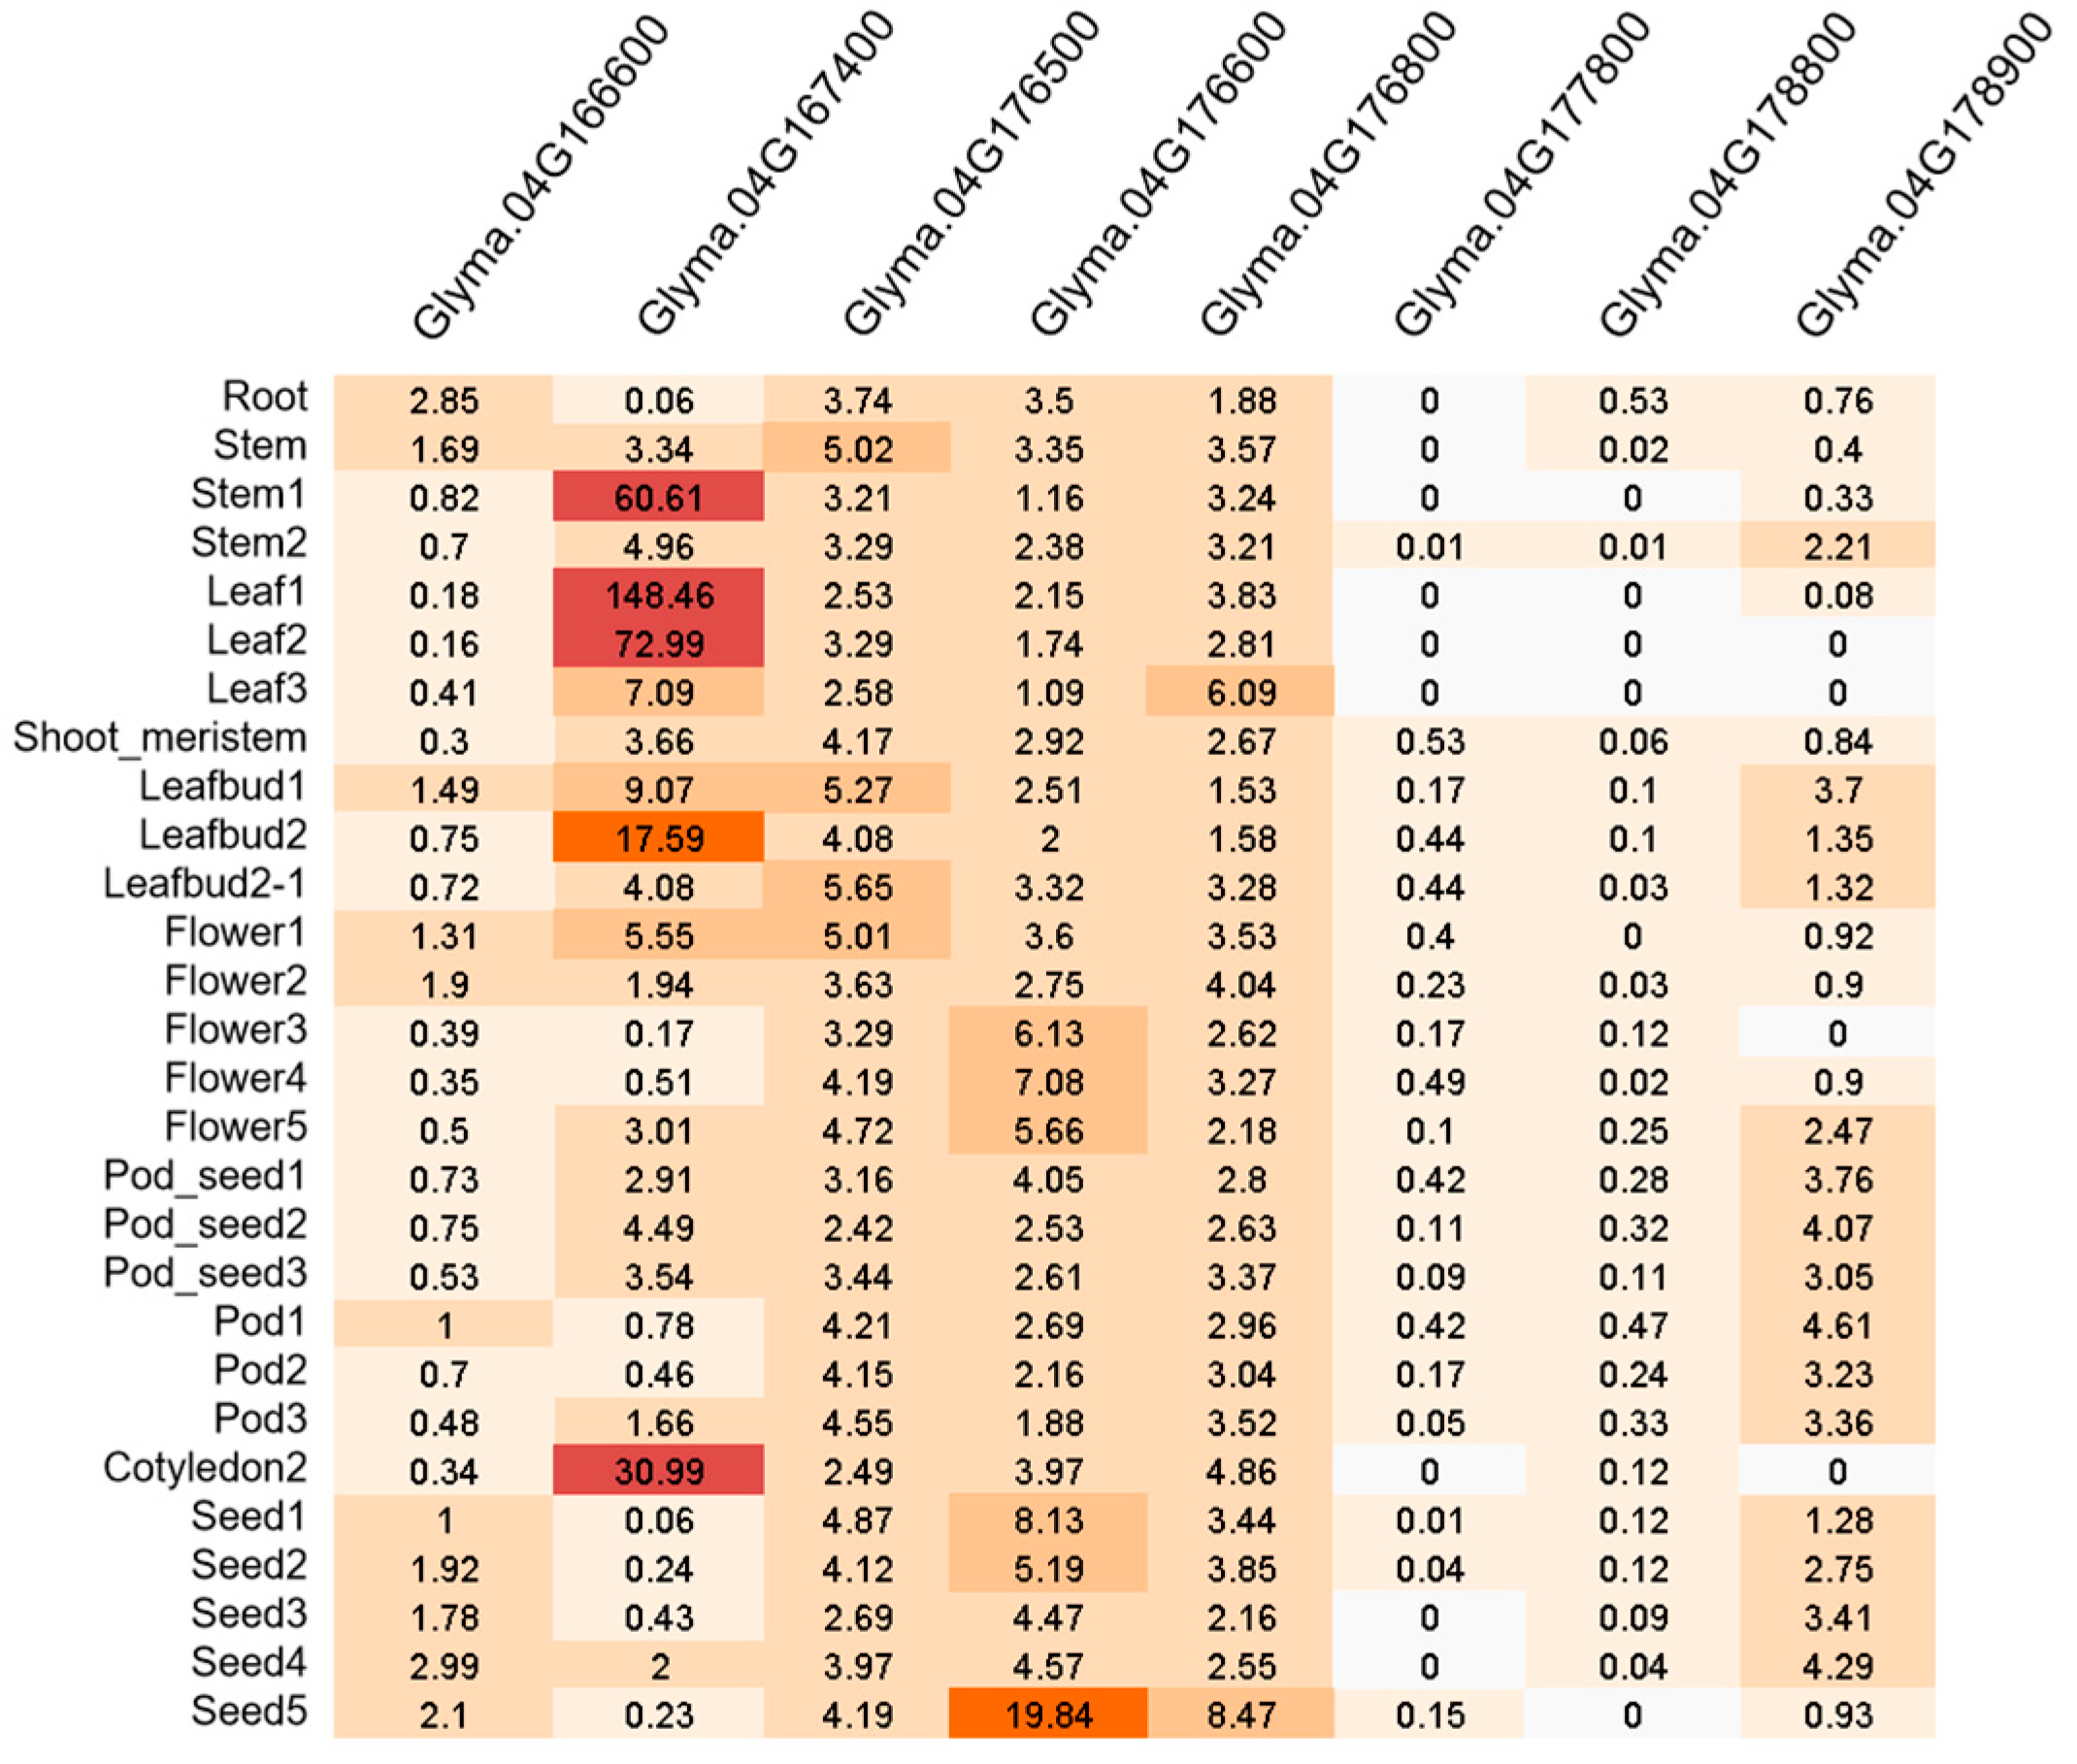
We also examined the expression patterns in different tissues that were collected from the different developmental stages including roots, stems, leaves, buds, developing pods, and seeds [30]. The result showed distinct expression patterns in the tissues. Glyma.04G176400 showed the highest expressions in stems, leaves, and cotyledons compared to the other seven genes, implying the important role for the vegetative growth period. Of the remaining genes, Glyma.04G176600 and Glyma.04G178900 were highly expressed in the florescence stage (Flower5) and early-stage pods (Pod_seed1, Pod_seed2, Pod_seed3, Pod1, Pod2, and Pod3) relative to other tissues (Figure 6), indicating that the two genes were likely the candidates for qFPN4 with roles involved in the regulation of flower and pod development.
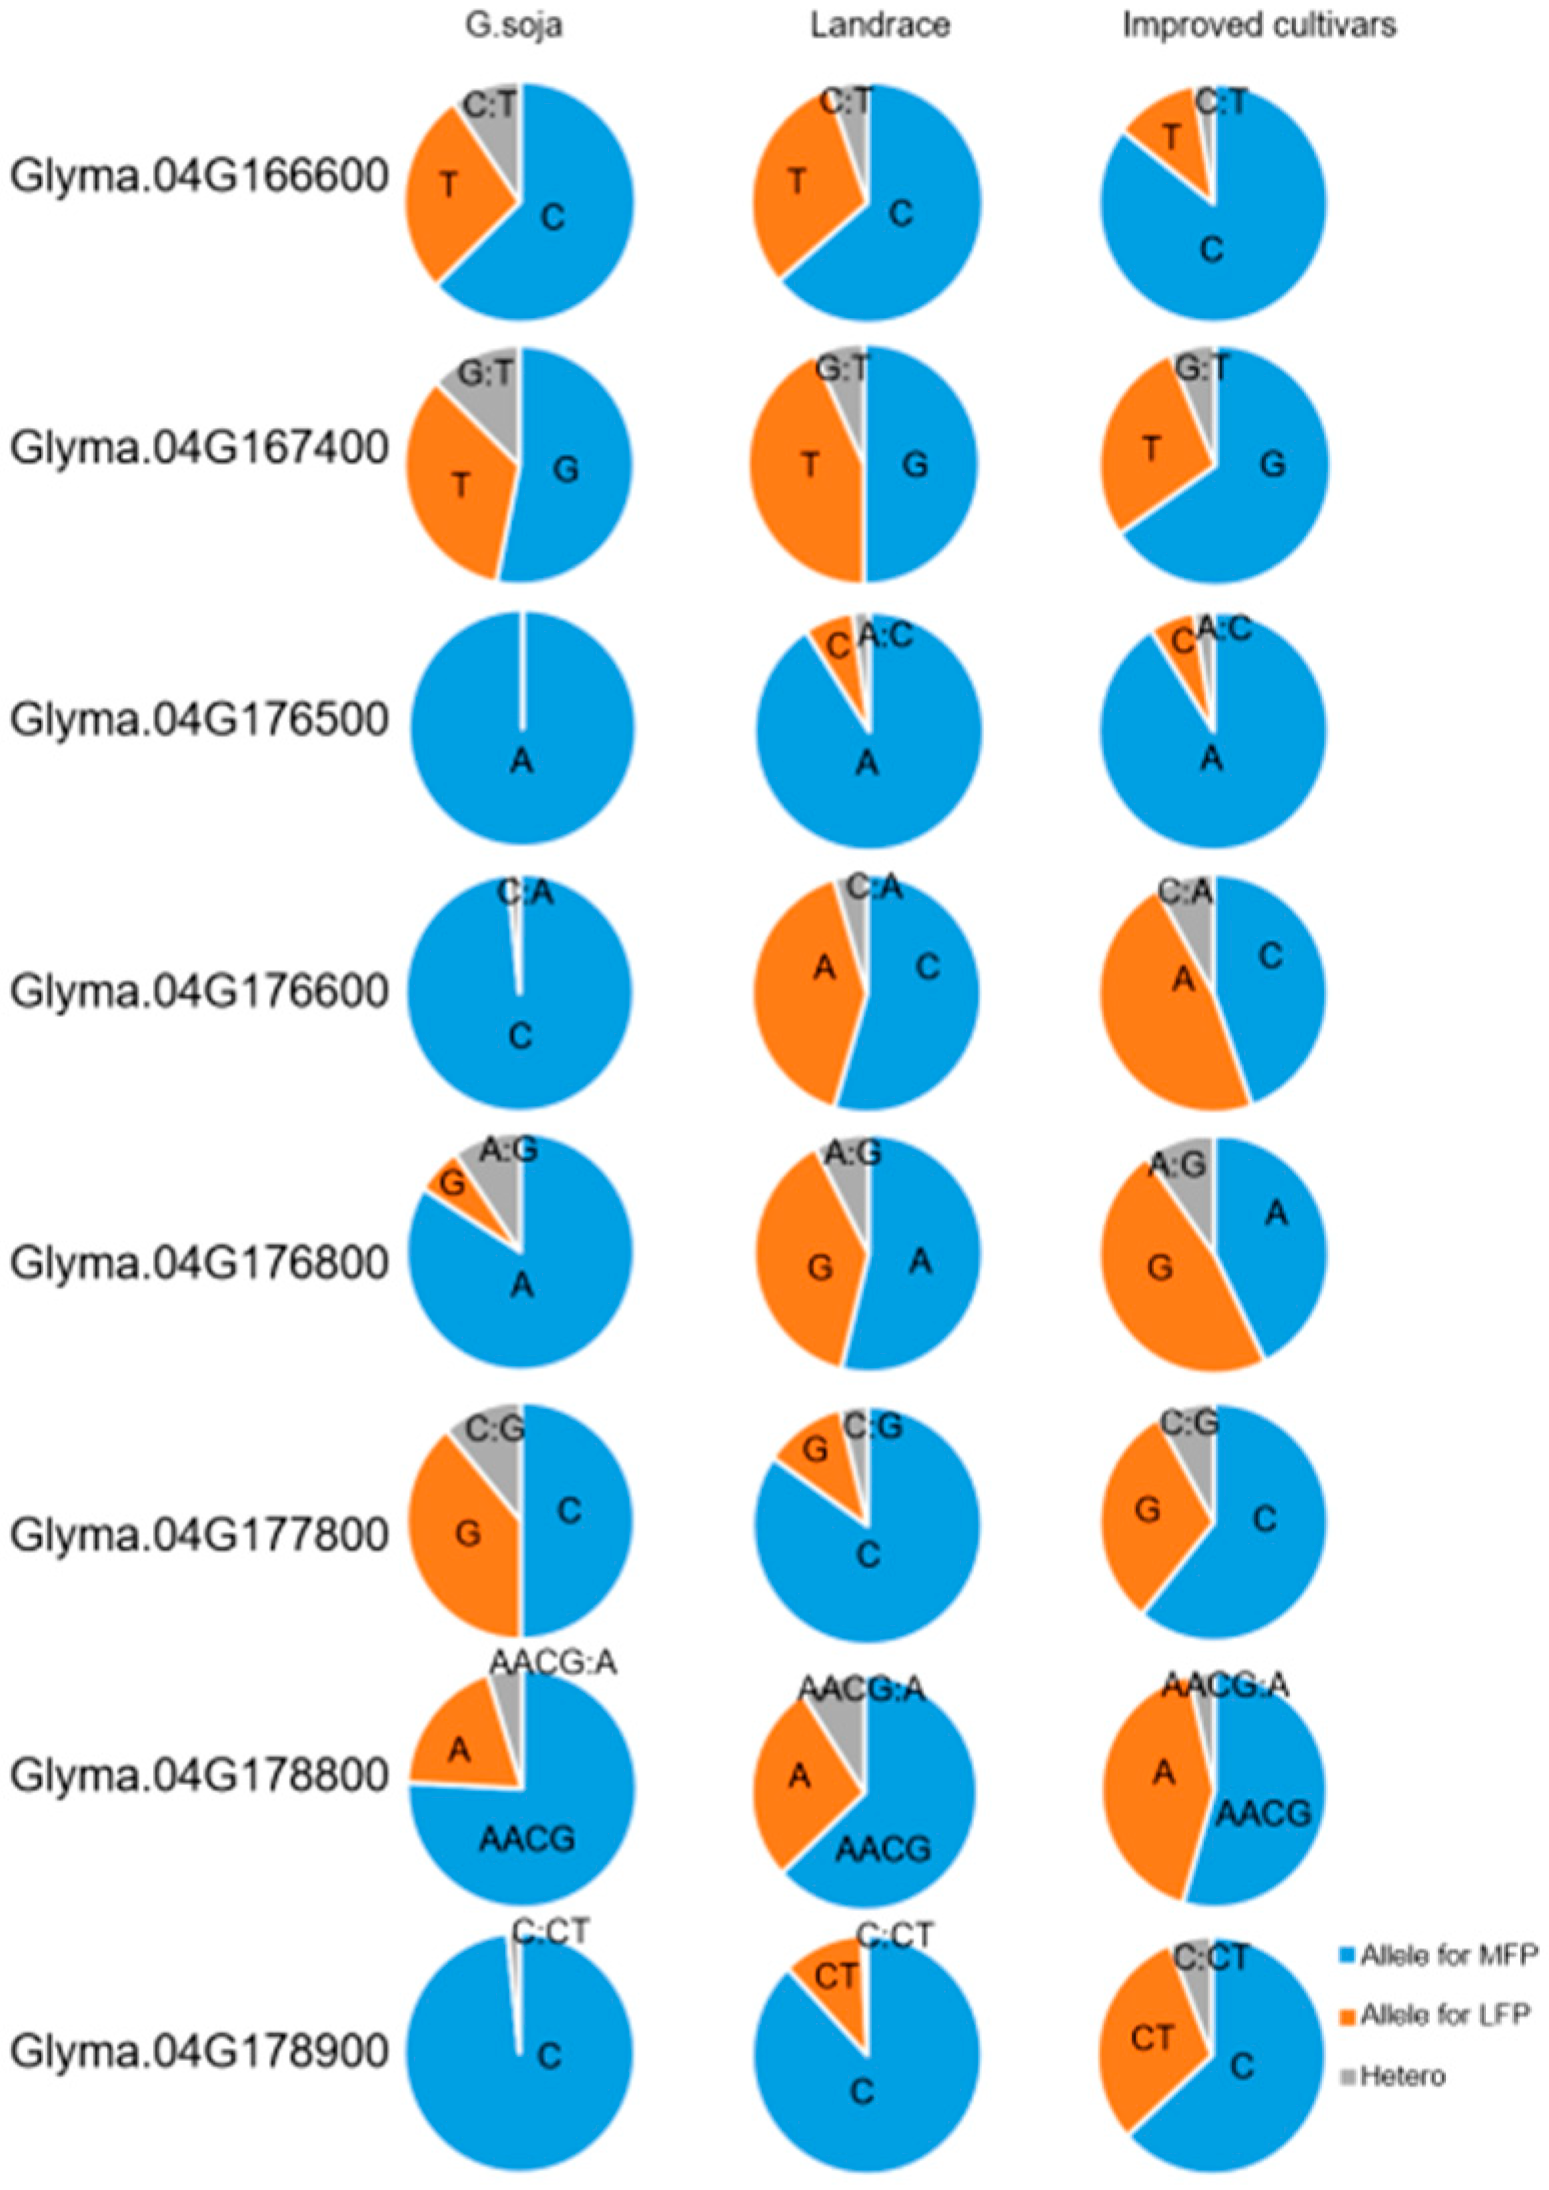
Furthermore, we performed genetic diversity analysis in a more diverse soybean panel comprising of 302 representative soybean accessions including wild soybean, landrace, and cultivars that have been sequenced [31]. As shown in Figure 7 and Table 4, genotyping analysis showed the differences in the distribution and frequency for these nonsynonymous-SNP or Indels of eight candidate genes in the population. Alleles of the eight genes may play a function in the development of floral and pod numbers during soybean domestication and development, implying the importance of these genes capable of meeting human needs for higher soybean production.
Combined with the above results, Glyma.04G176600 and Glyma.04G178900 were not only highly expressed in flower development and early-stage pods, but also accumulated some variants during soybean domestication and development, which were the most likely promising genes for qFPN4. Although the function of their homologous genes has been reported that Glyma.04G176600 might be involved in flower development [32,33], functional characterization of these genes should be performed to further validate their functions on the soybean flower and pod numbers in future studies.

4. Discussion

Soybean has been an important oilseed crop worldwide and the yield represents almost all the economic value in the market. The TFPN of soybean determines the effective number of flowers and pods that is also a main factor leading to effective PNPP, which were all especially important in determining soybean yield [34]. Studies have shown that high pod setting number per plant and PNPP greatly increased soybean yield [8,9,13,35]; therefore, dissecting the genetic basis of TFPN and PNPP is critically important to understand the genetic mechanism of soybean yield. Previous studies have been mainly dedicated to the identification of QTL for related traits associated with the pod number [9,10,11,12,13,14] with rare reports on the total number of flowers and pods, an important yield component as indicated in this study.
In this study, we selected two parental lines, TJSIH and JY73, with contrasting TFPN and PNPP to develop an F2 RIL population to dissect the genetic mechanism. Our study identified multiple QTL that control both traits: six QTL for TFPN and five QTL for PNPP. We observed that four QTL on chromosomes 2, 4, 7, and 10 were shared by TFPN and PNPP (Table 2; Figure 2), suggesting that both traits were controlled by the common mechanism. Of the identified QTL, qPN2, qPN7, and qPN10 have been identified in Kuroda et al., 2013 [12] and Ning et al., (2018) [6] and qPN5 was also detected in Yang et al., (2013) [13]. qPN4 was coincident with the QTL in different studies with different populations or environmental conditions in Vieira et al., (2006) [9], Liu et al., (2017) [14], and Ning et al., (2018) [6], verifying that qPN4 is a highly confident QTL that deserves to be pursued. Indeed, our follow-up assays using RHLs and NILs confirmed that qPN4/qFPN4 controlled both PNPP and TFPN and a single gene controlled the two traits. Thus far, no known genes for flower- and pod-related traits in this region have been reported in soybean; therefore, qFPN4 is a novel gene controlling the total number of flowers and pods.
It is known that soybean yield is a very complex trait controlled by multiple genes, the majority of which have small effect [1]. Therefore, the observed soybean yield is the accumulative result from a number of genes/QTL; however, few have been identified [36,37]. Here, we confirmed that qFPN4 is among the QTL that plays a contributing role for soybean yield, enriching the candidate QTL to explore the usefulness for soybean improvement. We further identified a tightly linked marker C1-5 to the QTL, which is approximately 360 kb from the proposed candidate gene Glyma.04G176600. This marker will be used for the trait test for the marker-aided selection of MFP for soybean yield improvement.
Next generation sequencing (NGS) based BSA approaches have been proven successful in rapidly mapping genes for various traits in plant species [38]. This strategy is useful for the analysis of the traits controlled by a single gene. For the first time, we showed that a single gene qFPN4 controls the flower and pod numbers using the RHL strategy. The NGS-based BSA is a very helpful approach to delimit the interval and to identify candidate genes for qFPN4; the resulting interval for TFPN in Chr.4: 39,889,438–45,442,849 bp (Figure 5) overlapped with the region of fine-mapping results (Chr.4: 41,754,458–44,375,173 bp) (Figure 3), confirming the robustness of our QTL mapping results. The BSA-seq also enabled the identification of eight candidate genes with nonsynonymous-SNP or/and Indel mutations (Table 3), paving the way for a follow-up investigation.
Among the eight genes, Glyma.04G166600 encodes fucosyltransferase 1. Several reports have found that glycosyltransferases are involved in the biosynthesis of cell wall polysaccharides, the addition of N-linked glycans to glycoproteins, and the attachment of sugar moieties to various small molecules such as hormones and flavonoids [39,40,41]. It has shown that an increase in alpha-(1,4)-fucosyltransferase activity was only observed during anther development. Higher activity was detected in mature pollen grains and pollen tubes, especially during pollen tube elongation [42]. The anther was curved in the Osfuct mutant, which lacks the α1,3-fucosyltransferase gene [43]. These data suggest that Glyma.04G166600 might be involved in pollen development but does not impact the number of seed or pod sets. Glyma.04G167400 encodes a thylakoid protein, NDH dependent flow 6, specific to terrestrial plants and it is essential for activity of chloroplastic NAD(P)H dehydrogenase involved in cyclic electron transport around photosystem I [44]. Glyma.04G176500 encodes DDT domain superfamily protein, which is involved in different transcription and chromosome remodeling factors [45]. Glyma.04G176600 encodes galactosyltransferase family protein, which is involved in the formation of several classes of glycoconjugates and in lactose biosynthesis [46]. Several reports have shown that β-(1,3)-galactosyltransferase was required for pollen exine development in Arabidopsis and maize [32,33]. The mutation in the β-(1,3)-galactosyltransferase caused reduced fertility as indicated by shorter fruit lengths and lower seed sets compared to the wild type. These data demonstrate that Glyma.04G176600 may be important for fertility that is directly related to the number of pod sets in soybean. Glyma.04G177800 encodes formin 8 and overexpression of AtFH8 caused dramatic changes in root hair cell development and its actin organization, indicating the involvement of AtFH8 in polarized cell growth through the actin cytoskeleton [47,48]. Glyma.04G178800, a member of transducin/WD40 protein superfamily, whose homologs controls seed germination, growth, and biomass accumulation through ribosome biogenesis protein interactions in Arabidopsis [49]. The remaining two genes (Glyma.04G176800 and Glyma.04G178900) have unknown functions. Therefore, based on the function of the homologous gene, Glyma.04G176600 is the most likely to control the flower and pod numbers. In addition, the one-base insertion of Glyma.04G178900 led to the frameshift from the 5th amino of CDS region in allele for LFP (Supplementary Figure S3). Frameshift mutations often result in loss of function, which may reduce both TFPN and PNPP; therefore, Glyma.04G176600 and Glyma.04G178900 could be the candidate genes for qFPN4.With the application of public data, it provides some clues for the characterizing of gene function. Using the expression data in different tissues that were collected from the different developmental stages, including roots, stems, leaves, buds, developing pods and seeds [30], we found that Glyma.04G176600 and Glyma.04G178900 were highly expressed in developing flower and early-stage pods relative to other tissues (Figure 6), indicating that the two genes were likely the candidates for qFPN4 with roles involved in the regulation of flower and pod development; among them, the allelic variation of Glyma.04G176600 for LFP caused amino acid replacement. Especially, the allelic variation of Glyma.04G178900 for LFP led to the frameshift from the 5th amino in CDS region, resulting in the missing four amino acids (Supplementary Figure S3). Moreover, the distribution and frequency of these two variations in the Glyma.04G176600 and Glyma.04G178900 were different in the G. soja (wild soybean), landrace, and improved cultivars, implying that the different haplotypes of Glyma.04G176600 and Glyma.04G178900 may play different roles on the floral and pod numbers during soybean domestication and development.
These results improved our understanding of the genetic mechanism of the effective flower and pod numbers. Further analysis of the QTL would allow the identification of markers closely linked to all the QTL, especially the qFPN4, which could be used in marker-assisted selection for increased soybean flower and pod numbers and yields in soybean. Further dissection of qFPN4 could also lead to the identification of causal genes or variants for the precise improvement of TFPN and PNPP in soybean.

5. Conclusions

In this study, we identified that an important QTL, qFPN4, for both TFPN and PNPP is controlled by a single dominant gene, where qFPN4 allele controls low TFPN and PNPP, whereas qfpn4 is responsible for high TFPN and PNPP. qFPN4 was delimited into a ~2.62 Mb interval (Gm04: 41,754,458–44,375,173). Within the interval, eight genes carry nonsynonymous SNPs and/or Indels between parental lines. of which Glyma.04G176600 and Glyma.04G178900 were nominated as the promising candidate genes for qFPN4 based on expression analysis. Additionally, we developed an Indel marker C1-5 tightly linking to the QTL, which may facilitate soybean improvement through the marker-aided selection. Our findings confirmed that qFPN4 plays a contributing role for soybean yield, enriching the candidate QTL to explore the usefulness for soybean improvement.

Supplementary Materials

The following supporting information can be downloaded at: https://www.mdpi.com/article/10.3390/agronomy12040790/s1. Figure S1: The observed frequencies of TFPN (A) and PNPP (B) in RHL family #5; Figure S2: The distribution of Euclidean distance (ED)-associated values on 20 chromosomes; Figure S3: The protein sequence alignment of Glyma.04G178900 and its mutant (Glyma.04G178900-mut); Table S1: Indel markers used for mapping QTL for TFPN and PNPP; Table S2: Indel markers used for fine mapping qFPN4 locus and detecting NILs; Table S3: Mapping QTL for TFPN and PNPP in the F6 JT RIL population.

Author Contributions

Conceptualization and funding, F.W. and H.Z.; investigation and marker analysis, X.S. (Xia Sun) and F.W.; data curation and QTL mapping, X.S. (Xia Sun), X.S. (Xiaohuan Sun), Y.W. and H.R.; writing and revision—original draft, X.S. (Xia Sun), X.P. and F.W.; writing—review and editing, F.W. and H.Z. All authors have read and agreed to the published version of the manuscript.

Funding

This research was funded by the National Natural Science Foundation of China (31972966 and 31301337), the Natural Science Foundation of Heilongjiang Province (QC2014C036 and YQ2020C029) and the Hainan Yazhou Bay Seed Lab (B21HJ0101).

Institutional Review Board Statement

Not applicable.

Informed Consent Statement

Not applicable.

Data Availability Statement

The data generated in this study are included in this published article and its Supplementary Materials.

Conflicts of Interest

The authors declare no conflict of interest.

References

  1. Xavier, A.; Rainey, K.M. Quantitative genomic dissection of soybean yield components. G3 (Bethesda) 2020, 10, 665–675. [Google Scholar] [CrossRef] [PubMed] [Green Version]
  2. Carter, T.E.; Nelson, R.L.; Sneller, C.H.; Cui, Z.; Boerma, H.R.; Specht, J.E. Genetic diversity in soybean. In Soybeans: Improvement, Production, and Uses, 3rd ed.; American Society of Agronomy: Madison, WI, USA, 2004; Volume 16, pp. 303–396. [Google Scholar]
  3. Mikel, M.A.; Diers, B.W.; Nelson, R.L.; Smith, H.H. Genetic diversity and agronomic improvement of North American soybean germplasm. Crop Sci. 2010, 50, 1219–1229. [Google Scholar] [CrossRef] [Green Version]
  4. Rincker, K.; Nelson, R.; Specht, J.; Sleper, D.; Cary, T.; Cianzio, S.R.; Casteel, S.; Conley, S.; Chen, P.; Davis, V.; et al. Genetic improvement of US soybean in maturity groups II, III, and IV. Crop Sci. 2014, 54, 1419–1432. [Google Scholar] [CrossRef]
  5. Specht, J.E.; Hume, D.J.; Kumudini, S.V. Soybean yield potential: A genetic and physiological perspective. Crop Sci. 1999, 39, 1560–1570. [Google Scholar] [CrossRef]
  6. Ning, H.; Yuan, J.; Dong, Q.; Li, W.; Xue, H.; Wang, Y.; Tian, Y.; Li, W.X. Identification of QTLs related to the vertical distribution and seed-set of pod number in soybean Glycine max (L.) Merri. PLoS ONE 2018, 13, e0195830. [Google Scholar] [CrossRef] [Green Version]
  7. Machado, B.Q.V.; Nogueira, A.P.O.; Hamawaki, O.T.; Rezende, G.F.; Jorge, G.L.; Silveira, I.C.; Medeiros, L.A.; Hamawaki, R.L.; Hamawaki, C.D.L. Phenotypic and genotypic correlations between soybean agronomic traits and path analysis. Genet. Mol. Res. 2017, 16, gmr16029696. [Google Scholar] [CrossRef]
  8. Raza, M.A.; Feng, L.Y.; van der Werf, W.; Iqbal, N.; Khalid, M.H.B.; Chen, Y.K.; Wasaya, A.; Ahmed, S.; Ud Din, A.M.; Khan, S.A.; et al. Maize leaf-removal: A new agronomic approach to increase dry matter, flower number and seed-yield of soybean in maize soybean relay intercropping system. Sci. Rep. 2019, 9, 13453. [Google Scholar] [CrossRef] [Green Version]
  9. Vieira, A.J.D.; Oliveira, D.A.; Soares, T.C.B.; Schuster, I.; Piovesan, N.D.; Martinez, C.A.; Barros, E.G.; Moreira, M.A. Use of the QTL approach to the study of soybean trait relationships in two populations of recombinant inbred lines at the F7 and F8 generations. Braz. J. Plant Physiol. 2006, 18, 281–290. [Google Scholar] [CrossRef] [Green Version]
  10. Sun, D.; Li, W.; Zhang, Z.; Chen, Q.; Ning, H.; Qiu, L.; Sun, G. Quantitative trait loci analysis for the developmental behavior of soybean (Glycine max L. Merr.). Theor. Appl. Genet. 2006, 112, 665–673. [Google Scholar] [CrossRef]
  11. Zhang, D.; Cheng, H.; Wang, H.; Zhang, H.; Liu, C.; Yu, D. Identification of genomic regions determining flower and pod numbers development in soybean (Glycine max L.). J. Genet. Genom. 2010, 37, 545–556. [Google Scholar] [CrossRef]
  12. Kuroda, Y.; Kaga, A.; Tomooka, N.; Yano, H.; Takada, Y.; Kato, S.; Vaughan, D. QTL affecting fitness of hybrids between wild and cultivated soybeans in experimental fields. Ecol. Evol. 2013, 3, 2150–2168. [Google Scholar] [CrossRef] [PubMed]
  13. Yang, Z.; Xin, D.; Liu, C.; Jiang, H.; Han, X.; Sun, Y.; Qi, Z.; Hu, G.; Chen, Q. Identification of QTLs for seed and pod traits in soybean and analysis for additive effects and epistatic effects of QTLs among multiple environments. Mol. Genet. Genom. 2013, 288, 651–667. [Google Scholar] [CrossRef] [PubMed]
  14. Liu, N.; Li, M.; Hu, X.; Ma, Q.; Mu, Y.; Tan, Z.; Xia, Q.; Zhang, G.; Nian, H. Construction of high-density genetic map and QTL mapping of yield-related and two quality traits in soybean RILs population by RAD-sequencing. BMC Genom. 2017, 18, 466. [Google Scholar] [CrossRef] [PubMed] [Green Version]
  15. Lu, S.; Zhao, X.; Hu, Y.; Liu, S.; Nan, H.; Li, X.; Fang, C.; Cao, D.; Shi, X.; Kong, L.; et al. Natural variation at the soybean J locus improves adaptation to the tropics and enhances yield. Nat. Genet. 2017, 49, 773–779. [Google Scholar] [CrossRef]
  16. Cregan, P.B.; Jarvik, T.; Bush, A.L. An integrated genetic linkage map of the soybean genome. Crop Sci. 1999, 39, 1464–1490. [Google Scholar] [CrossRef] [Green Version]
  17. Song, Q.J.; Marek, L.F.; Shoemaker, R.C.; Lark, K.G.; Concibido, V.C.; Delannay, X.; Specht, J.E.; Cregan, P.B. A new integrated genetic linkage map of the soybean. Theor. Appl. Genet. 2004, 109, 122–128. [Google Scholar] [CrossRef]
  18. Richards, E.; Reichardt, M.; Rogers, S. Preparation of genomic DNA from plant tissue. Curr. Protoc. Mol. Biol. 2001, 2, Unit2.3. [Google Scholar] [CrossRef]
  19. Manly, K.F.; Cudmore, J.; Robert, H.; Meer, J.M. Map Manager QTX, cross-platform software for genetic mapping. Mamm. Genome 2001, 12, 930–932. [Google Scholar] [CrossRef]
  20. Van Ooijen, J.W.; Voorrips, R.E. JoinMap®, Version 3.0; Software for the Calculation of Genetic Linkage Maps; Plant Research International: Wageningen, The Netherlands, 2001.
  21. Van Ooijen, J.W. MapQTL®, Version 5; Software for the Mapping of Quantitative Trait Loci in Experimental Populations; Kyazma BV: Wageningen, The Netherlands, 2004.
  22. Abuín, J.M.; Pichel, J.C.; Pena, T.F.; Amigo, J. BigBWA: Approaching the Burrows-Wheeler aligner to Big Data technologies. Bioinformatics 2015, 31, 4003–4005. [Google Scholar] [CrossRef]
  23. Li, H.; Handsaker, B.; Wysoker, A.; Fennell, T.; Ruan, J.; Homer, N.; Marth, G.; Abecasis, G.; Durbin, R. 1000 genome project data processing subgroup. The sequence alignment/map format and SAMtools. Bioinformatics 2009, 25, 2078–2079. [Google Scholar] [CrossRef] [Green Version]
  24. McKenna, A.; Hanna, M.; Banks, E.; Sivachenko, A.; Cibulskis, K.; Kernytsky, A.; Garimella, K.; Altshuler, D.; Gabriel, S.; Daly, M.; et al. The Genome Analysis Toolkit: A MapReduce framework for analyzing next-generation DNA sequencing data. Genome Res. 2010, 20, 1297–1303. [Google Scholar] [CrossRef] [PubMed] [Green Version]
  25. Hill, J.T.; Demarest, B.L.; Bisgrove, B.W.; Gorsi, B.; Su, Y.C.; Yost, H.J. MMAPPR: Mutation mapping analysis pipeline for pooled RNA-seq. Genome Res. 2013, 23, 687–697. [Google Scholar] [CrossRef] [PubMed] [Green Version]
  26. Geng, X.; Jiang, C.; Yang, J.; Wang, L.; Wu, X.; Wei, W. Rapid identification of candidate genes for seed weight using the SLAF-Seq method in Brassica napus. PLoS ONE 2016, 11, e147580. [Google Scholar]
  27. Fehr, W.R.; Caviness, C.E.; Bumood, D.T.; Pennington, J.S. Stage of development descriptions for soybeans, Glycine max L. Merrill. Crop Sci. 1971, 11, 929–931. [Google Scholar] [CrossRef]
  28. Han, Y.; Li, D.; Zhu, D.; Li, H.; Li, X.; Teng, W.; Li, W. QTL analysis of soybean seed weight across multi-genetic backgrounds and environments. Theor. Appl. Genet. 2012, 125, 671–683. [Google Scholar] [CrossRef]
  29. Adzhubei, I.A.; Schmidt, S.; Peshkin, L.; Ramensky, V.E.; Gerasimova, A.; Bork, P.; Kondrashov, A.S.; Sunyaev, S.R. A method and server for predicting damaging missense mutations. Nat. Methods 2010, 7, 248–249. [Google Scholar] [CrossRef] [Green Version]
  30. Liu, Z.Z.; Yao, D.; Zhang, J.; Li, Z.L.; Ma, J.; Liu, S.Y.; Qu, J.; Guan, S.Y.; Wang, D.D.; Pan, L.D.; et al. Identification of genes associated with the increased number of four-seed pods in soybean (Glycine max L.) using transcriptome analysis. Genet. Mol. Res. 2015, 14, 18895–18912. [Google Scholar] [CrossRef]
  31. Zhou, Z.; Jiang, Y.; Wang, Z.; Gou, Z.; Lyu, J.; Li, W.; Yu, Y.; Shu, L.; Zhao, Y.; Ma, Y.; et al. Resequencing 302 wild and cultivated accessions identifies genes related to domestication and improvement in soybean. Nat. Biotechnol. 2015, 33, 408–414. [Google Scholar] [CrossRef] [Green Version]
  32. Suzuki, T.; Narciso, J.O.; Zeng, W.; van de Meene, A.; Yasutomi, M.; Takemura, S.; Lampugnani, E.R.; Doblin, M.S.; Bacic, A.; Ishiguro, S. KNS4/UPEX1: A Type II arabinogalactan beta-(1,3)-Galactosyltransferase required for pollen exine development. Plant Physiol. 2017, 173, 183–205. [Google Scholar] [CrossRef] [Green Version]
  33. Wang, D.; Skibbe, D.S.; Walbot, V. Maize Male sterile 8 (Ms8), a putative beta-1,3-galactosyltransferase, modulates cell division, expansion, and differentiation during early maize anther development. Plant Reprod. 2013, 26, 329–338. [Google Scholar] [CrossRef]
  34. Board, J.E.; Tan, Q. Assimilatory capacity effects on soybean yield components and pod number. Crop Sci. 1995, 35, 846–851. [Google Scholar] [CrossRef]
  35. Zhang, J.L.; Wang, Y.Y.; Sun, L.Q.; Wei, T.T.; Gu, X.H.; Gao, F.; Li, X.D. Effects of paclobutrazol on the yield, quality, and related enzyme activities of different quality type peanut cultivars. Ying Yong Sheng Tai Xue Bao 2013, 24, 2850–2856. [Google Scholar] [PubMed]
  36. Wang, S.; Liu, S.; Wang, J.; Yokosho, K.; Zhou, B.; Yu, Y.C.; Liu, Z.; Frommer, W.B.; Ma, J.F.; Chen, L.Q.; et al. Simultaneous changes in seed size, oil content, and protein content driven by selection of SWEET homologues during soybean domestication. Natl. Sci. Rev. 2020, 7, 1776–1786. [Google Scholar] [CrossRef]
  37. Zhang, H.; Goettel, W.; Song, Q.; Jiang, H.; Hu, Z.; Wang, M.L.; An, Y.C. Selection of GmSWEET39 for oil and protein improvement in soybean. PLoS Genet. 2020, 16, e1009114. [Google Scholar] [CrossRef] [PubMed]
  38. Wu, S.; Qiu, J.; Gao, Q. QTL-BSA: A bulked segregant analysis and visualization pipeline for QTL-seq. Interdiscip Sci. 2019, 11, 730–737. [Google Scholar] [CrossRef] [PubMed]
  39. Lim, E.K. Plant glycosyltransferases: Their potential as novel biocatalysts. Chemistry 2005, 11, 5486–5494. [Google Scholar] [CrossRef] [PubMed]
  40. Keegstra, K.; Raikhel, N. Plant glycosyltransferases. Curr. Opin. Plant Biol. 2001, 4, 219–224. [Google Scholar] [CrossRef]
  41. Taylor, L.P.; Miller, K.D. The use of a photoactivatable kaempferol analogue to probe the role of flavonol 3-O-galactosyltransferase in pollen germination. Adv. Exp. Med. Biol. 2002, 505, 41–50. [Google Scholar]
  42. Joly, C.; Léonard, R.; Maftah, A.; Riou-Khamlichi, C. alpha4-Fucosyltransferaseis regulated during flower development: Increases in activity are targeted to pollen maturation and pollen tube elongation. J. Exp. Bot. 2002, 53, 1429–1436. [Google Scholar]
  43. Sim, J.S.; Kesawat, M.S.; Kumar, M.; Kim, S.Y.; Mani, V.; Subramanian, P.; Park, S.; Lee, C.M.; Kim, S.R.; Hahn, B.S. Lack of the alpha1,3-Fucosyltransferase Gene (Osfuct) Affects Anther Development and Pollen Viability in Rice. Int. J. Mol. Sci. 2018, 19, 1225. [Google Scholar] [CrossRef] [Green Version]
  44. Ishikawa, N.; Takabayashi, A.; Ishida, S.; Hano, Y.; Endo, T.; Sato, F. NDF6: A thylakoid protein specific to terrestrial plants is essential for activity of chloroplastic NAD(P)H dehydrogenase in Arabidopsis. Plant Cell Physiol. 2008, 49, 1066–1073. [Google Scholar] [CrossRef] [PubMed] [Green Version]
  45. Doerks, T.; Copley, R.; Bork, P. DDT—A novel domain in different transcription and chromosome remodeling factors. Trends Biochem. Sci. 2001, 26, 145–146. [Google Scholar] [CrossRef]
  46. Hennet, T. The galactosyltransferase family. Cell Mol. Life Sci. 2002, 59, 1081–1095. [Google Scholar] [CrossRef] [PubMed]
  47. Yi, K.; Guo, C.; Chen, D.; Zhao, B.; Yang, B.; Ren, H. Cloning and functional characterization of a formin-like protein (AtFH8) from Arabidopsis. Plant Physiol. 2005, 138, 1071–1082. [Google Scholar] [CrossRef] [Green Version]
  48. Zhang, L.; Smertenko, T.; Fahy, D.; Koteyeva, N.; Moroz, N.; Kuchařová, A.; Novák, D.; Manoilov, E.; Smertenko, P.; Galva, C.; et al. Analysis of formin functions during cytokinesis using specific inhibitor SMIFH2. Plant Physiol. 2021, 186, 945–963. [Google Scholar] [CrossRef]
  49. Gachomo, E.W.; Jimenez-Lopez, J.C.; Baptiste, L.J.; Kotchoni, S.O. GIGANTUS1 (GTS1), a member of Transducin/WD40 protein superfamily, controls seed germination, growth and biomass accumulation through ribosome-biogenesis protein interactions in Arabidopsis thaliana. BMC Plant Biol. 2014, 14, 37. [Google Scholar] [CrossRef] [Green Version]
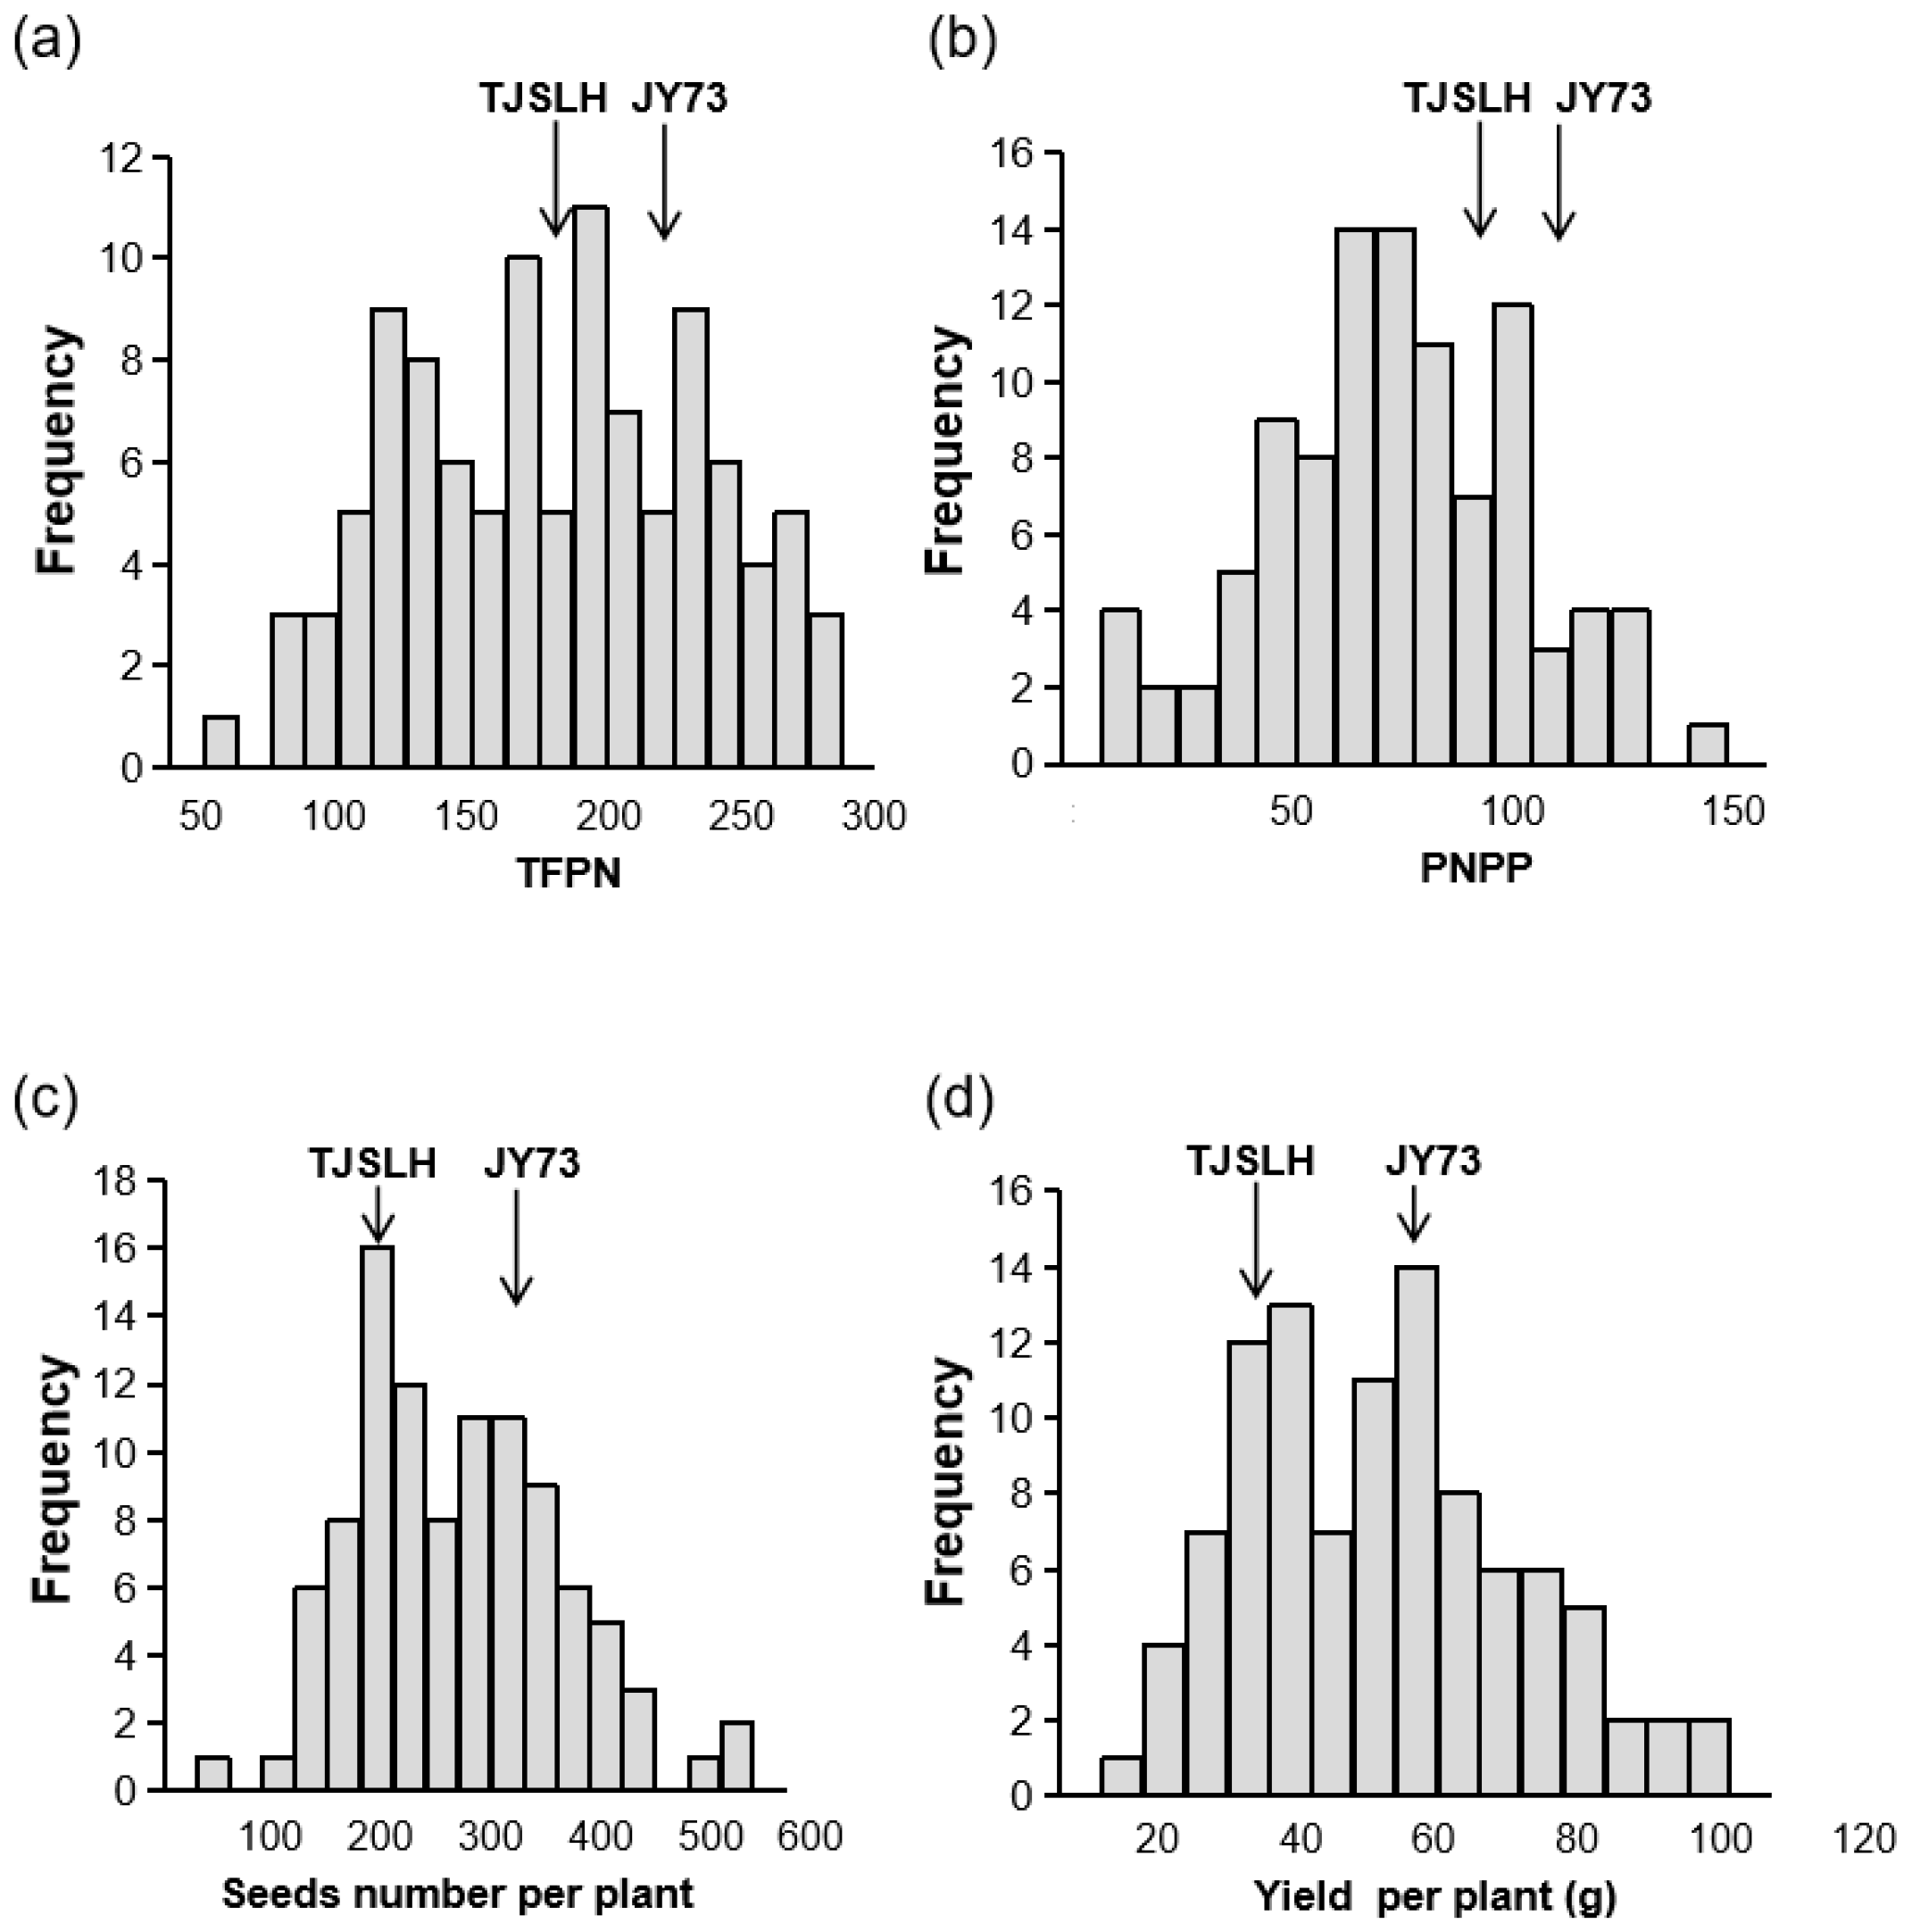
Figure 1. Distribution of TFPN (a), PNPP (b), and other two agronomic traits (c,d) in the F2 population.
Agronomy 12 00790 g001
Figure 2. The genetic map of the RIL population and the QTL for TFPN and PNPP.
Agronomy 12 00790 g002
Figure 3. Fine mapping of qFPN4. Graphical genotypes of soybean recombinants carrying crossovers at qFPN4. The white bars represent the homozygote for the qFPN4 allele from TJSLH, the black solid bars represent the homozygote for the qfpn4 allele from JY73, and the crosshatched bars represent the heterozygote. All the recombinants were derived from RHL family #5. Six recombinants were genotyped with ten newly developed Indels. Physical coordinates of the markers were obtained from the soybean reference genome and indicated at the top of the markers. TFPN and PNPP for the recombinants were evaluated for at least 30 of their respective progeny and shown in the right panels.
Agronomy 12 00790 g003
Figure 4. Development of NILs for qFPN4 and phenotypes comparison. (A) The genotype of NIL-qFPN4 and NIL-qfpn4 on chromosome 4; (B) TFPN and PNPP between NIL-qFPN4 and NIL-qfpn4.
Agronomy 12 00790 g004
Figure 5. The distribution of ED-associated values on chromosome 4. Note: The color dots represent the ED value of each SNP (a) or Indel (b) locus. The higher the ED value the better the correlation.
Agronomy 12 00790 g005
Figure 6. The expression patterns and relative levels of the eight genes in different tissues.
Agronomy 12 00790 g006
Figure 7. Allelic frequencies of the eight genes in G. soja, landrace, and improved cultivars.
Agronomy 12 00790 g007
Table 1. Correlation coefficient among TFPN, PNPP, and yield-related traits in soybean.
PNPPSeed Number per PlantYield per Plant
TFPN0.9030.807 **0.833 **
PNPP-0.868 **0.903 **
** means significant differences at p < 0.01, student’s t-tests.
Table 2. QTL information for TFPN and PNPP.
TraitsQTLChromosomeFlanking MarkerGenomic Region (Mb)LODPVE (%)Additive EffectRe-Identification
TFPNqFPN22Sat_069—PSI029543.2–48.32.2814.423.04
qFPN33Sat_266—GMABAB34.0–37.92.6713.926.10
qFPN44Satt190—Satt19516.7–44.42.109.216.81
qFPN77Satt201—Satt2452.0–9.44.2818.133.09
qFPN10-110Sat_321—Satt6532.4–4.62.2811.323.34
qFPN10-210Satt653—Satt2594.6–4.92.028.920.06
PNPPqPN22Sat_069—PSI029543.2–48.32.3815.917. 55[6,12]
qPN44Satt190—Satt19516.7–44.42.199.613.89[6,9,14]
qPN55Sat_40734.02.008.814.18[13]
qPN77Satt201—Satt2452.0–9.43.1913.721.21[6,12]
qPN1010Sat_321—Satt6532.4–4.62.1510.317.17[6,12]
PVE, phenotypic variation explanation ratio.
Table 3. Predicted genes within ~2.62 Mb region of qFPN4 locus in the reference Williams82 sequence.
Gene NameSNP PositionCDSAllele for MFPAllele for LFPNSSNPHomolog in Ath.Protein Family
Glyma.04G16660041834809exon2CTA78VAT2G03220.1Fucosyltransferase 1
Glyma.04G16740042009788exon1GTR32IAT1G18730.1Photosynthetic NAD(P)H dehydrogenase subcomplex B4
Glyma.04G17650043949063exon6ACK259TAT1G18950.1DDT domain superfamily
Glyma.04G17660043971465exon1CAW11LAT5G62620.1Galactosyltransferase family protein
Glyma.04G17680044006761exon2AGN154DAT3G47850.1-
Glyma.04G17780044202428exon2CGK600NAT1G70140.1Formin 8
Glyma.04G17880044358968exon1AACGAN146del.3AT5G50120.1Transducin/WD40 repeat-like Superfamily protein
Glyma.04G17890044372615exon1CCTT5ins.1--
NSSNP, substitution or insertion–deletion of amino acids because of the variation of the base.
Table 4. Variation information and percentage of the eight genes in the population.
Gene Name* Variation PositionVariationG. sojaLandraceImproved Cultivar
C62.90%63.85%85.45%
Glyma.04G166600233T27.42%30.77%11.82%
Y9.68%5.38%2.73%
G53.23%50%65.45%
Glyma.04G16740095T33.87%43.08%28.18%
K12.90%6.92%6.36%
A100%90.77%90.91%
Glyma.04G176500776C06.92%6.36%
M02.31%2.73%
C98.39%54.62%44.55%
Glyma.04G17660032A040.77%47.27%
M1.61%4.61%8.18%
A83.87%53.85%42.73%
Glyma.04G176800460G6.45%38.46%47.27%
R9.68%7.69%10%
C50%84.61%60.91%
Glyma.04G1778001800G38.71%11.54%30.91%
S11.29%3.85%8.18%
AACG75.81%63.08%54.54%
Glyma.04G178800437A19.35%27.69%41.82%
H4.84%9.23%3.64%
C98.39%89.23%67.27%
Glyma.04G17890016CT011.54%32.73%
H1.61%0.77%6.36%
* means the position of allele within CDS of gene.
Publisher’s Note: MDPI stays neutral with regard to jurisdictional claims in published maps and institutional affiliations.