Article

A Root Density Tradeoff in an Okra-Assisted Subsurface Pipe Drainage System for Amelioration of Saline Soil

1
Key Laboratory of Agricultural Water Resources, Hebei Key Laboratory of Soil Ecology, CAS Engineering Laboratory for Efficient Utilization of Saline Resources, Center for Agricultural Resources Research, Institute of Genetics and Developmental Biology, Chinese Academy of Sciences, Shijiazhuang 050022, China
2
University of Chinese Academy of Sciences, Beijing 100049, China
3
Rice Programme, Pakistan Agricultural Research Council, Kala Shah Kaku, Lahore 39020, Pakistan
*
Author to whom correspondence should be addressed.
As a joint corresponding author to this work.
Agronomy 2022, 12(4), 866; https://doi.org/10.3390/agronomy12040866
Submission received: 12 March 2022 / Revised: 28 March 2022 / Accepted: 29 March 2022 / Published: 31 March 2022

Abstract

:
Subsurface pipe drainage technology can effectively improve coastal saline land in Northern China. We explored an okra (Abelmoschus esculentus L.)-assisted subsurface pipe drainage system to improve the water and salt discharge performance and benefits. In this study, the simulation box experiment was conducted to research the response of water and salt discharge performance in subsurface pipe drainage to okra root weight density (RWD). The drain outflow, soil salinity, and sodium adsorption ratio were determined. The results showed that okra RWD affected the vertical distribution of okra roots. Okra with an appropriate RWD (about 116 μg·cm−3) could significantly increase the cumulative drain outflow. Okra with an appropriate RWD (about 136 μg·cm−3) could significantly increase the desalting effect. Moreover, the RWD of okra also influenced the ability of subsurface pipe drainage to inhibit soil alkalization. The above results show that planting okra and installing subsurface pipe drainage to control drainage at the coastal saline land in Northern China can effectively improve the water and salt drainage effect when okra RWD is about 116–136 μg·cm−3. When using subsurface pipe drainage to improve coastal saline soils, planting okra with proper density may be an appropriate choice to improve the effect and benefit.

1. Introduction

In North China, there is a large area of coastal saline land which is a potential arable land resource which needs to be improved and utilized [1,2,3]. The subsurface pipe drainage method, has the advantage of reducing the groundwater level and increasing salt-leaching efficiency by installing underground pipes [4,5]. In recent years, relevant research showed that the use of subsurface pipe drainage can effectively improve coastal saline land in Northern China [6,7]. However, various factors constrain the application of the subsurface pipe drainage method. For example, in the early stage of saline land utilization, the soil salinity leads to the low yield of planting common crops [8,9], which will reduce farmers’ enthusiasm for investing in subsurface pipe drainage to reclaim saline land. Moreover, the relatively poor soil structure, permeability, and salt-leaching efficiency of coastal saline soil constrain water and salt discharge performance under the utilization of subsurface pipe drainage [10]. In addition, the saline soil reclamation is strongly dependent on fresh water which is scarce in that area [11,12]. Rainfall is the only freshwater resource used for leaching.
Numerous studies have reported that planting plants in saline soil can improve the leaching efficiency of saline soil. It is indicated that the growth of plants has an improved effect on the saline soil through improving the structure and water permeability of soil by its roots [13,14]. Moreover, the CO2 produced by the respiration of plant roots and the decomposition of organic matter promotes the dissolution of CaCO3 in the soil, which further reduces the soil pH and exchangeable sodium percentage (ESP), and results in increasing the water permeability of the soil [15,16,17,18]. It is indicated that planting forage beet and barley significantly improved the stability of soil aggregates and the hydraulic conductivity of surface soil [19]. The leaching efficiency under the condition of planting crops was higher than that under the non-cropped condition [20]. The water and salt discharge performance of subsurface pipe drainage may also be enhanced by plants, but the specific conditions are not clear.
The plant selection plays an important role in saline soil utilization [13,21]. Okra (Abelmoschus esculentus (L.) Moench) is recognized as a moderate salt tolerance plant having well-developed roots. It is widely cultivated in the subtropics and tropics due to being rich in minerals and vitamins; thus, it has a high economic value [22,23]. The improving effect of growth of okra on the soil hydraulic property was more than that of wheat [24]. It may result in a great salt-leaching effect under the plantation of okra in saline soil and relatively ideal yield can be obtained in the saline land with leaching measurements [25]. Recently, okra has been successfully planted on saline soil, which achieved good profits at ShouGuang city, the biggest vegetable production base in the north of China [26].
In our present research, we explored the possibility of combining planting okra with subsurface pipe drainage to reclaim saline land. However, okra roots may have a dual effect on salt movement in the saline soil (Figure 1). On the one hand, salt will accumulate in the root zone due to the transpiration of plants [27], and on the other hand, the root system can improve the hydraulic conductivity and leaching efficiency of saline soil [19,20]. Therefore, we set root densities as treatment variables in the present study. Our hypothesis was that installing underground pipes for subsurface pipe drainage and planting okra with an appropriate root density in a coastal saline area in Northern China will enhance the water and salt discharge performance of subsurface pipe drainage technology. The objective of the present study was to (1) determine the responses of water and salt discharge performance in subsurface pipe drainage to okra root density under the natural rainfall; and (2) find out an appropriate density of okra root density, which will effectively improve the water and salt discharge performance of subsurface pipe drainage.

2. Materials and Methods

2.1. Experimental Site

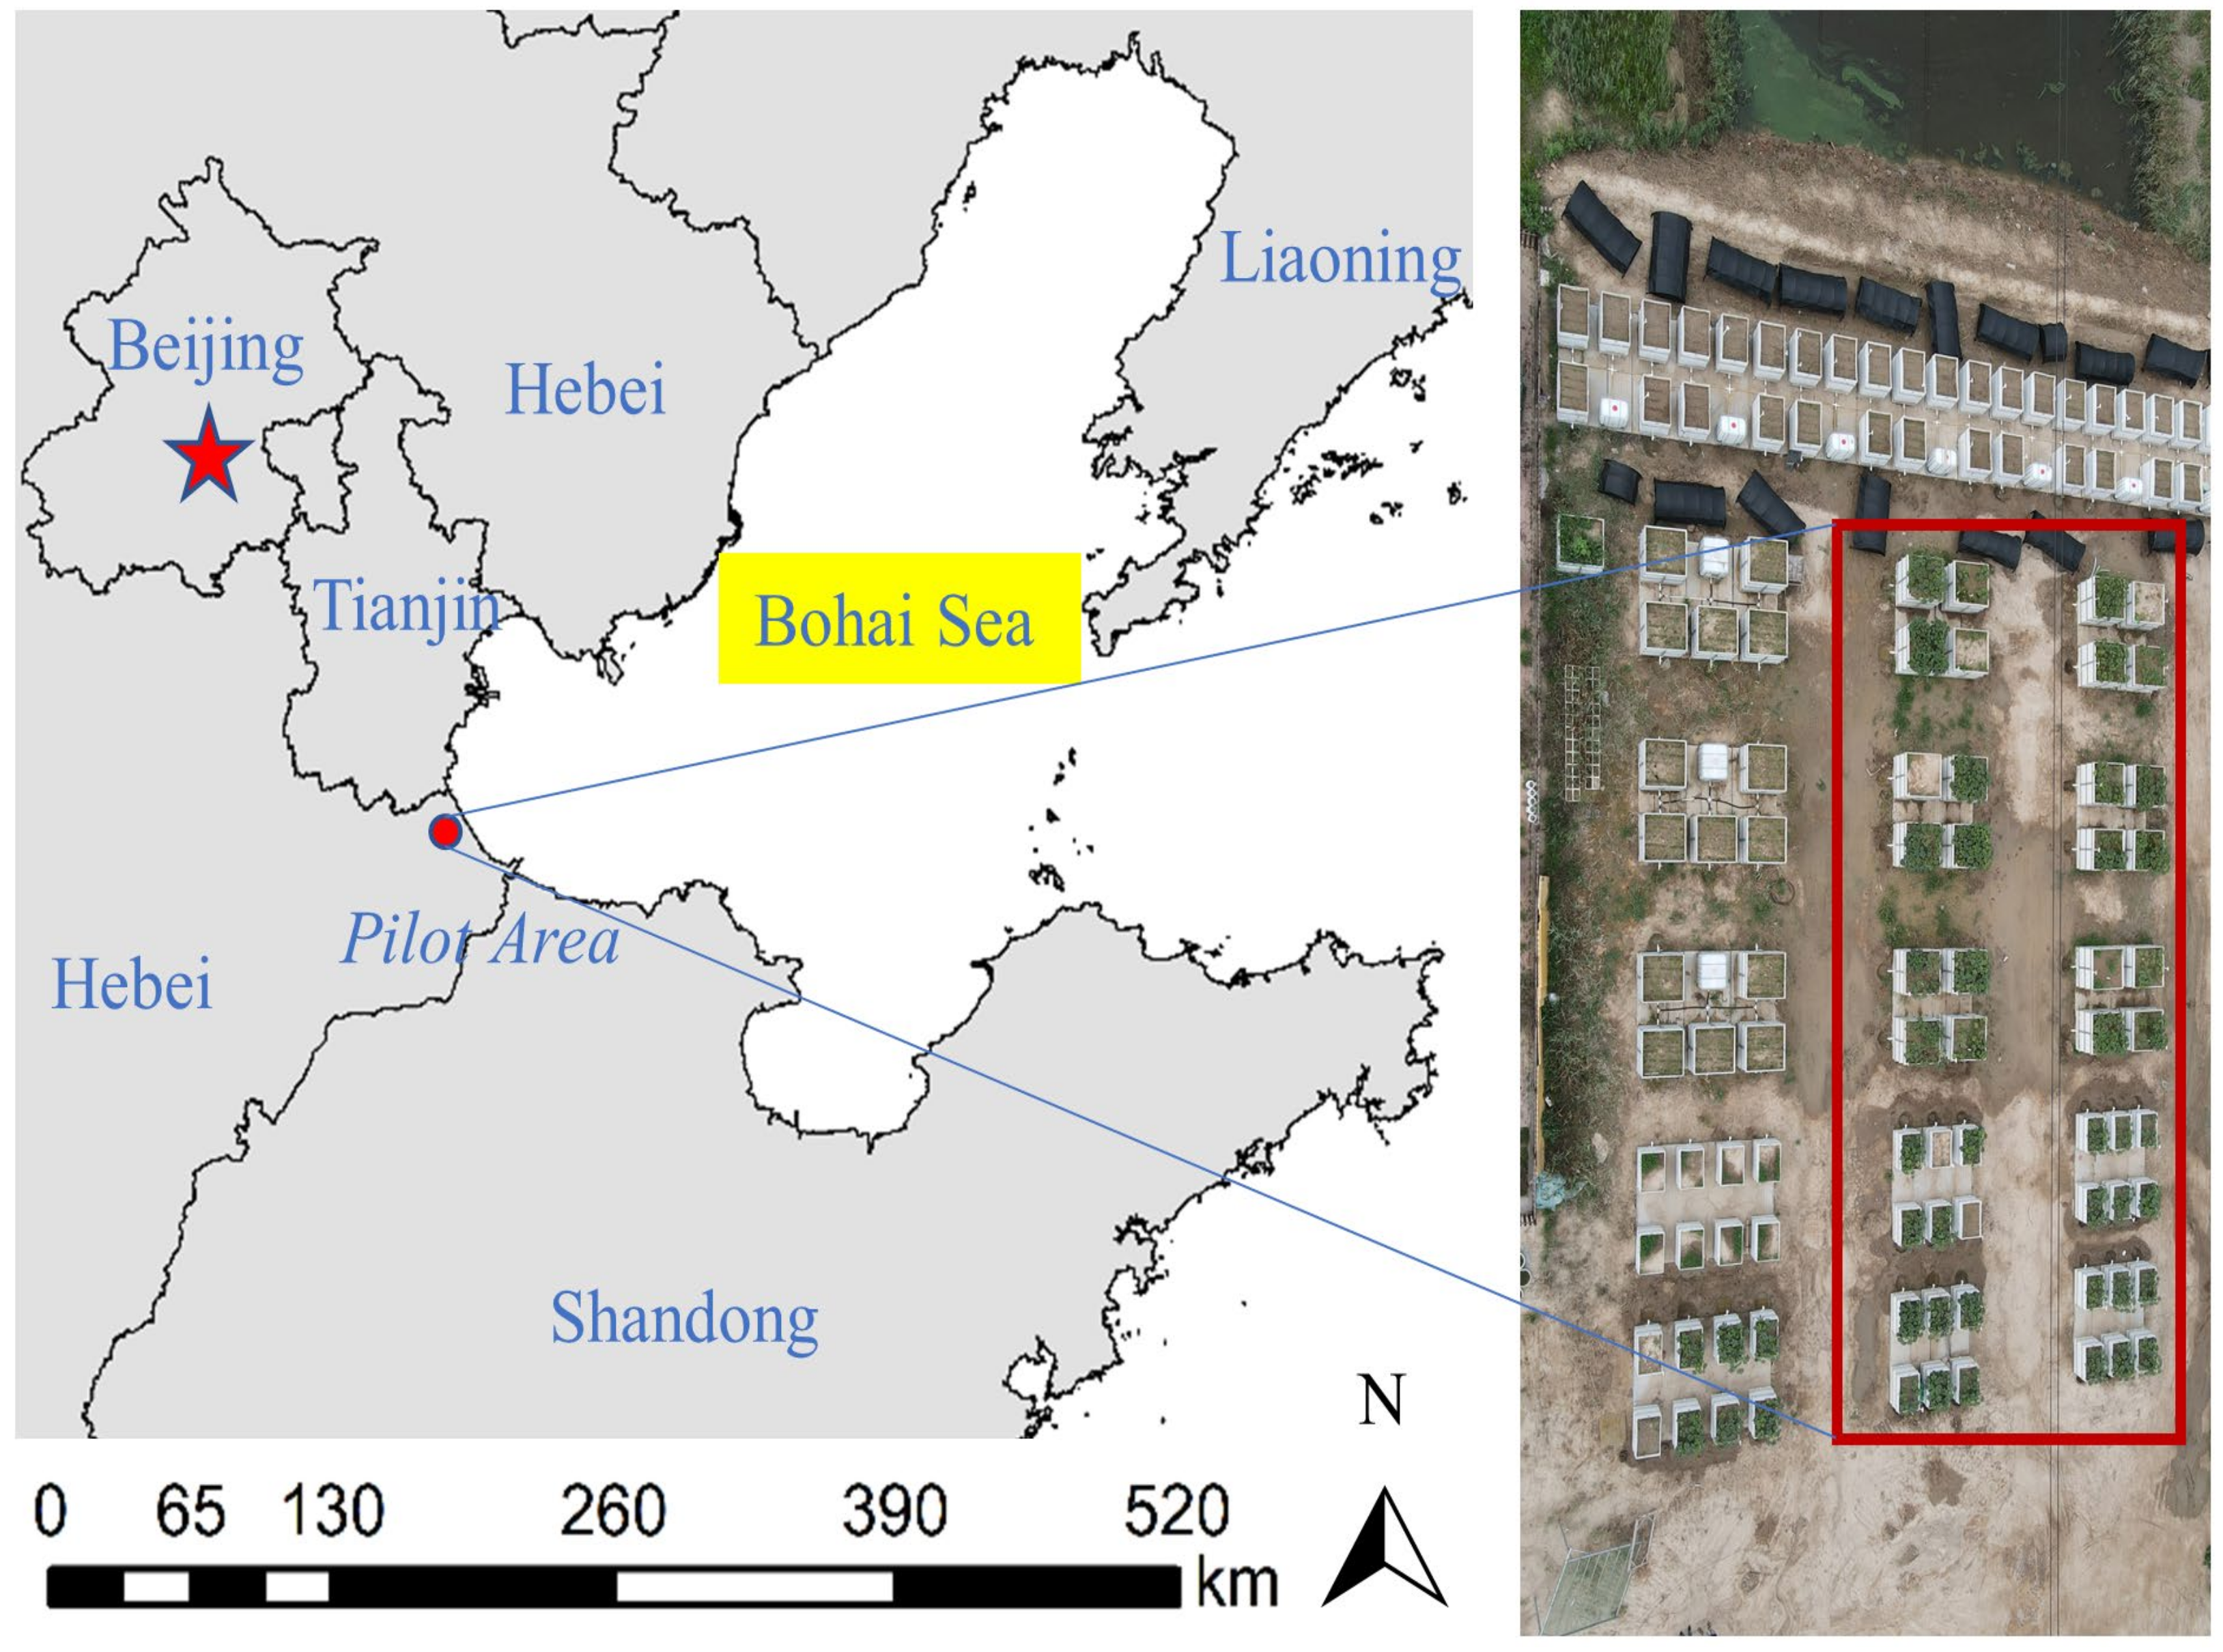
A soil box experiment was conducted at Nandagang government (117°05′–117°49′ E, 38°09′–38°39′ N) (Figure 2) in coastal saline area around Bohai Sea, Hebei Province, North China from April 2019 to November 2020. The soil salt content in this area was 2–6 g·kg−1, soil type was Salic Fluvisol. The groundwater table range was 0.3 m to 1.2 m. This area belongs to Heilonggang Basin in North China Alluvial Plain. It is a flat coastal plain with many pits and puddles.
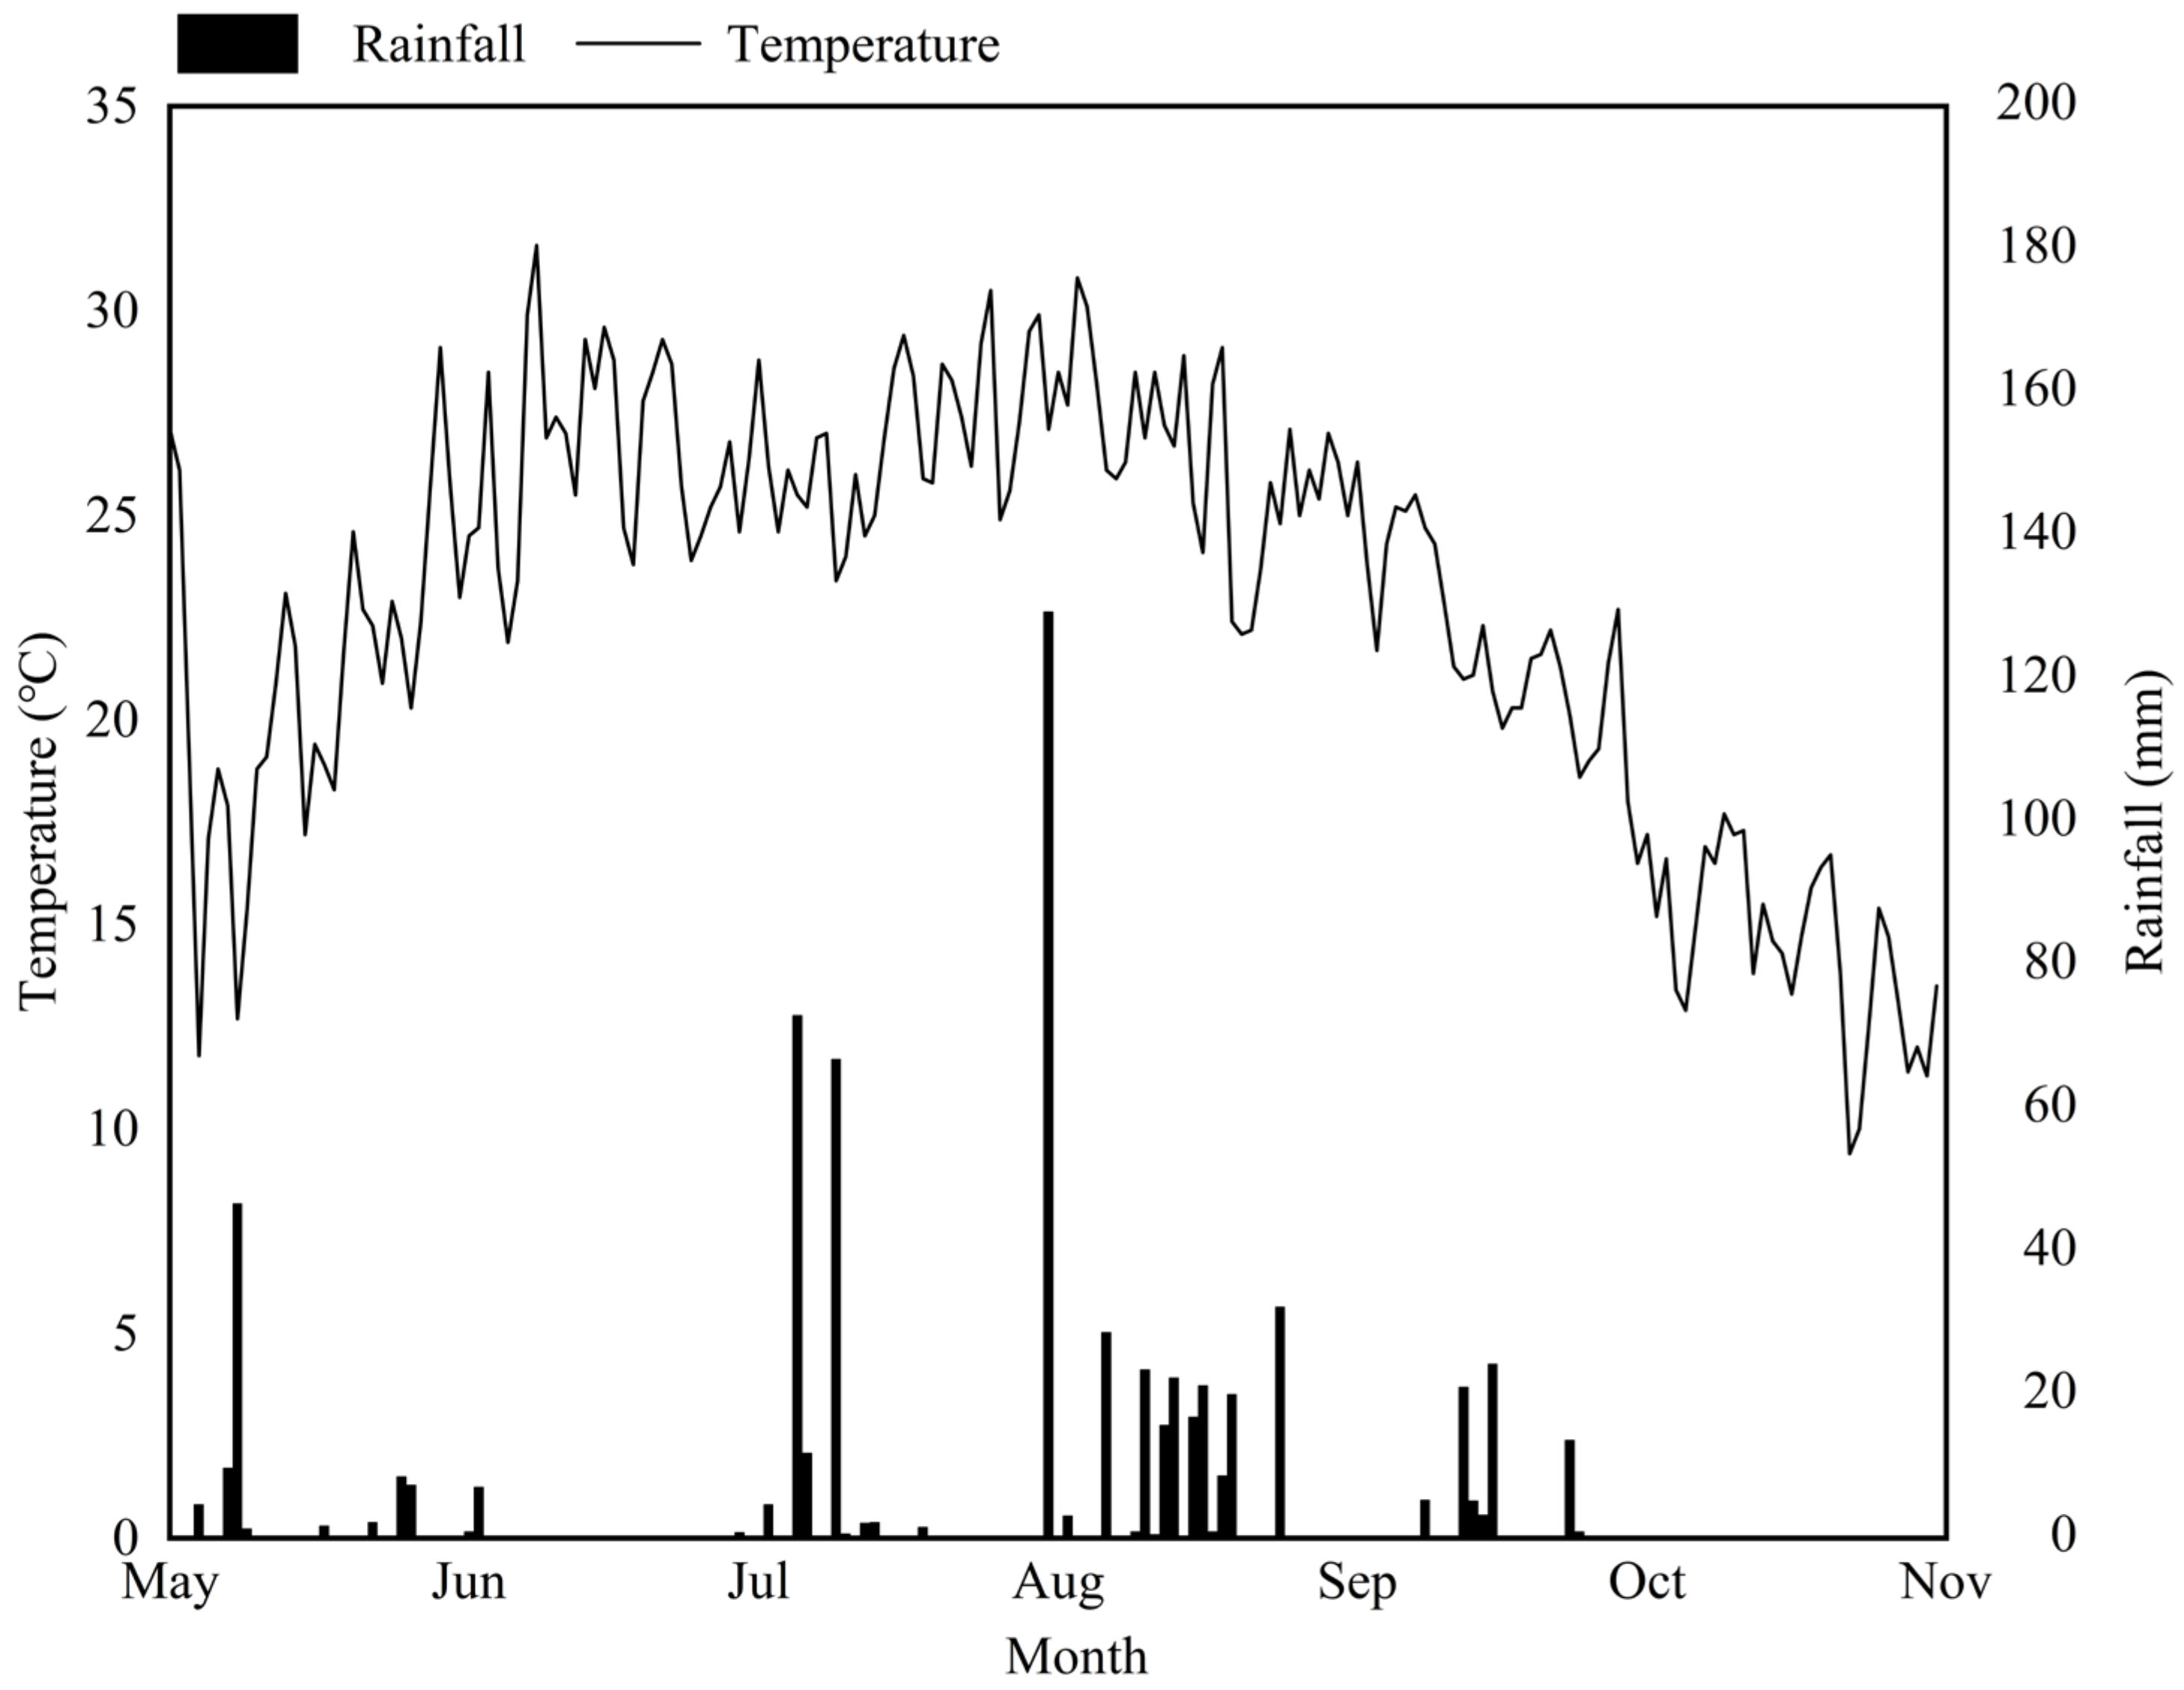
The climate of this area belongs to continental monsoon with less precipitation in spring and winter, but rich in summer. The average annual precipitation is about 660 mm, about 65% of annual precipitation concentrate in July–August. The average annual evaporation is about 1980 mm, which is 3 times the total annual average precipitation. The effective rainfall in okra growth period (May–November) was 653.1 mm during 2020 (Figure 3).

2.2. Experiment Design and Management

In this study, the simulation boxes with volume of 1.5 × 1.5 × 1.5 m3 were prepared by pasting 1 cm thick polyethylene plates fixed with steel pipes and the gaps between the plates were welded with plastic covered electrode. A perforated corrugated pipe with a diameter of 4 cm was installed in the middle of the box bottom as a pipe drain, the pipe was sleeved with a sealed nylon mesh cloth, and a valve was installed at the outlet of the pipe drain to control the drainage. After the pipe was installed, quartz sand as filter material was filled 30 cm deep at the bottom of the boxes. Then, the homogeneous coastal saline soil with the bulk density of 1.42 g·cm−3 (average bulk density of local saline soil) was filled in the boxes at 10 cm intervals until the whole soil depth (1 m) was reached. A 20 cm space was left from the soil surface to top of the wall of box for rainfall collection.
The soil sample was taken from the local saline soil in the experiment site. After air-drying and passing through 2 mm sieve, the soil sample was mixed and made uniform in salinity during the start of experiment in April 2019. The physical and chemical properties of soil taken to fill the boxes are listed in Table 1. Soil texture was silt soil with a small hydraulic conductivity and high sodium adsorption ratio (SAR). In order to make the soil structure of the simulation box closer to the field condition, the simulation box was left untouched for one year (April 2019 to May 2020) after filling the boxes with soil. The valve of the boxes was not opened to discharge during this period.
The cultivar of okra planted in this study was Abelmoschus esculentus L. cv. Wufu.The okra with five planting densities (4, 8, 12, 16 and 20 plants per box) was planted in May 2020 to obtain five groups of root densities, with a bare simulation box as a control (Table 2). Before sowing in the beginning of May, a basal fertilizer dose of N, P2O5 and K2O were applied in each simulation box at the rates of 120, 100 and 50 kg·ha−1, respectively. Each planting density was replicated 4 times. A total of 24 simulation boxes were placed on the flat land using a completely random design (CRD). During the seeding period of okra, supplemental freshwater (about 50 L) was pre-showered into the simulation box to ensure the germination of okra.

2.3. Observations and Analyses

The initial soil samples were taken before sowing in May 2020 while the last soil samples were taken at the beginning of November 2020. Soil was sampled by layers (20 cm) with an auger (5.0 cm diameter, 100 cm high) in the soil profile (up to 1 m depth). Three points were randomly selected in each simulation box to take samples and the soil in the same soil layer was mixed into a sample. The soil samples were air-dried, passed through a 1 mm sieve, and then water-soluble salts content of 1:5 soil–water extract was measured. The contents of cations including ions of Ca2+, Mg2+, K+, Na+ and anions of Cl, SO42−, NO3 were determined by ion chromatography (ICS-2100, DIONEX, Sunnyvale, CA, USA). The contents of CO32− and HCO3 were determined by potentiometric titration [28]. The salinity was calculated as the sum of all the above-measured ions. The average salinity value (Sa) in the soil profile (0–100 cm) of each group was also calculated:
Sp = i = 1 m S m
Sa = i = 1 n S p n
where Sp is the average salinity value of the soil profile (0–100 cm) in each simulation box, m is the number of soil layers, n is the number of replicates, S is the salinity of each soil layer in the simulation box.
Sodium adsorption ratio (SAR) (mmol L)−1/2 was used to analyze the potential risk of soil alkalization. The formula for calculating SAR (mmol·L)−1/2 of effluent was as follows [29]:
SAR = Na + Ca 2 + + Mg 2 +
Here, the unit of concentration is mmol·L−1.
The calculation method of average SAR in soil profile of each group was the same as average salinity value in soil profile of each group.
Soil desalination rate and SAR reduction rate were used to analyze the improvement effect in subsurface pipe drainage of coastal saline soil. The calculation formula was as follows:
DR = S 1 S 2 S 1 × 100 %
RR = SAR 1 SAR 2 SAR 1 × 100 %
where DR is desalination rate (%), S1 is the salinity (g·kg−1) of soil which was sampled before okra was planted (before leaching), and S2 is the salinity (g·kg−1) of soil after okra harvest (after leaching). RR represents reduction rate (%) of SAR. SAR1 represents the SAR (mmol·L)−1/2 of soil which was sampled before okra was planted (before leaching), and SAR2 represents SAR (mmol·L)−1/2 of soil after okra harvest (after leaching).
During the growth season of okra, high rainfall occurred four times. The drainage water was collected through opening the valve of the simulation box within 48 h after occurrence of above four rainfall events. Then, the volume of collected discharged water was measured by a cylinder. The cumulative drain outflow was the sum of four times of drain outflow (L).
After okra stopped growth in the beginning of November, the soil in the simulation box was dug out from every 10 cm layer and the roots of okra were washed out to determine the dry root weight by using the oven-dry method at 70 °C for 48 h. Root weight density (μg·cm−3) was used to describe and analyze the density and distribution of okra roots. The RWD of each simulation box was calculated using the following formula:
RWD = DW/V
DW (μg) is the total root dry mass of the sum of root dry mass in all soil layers within a simulation box while V (cm3) is the volume of saline soil in the simulation box (2,700,000 cm3). Using a vertical root distribution model to calculate root distribution coefficient (β, dimensionless), the calculation formula was as follows [30]:
Y = 1 − βd
Y is the cumulative percentage (%) of root biomass with a depth of d (cm) from surface to the bottom of soil.
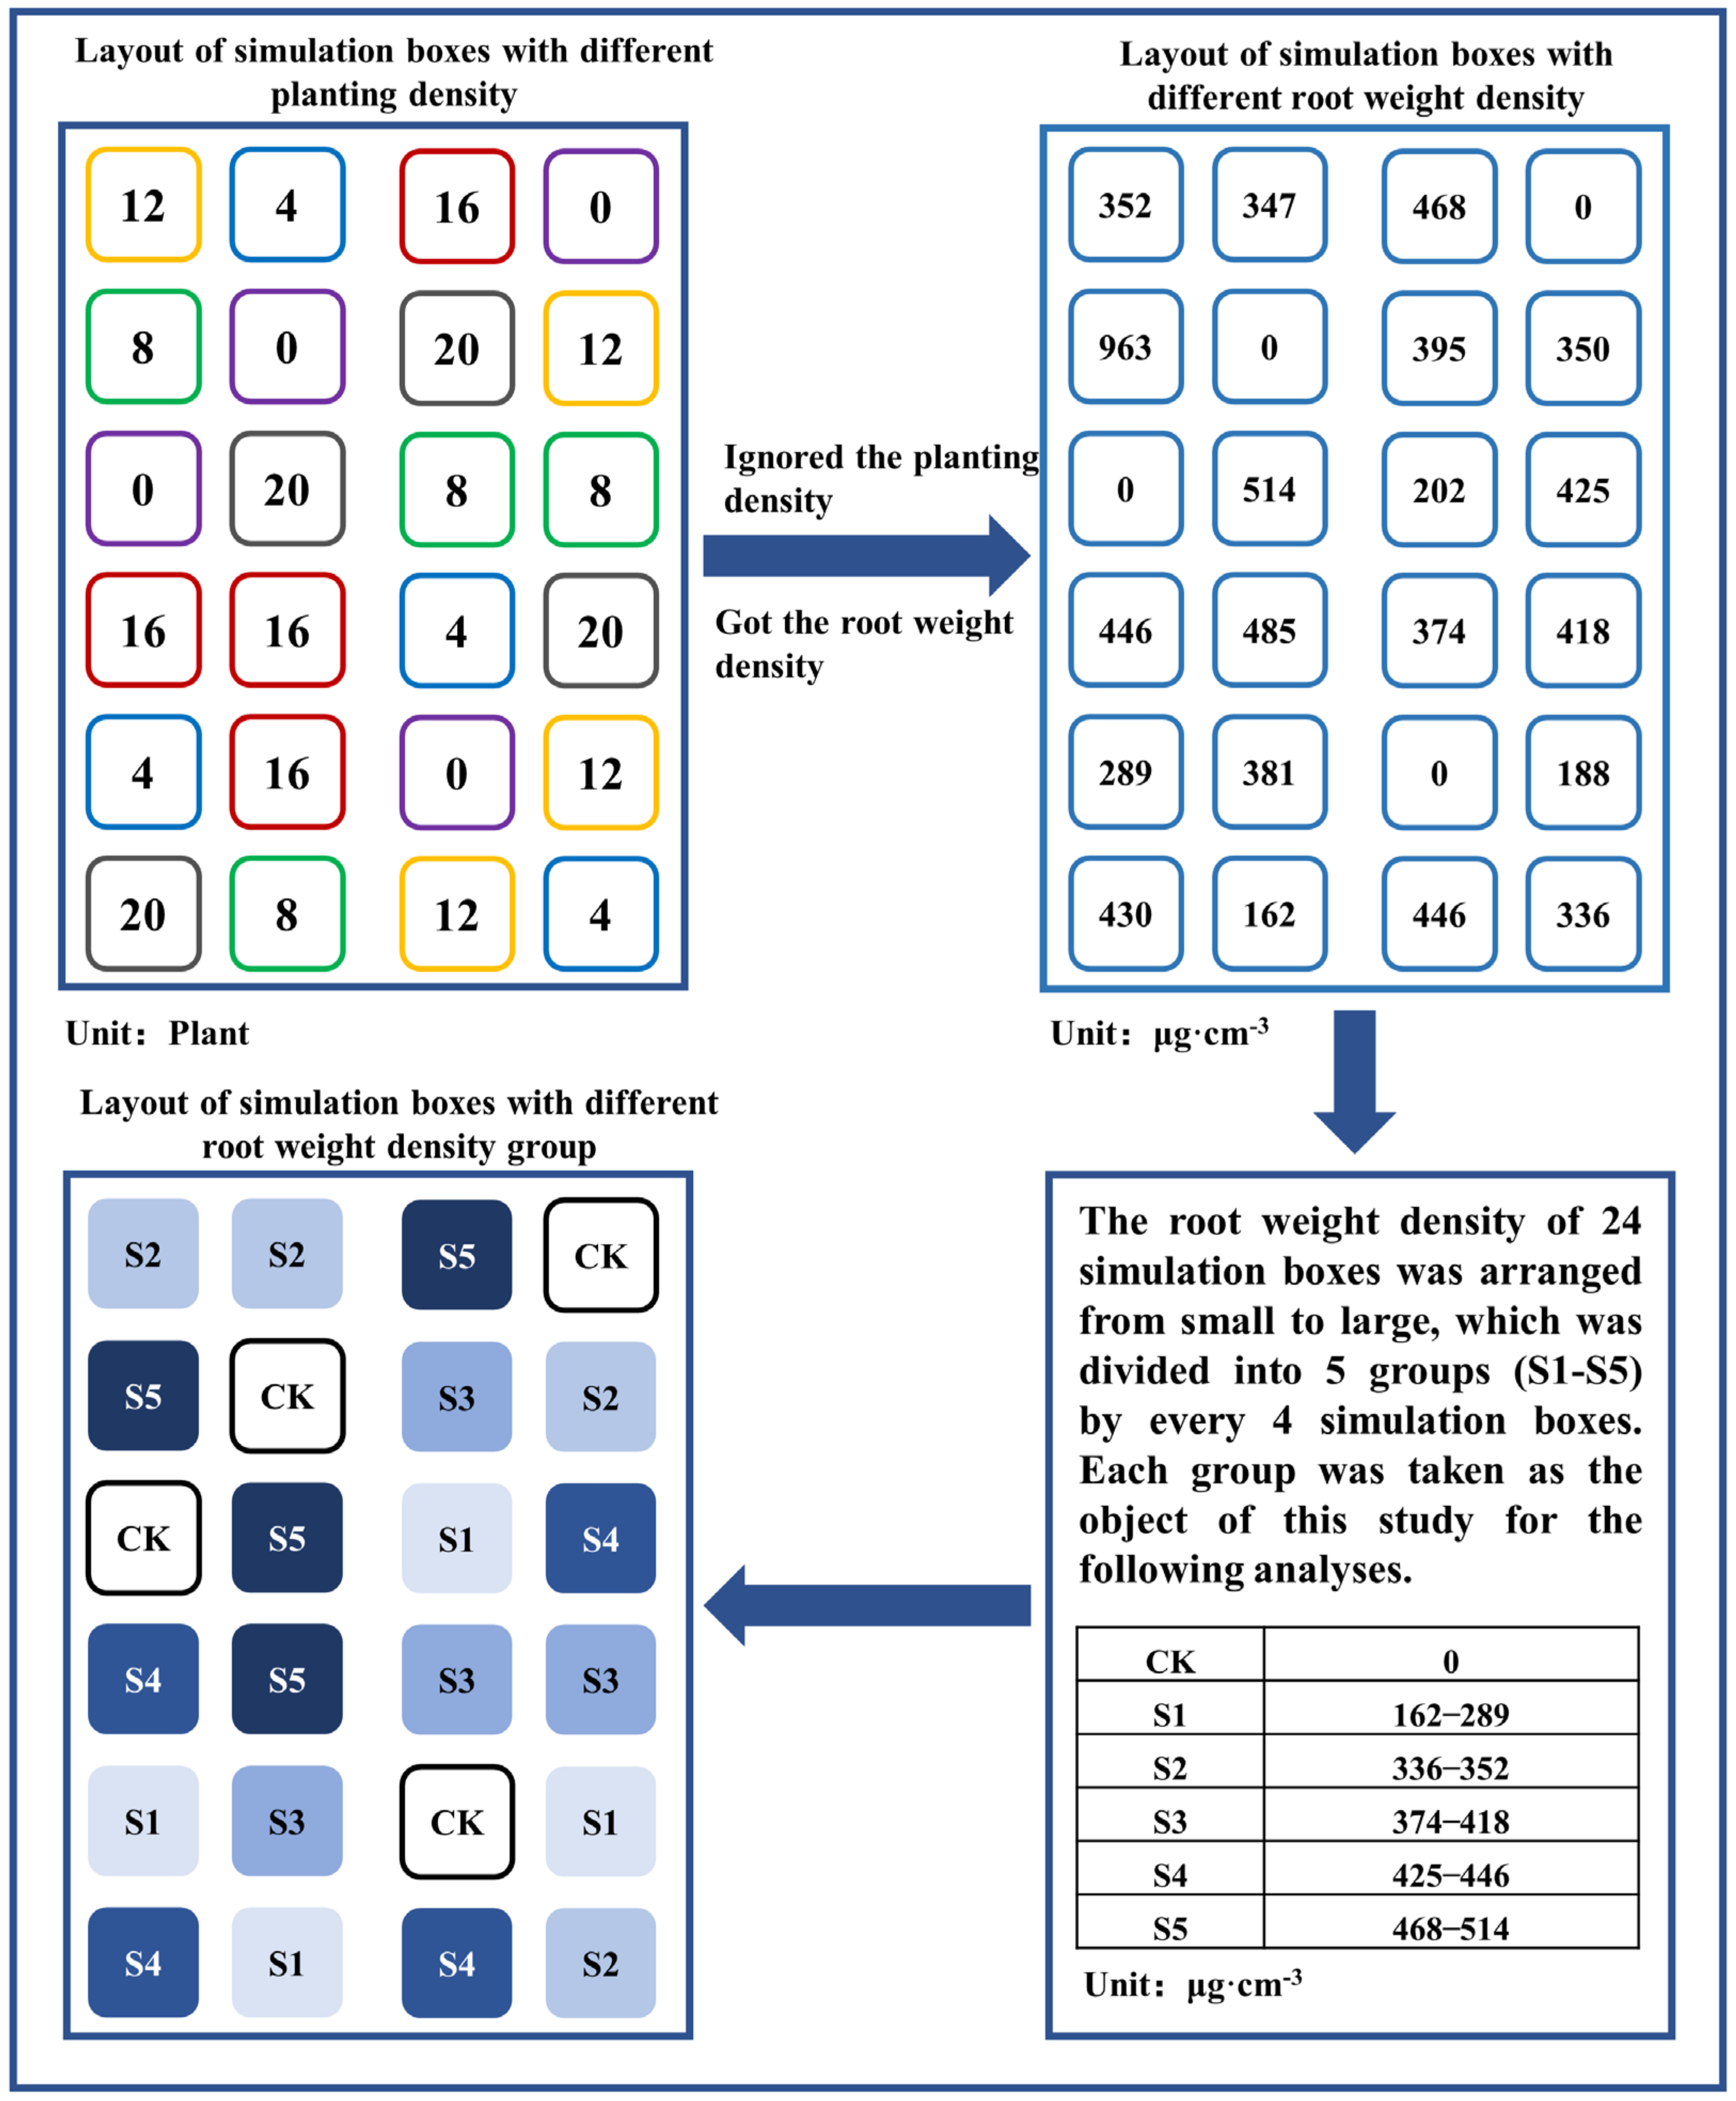
Some studies indicated that salt stress affects the development and growth of okra root system [31], and the heterogeneity of the salts present in the soil will increase the variation in okra RWD under the same planting density. In order to eliminate this effect, the RWD of 20 simulation boxes was arranged from small to large and the RWD of every 4 simulation boxes was divided into 5 groups (Figure 4). Each group from S1 to S5 was analyzed as the treatment object of this study (Figure 5). The difference of RWD among five groups reached a significant level (p < 0.05). There were highly significant differences between S5 and S1, S2 and S3, and between S4 and S1 and S2 (p < 0.01).

2.4. Statistical Analyses

Paired t-test was used to evaluate the difference of salinity and SAR in soil sampled before and after leaching (p < 0.05). The normality of data was tested by Shapiro–Wilk method, and the homogeneity of data was tested based on the mean. One-way analysis of variance (ANOVA) and multiple comparisons (LSD test) were used to analyze the differences of RWD, the cumulative drain outflow, soil salt content, and SAR between different groups. Regression analysis was used to study the relationship between the cumulative drain outflow, the desalination rate, the decreasing rate of SAR, and the RWD of okra. A computer software SPSS 26.0 (SPSS Inc., Chicago, IL, USA) was used for statistical analysis. The software Origin Pro 2018 (Origin Lab Inc., Northampton, MA, USA) was used for graphical representation.

3. Results

3.1. Root Vertical Distribution

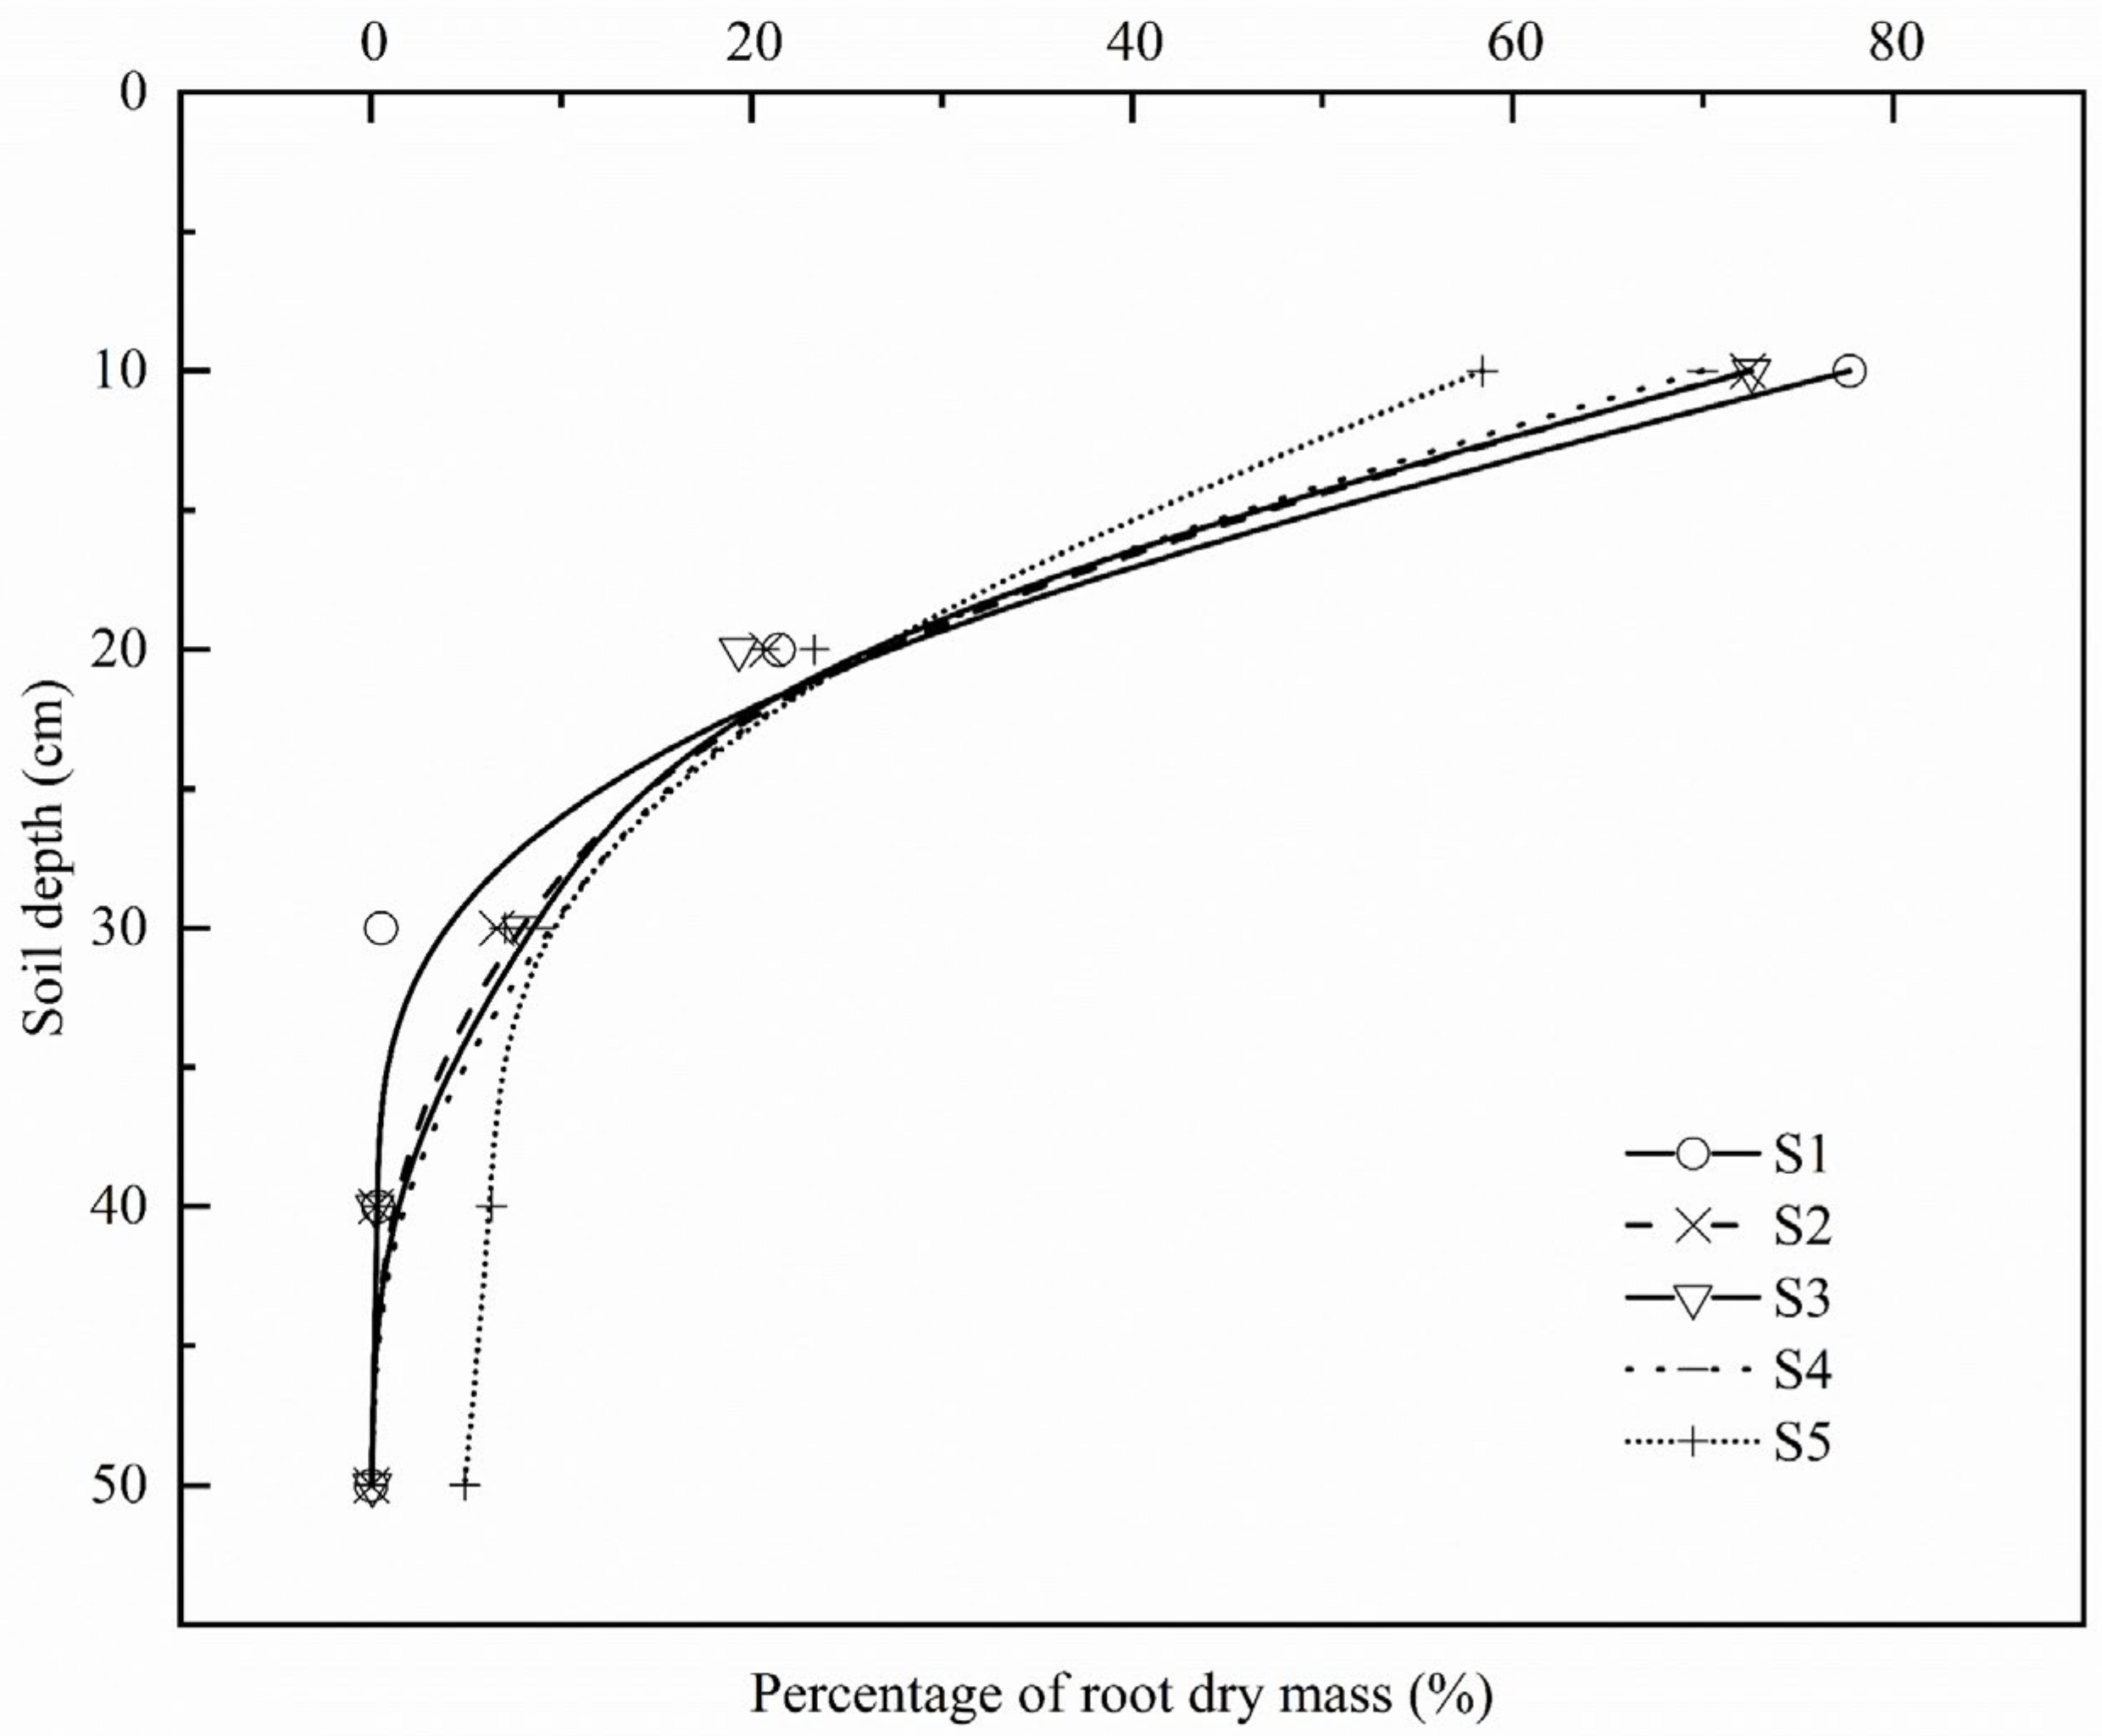
The RWD significantly affected the vertical distribution characteristics of okra root dry mass in the soil profile (Figure 6). The percentage of root dry mass in 0–20 cm soil layer decreased with the increase in RWD, but increased in 20–50 cm soil layer. For 40–50 cm soil depth, the percentage of root dry mass in all groups except for S5 was almost reduced to 0. Group S1 intersected with all other groups at the soil depth of 20 cm.
The roots of the five groups were fitted with the vertical distribution model of roots (Table 3). The curve of five groups fitted very well, for which R2 was 0.96 or above. RWD had great influence on root distribution coefficient (β) of okra, which decreased with the increase in RWD. Root distribution coefficient (β) increased to 115% of itself from 0.85 of S1 to 0.98 of S5. From S1 to S2, β increased slightly by 0.03. From S2 to S4, β increased very slightly by 0.01, and there was no significant change. From S4 to S5, β significantly increased by 0.09.

3.2. The Drain Outflow

In the process of four times of drainage, the drain outflow between different groups had no significant difference due to the large difference within groups (Table 4). In the first and second drainage process, the drain outflow of S1 was the highest, while that of S5 was the lowest. The drain outflow of S1 and S5 was 189% and 192%, about 140% and 150% of the control, respectively. In the third drainage process, the drain outflow of S2 was the highest, while that of the CK was the least. The drain outflow of S2 was 242% of the control. In the fourth drainage process, the drain outflow of S3 was the highest, while that of the S1 was the least. The drain outflow of S3 was 161% of S5, and it was about 126% of the CK.
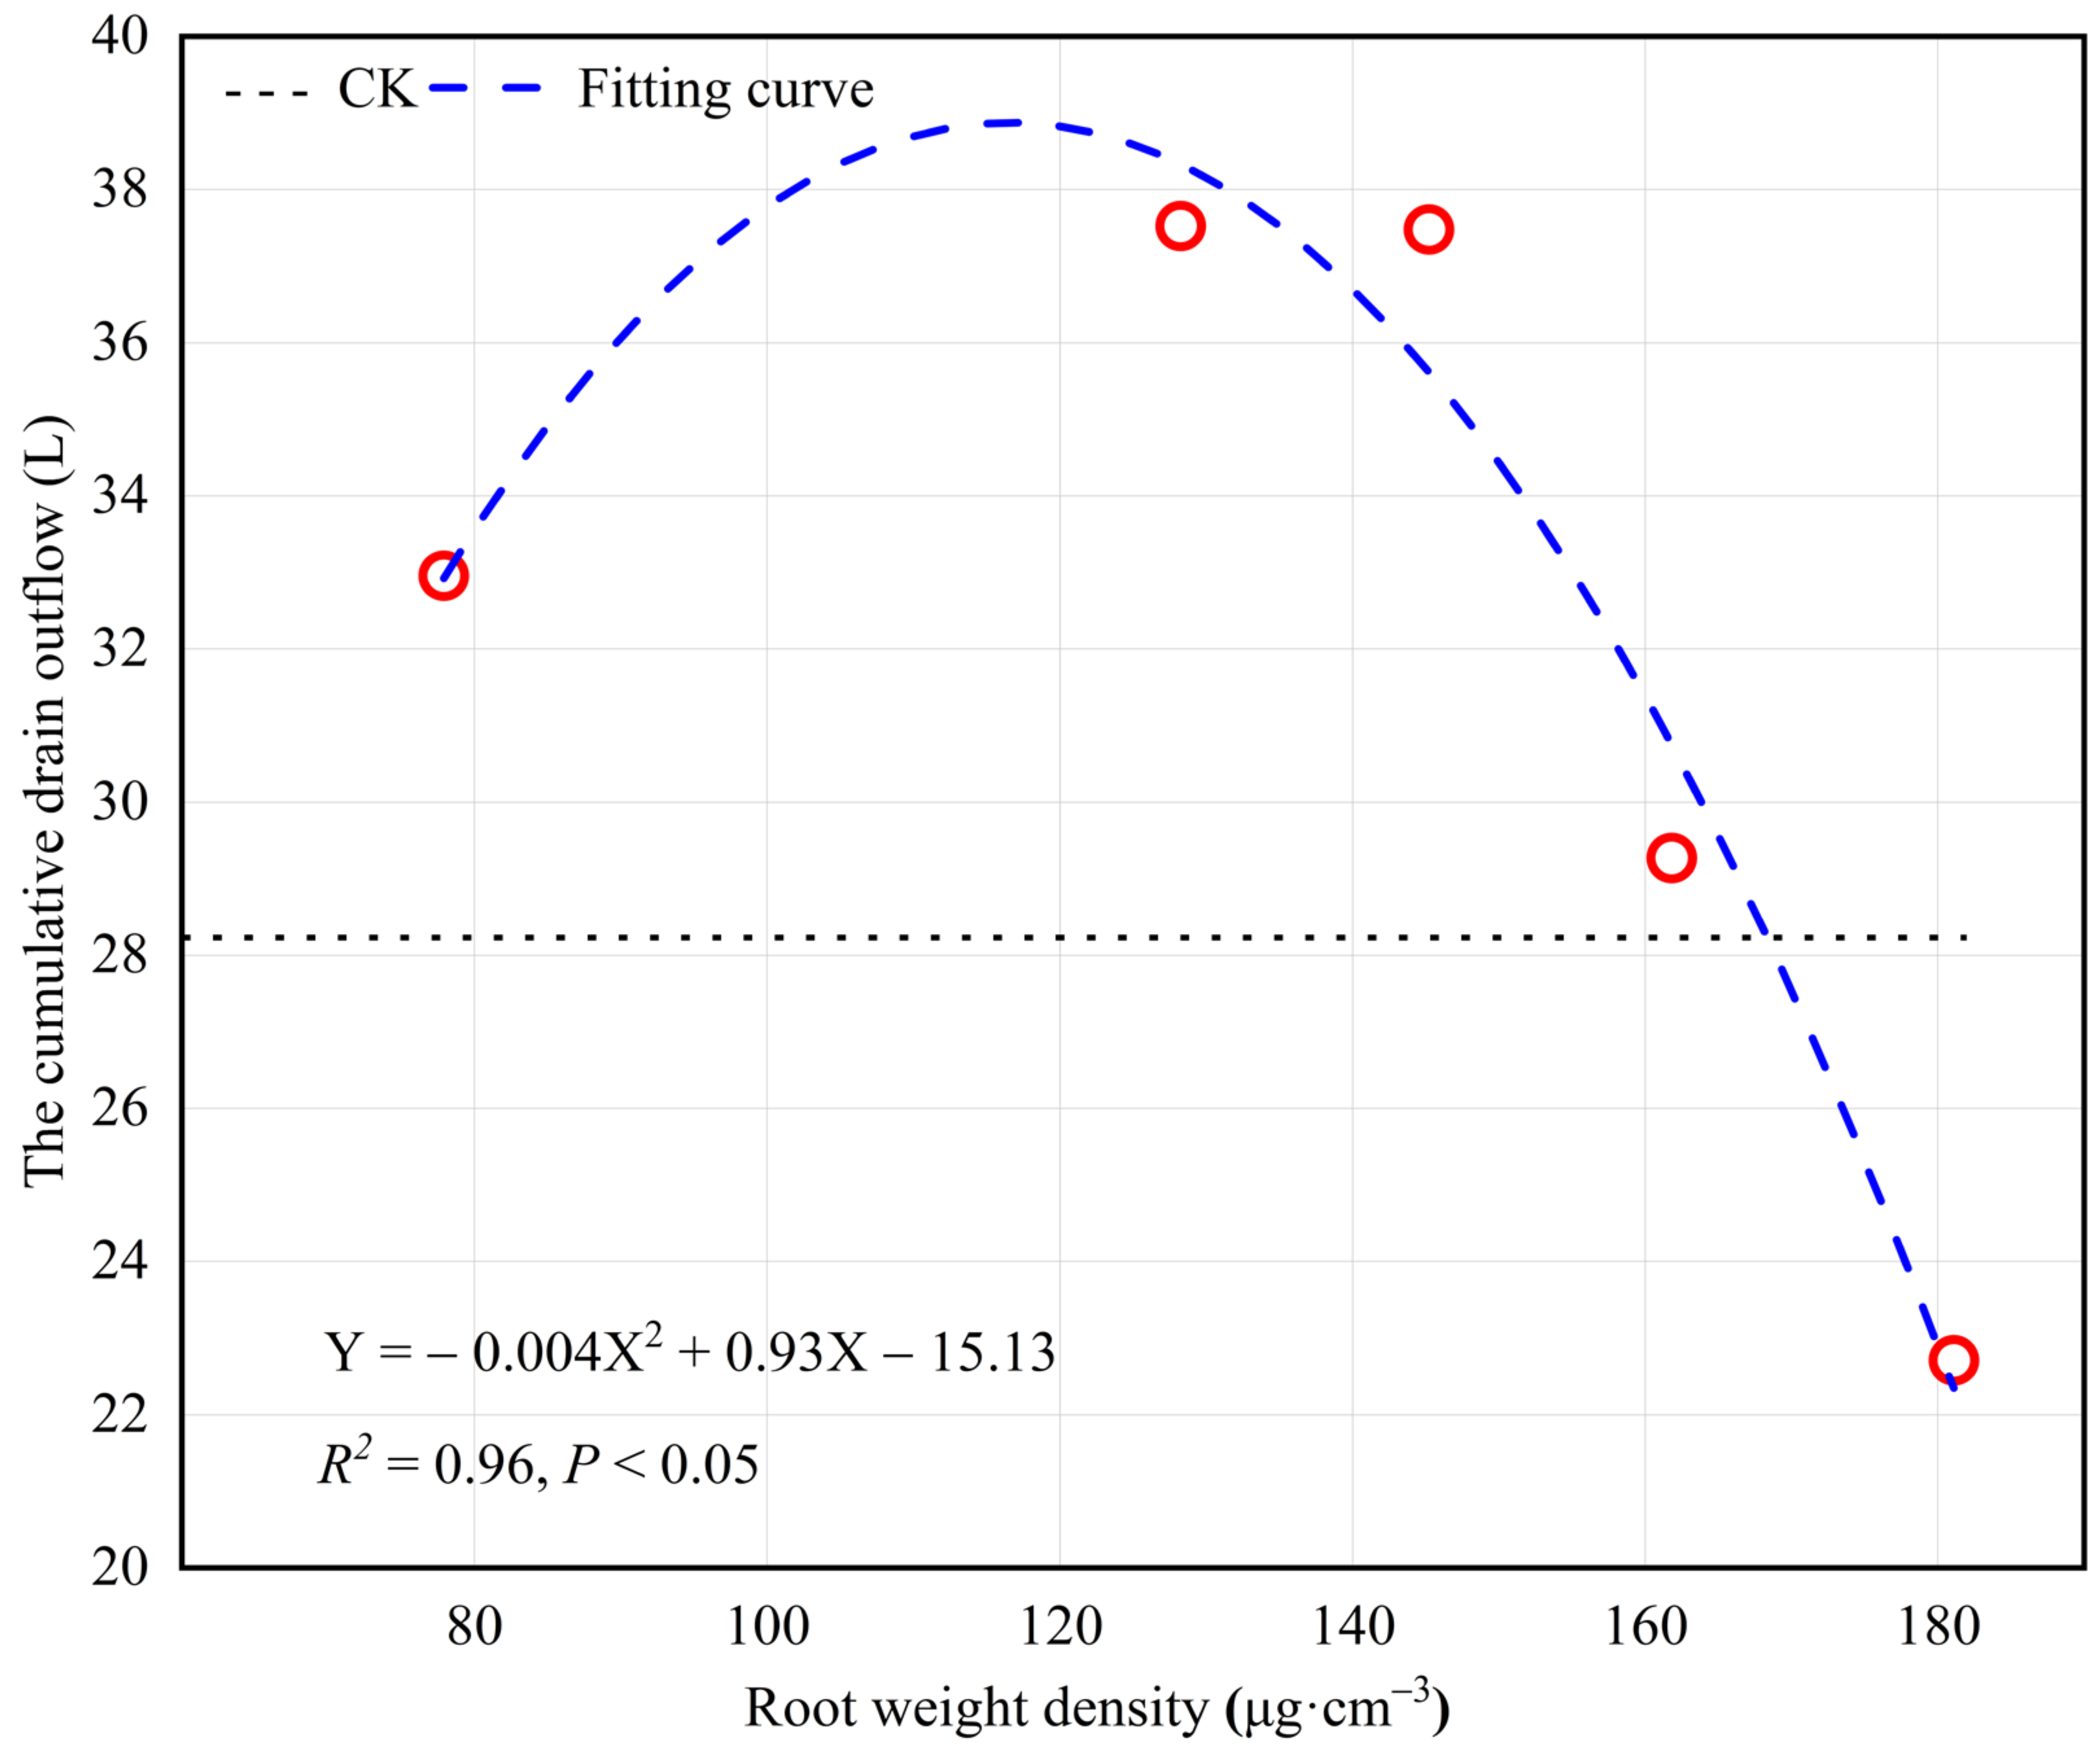
Regression analyses were performed on the RWD with the cumulative drain outflow (Figure 7). With the increase in RWD of okra, the cumulative drain outflow increased first and then decreased. The cumulative drain outflow of S2 was the highest and about 165% of that of S5. The fitting curve was a downward parabola and reached its maximum at the RWD of 116 μg·cm−3, which was 140% of the cumulative drain outflow in CK. Except for group S5, the cumulative drain outflow of all groups was greater than that of the control.

3.3. Soil Salt Content and Sodium Adsorption Ratio

3.3.1. Salt Content and Sodium Adsorption Ratio of Different Soil Layers

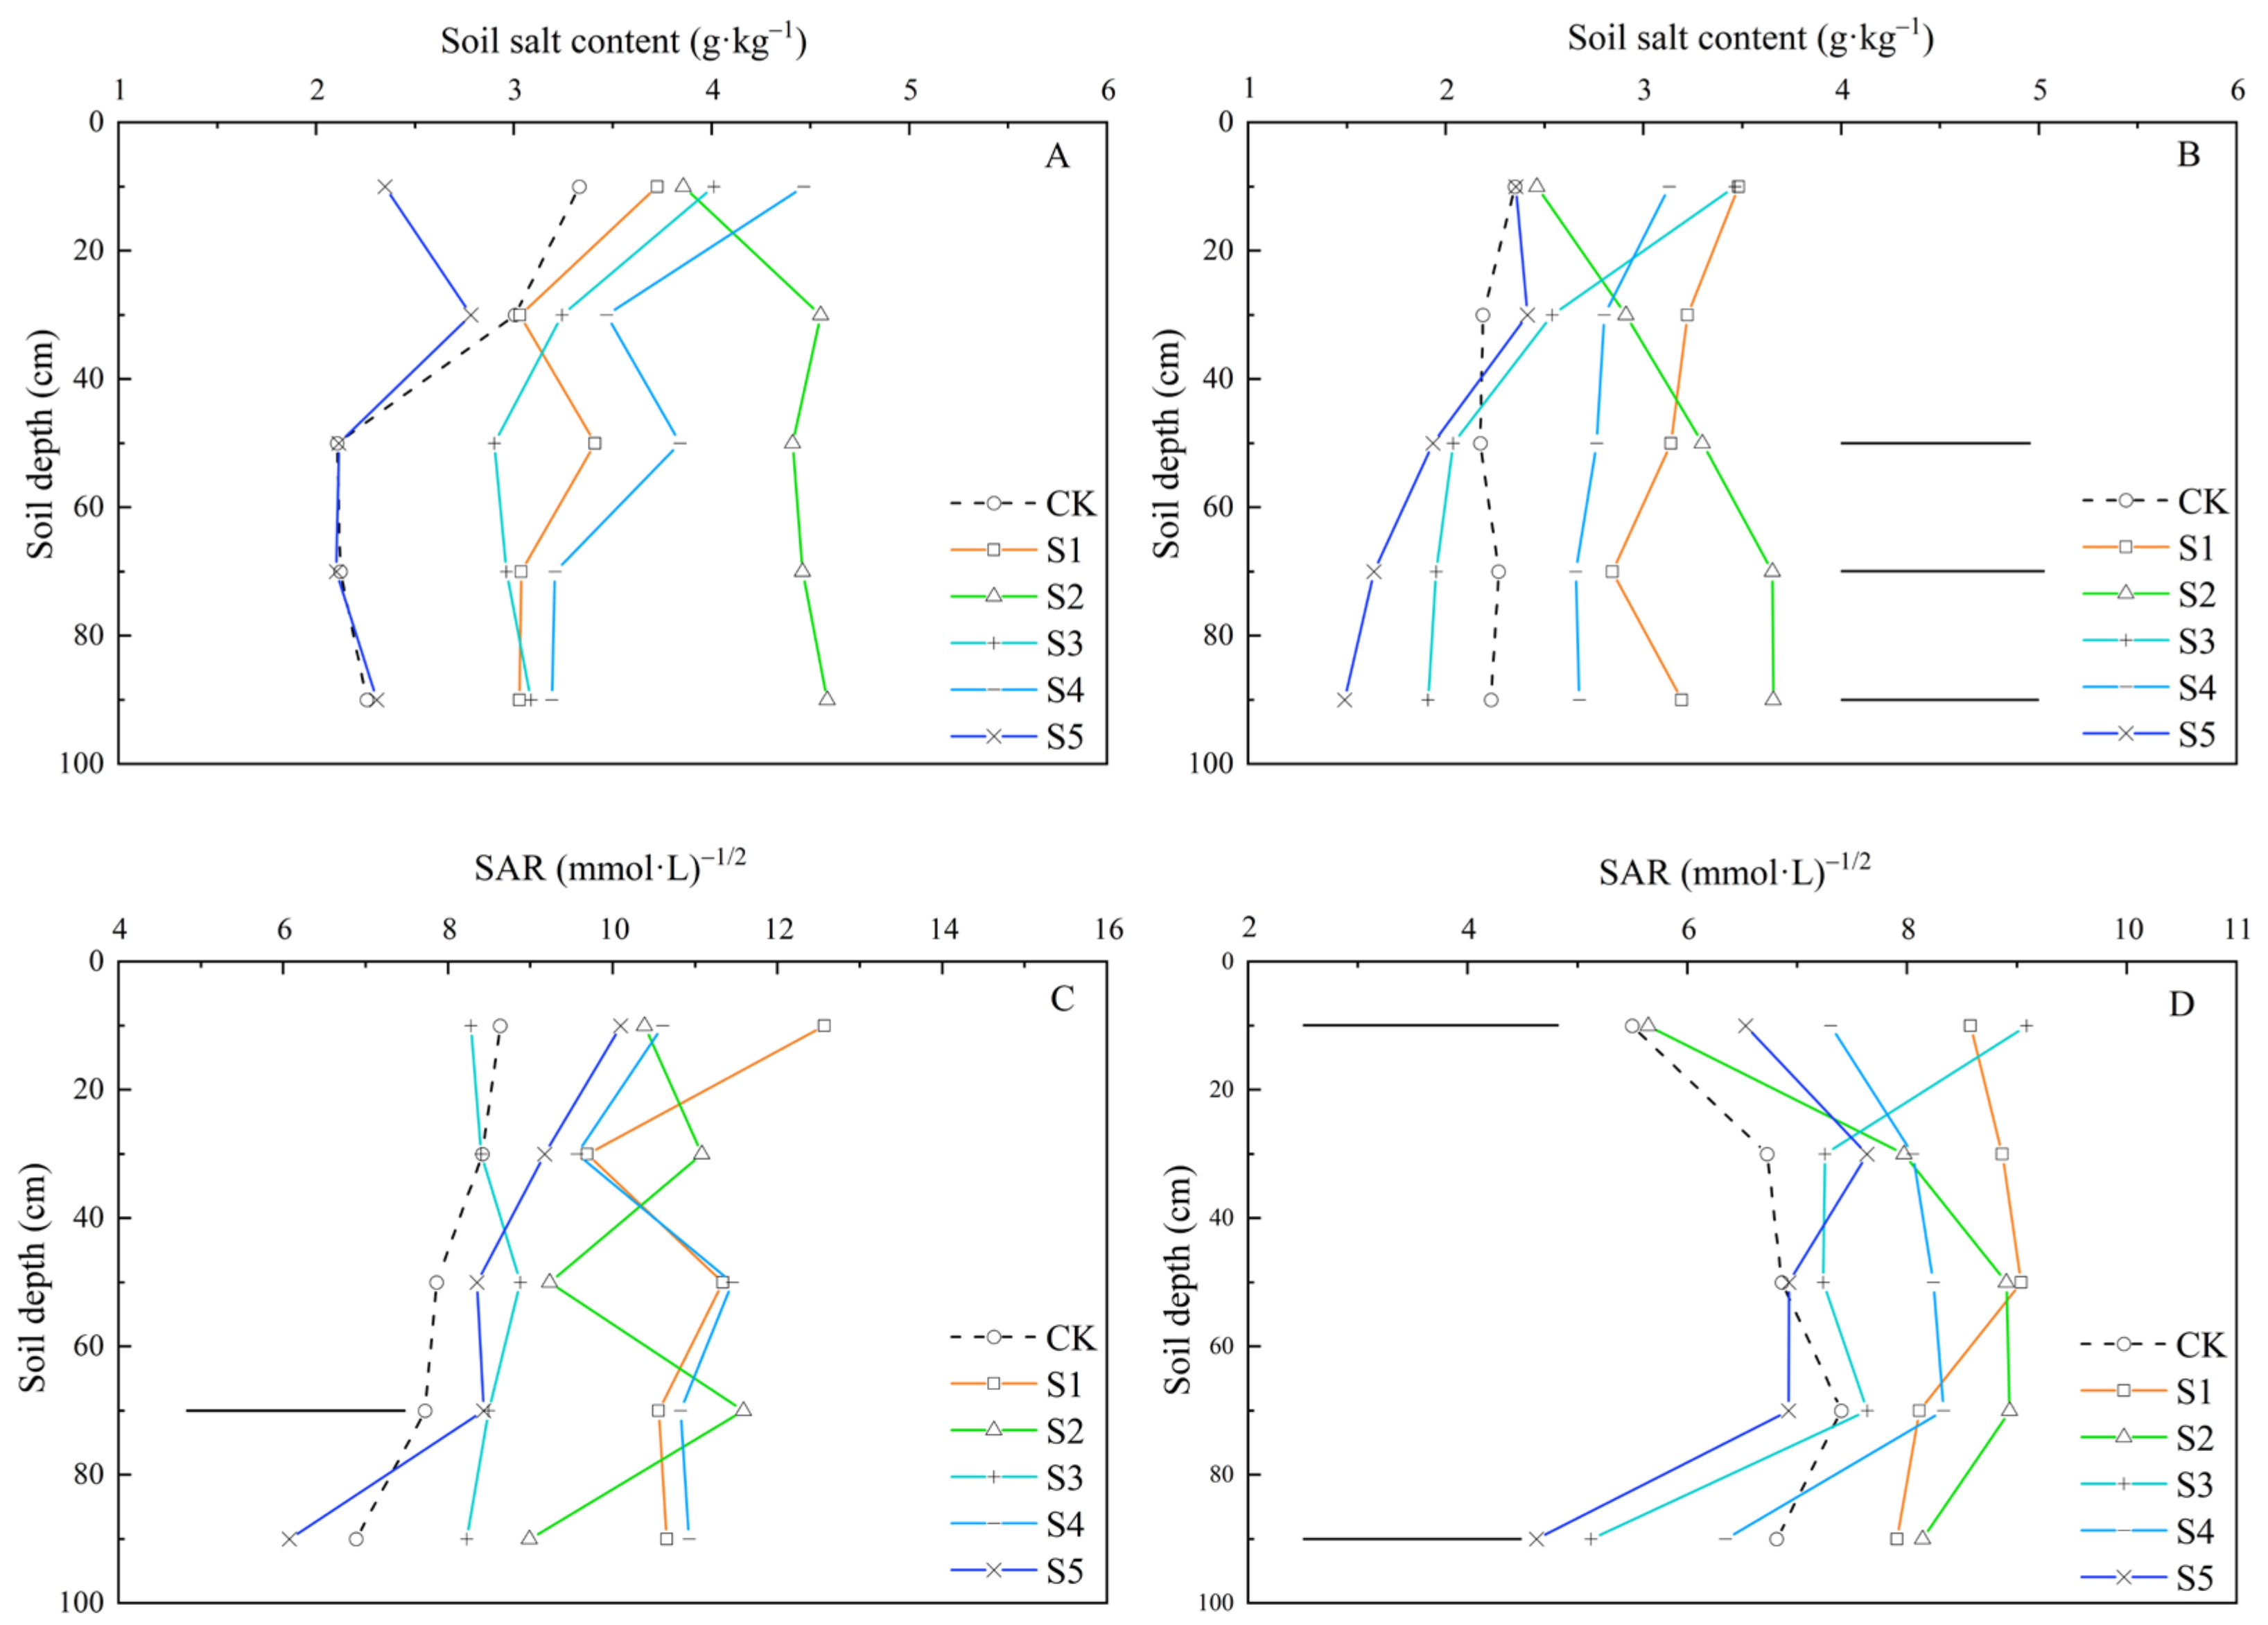
The salt content and SAR of soil sampled before and after leaching were analyzed (Figure 8). The salinity of each soil layer before leaching ranged between 2.10–4.58 g·kg−1, and the results of ANOVA in groups were not significant. Except for S2 and S5, the topsoil (0–20 cm) salt content of all groups was the highest among all soil layers. The salt contents of each soil layer after leaching ranged between 1.49–3.66 g·kg−1, and the result of ANOVA was significant in salt contents of 40–60 cm, 60–80 cm, and 80–100 cm soil layers (p < 0.05). Except S1 and S5, the topsoil salt content of different groups decreased significantly (p < 0.05) after leaching.
The SAR of each soil layer before leaching was 4.07–12.57 (mmol·L)−1/2. The results of variance analysis among groups in the 60–80 cm soil layer reached a significant level (p < 0.05). The SAR of topsoil (0–20 cm) of all groups was the highest or a higher level in all soil layers. After leaching, the SAR of each soil layer ranged 4.63–9.09 (mmol·L)−1/2, and the variance analysis results of SAR in the 0–20 cm and 80–100 cm soil layers were significant among the groups. Except S3, the SAR of topsoil and bottom soil layer in all groups was the lowest or a lower level in soil layers.
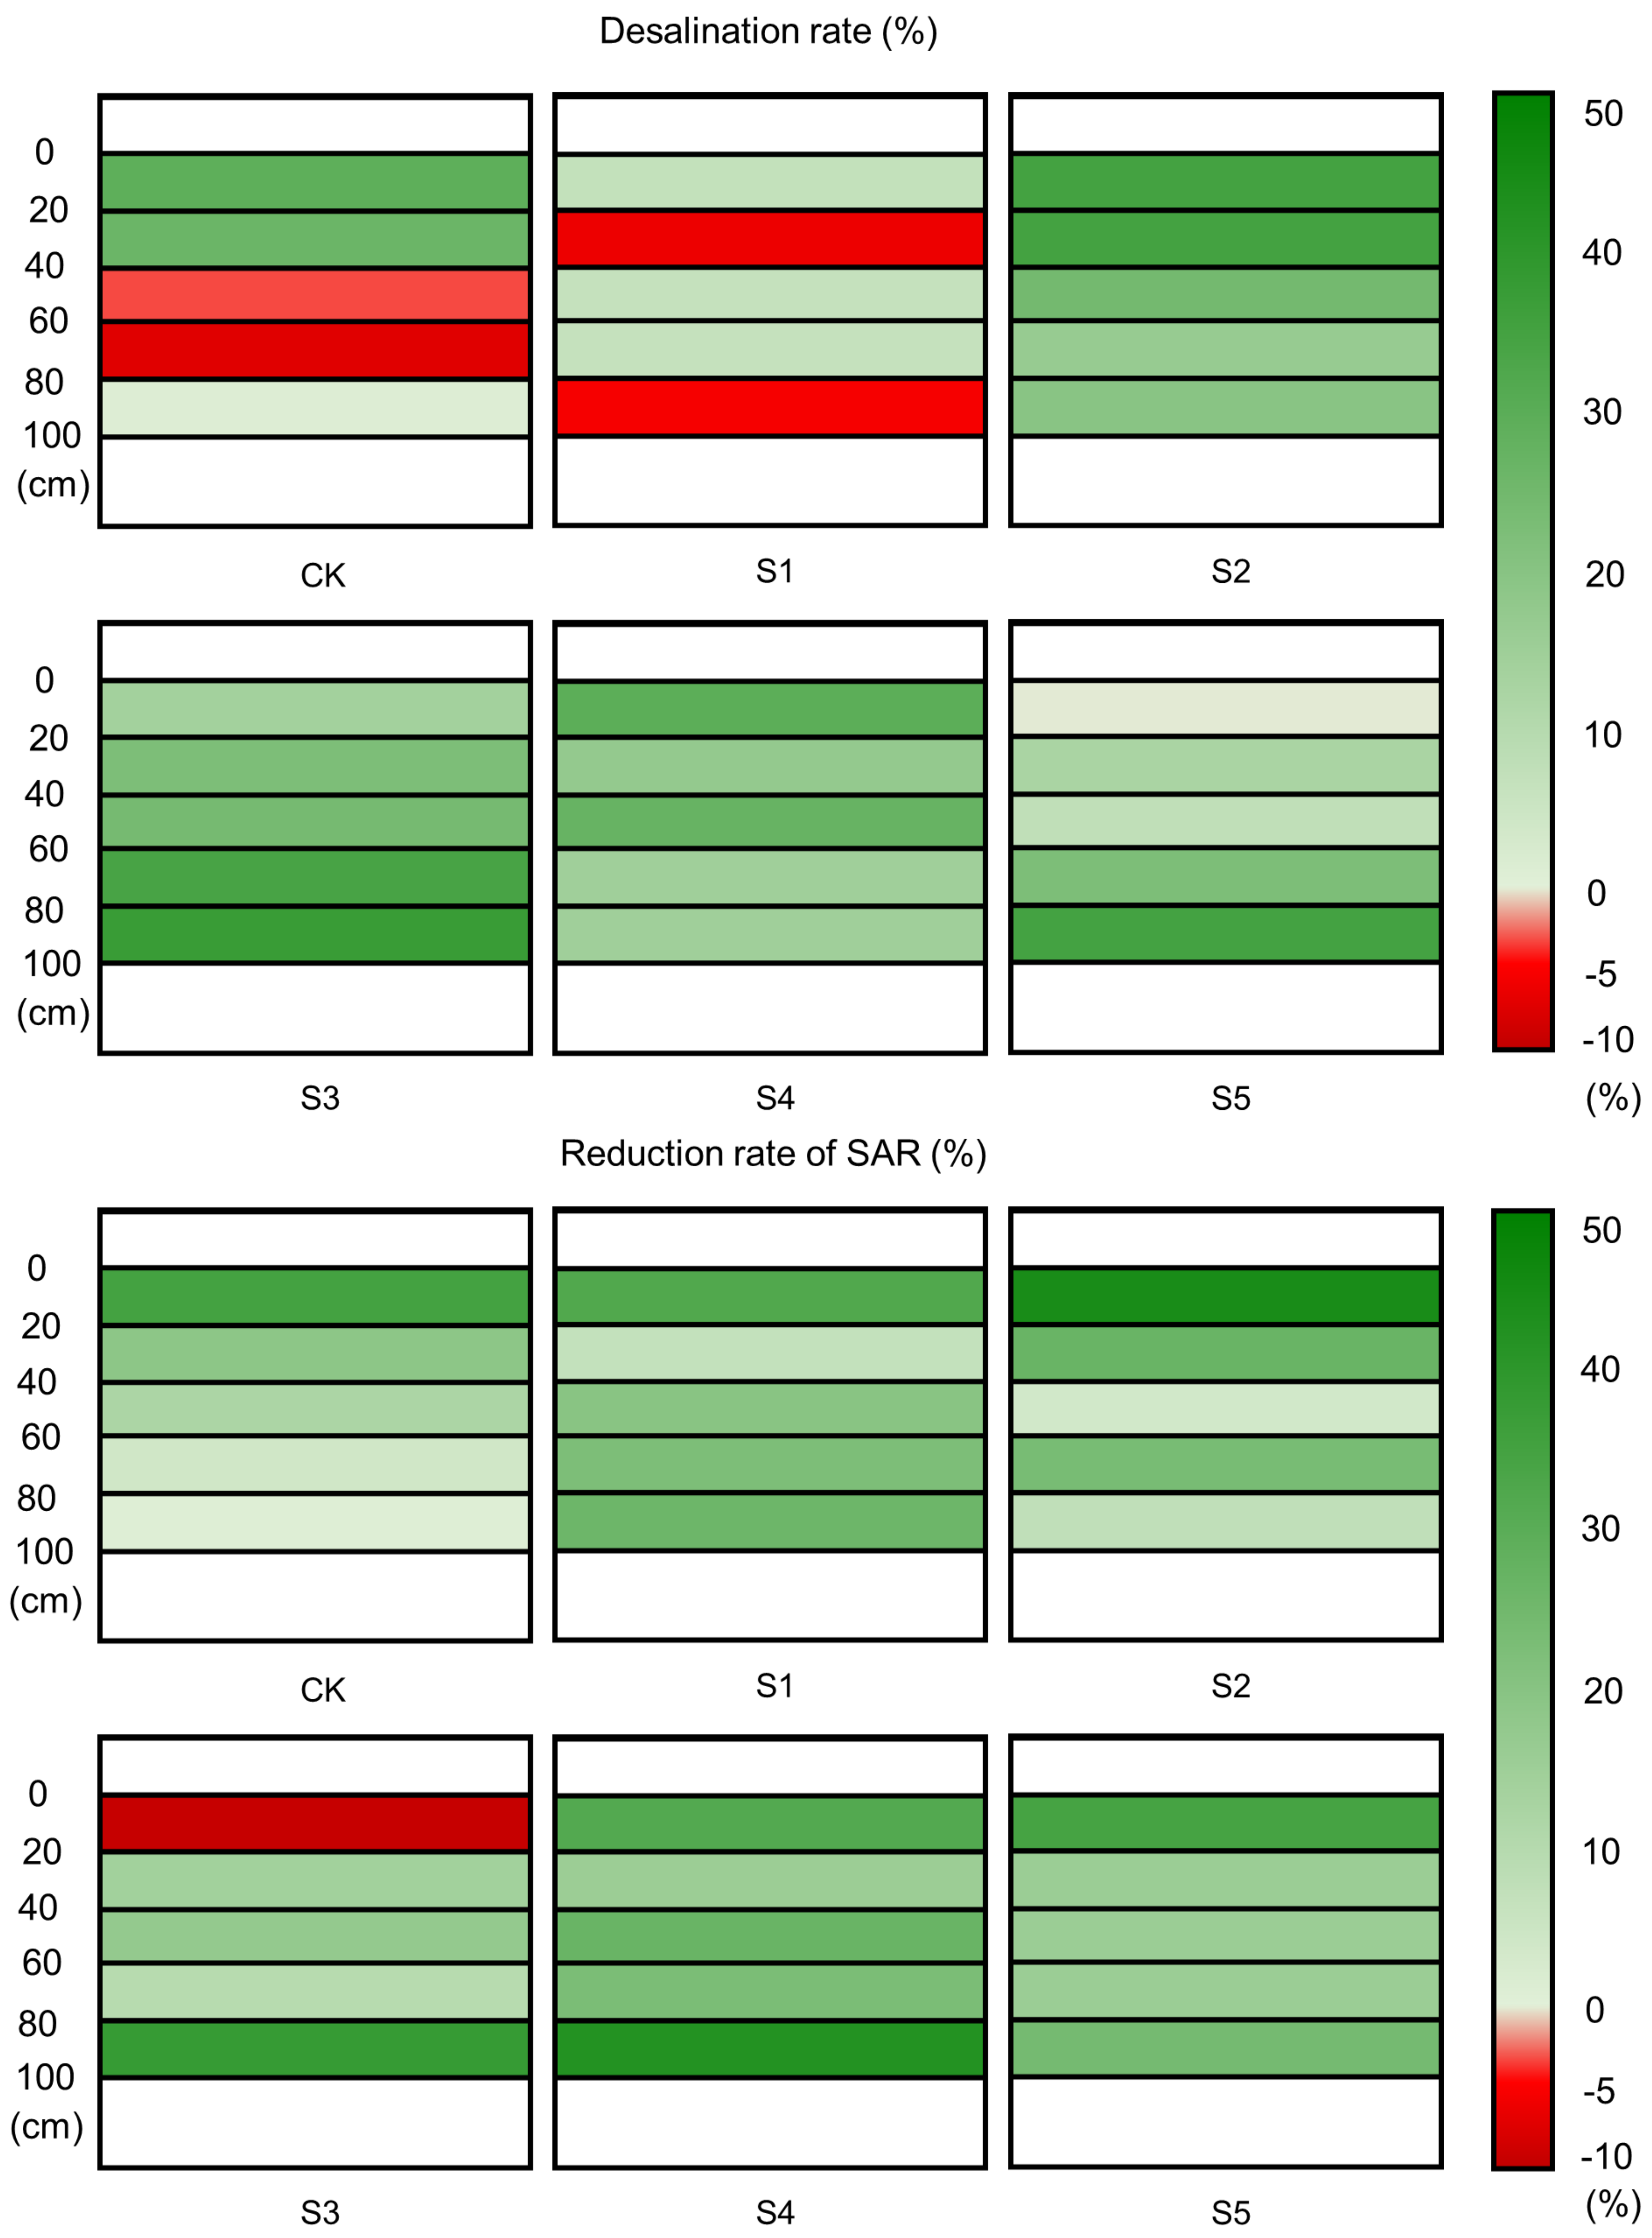
The desalination rate and SAR reduction rate of all groups in each soil layer were analyzed (Figure 9). In groups S2, S3, and S4, all soil layers at 0–100 cm soil depth were in a desalting state. The desalination rate of the top and sub-topsoil layer (20–40 cm) was not significantly different from that of the control, while the desalination rate of the middle soil layer (40–60 cm) and lower soil layers (60–100 cm) was significantly higher than that of the control. The overall desalting effect of S1, S5, and CK was poor, with one or more layers of salt accumulation after leaching.
The SAR of soil in S1, S2, S4, and S5 decreased effectively, with the SAR of all layers decreased after leaching during the rainy season. The reduction rate of SAR in topsoil at S2 was the highest among all groups. In the control group, the reduction rate of SAR in topsoil was higher, decreasing from the top layer to the bottom layer in turn. In S3, the reduction rate of SAR increased from the top layer to the lower layer, but it was negative in the top layer.
The effects of okra RWD on soil desalination rate and reduction rate of SAR at different depths were analyzed (Table 5). The regression analysis results showed that the soil desalination rate in all soil layers first increased and then decreased with the increase in okra RWD, showing a parabolic trend with downward opening. All values of R2 of the regression analyses reached 0.59 and above, but none of them were significant. There was no obvious correlation between the reduction rate of SAR in each soil layer and the RWD of okra.

3.3.2. Average Salt Content and Sodium Adsorption Ratio in the Soil Profile

The average salt content and average SAR in the soil profile (0–100 cm) before and after leaching were analyzed (Table 6). The results of variance analysis of soil salt content among groups were not significant. There were significant differences between the salt content of soil sampled before leaching and after leaching in the S3 and S4 groups (p < 0.05). Except S1, the desalination rate of all groups was higher than that of the control. The desalination rate of S2 was the highest, about 257% of the control. The soil desalination rate in groups from high to low was in the following order: S2, S3, S4, S5, CK, and S1.
The soil SAR of different groups before leaching was 7.90–10.82 (mmol·L)−1/2, and the results of variance analysis were significant (p < 0.05). After leaching, the soil SAR was 6.53–7.92 (mmol·L)−1/2 with no significant differences among groups. There were significant differences between SAR of soil sampled before and after leaching in S1 and S4 groups (p < 0.05). Except S3, the SAR reduction rate of groups was greater than that of the control. The reduction rate of SAR in S4 was the highest (161.81 μg·cm−3), which was about 180% of that of the control. The reduction rate of SAR from large to small was in the following order: S4, S2, S5, S1, CK and S3.
The effects of okra RWD on average soil desalination rate and average reduction rate of SAR in the soil profile were also analyzed (Figure 10). The soil desalination rate first increased and then decreased with the increase in okra RWD. The fitting curve reached the maximum value (28.83%) when the RWD was 136 μg·cm−3, which was about 229% of the control. There was no significant correlation between the reduction rate of soil SAR and okra RWD.

4. Discussion

4.1. Effect of Okra Root Weight Density on Root Vertical Distribution

Soil salinity, planting density, soil water, fertilizer distribution, and some other factors strongly affect the vertical distribution of roots in the soil profile [32,33,34]. The increase in planting density increases the root biomass, aggravates the competition among roots, and changes the vertical distribution of roots [35]. In the present study, the results showed that with the increase in RWD, more roots of okra grew into the deep soil. The percentage of root dry mass in the 0–20 cm soil layer decreased with the increase in RWD, while it increased with the increase in RWD in the 20–50 cm soil layer. These results were similar to those reported by an article studying the effect of planting density on the distribution of maize roots [36].
The fitting results of the root vertical distribution model also showed this phenomenon, as β decreased with the increase in RWD. However, β increased less at low RWD but more at high RWD, especially for the S4 to S5 groups, which reached 69% of the increase from group S1 to S5. This indicated that there was a threshold (161.81–181.07μg·cm−3) between S4 and S5. The okra RWD exceeded the threshold, the vertical distribution of okra roots was significantly affected, and more root penetrated beyond the surface layer to the deep soil layer. This may be one of the reasons why okra with different RWD has different effects on water and salt discharge performance in subsurface pipe.

4.2. Effect of Okra Root Weight Density on Drain Outflow

The drain outflow of subsurface pipe drainage was affected by many factors. Beside the depth and the spacing of the pipe drain, plants could influence the soil permeability [37], which affected the drainage capacity of subsurface pipe drainage. With the increase in root density, the more macropores were produced by roots, which further improved the structure and permeability of soil [38]. This would have a greater impact on the soil water and salt transport and discharge performance in subsurface pipe drainage, and would have increased the drain outflow from simulation boxes in the rainy season, but it could also increase the evapotranspiration per unit area of the soil at the same time [39], and reduce the soil water content and drain outflow.
The present study found that the cumulative drain outflow firstly increased and then decreased with the increase in RWD, and had a significant parabolic relationship with okra RWD. The fitting curve reached the maximum at the RWD about 116 μg·cm−3, which was about 140% of that of the control. This indicated okra with an appropriate density (116 μg·cm−3) in coastal saline land could significantly increase the drain outflow of subsurface pipe drainage in the rainy season and further reduce ponding, surface runoff, and soil erosion caused by strong rainfall.
The results of this study were different from some studies. Their results showed that some forage grasses with deeper roots significantly reduced soil water content and groundwater level [40,41], which should lead to the reduction in the drain outflow. The possible reason was that the drain outflow in this experiment was measured within 48 h after heavy rainfall. Deep-rooted crops may reduce soil water content over a long period of time. However, the existing results of this study could not show the changes of soil water content over a long interval, so further research is needed in the future.

4.3. Effect of Okra Root Weight Density on Soil Desalination Rate and Reduction Rate of Sodium Adsorption Ratio

The results of leaching in saline soil were related to many factors such as initial soil salt content, soil permeability, water volume, water quality, and so on [42]. Plant roots can improve the permeability of soil and then influence the desalination rate [43].
In this study, the leaching volume of water and water quality were the same for all the RWD groups. The average initial soil salt content in the soil profile of each group was 2.33–4.09 g·kg−1 where all groups belong to mild saline soil and there was no significant difference in groups. However, the variation in salt content had some influence on the results of the experiment, so needs to be reduced in future research to avoid experimental error.
The present study found that okra RWD has a significant effect on the soil desalination rate. The soil desalination rate of average salt content in the soil profile first increased and then decreased with the increase in okra RWD. The fitting curve reached the maximum value (28.83%) when the RWD was 136 μg·cm3, which was about 229% of the control. In S2, S3, and S4, all soil layers at 0–100 cm soil depth were in a desalting state. The desalination rate of the top and sub-topsoil layer was not significantly different from that of the control, while the desalination rate of the middle soil layer (40–60 cm) and lower soil layers (60–100 cm) was significantly higher than that of the control. This means that when the RWD is 128–161 μg·cm3, the desalting effect of each soil layer is better than that of CK or as good as it is. The above results indicate that okra with an appropriate root (136 μg·cm−3) density in coastal saline land could significantly improve the desalting effect of subsurface pipe drainage in the rainy season and shorten the time needed for the improvement in coastal saline land.
The results of this study contradicted the views of an article, which suggested that growing crops increased leaching efficiency because it reduced soil water content, macropore bypass, and drainage volume [13]. However, in this study, the cumulative drain outflow of the group with the highest soil desalination rate was also very high. The possible reason was that the existence of the subsurface pipe drainage system generally increased the drainage rate, which led to higher drainage within a short time, and it was too late for crops to show the effect of reducing soil moisture.
The soil SAR reflected the relative content of Na+, Mg2+, and Ca2+ in soil solution and can indicate the exchangeable sodium percentage to a certain extent [44]. In the present study, the soil SAR before leaching was 7.90–10.82 (mmol·L)−1/2 and the result of variance analysis was significant (p < 0.05). After leaching, it decreased to 6.53–7.92 (mmol·L)−1/2 with no significant difference among groups. It showed that subsurface pipe drainage can reduce the soil SAR after leaching.
The RWD of okra had a great effect on the reduction rate of SAR. Except S3, the reduction rate of average SAR in the soil profile in other groups was greater than the control. Group S4 was the highest, which was about 180% of the control. The above results indicate that okra with an appropriate root density in coastal saline soil could improve the ability of subsurface pipe drainage to inhibit soil alkalization that will change the relative content of ions and improve the physiochemical properties of the soil. However, the relationship between RWD and reduction rate of SAR needs a further study.
The results were similar to the results of an article on the improvement in saline soil by subsurface pipe drainage technology through field experiments. Its results showed that subsurface pipe drainage technology can effectively restrain the trend in soil alkalization, but that soil SAR increases after the rainy season [45]. The effect of an okra-assisted subsurface pipe drainage system on soil SAR needs to be further studied under field conditions.

5. Conclusions

The okra root density affected the vertical distribution of okra roots in soil layers. When the okra RWD exceeded a threshold, the vertical distribution of okra roots was significantly affected, and more root penetrated beyond the surface layer to the deep soil layers. The root density of okra influenced the water discharge performance of subsurface pipe drainage under natural precipitation. Okra with an appropriate RWD (about 116 μg·cm−3) in coastal saline soil could significantly increase the cumulative drain outflow of subsurface pipe drainage in the rainy season. The root density of okra influenced the salt discharge performance of subsurface pipe drainage under natural precipitation. In addition, okra with an appropriate RWD (about 136 μg·cm−3) in coastal saline land could significantly improve the desalting effect of subsurface pipe drainage in the rainy season. The root density of okra also influenced the ability of subsurface pipe drainage to inhibit soil alkalization. Planting okra and installing subsurface pipe drainage to control drainage at the coastal saline land in Northern China can effectively improve the water and salt drainage effect of subsurface pipe drainage technology when okra RWD is about 116–136 μg·cm−3; it will also enhance the ability of subsurface pipe drainage to inhibit soil alkalization, and shorten the time needed to improve the coastal saline soil. The results of this study provided a scientific basis for an okra-assisted subsurface pipe drainage system to reclaim coastal saline land in Northern China. When using subsurface pipe drainage to improve coastal saline soils, planting okra with proper density is an appropriate choice to improve the effect and benefit.

Author Contributions

Conceptualization, L.H.; Data curation, D.F., K.G., A.A. and J.L.; Formal analysis, K.G.; Funding acquisition, S.W.; Methodology, S.W. and J.X.; Project administration, J.X.; Software, D.F.; Supervision, J.X.; Validation, A.A.; Visualization, L.H.; Writing—original draft, D.F.; Writing—review and editing, K.G. and L.H. All authors have read and agreed to the published version of the manuscript.

Funding

This research was provided by the National Natural Science Foundation of China (No.4187071447), the Natural Science Foundation for Outstanding Young Scholars of Hebei Province of China (C2018503015) and the Youth Innovation Promotion Association CAS (No.2018132).

Institutional Review Board Statement

Not applicable.

Informed Consent Statement

Not applicable.

Data Availability Statement

The authors confirm that the data supporting the findings of this study are available within the article.

Acknowledgments

We are grateful to all workers at the experimental sites.

Conflicts of Interest

The authors declare no conflict of interest.

References

  1. Li, N.; Kang, Y.H.; Li, X.B.; Wan, S.Q. Response of tall fescue to the reclamation of severely saline coastal soil using treated effluent in Bohai Bay. Agric. Water Manag. 2019, 218, 203–210. [Google Scholar] [CrossRef]
  2. Tao, J.; Wu, L.; Liu, X.; Zhang, H.; Xu, Y.; Gu, W.; Li, Y. Effect of brackish ice on salt and nutrient contents of saline soil in flue-gas desulfurization gypsum amended, raised bed agroecosystem. Soil Sci. Soc. Am. J. 2014, 78, 1734–1740. [Google Scholar] [CrossRef]
  3. He, K.; Yang, Y.; Yang, Y.; Chen, S.; Hu, Q.; Liu, X.; Gao, F. HYDRUS Simulation of Sustainable Brackish Water Irrigation in a Winter Wheat-Summer Maize Rotation System in the North China Plain. Water 2017, 9, 536. [Google Scholar] [CrossRef] [Green Version]
  4. He, X.; Liu, H.; Ye, J.; Yang, G.; Li, M.; Gong, P.; Aimaiti, A. Comparative investigation on soil salinity leaching under subsurface drainage and ditch drainage in Xinjiang arid region. Int. J. Agric. Biol. Eng. 2016, 9, 109–118. [Google Scholar] [CrossRef]
  5. Lu, P.; Zhang, Z.; Feng, G.; Huang, M.; Shi, X. Experimental study on the potential use of bundled crop straws as subsurface drainage material in the newly reclaimed coastal land in eastern China. Water 2018, 10, 31. [Google Scholar] [CrossRef] [Green Version]
  6. Yu, S.; Liu, J.; Eneji, A.E.; Han, L.; Tan, L.; Liu, H. Dynamics of soil water and salinity under subsurface drainage of a coastal area with high groundwater table in spring and rainy season. Irrig. Drain. 2016, 65, 360–370. [Google Scholar] [CrossRef]
  7. Yu, S.; Liu, J.; Eneji, A.E.; Liu, H.; Han, L. Spatial variability of soil salinity under subsurface drainage. Commun. Soil Sci. Plant Anal. 2015, 46, 259–270. [Google Scholar] [CrossRef]
  8. Tedeschi, A. Irrigated Agriculture on Saline Soils: A Perspective. Agronomy 2020, 10, 6. [Google Scholar] [CrossRef]
  9. Zhang, J.S.; Jiang, X.L.; Xue, Y.F.; Li, Z.X.; Yu, B.T.; Xu, L.M.; Lu, X.C.; Miao, Q.; Liu, Z.T.; Cui, Z.L. Closing yield gaps through soil improvement for maize production in coastal saline soil. Agronomy 2019, 9, 13. [Google Scholar] [CrossRef] [Green Version]
  10. Zhang, J.; Yang, J.; Yao, R.; Yu, S.; Li, F.; Hou, X. The effects of farmyard manure and mulch on soil physical properties in a reclaimed coastal tidal flat salt-affected soil. Integr. Agric. 2014, 13, 1782–1790. [Google Scholar] [CrossRef] [Green Version]
  11. Yu, X.Y.; Dan, H.C.; Xin, P. Method for improving leaching efficiency of coastal subsurface drainage systems. J. Irrig. Drainage Eng-ASCE 2018, 144, 04018019. [Google Scholar] [CrossRef]
  12. Chen, H.; Yang, C.; Ren, A.; Guo, K.; Feng, X.; Li, J.; Liu, X.; Sun, H.; Wang, J. The Evapotranspiration of Tamarix and Its Response to Environmental Factors in Coastal Saline Land of China. Water 2019, 11, 2273. [Google Scholar] [CrossRef] [Green Version]
  13. Qadir, M.; Ghafoor, A.; Murtaza, G. Amelioration strategies for saline soils: A review. Land Degrad. Dev. 2000, 11, 501–521. [Google Scholar] [CrossRef]
  14. Akhter, J.; Murray, R.; Mahmood, K.; Malik, K.A.; Ahmed, S. Improvement of degraded physical properties of a saline-sodic soil by reclamation with kallar grass (Leptochloa fusca). Plant Soil 2004, 258, 207–216. [Google Scholar] [CrossRef]
  15. Robbins, C.W. Sodic calcareous soil reclamation as affected by different amendments and crops. Agron. J. 1986, 78, 916–920. [Google Scholar] [CrossRef] [Green Version]
  16. Robbins, C.W. Carbon-dioxide partial-pressure in lysimeter soils. Agron. J. 1986, 78, 151–158. [Google Scholar] [CrossRef] [Green Version]
  17. Qadir, M.; Qureshi, R.H.; Ahmad, N. Reclamation of a saline-sodic soil by gypsum and Leptochloa fusca. Geoderma 1996, 74, 207–217. [Google Scholar] [CrossRef]
  18. Choudhary, O.P.; Ghuman, B.S.; Bijay, S.; Thuy, N.; Buresh, R.J. Effects of long-term use of sodic water irrigation, amendments and crop residues on soil properties and crop yields in rice-wheat cropping system in a calcareous soil. Field Crops Res. 2011, 121, 363–372. [Google Scholar] [CrossRef]
  19. Ammari, T.G.; Tahboub, A.B.; Saoub, H.M.; Hattar, B.I.; Al-Zu’bi, Y.A. Salt removal efficiency as influenced by phyto-amelioration of salt-affected soils. J. Food Agric. Env. 2008, 6, 456–460. [Google Scholar]
  20. Dahiya, I.S.; Malik, R.S.; Singh, M. Field studies on leaching behaviour of a highly saline-sodic soil under two modes of water application in the presence of crops. J. Agric. Sci. 1981, 97, 383–389. [Google Scholar] [CrossRef]
  21. Cuevas, J.; Daliakopoulos, I.N.; del Moral, F.; Hueso, J.J.; Tsanis, I.K. A Review of Soil-Improving Cropping Systems for Soil Salinization. Agronomy 2019, 9, 22. [Google Scholar] [CrossRef] [Green Version]
  22. Elshaikh, N.A.; Liu, Z.P.; She, D.L.; Timm, L.C. Increasing the okra salt threshold value with biochar amendments. J. Plant Interact. 2018, 13, 51–63. [Google Scholar] [CrossRef] [Green Version]
  23. Panigrahi, P.; Sahu, N.N. Evapotranspiration and yield of okra as affected by partial root-zone furrow irrigation. Int. J. Plant Prod. 2013, 7, 33–54. [Google Scholar]
  24. Chen, R.; Huang, J.W.; Chen, Z.K.; Xu, Y.; Liu, J.; Ge, Y.H. Effect of root density of wheat and okra on hydraulic properties of an unsaturated compacted loam. Eur. J. Soil Sci. 2019, 70, 493–506. [Google Scholar] [CrossRef]
  25. Kamaluldeen, J.; Yunusa, I.A.M.; Zerihun, A.; Bruhl, J.J.; Kristiansen, P. Uptake and distribution of ions reveal contrasting tolerance mechanisms for soil and water salinity in okra (Abelmoschus esculentus) and tomato (Solanum esculentum). Agric. Water Manag. 2014, 146, 95–104. [Google Scholar] [CrossRef]
  26. Liang, G.T.; Xia, X.X. Okra high-efficiency cultivation techniques in saline-alkali soil. North. Hortic. 2015, 23, 69–70. [Google Scholar]
  27. Alharby, H.F.; Colmer, T.D.; Barrett-Lennard, E.G. Salinization of the soil solution decreases the further accumulation of salt in the root zone of the halophyte Atriplex nummularia Lindl. growing above shallow saline groundwater. Plant Cell Environ. 2018, 41, 99–110. [Google Scholar] [CrossRef]
  28. Zhang, Y.; Yang, J.; Huang, Y.; Yao, R.; Wang, M.K.; Lin, J.; Jiang, F. Use of freeze-thaw purified saline water to leach and reclaim gypsum-amended saline-alkali soils. Soil Sci. Soc. Am. J. 2019, 83, 1333–1342. [Google Scholar] [CrossRef]
  29. Qadir, M.; Sposito, G.; Smith, C.J.; Oster, J.D. Reassessing irrigation water quality guidelines for sodicity hazard. Agric. Water Manag. 2021, 255, 7. [Google Scholar] [CrossRef]
  30. Gale, M.R.; Grigal, D.F. Vertical root distribution of northern tree species in relation to successional status. Can. J. For. Res. 1987, 17, 829–834. [Google Scholar] [CrossRef]
  31. Naqve, M.; Wang, X.K.; Shahbaz, M.; Mahmood, A.; Bibi, S.; Fiaz, S. Alpha Tocopherol-Induced Modulations in the Morphophysiological Attributes of Okra Under Saline Conditions. Front. Plant Sci. 2021, 12, 800251. [Google Scholar] [CrossRef] [PubMed]
  32. Jiang, H.; Bai, Y.Y.; Du, H.Y.; Hu, Y.; Rao, Y.F.; Chen, C.; Cai, Y.L. The spatial and seasonal variation characteristics of fine roots in different plant configuration modes in new reclamation saline soil of humid climate in China. Ecol. Eng. 2016, 86, 231–238. [Google Scholar] [CrossRef]
  33. Zhang, L.Z.; Li, B.G.; Yan, G.T.; Van der Werf, W.; Spiertz, J.H.J.; Zhang, S.P. Genotype and planting density effects on rooting traits and yield in cotton (Gossypium hirsutum L.). J. Integr. Plant Biol. 2006, 48, 1287–1293. [Google Scholar] [CrossRef]
  34. Zhong, R.H.; Hu, J.M.; Bao, Y.H.; Wang, F.; He, X.B. Soil nutrients in relation to vertical roots distribution in the riparian zone of Three Gorges Reservoir, China. J. Mt. Sci. 2018, 15, 1498–1509. [Google Scholar] [CrossRef]
  35. Chen, Y.; Wu, Q.; Chen, X.; Chen, F.; Zhang, Y.; Li, Q.; Yuan, L.; Mi, G. Root growth and its response to increasing planting density in different maize hybrids. Plant Nutr. Fert. Sci. 2012, 18, 52–59. [Google Scholar]
  36. Guan, J.; Guo, X.; Liu, Y. Study on dynamic variation of root dry weight space distribution on different densities of maize. J. Maize Sci. 2007, 15, 105–108,118. [Google Scholar]
  37. Jotisankasa, A.; Sirirattanachat, T. Effects of grass roots on soil-water retention curve and permeability function. Can. Geotech. J. 2017, 54, 1612–1622. [Google Scholar] [CrossRef] [Green Version]
  38. Liu, M.; Wu, D.; Wu, S.; Liao, L. Characteristic of soil macropores under various types of forest coverage and their influence on saturated hydraulic conductivity in the Three Gorges Reservoir Area. Acta Ecol. Sin. 2016, 36, 3189–3196. [Google Scholar]
  39. Ren, X.; Sun, D.; Wang, Q. Effects of plastic film mulching and plant density on yield and evapotranspiration of rainfed spring maize. Chin. Soc. Agric. Mach. 2017, 48, 206–211. [Google Scholar]
  40. Dear, B.S.; Moore, G.A.; Hughes, S.J. Adaptation and potential contribution of temperate perennial legumes to the southern Australian wheatbelt: A review. Aust. J. Exp. Agric. 2003, 43, 1–18. [Google Scholar] [CrossRef]
  41. Latta, R.A.; Blacklow, L.J.; Cocks, P.S. Comparative soil water, pasture production, and crop yields in phase farming systems with lucerne and annual pasture in Western Australia. Aust. J. Agric. Res. 2001, 52, 295–303. [Google Scholar] [CrossRef]
  42. Guo, K.; Liu, X. Effect of initial soil water content and bulk density on the infiltration and desalination of melting saline ice water in coastal saline soil. Eur. J. Soil Sci. 2019, 70, 1249–1266. [Google Scholar] [CrossRef]
  43. Liu, A.Q.; Qu, Z.Y.; Nachshon, U. On the potential impact of root system size and density on salt distribution in the root zone. Agric. Water Manag. 2020, 234, 9. [Google Scholar] [CrossRef]
  44. Wang, J.; Yuan, G.D.; Lu, J.; Wu, J. Leaching of salt-affected soil amended by leonardite. Phys. Geogr. 2021, 42, 226–239. [Google Scholar] [CrossRef]
  45. Xu, Y.; Yu, S.; Shi, L. Effects of subsurface controlled drainage on reducing salinity and preventing basification in saline-alkali areas with underground high water level. J. Arid. Land Resour. Environ. 2018, 32, 164–169. [Google Scholar]
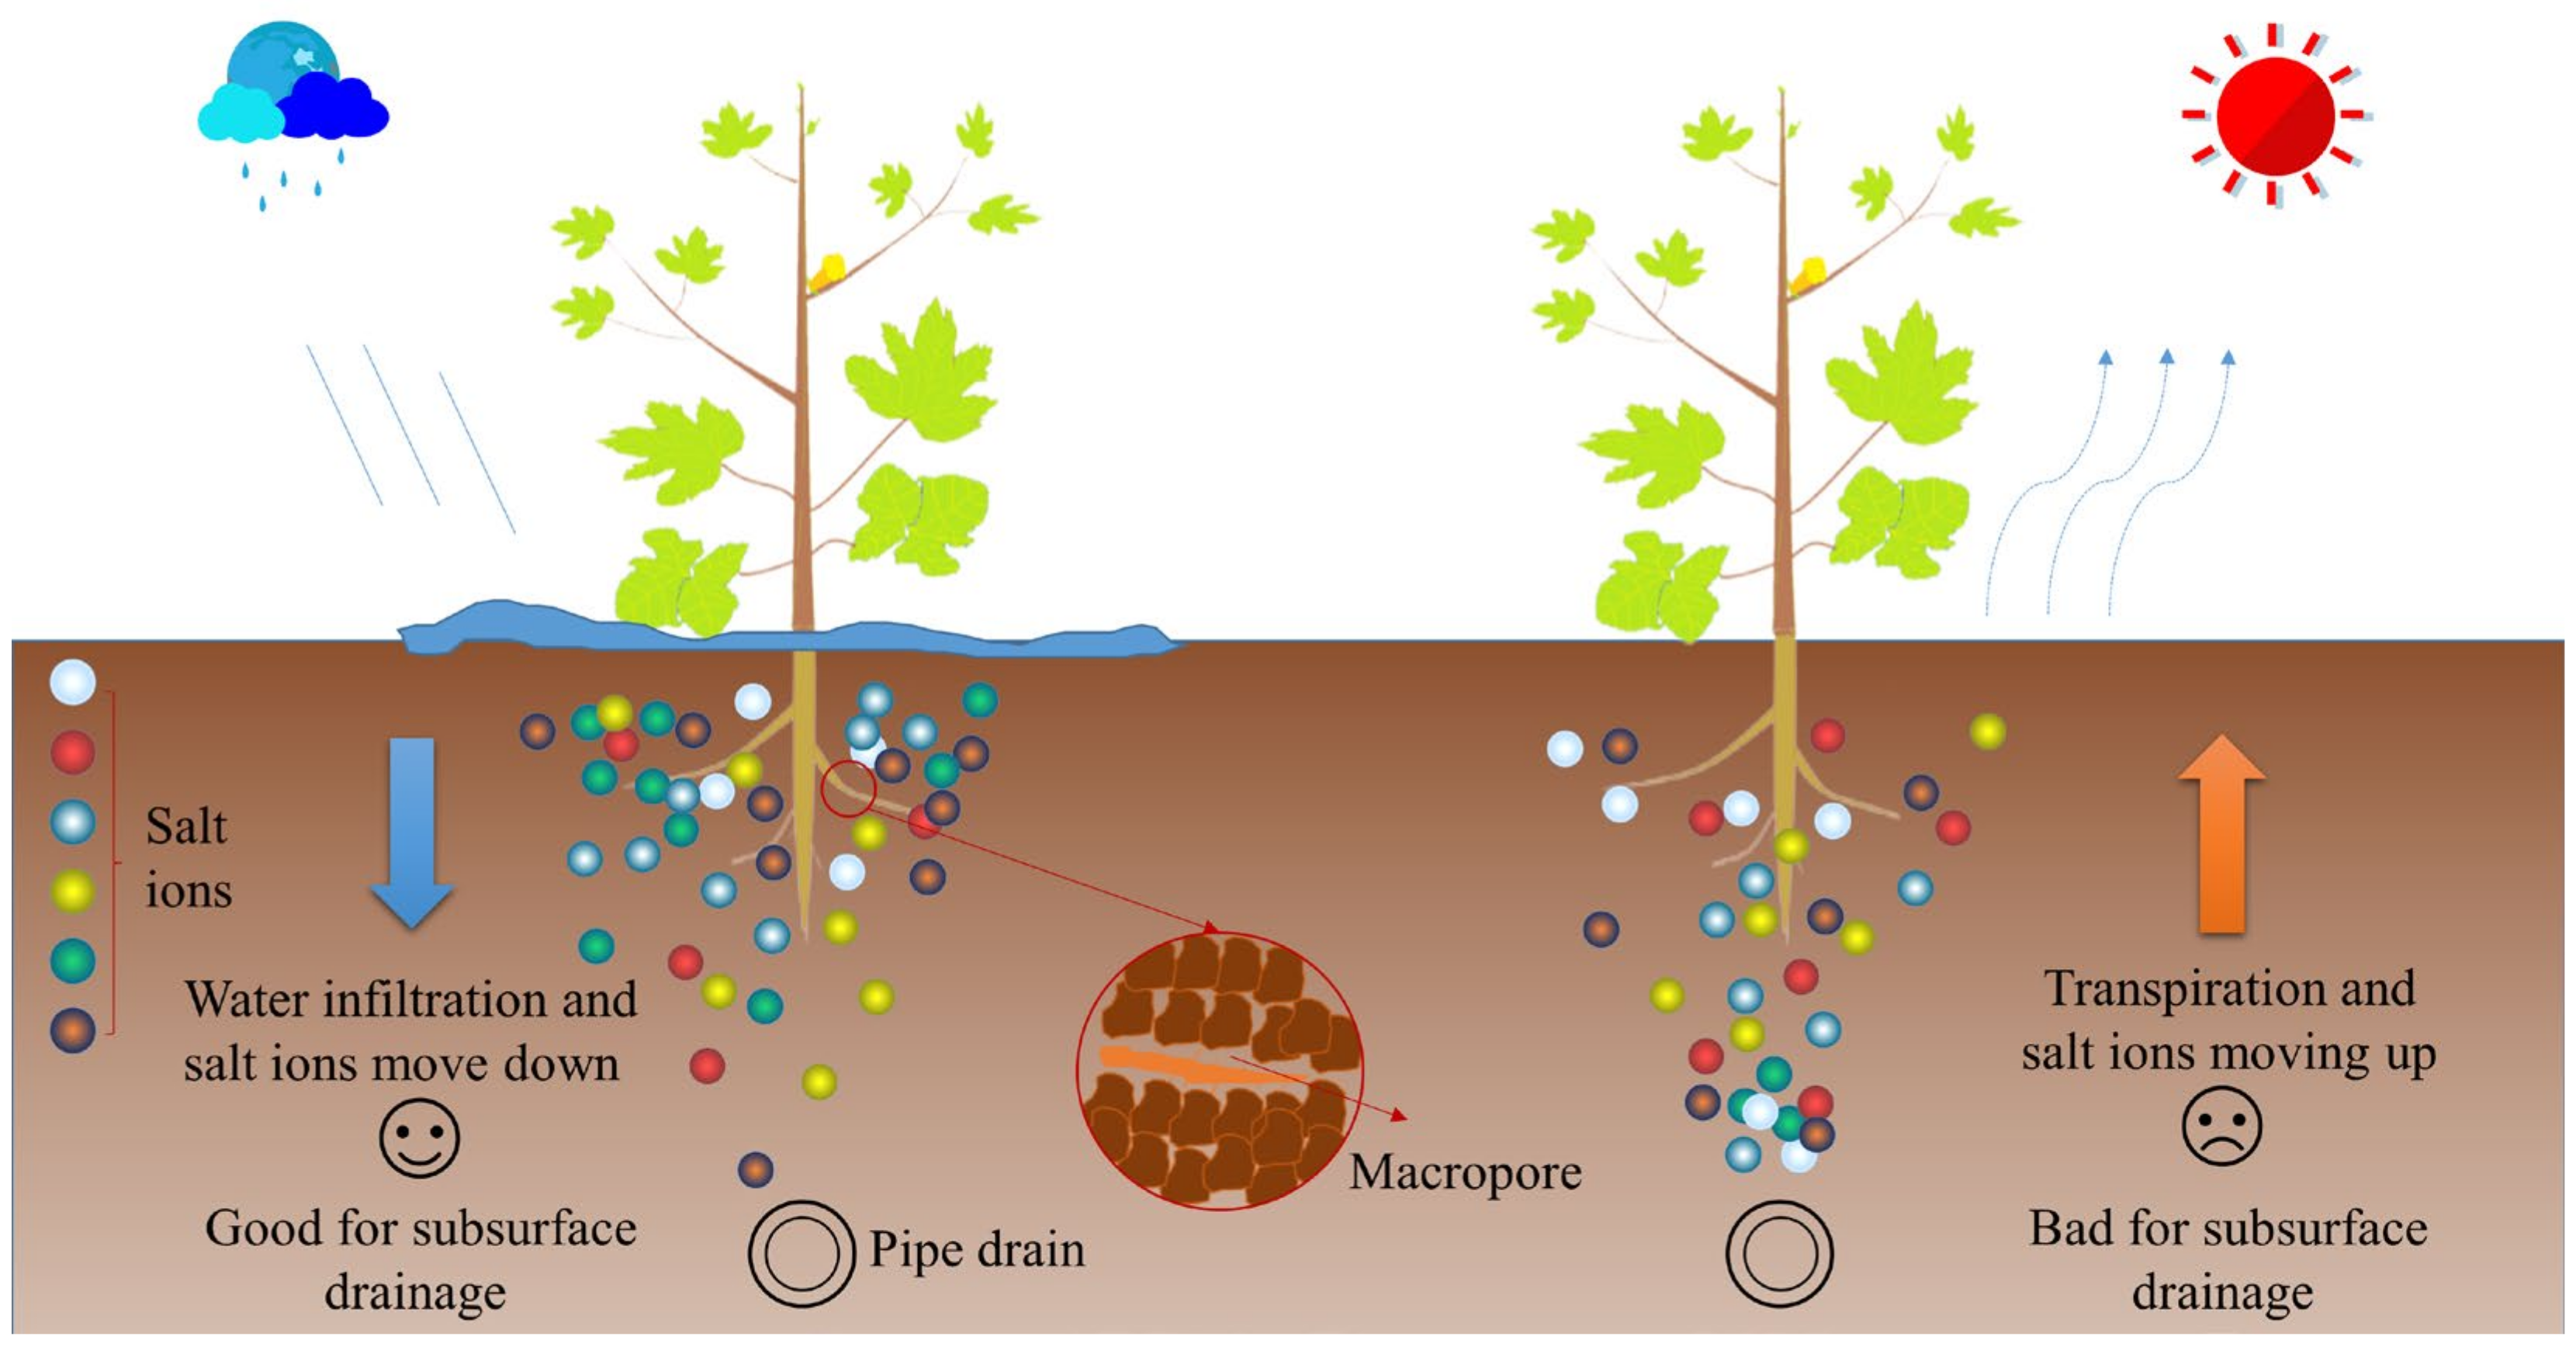
Figure 1. The dual effect of okra roots on the salt movement in saline soil.
Agronomy 12 00866 g001
Figure 2. The pilot site and distribution of simulation boxes.
Agronomy 12 00866 g002
Figure 3. The rainfall and temperature during okra growth period in 2020.
Agronomy 12 00866 g003
Figure 4. The method of grouping simulation boxes with different planting densities according to root weight density.
Agronomy 12 00866 g004
Figure 5. The okra root weight density in different groups. Different lowercase letters indicate significant differences among treatments at p < 0.05, while different uppercase letters indicate significant differences among treatments at p < 0.01.
Agronomy 12 00866 g005
Figure 6. Percentage of okra root dry mass for each soil layer in relation to root weight density.
Agronomy 12 00866 g006
Figure 7. The cumulative drain outflow in relation to okra root weight density. CK represents the value corresponding to bare land. Data are the means of four replicates.
Agronomy 12 00866 g007
Figure 8. The salt content and sodium adsorption ratio of soil sampled before and after leaching. (A,B) represent the salt content in soil layers before and after leaching, respectively. (C,D) represent the sodium adsorption ratio in soil layers before and after leaching, respectively. The length of the horizontal line represents LSD (p = 0.05) in the least significant difference method, and if there is no horizontal line, it means the analysis of variance is not significant. SAR refers to sodium adsorption ratio.
Agronomy 12 00866 g008
Figure 9. The soil desalination rate and reduction rate of SAR at different soil depths. SAR refers to sodium adsorption ratio.
Agronomy 12 00866 g009
Figure 10. The average soil desalination rate and average SAR reduction rate in relation to okra root weight density. CK represents the value corresponding to bare land. Data are the means of four replicates. SAR refers to sodium adsorption ratio.
Agronomy 12 00866 g010
Table 1. Physical and chemical characteristics of the soil filled in the simulation boxes.
Soil Texture in % (USDA)Soil TextureBulk Density/
(g·cm−3)
Saturated Hydraulic Conductivity/
(cm·d−1)
Soil Salt Content/
(g·kg−1)
<0.002 mm0.002–0.05 mm0.05–2 mm
1.7182.2216.08Silt1.427.343.14
Table 2. Row distance and plant spacing of each planting density (cm).
Plant DensityRow DistancePlant Spacing
4 plants75.0075.00
8 plants75.0037.50
12 plants50.0037.50
16 plants37.5037.50
20 plants37.5030.00
Table 3. Root distribution coefficient (β, dimensionless) of okra in different root weight density groups.
GroupsβR2
S10.850.96
S20.880.99
S30.880.99
S40.890.99
S50.980.98
Note: R2 refers to the coefficient of determination of regression analysis.
Table 4. The drain outflow during the four times’ drainage processes (L).
GroupsThe First TimeThe Second TimeThe Third TimeThe Fourth Time
CK4.63a6.33a4.03a13.23a
S16.09a8.90a7.57a10.40a
S23.73a8.15a9.75a15.90a
S35.02a8.20a7.53a16.73a
S43.55a6.28a5.30a14.15a
S53.24a4.63a4.15a10.70a
Note: Values followed by similar letters in a column do not differ significantly at p < 0.05.
Table 5. The regression analysis results of soil desalination rate and reduction rate of sodium adsorption ratio at different soil depths with okra root weight density.
Soil Depth (cm)Desalination RateReduction Rate of SAR
Regression EquationR2Regression EquationR2
0–20Y = −0.0097X2 + 2.46X − 126.370.64 nsY = 0.0047X2 − 1.23X + 102.470.08 ns
20–40Y = −0.0097X2 + 2.65X − 152.750.86 nsY = −0.0033X2 + 0.89X − 39.770.43 ns
40–60Y = −0.0064X2 + 1.69X − 85.620.80 nsY = 0.0028X2 − 0.69X + 55.080.19 ns
60–80Y = −0.0036X2 + 1.08X − 55.910.59 nsY = 0.001X2 − 0.30X + 40.780.16 ns
80–100Y = −0.0036X2 + 1.28X − 83.040.72 nsY = 0.0006X2 − 0.06X + 24.350.07 ns
Note: ns: not significant. SAR refers to sodium adsorption ratio. R2 refers to the coefficient of determination of regression analysis.
Table 6. The average salt content and sodium adsorption ratio in the soil profile.
GroupsSalt Content
(g·kg−1)
SAR
(mmol·L)−1/2
Before
Leaching
After LeachingDesalination Rate (%)Before
Leaching
After LeachingReduction Rate (%)
CK2.56 a2.24 a12.587.90 c6.66 a15.75
S13.25 a3.18 a2.1810.82 a8.50 a21.43 *
S24.72 a3.20 a32.2710.26 ab7.92 a22.79
S33.24 a2.38 a26.58 *8.46 abc7.27 a14.05
S43.63 a2.80 a22.82 *10.67 ab7.66 a28.29 *
S52.33 a1.96 a15.718.43 bc6.53 a22.53
Note: *: p < 0.05 (t-test). Values followed by different letters in a column differ significantly at p < 0.05. SAR refers to sodium adsorption ratio.
Publisher’s Note: MDPI stays neutral with regard to jurisdictional claims in published maps and institutional affiliations.