Article

Environmental and Regional Effects on Fiber Quality of Cotton Cultivated in Greece

by
Mohammed K. Darawsheh
1,
Dimitrios Beslemes
2,
Varvara Kouneli
3,
Evangelia Tigka
4,
Dimitrios Bilalis
3,
Ioannis Roussis
3,
Stella Karydogianni
3,
Antonios Mavroeidis
3,
Vassilios Triantafyllidis
5,
Chariklia Kosma
5,
Anastasios Zotos
6 and
Ioanna Kakabouki
3,*
1
National Cotton Classification Centre, Institute of Industrial and Forage Crops, Hellenic Agricultural Organization Demeter, 43100 Karditsa, Greece
2
Research and Development Department, Alfa Seeds ICSA, 41500 Larissa, Greece
3
Laboratory of Agronomy, Department of Crop Science, Agricultural University of Athens, 11855 Athens, Greece
4
Institute of Industrial and Forage Crops, Hellenic Agricultural Organization Demeter, 41335 Larissa, Greece
5
Department of Business Administration of Food and Agricultural Enterprises, University of Patras, 30100 Agrinio, Greece
6
Department of Biosystems and Agricultural Engineering, University of Patras, 30200 Mesolonghi, Greece
*
Author to whom correspondence should be addressed.
Agronomy 2022, 12(4), 943; https://doi.org/10.3390/agronomy12040943
Submission received: 4 March 2022 / Revised: 7 April 2022 / Accepted: 13 April 2022 / Published: 14 April 2022

Abstract

:
The cultivation of cotton and in particular the quality characteristics of the fiber are mainly influenced by the growing conditions, the cultivation techniques as well as the climatic changes of the environment. The current study aimed to quantify the impact of environment, season, and their interactions on cotton fiber quality of different areas where cotton is grown in Greece. A large-scale database was created, consisting of more than 20,000 fiber samples from cotton fields of the four major cotton-producing regions of Greece (Thrace, Macedonia, Central Greece, and Thessaly) during 2016–2020, in order to evaluate thirteen fiber quality traits that were divided into four groups (fiber maturity, fiber length, color, and trash traits). The results of this work demonstrated that the effect of the environment and the interaction of the environment with year (season), were the important source of variance for almost all the qualitative characteristics studied. Regional climatic characteristics such as temperature, humidity and rainfall also significantly affected to a greater or lesser extent all quality characteristics. In conclusion, the different cultivation regions, in the broader sense of an environment that incorporates both climatic and management parameters, show stability in terms of the studied groups of quality parameters. This stability is independent of the high or low performance of the group features.

1. Introduction

In recent years, climate change has threatened agriculture globally, it is worth noting that cotton production in Greece is unlikely to be affected by it. According to several prediction models, Greece will maintain or increase its total cotton production within the next decade [1].
The main product of the cotton plant was the lint that is grown on the surface of the seed. This lint has been used for thousands of years as it was worn by ancient people in India, Asia, America, and Africa. Lint provides a source of high-quality fiber for the textile industry [2]. The cultivation of cotton, and in particular the quality characteristics of the fiber, are influenced by the growing conditions of the plants, the cultivation techniques, as well as the climatic changes of the environment [3]. Cotton fiber is mainly composed of cellulose, and any effect on the photosynthetic rate also affects the production of carbohydrates where they will have a similar effect on fiber development. Fiber quality parameters are a genetic characteristic; however, these parameters are significantly affected by crop management and environmental conditions [4,5,6]. Micronaire (fineness), length, strength are very important parameters for spinning, while maturity, elongation, and short fiber index are important fiber quality characteristics [7,8]. The genotype strongly influences the length of the fibers [9], while fiber strength and micronaire are affected by climate and management [10]. The cotton lint yields and fiber quality are affected by the quantity and quality of the solar radiation [11]. One of the most important environmental factors affecting micronaire during boll development, due to its impact on secondary wall thickening, is the temperature. Temperature changes during the period of fiber thickening will lead to differences in micronaire [12]. Color grade describes the cotton color and it is determined by HVI (RD and +b) and by specialized personnel called classifiers, who compare samples with five categories of color standards (white, lightly spotted, spotted, tinged, and yellow stained). Color has traditionally been related to physical cotton standards. Significant discounts for growers exist for poor grades. Cases of severe staining of cotton generally have no direct bearing on processing ability; however, differences in color can lead to dyeing problems. Discoloration is due to a range of influences approaching harvest including trash and dust content, rain damage, insect secretions, UV radiation exposure, heat, and microbial decay. Humid conditions or rainfall increase microbial, damage thereby potentially reducing color grades [13].
Development of management practices for high fiber quality requires an understanding of various mechanisms involved in cotton response to environmental conditions. Despite the complexity of these mechanisms on fiber development, yield, and quality, a lot have been explored [14,15,16,17,18,19], however the literature on critical analysis of the available data on the regional effects on cotton with respect to lint quality is lacking. The regional effect should not only be interpreted as environmental and climatic conditions of the specific region, but also as the crop management practices and technologies adopted by the majority of cotton growers [20].
Hence, the purpose of this study was: (1) quantify the impact of environment, season, and their interactions on cotton fiber quality of different areas where cotton is grown in Greece; (2) examine the geographical regional effect on specific groups of fiber quality parameters; and (3) assess the stability of the projected environments in relation to these quality parameter groups.

2. Materials and Methods

2.1. Data Curation

The data were collected from the National Centre for Quality Control, Classification, and Standardization of Cotton (1st km Karditsa-Mitropolis, 43100 Karditsa, Greece), which is the division of the Institute of Industrial and Forage Crops of the Hellenic Agricultural Organization “DEMETER” (Τheofrastou 1, 41335 Larissa, Greece). The National Centre for Quality Control, Classification and Standardization of Cotton possess a large-scale database regarding the quality traits of Greek cotton. The data used in the present study were obtained during 2016–2020 from cotton fields throughout four major cotton-producing regions of Greece: Thrace (E1), Macedonia (E2), Central Greece (E3), and Thessaly (E4). In total, more than 20,000 samples were utilized in this process.

2.2. Measurements and Equipment

Thirteen quality traits were assessed in order to evaluate the quality of the cotton fibers. These traits were divided into four groups as presented in Table 1.
Measurements were carried out via a High Volume Instrument (HVI) spectrum system (Zellweger Uster Inc., Uster, Switzerland). Specifically, the micronaire reading is an indirect measure of the fiber fineness in standard micronaire units. Micronaire is measured by relating airflow resistance to a specific surface of fibers. Micronaire is lower for finer fibers. Additionally, the fiber length, reported in millimeters, was measured as 2.5% span length. The fiber uniformity (UI) was determined as the ratio of 50 to 2.5% span lengths (50/2.5), and was expressed as a percentage. Concerning the fiber strength, this is measured physically and has the force necessary to break a fiber bundle by clamping them between two pairs of clamps at a specific distance. With regard to whiteness, this indicates the degree of cotton pigmentation. Two parameters, reflectance degree (Rd) and yellowness (+b) represent the cotton color, while the percentage of them express the whiteness. Moreover, the elongation of the cotton fiber is reported as a percentage of the extended fiber bundle before breakage. In addition, short fiber content is represented as the percentage of fibers that are 13 mm or shorter in length.
Finally, Spinning Consistency Index (SCI) is based on the individual HVI properties. The regression equation [21] used to calculate the SCI is as follows:
S C I = 414.67 + 2.9 S T R 9.32 M I C + 49.17 U H M L + 4.74 U I + 0.65 R d + 0.36 + b

2.3. Climate Data

Mean monthly temperature (°C) and precipitation (mm) recorded throughout the duration of the study in each area are presented in Table 2. All the meteorological data were obtained from the Institute for Environmental Research, National Observatory of Athens (IERSD/NOA) [21].

2.4. Statistical Analysis

Data were subjected to analysis of variance (ANOVA) using SPSS software (SPSS Inc. version 22.0, IBM Corp, Armonk, NY, USA). Significant differences between means were determined by Tukey’s Honestly Significant Difference test (HSD) at two levels of significance (p = 0.05 and p = 0.01) [22]. Results regarding the environmental effects are graphically depicted via PCA biplot analysis [22,23]. Graphs were exported using GGEBiplot software (GGEBiplot version 4.1, Weikai Yan). The initial analysis of ANOVA was used to calculate the proportional effect of the factors “Environment”, “Year” as well as the interaction “Environment × Year”. Factor “Genotype” was not analyzed since no varietal separation was performed prior to sampling. Data were treated as having originated from a single population.

3. Results

3.1. Climate between Year and Environment

The mean temperature varies considerably between years and environments (Table 2). Thessaly (E4) recorded the highest mean temperature in each experimental year, with a range of 23.2 ± 6.2 °C to 23.6 ± 6.5 °C. On the other hand, Thrace (E1) had the lowest mean temperature values (21.1 ± 6.6–22.3 ± 6.5 °C) every year, with a difference of 1.8 °C less than Thessaly in the total average.
In Thessaly (E4) and in Thrace (E1) the total average (average of 2016–2020) precipitation (mm) had the highest (263.4 mm) and lowest (210.7 mm) values, respectively. Regarding Thrace (E1), the highest value (290.2 mm) was exhibited in 2019, while the lowest value (133.2 mm) was in 2016, which was the minimum value presented throughout the growing period of all years. In Macedonia (E2) and in Central Greece (E3) the maximum values were recorded during 2018, with values 297.4 mm and 347.7 mm, respectively. Specifically, the highest value among all years was the value mentioned above, of 347.7 mm in Central Greece during 2018. Moreover, the lowest precipitation (mm), in Macedonia (E2) and in Central Greece (E3) were in 2017 (207.1 mm) and in 2016 (147.8 mm), respectively. Additionally, in Thessaly (E4) the year 2020 was noted as having the highest precipitation (322.4 mm), while the lowest was presented in 2019 (207.9 mm).

3.2. Effect of Environment, Year and Their Interaction

The statistical analysis displayed in Table 3, revealed a highly significant effect of Environment (E), Year (Y), and their interaction (E × Y) (p < 0.001) on cotton quality measurements viz. Mic, Mat, Str, Elg, UHML, UI, SF, Rd, +b, SCI, TrCnt, TrAr, and TrID. It is notable that (E) contributed to the highest portion of the total variance in most cases and for this reason, PCA analysis was used to study the environmental effect across the five years. On the opposite, E × Y contribution to the variation was the lowest, except for color traits. Analytically, E was the significant source of variation for Mic, Str, and Elg at 49.6%, 44.9%, 52.8%, respectively, and within fiber length traits for UHML at 53.6% and for UI at 62.9%. Extraneous matter measurements were highly environmentally controlled, given that the E effect accounted for 85.15% of TrCnt, at 80.6% for TrAr, and at 80.2% for TrID. Additionally, Y was the significant source of variation for Mat at 47.4% and for Sf and SCI at 47.1%, respectively. Although, the lowest portion for the majority of measurements was attributed to E × Y, for color fiber measurements the highest portion of variance was 45.4% for Rb and 58.4% for +b.

3.3. Variation between Environments

Significant differences were detected among quality attributes of raw cotton across the four growing environments (Table 4). Cotton grown in Thrace (E1) recorded the higher values in MIC (micronaire of fiber) and the lowest values in ELG (elongation (%), whereas when grown in Central Greece (E3) recorded the exact opposite performance on these specific characteristics. In Macedonia (E2) and in Thessaly (E4) the maturity index of fiber (MAT %) had the lowest and the highest values, respectively, while the strength of fiber (STR) was higher in Thessaly (E4) and lower in Thrace (E1). There were also significant differences (p ≤ 0.05) in UHML, UI and SF originated from the four environments. Thrace (E1) produced cotton with the lowest values in both UTML and UI while Macedonia (E2) produced cotton with the lowest values in SF. The rest of the environments gave moderate values in these fiber attributes. Significant environmental variation existed for the quality attributes reflecting color, Spinning Consistency Index (SCI), Reflectance (Rd), and Yellowness (+b). Specifically, cotton grown in Trace (E1) exhibited the lowest values in SCI (i.e., 121.8) and the higher values in Rb (i.e., 72.7). Likewise, Macedonia (E2) produced cotton with the lowest values in Rb (i.e., 71.1) and the highest values in +b (i.e., 9.8). Once again Central Greece (E3) exhibited modest values in SCI, Rd, and +b and Thessaly (E4) produced cotton with the higher SCI index (i.e., 129.9). Finally, regarding cotton extraneous matter measurements, Trash count (number; TRcnt), Trash Area (TrAr; %), and Trash Grade (TrID), significant differences were also detected, originating from the four different environments. Analytically, cotton grown in Thrace (E1) and in Central Greece (E3) had the lowest TRcnt, TrAr, and TrID whereas in Macedonia (E2) had the highest values.

3.4. Variation between Years

The year was also found to be a significant source of variation for all the analyzed quality attributes of cotton as shown in Table 5. Regarding fiber maturity traits, the lowest values for Mic and Mat were recorded in the year 2020, and oppositely, in the year 2016, the higher values were recorded for Str and Elg. All, except for these years, have presented moderate values aside from 2017, where Elg reached the highest value (i.e., 7.9). Similarly, the UHML, UI and SF attributes varied across the years. The cotton produced in 2016 averaged low values of UHML and UI (28.2 and 82.3, respectively) and in 2018 the highest values of UHML and UI (28.9 and 83.1, respectively). Cotton that was produced in 2018 and in 2019 recorded the lowest and highest SF, respectively. Additionally, significant differences were detected among the cotton color values SCI, Rd, and +b across the years. Specifically, SCI recorded the higher value (i.e., 120.6) in 2016 and the lowest (i.e., 130.5) in 2018, Rd fluctuated from 71.5 to 73.3 across the years and +b from 9.3 to 9.7. Regarding cotton extraneous matter attributes TrAr and TrID, no statistical differences were detected among the years 2016, 2017, and 2019. On the contrary, significant differences were noted in TrCnt averaged across the years, with the lowest value being observed in 2016 and the highest in 2019.

3.5. Environmental Stability with PCA Analysis

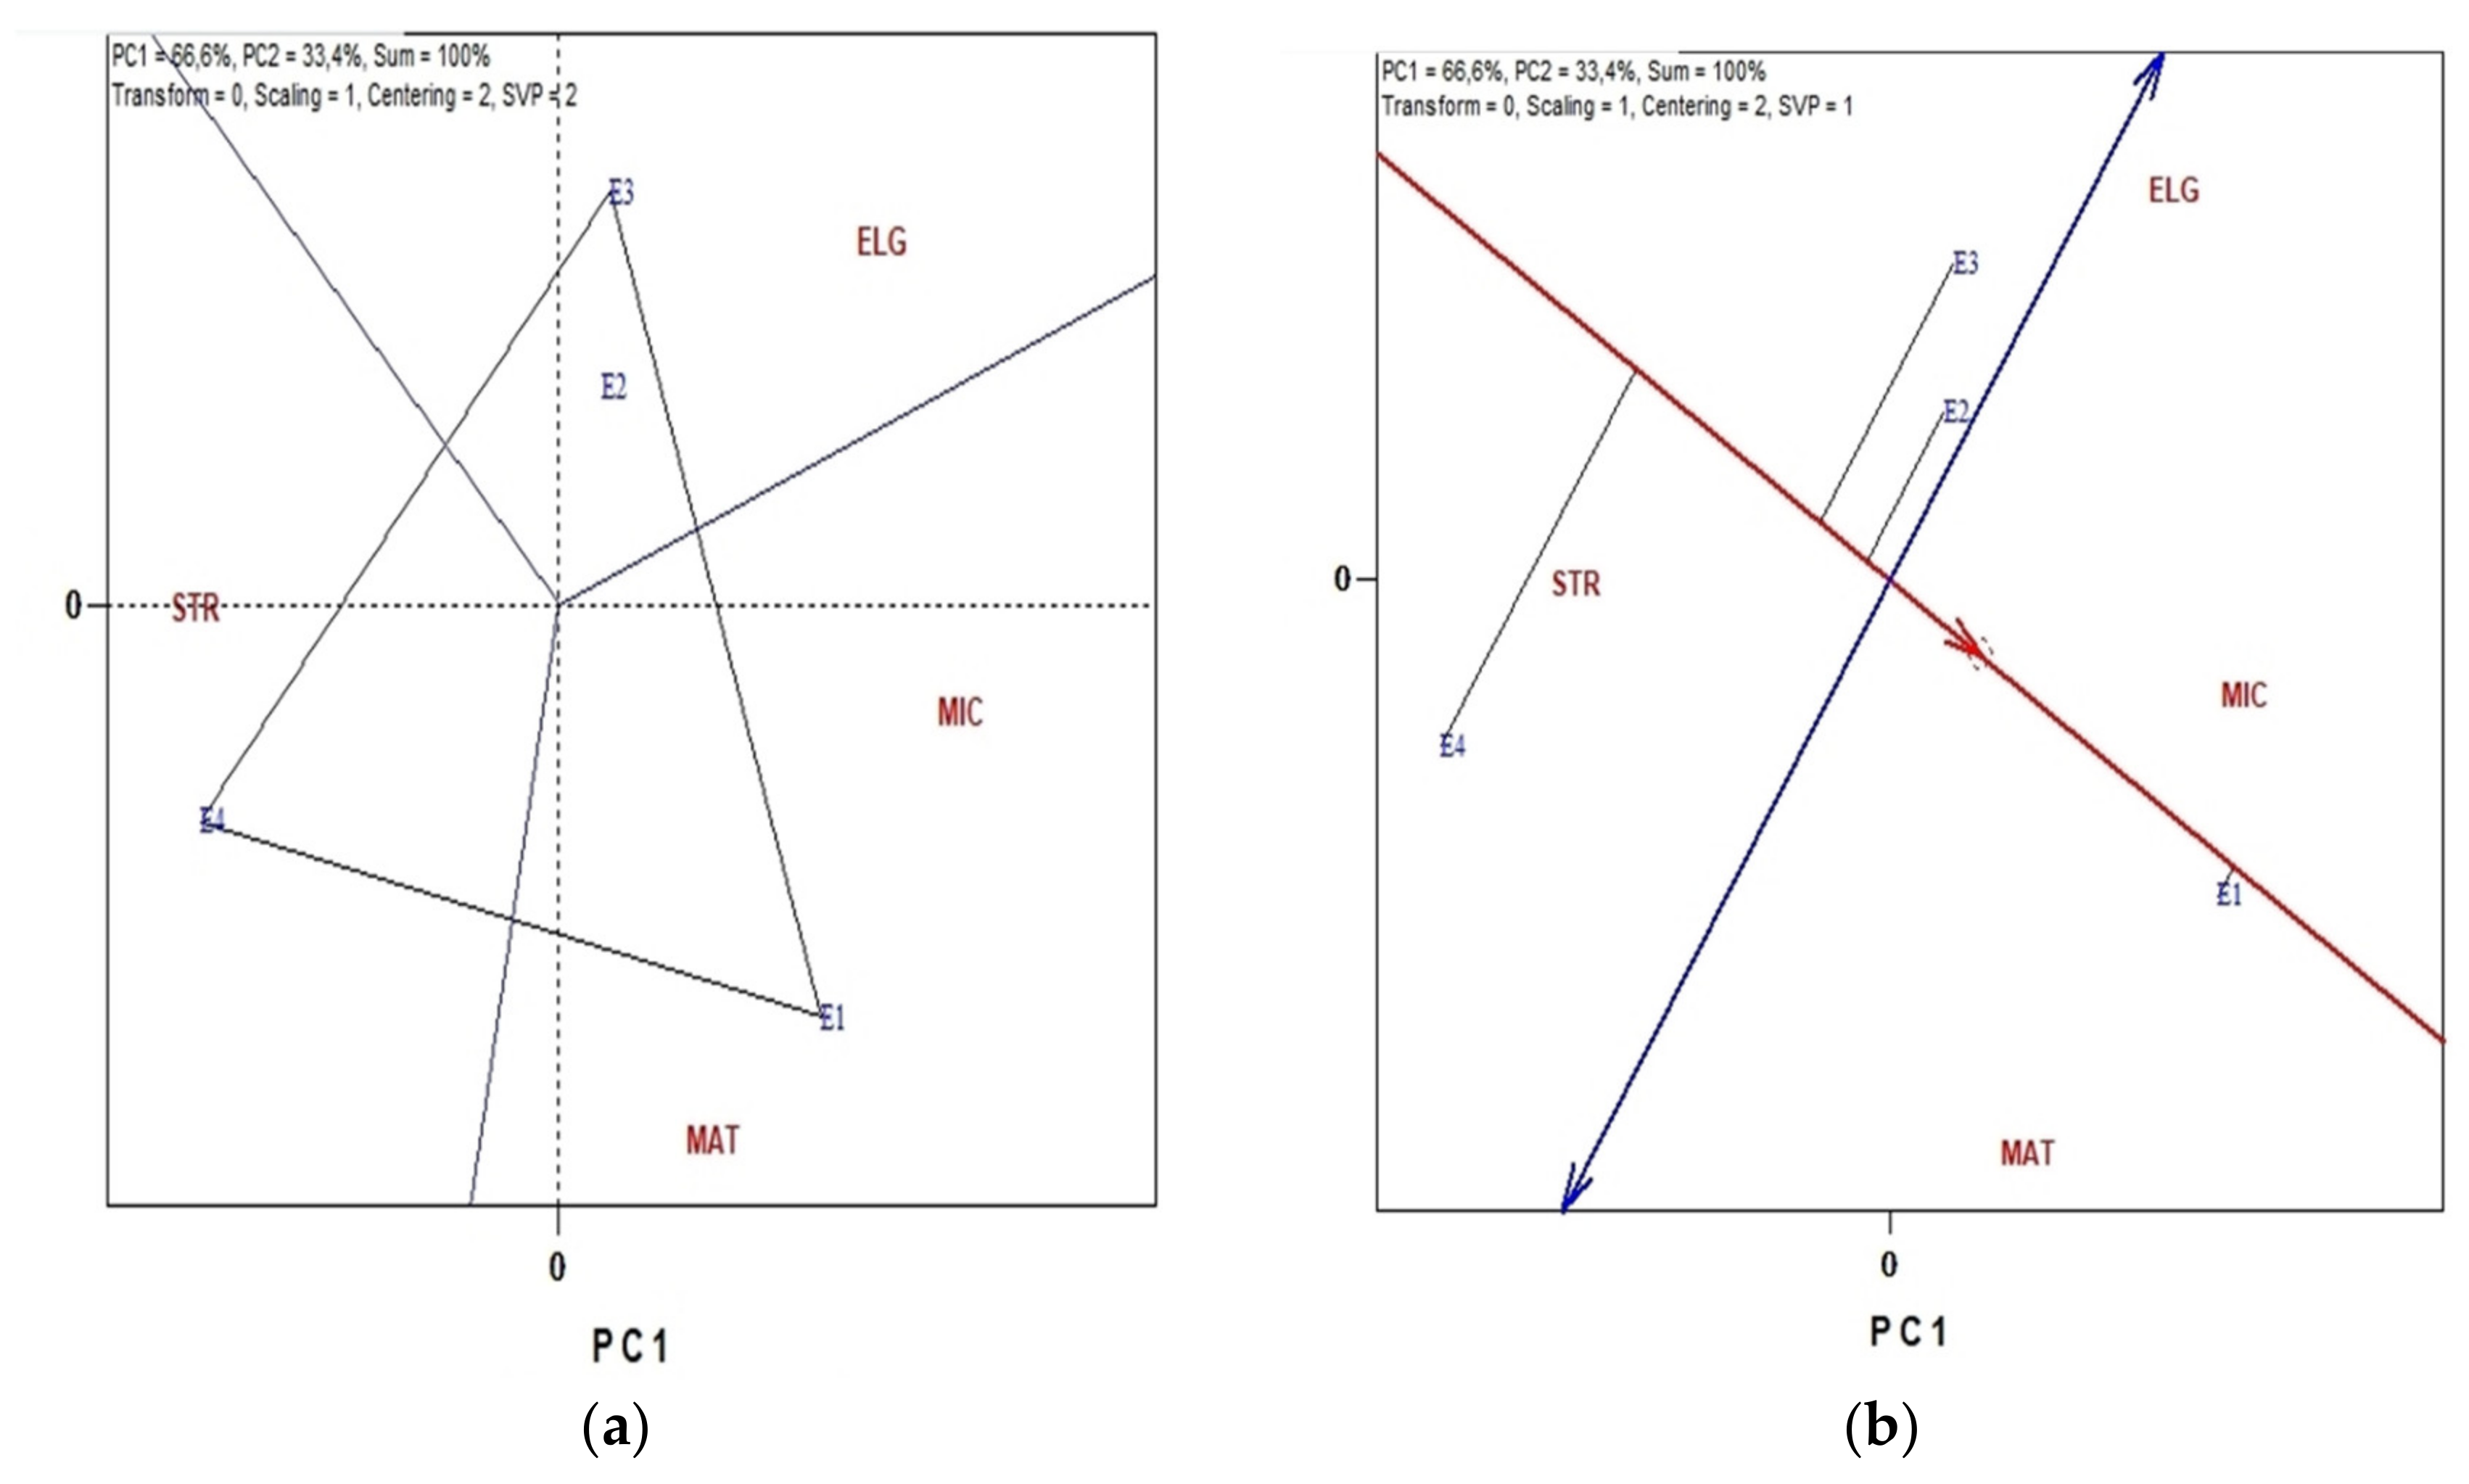
3.5.1. Fiber Physiological Traits

Biplot analysis of cotton quality measurements Mat, Mic, Str, and Elg, across four environments in five years is illustrated in Figure 1. Biplot on the left is a trait (measurement)-metric preserving (SVP = 2) and therefore is appropriate for visualizing the relationships among the traits/measurements, while the Biplot on the right, in Figure 1, was based on environment-focused singular value partitioning (SVP = 1) and therefore is appropriate for visualizing the similarities among environments.
The Biplot analysis, in Figure 1a, was constructed with the polygon view. The polygon view shows us which environment is favorable for the selected quality properties of cotton fiber in the specific group. Thus, the E3 environment (Central Greece) located in the upper vertices of the polygon, performed highly for the elongation (Elg) of fiber. Environment E1 (Thrace) is the winning environment for micronaire (Mic) and maturity index (Mat). Additionally, these quality measurements, i.e., Mic and Mat, seem to have a strong relationship in E1. Finally, Thessaly (E4) is uniquely associated with the Strength (Str) of the fiber. In image b of Figure 1, the single-arrowed line is the “Average Environment Coordination” (“AEC”) abscissa; it points to a higher mean value across environments. The doted small cycle on “AEC” defines an ideal environment for the physiological traits of Fiber, which is between E1 and E2. According to the double-arrowed line, the ordinate, that points to greater variability (poorer stability) in either direction, E4 followed by E3 were highly unstable, whereas E2 was moderately stable and E1 was highly stable. The ideal environment is E1, which is highly stable with the cotton grown in that environment having higher mean values in Fiber maturity affected quality traits.

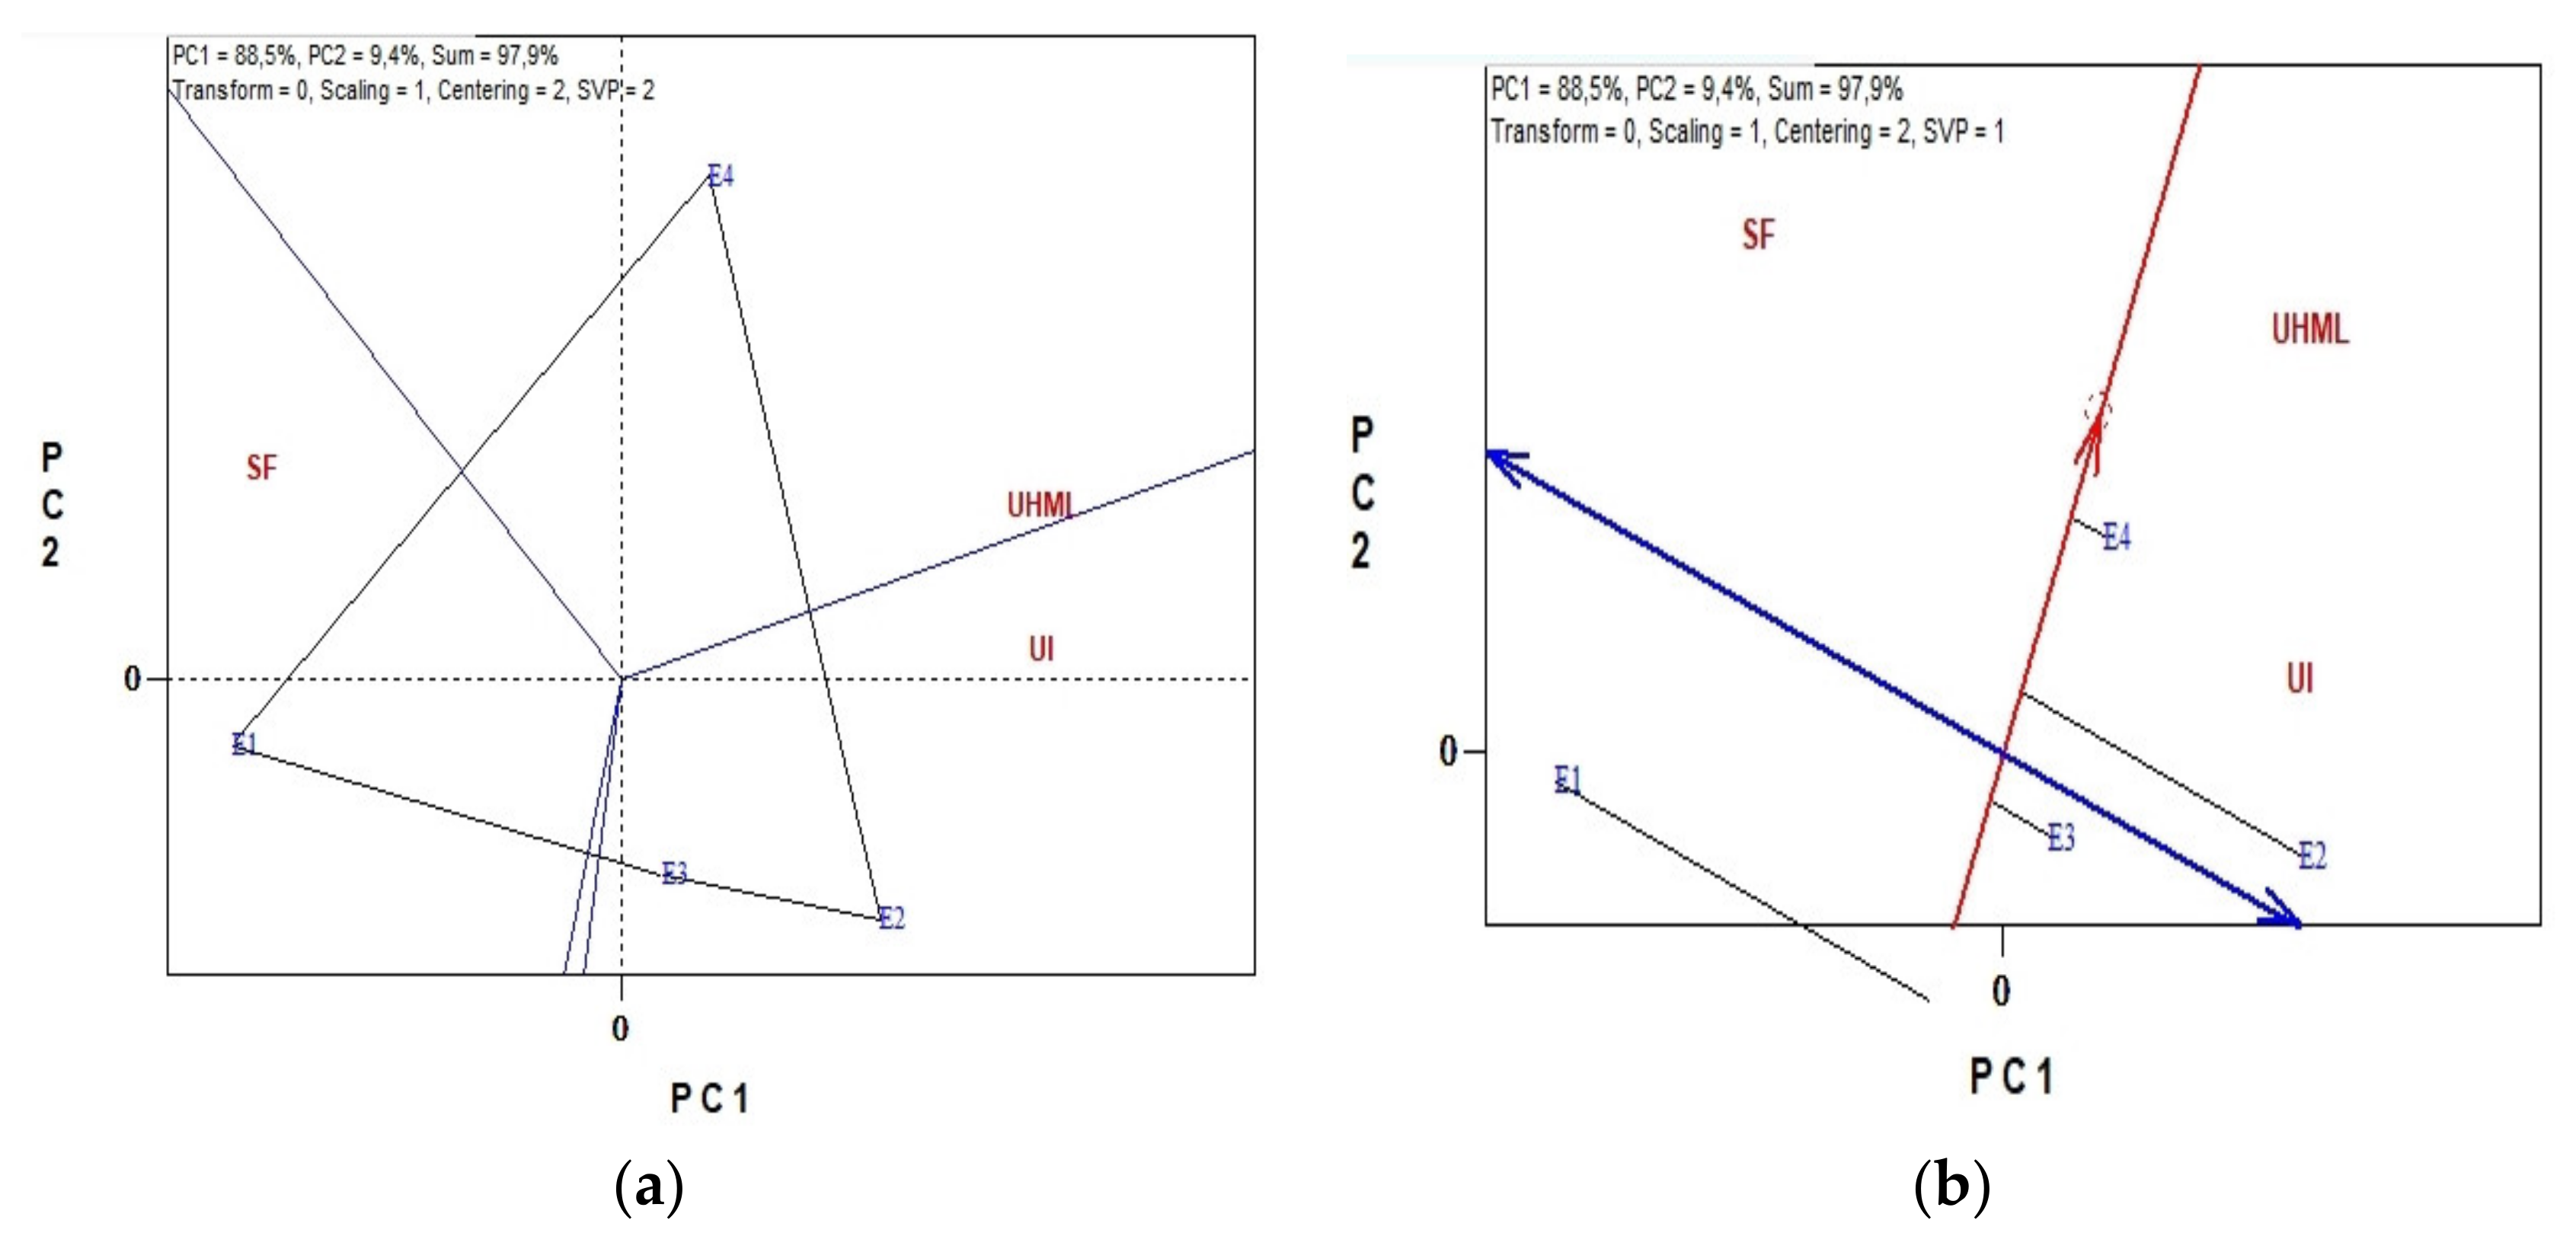
3.5.2. Fiber Spinning Traits

Figure 2 illustrates the view of the biplot analysis for Fiber length traits UHML, UI, and SF across four environments for five years. The biplot analysis explained 97.7% of the total variability.
In Figure 2a, E1, E2 and E3 environments are located in the vertices of the polygon that contains all the environments. The environments located on the vertices of the polygon performed either the best or the poorest in one or more traits under study, i.e., UHML, UI, and SF. The equality lines divided the biplot into sectors and the winning environment for UHMl is E4 (Thessaly) since it is located on the respective vertex. Similarly, E2 (Macedonia) is the winning environment for UI as the single-arrowed line points to a higher mean trait across environments, and E1 (Thrace) for SF. Additionally, as illustrated Figure 2b, the single-arrowed line that points to a higher mean trait across environments depicted E4 (Thessaly) as the most stable environment for high mean values for all Fiber spinning traits. Environment E2 produces cotton with high mean values of Fiber length traits, although it is not stable across the years. Moreover, E3 is stable but produces cotton with low mean values of traits, while E1 is totally unstable with the lowest mean values, especially for UHML and UI measurements.

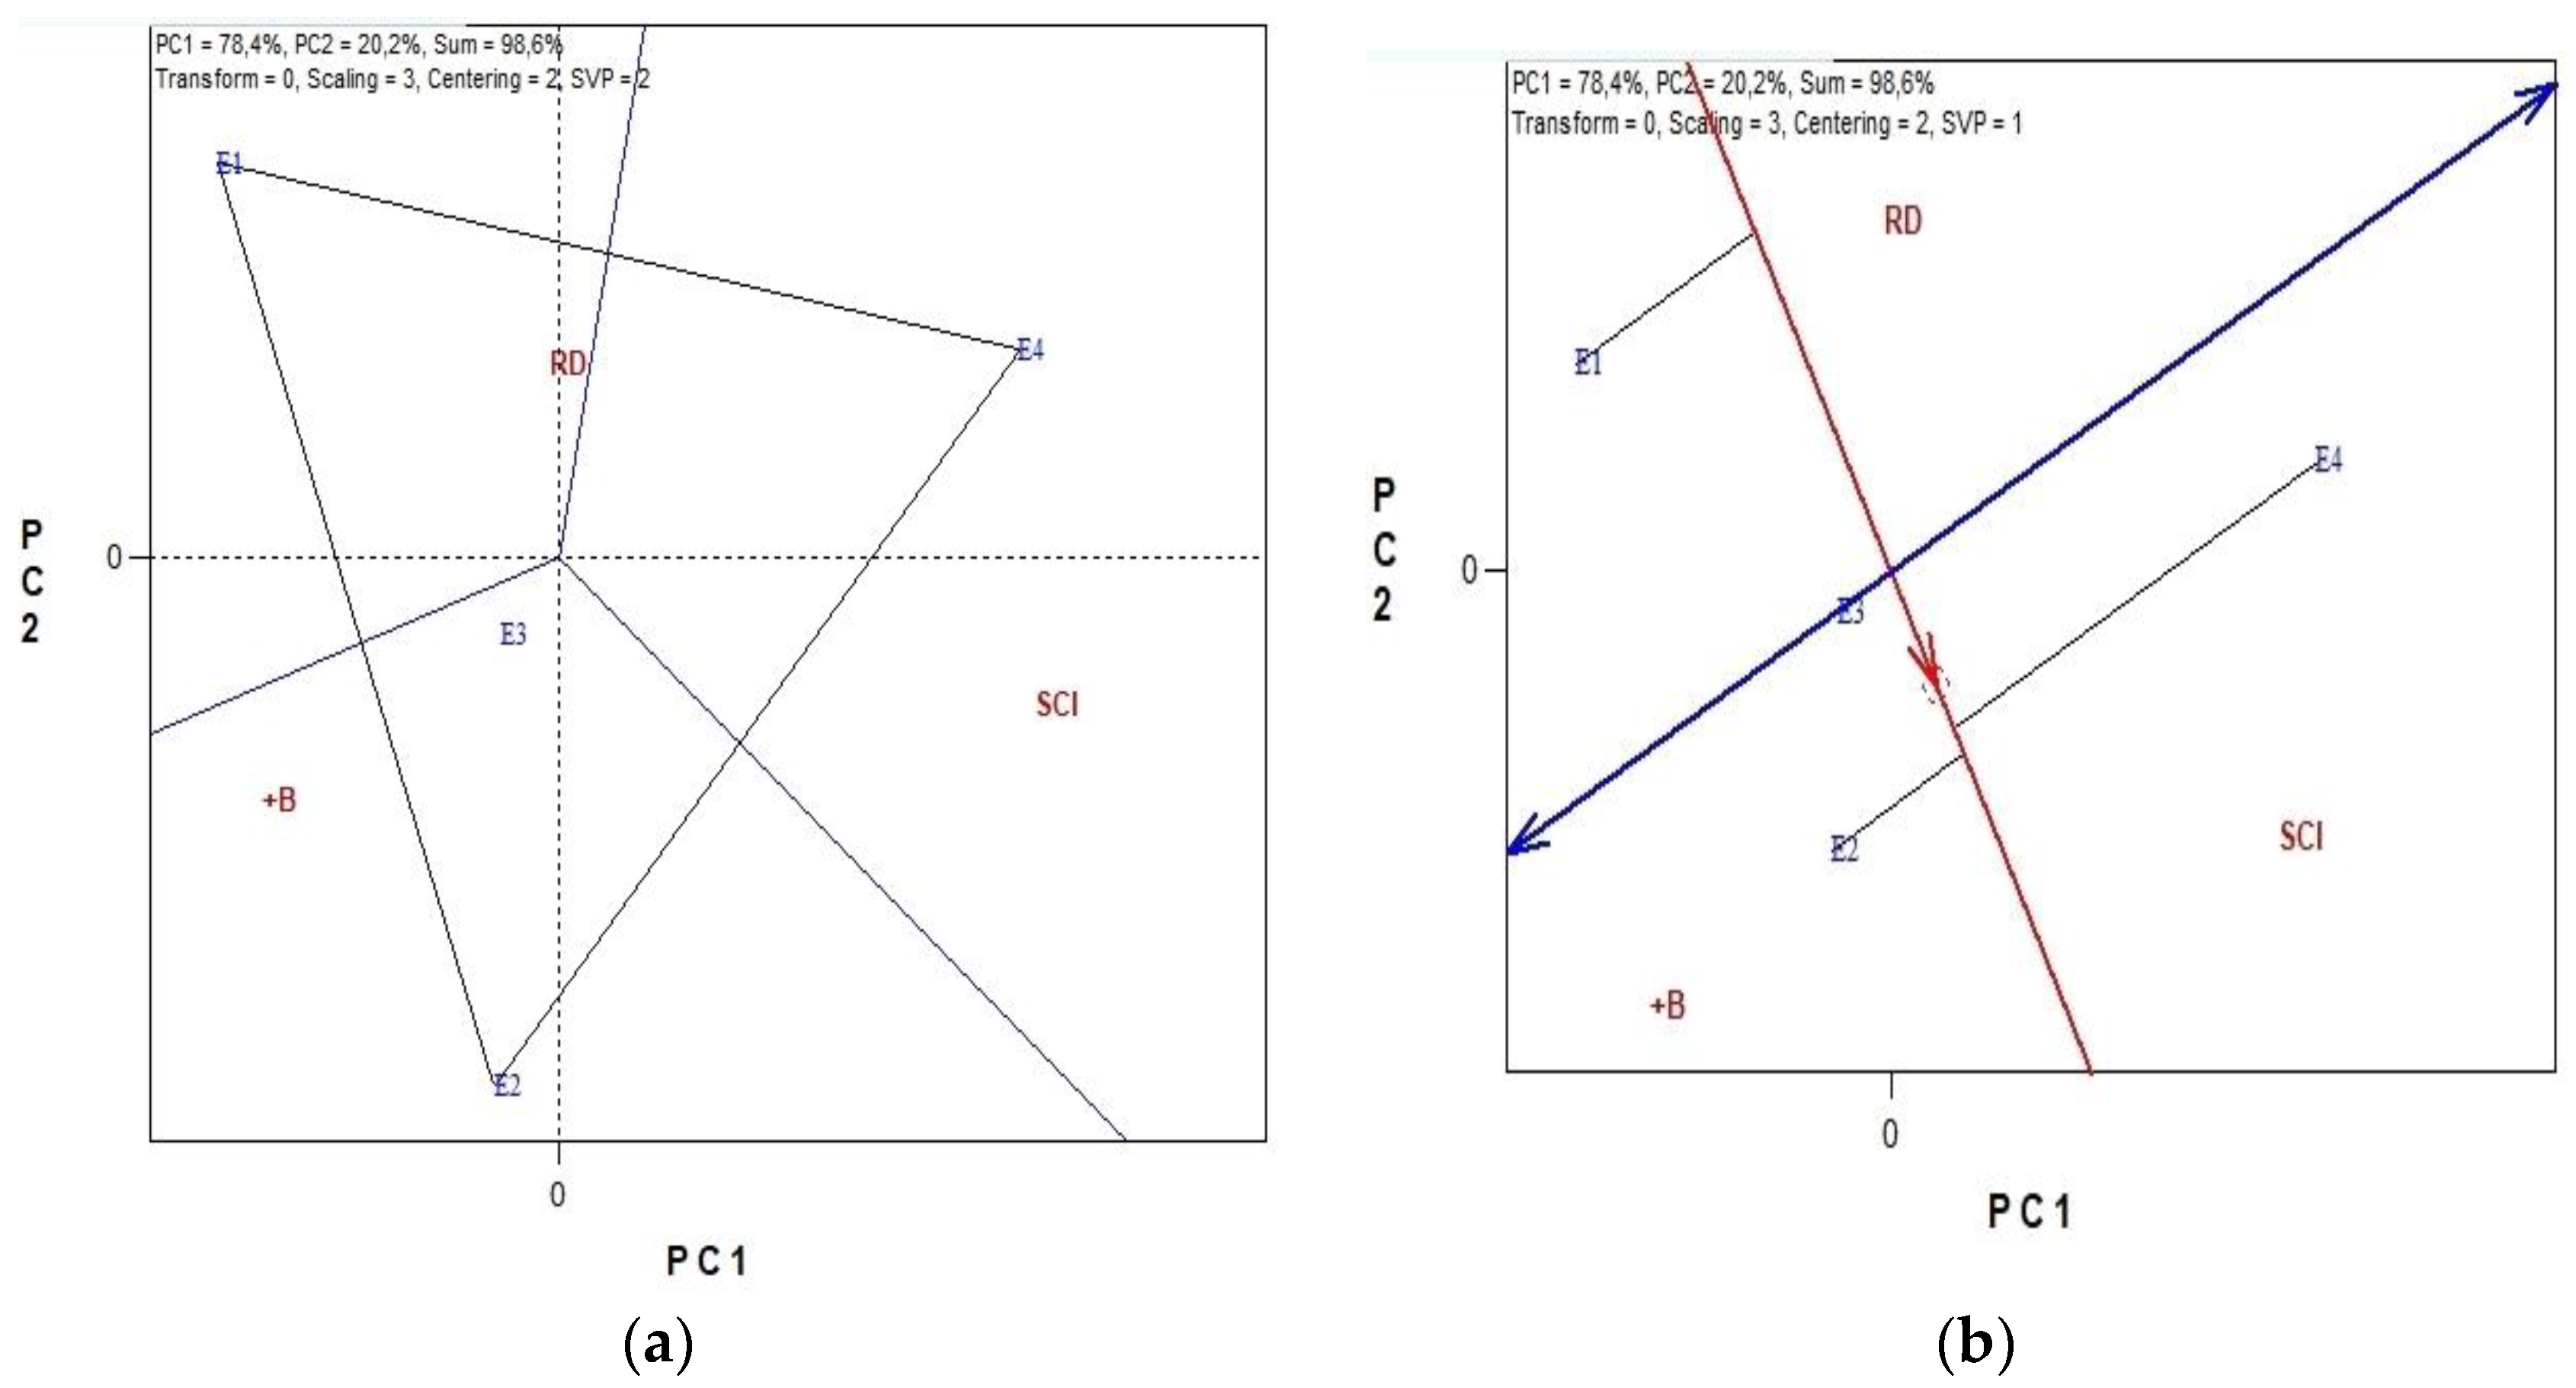
3.5.3. Cotton Color Traits

Three cotton color traits, Rd, +b, and SCI are illustrated in Figure 3a,b. Biplot analysis explained 98.6% of total variability. In Figure 3a, the biplot analysis is trait-metric preserving (SVP = 2), and in Figure 3b, it is appropriate for visualizing the similarities among environments (SVP = 1).
Biplot in Figure 3a is divided in three major sectors with a winning environment in each sector. Analytically, in E4 (Thessaly) SCI recorded the highest values from all the other environments. The E1 (Thrace) environment was uniquely connected with Rd color trait and E2 (Macedonia) with +b. Biplot analysis in Figure 3b revealed the ideal environment, according to the cycle in the single-arrowed line, “Average Environment Coordination” (“AEC”) abscissa. It is worth mentioning that although E4 produced cotton with high values of color measurements, it is highly unstable while E1 was more stable with a high mean performance in color traits of cotton. On the contrary, E3 and E2 are the most stable environments for cotton color traits.

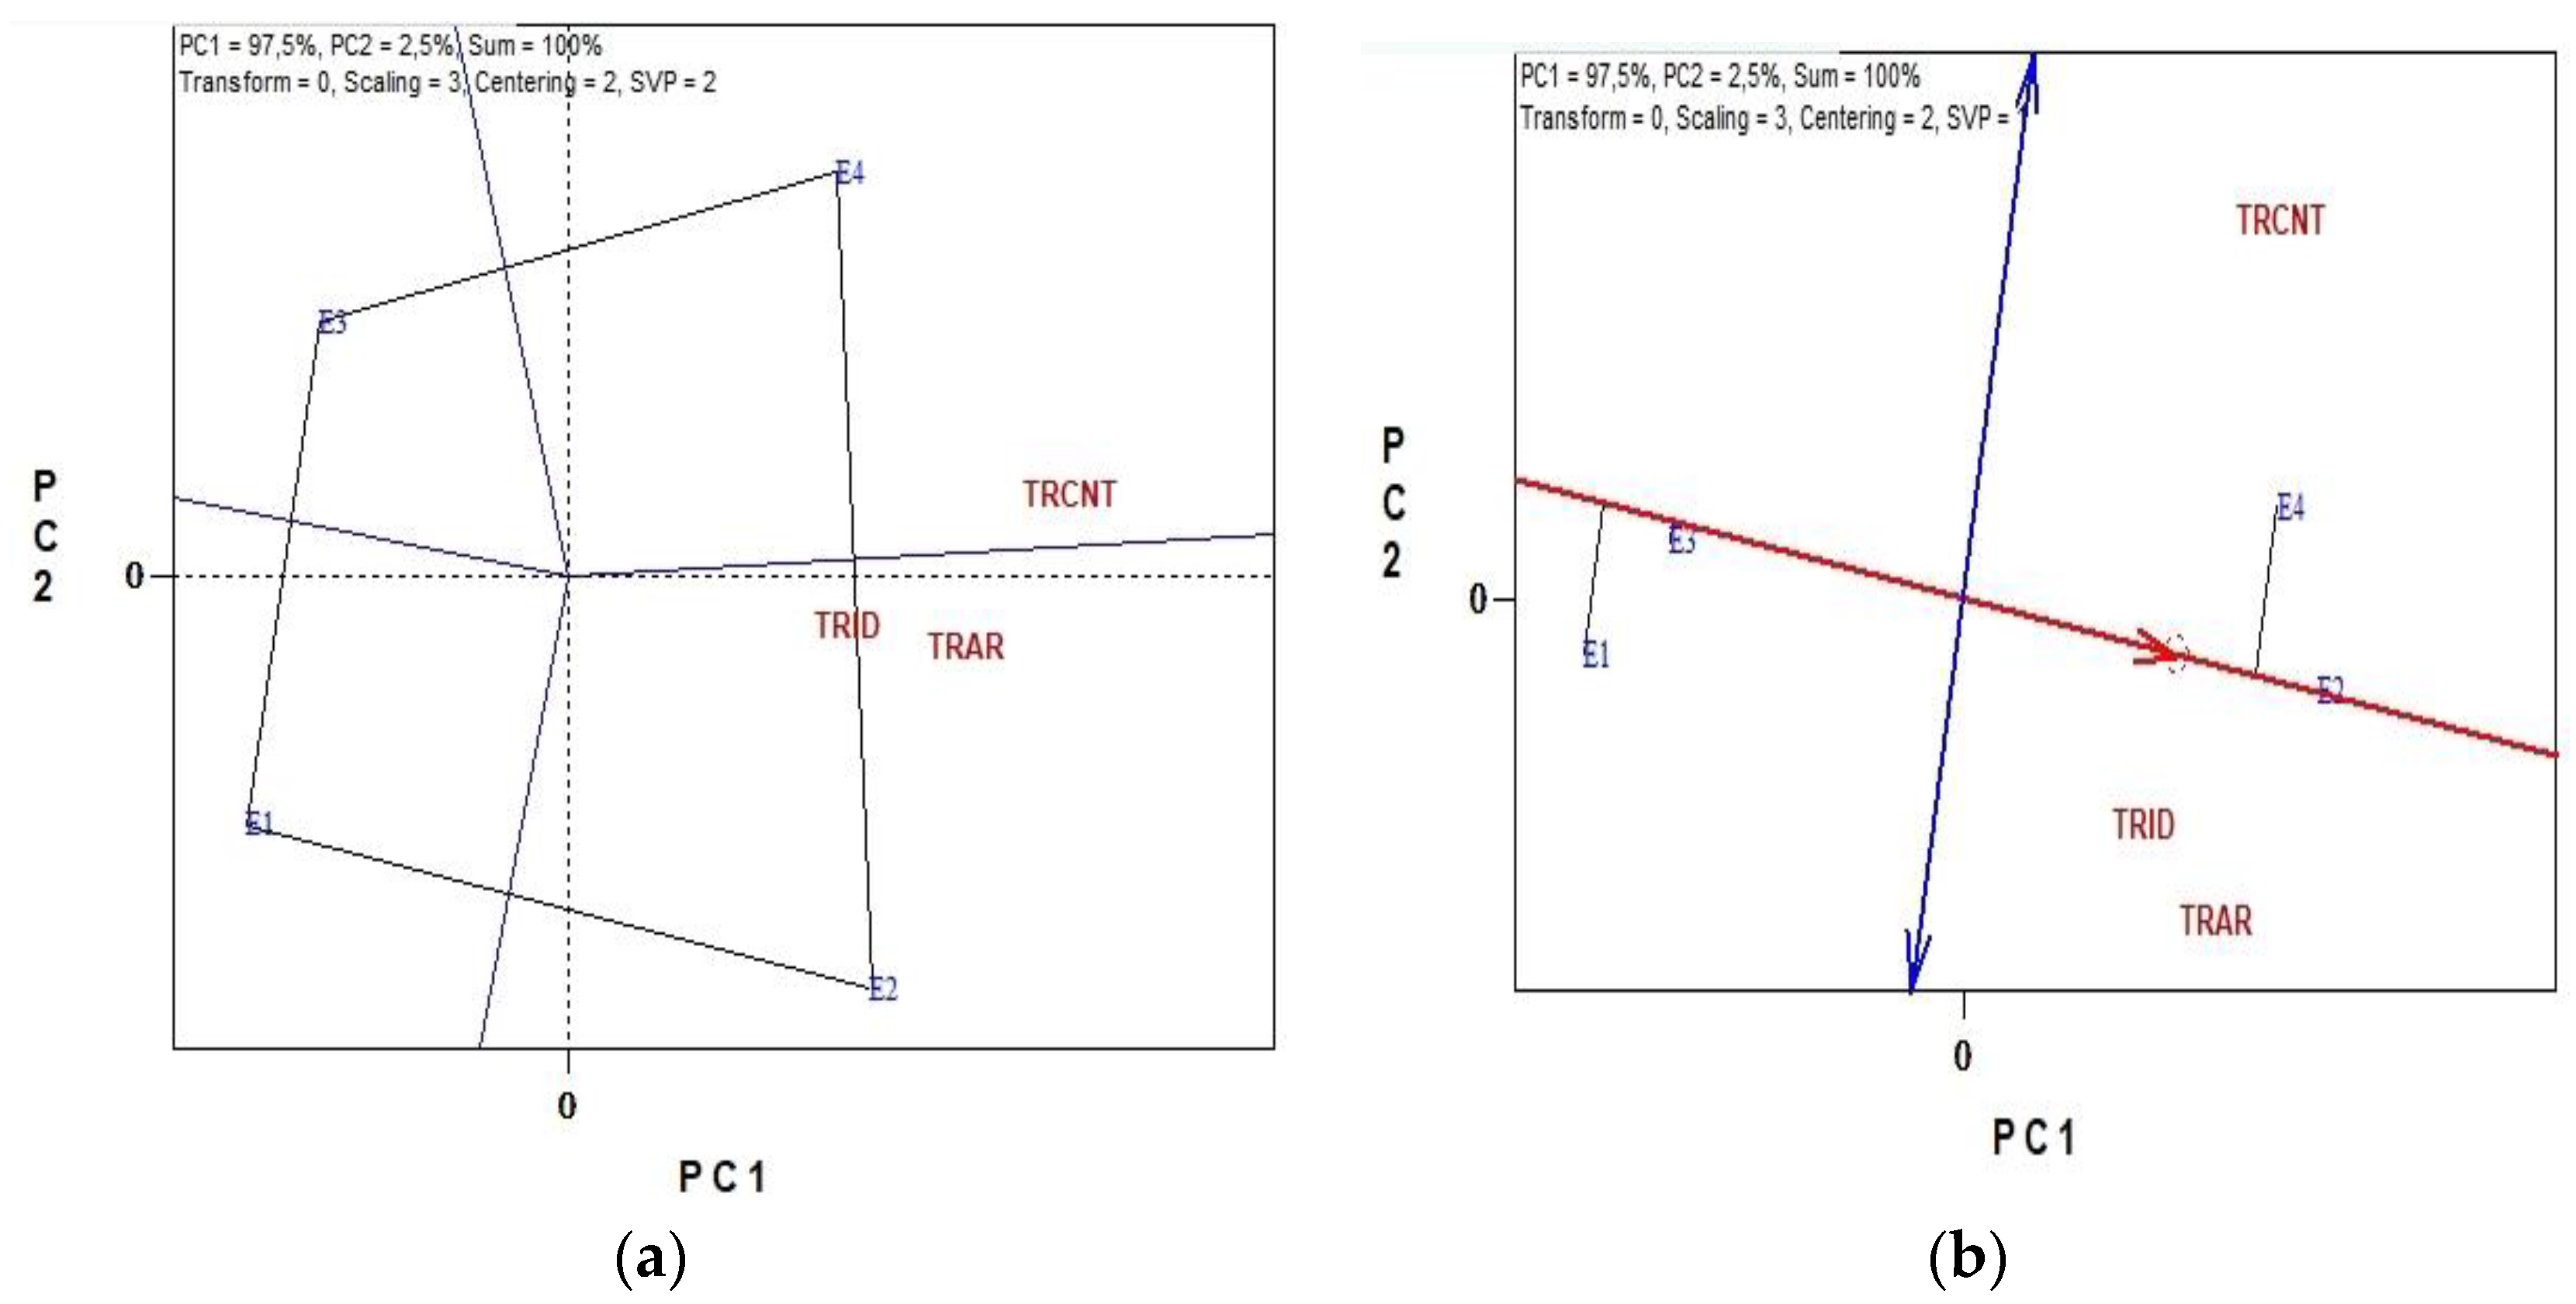
3.5.4. Cotton Trash Traits

Three cotton trash traits TrCnt, TrID and TrAr averaged across four environments in five years are presented by Biplot analysis in Figure 4. Biplot in Figure 4a is trait (measurement)-metric preserving (SVP = 2), while the Biplot in Figure 4b was based on environment-focused singular value partitioning (SVP = 1).
The Biplot view of Figure 4a consists of an irregular polygon of environments that are located on the four vertices of the polygon. Additionally, biplot analysis revealed the strong relationship among TrID and TrAr quality measurements with the best environment for these measurements E2 (Macedonia). Environment E4 (Thessaly), is located on the right vertices of the polygon and performed highly for TrCnt. On the opposite, Environments E1 (Thrace) and E3 (Central Greece) are the poorest in terms of Cotton trash traits and therefore the superior environments for producing cotton. According to Biplot analysis in Figure 4b, all the environments are satisfyingly stable with environments E2 and E3 to be distinguished as the most stable. Nevertheless, environment E1 and E3 recorded the lowest mean values in these measurements. In contrast, the E2 and E4 environments produced the highest mean values of Cotton trash traits, becoming clearly the least desirable environments regarding extraneous matter.

4. Discussion

Producing quality fiber is important, not only as both the quantity and quality of fiber determine the end economic value of the cotton crop, but due to the consequences of producing poor fiber quality being substantial for Greek cotton competitiveness. In ensuring that fiber quality is maintained, it is important to understand the nature of fiber and the interacting factors that affect its quality. Cotton fiber quality is a complex trait, which is the result of various morphological and physiological features of the plant. Both of these parameters are polygenic in nature and highly influenced by environmental conditions and agronomic management.

4.1. Effect of Environment, Year and Their Interaction

In this study, four different areas were studied across five consecutive years. The four areas from which samples were collected were located in central-south, central, northern-central and northern Greece and showed significant differences in the main pedoclimatic parameters, such as air temperature and rainfall, which resulted in four different environments typical of the Mediterranean region.
Regarding temperature, a few days of suboptimal temperature can have an impact on cotton yield quality at any time during fiber growth and development. Cotton sheds some squares, flowers, and bolls to ensure survival under unfavorable conditions, such as excessive heat or moisture, low temperature, or receiving less nutrients than the optimal requirements, resulting in a significant decline in fiber quality [24]. Cotton fiber quality-related traits, such as fiber strength, elongation, fineness, and micronaire value, are negatively affected under high temperatures [25]. Since fiber is primarily composed of cellulose, any effect on net crop photosynthesis and carbohydrate production will have a corresponding effect on fiber thickening. The temperature has a significant impact on photosynthesis. Temperature fluctuations over time during the fiber-thickening process will result in differences in the physiological properties of the fiber [25]. In our study, it was observed that E4 (Thessaly) recorded the higher average temperature as well as the higher temperature during the critical fiber thickening period, despite being located further north than E3 (Central Greece), during all the studied years. Similarly, E2 (Macedonia) recorded an average temperature close to E2 and E1 (Thrace), despite being located further north, yet steadily recorded lower temperatures during the five years. Such differences between environments are important for studies in cotton lint, as they dissect the E × Y interaction.
On the contrary, rainfall greatly fluctuated among both areas and years. As a result, no steady pattern could be attributed. Cotton crop in Greece requires supplement irrigation of about 350–450 mm depending on sowing time, as early sowing cotton needs less irrigation water, and cotton crop requires minimum rainfall [26]. Heavy rainfall, especially of an erratic and intense nature, is more dangerous to cotton crop during either the vegetative or the reproductive phase. The dry growing season under the irrigation crop is good for the production of quality fiber as rainfall during the later growth stages may cause excessive vegetative growth, which leads to squares and boll shedding, while opened boll is dangerously affected by erratic and intense rainfall, especially in terms of cotton quality [27,28]. High rainfall leads to high wet conditions, which provides the favorable climatic conditions for many of the insect pest and diseases. Excessive rainfall promotes the vegetative growth, more biomass, and lower yield as it is an indeterminate crop so balanced fertilizer and irrigation management are crucial. The best suitable area for cotton on the basis of rainfall conditions should be considered to be E2 (Macedonia) during the years 2017–2018 and E1 (Thrace) during the years 2016–2020.
Environment, Year and Environment × Year interaction affected all of the quality traits studied, viz Mic, Mat, Str, Elg, UHML, UI, SF, Rd, +b, SCI, TrCnt, TrAr, and TrID, whereas, solo environment affected almost totally the trash traits TrCnt, TrAr, and TrID. This finding greatly reflects the importance of management considerations from open boll to harvest, including appropriate irrigation management for finishing the crop and avoiding regrowth, managing aphid and whitefly infestations to avoid sticky cotton, accurately determining crop maturity, ensuring timeliness of harvest operations to avoid wet weather, effective application of harvest aids [29], as well as growers know how and favorable harvest equipment viz. picker versus stripper harvesters [30]. As mentioned earlier, a regional effect should not only be interpreted as environmental and climatic conditions of a geographical area, but also as the crop management practices and technologies adopted by the majority of cotton growers of that specific area [20].
Moreover, environment was the major source of variation, as it explained more than 80% of the total variation in the above traits, around 50% of the variation for maturity traits (quality characteristics or parameters), except maturity, spinning traits and short fibers. In addition, the relatively large magnitude of the E × Y interaction sum of squares observed in color traits (except SCI that is a complex index) was from two to six times larger than that for environment. This indicated that there were sizable differences in responses according to environment across the years.
Typically, when investigating the environmental (regional) effect on cotton lint quality traits, genotype is almost in all cases included in the study, as many of the quality traits are genetically controlled [31]. Genotype and Genotype × Environment interactions affecting key quality attributes, such as fiber quality, present special challenges in the improvement of crops such as cotton. While it is anecdotally accepted that some genotypes are better-suited to an area than others, the very large sample pool of our study (over 20,000 samples) permits the assumption that genotype adaptation to these very different environments can be considered as equal. This new approach suggests that complex traits such as fiber quality may also be fine-tuned to specific conditions, presumably in conjunction with the development of climatic cultivation zones, helping to maintain both productivity and quality.

4.2. Quality Traits Biplot Analysis

ANOVA showed that Environment (E) was the main source of variation ranging from 36.8% to 85.1%. (E) contributed to the highest portion of total variance in most cases and for this reason PCA biplot analysis was used to study the environmental effect across the five years. Biplot analysis was performed both as trait (measurement)-metric preserving (SVP = 2) and therefore appropriate for visualizing the relationships among the traits/measurements and as environment- focused singular value partitioning (SVP = 1) and therefore appropriate for visualizing the similarities among environments [32].
Among fiber maturity traits, MAT (maturity index) was less explained by E as the main source of variation and fluctuated from 20.3 for E2 to 24.8 for E4. The ideal environment in terms of stability for the maturity quality traits (parameters) was E1 (Thrace) viz. mean values of Mic 4.7, Mat 0.859, Str 29.4 and Elg 7.6. Fiber length and micronaire are significantly affected by agronomic and climate effect as fiber growth and development is affected by most factors that influence plant growth. Since the fiber is primarily cellulose, any influence on plant photosynthesis and production of carbohydrates will have a similar influence on fiber growth [33]. Cell expansion during growth is strongly driven by turgor (the pressure of fluid in the plant cell), plant water relations will likewise influence fiber elongation in the period immediately following flowering. As a result, in terms of primary (direct) responses, fiber elongation will also be affected by temperature and carbohydrate limitations [34]. The ideal temperature range reported for the synthesis of cellulose is from 25 to 30 °C, and cellulose synthesis decreases if the temperature drops or exceeds this range [35]. Sucrose (carbohydrate), the product of photosynthesis in plants, is the basic compound in cellulose synthesis [35]; therefore, any change in the concentration of sucrose would directly affect the synthesis of cellulose. Cotton photosynthetic capacity decreases if the average daily temperature rises above 32 °C [36], thus decreasing sucrose synthesis. To produce healthy fiber, a plant should be able to maintain a steady rate of photosynthesis under varied conditions. Generally, 12,000–15,000 fibers are produced by a single seed under favorable temperature conditions [37].
Regarding the environmental impact on spinning traits, no winning environment was detected for the total of examined traits. Winner Environment for UHML was E4 (Thessaly), E2 (Macedonia) was the winner environment for UI and E1 (Thrace) for SF. In terms of stability, E4 (Thessaly) was the most stable environment for high mean values for all Fiber spinning traits, with average values 28.8 UHML, 82.7 UI and 8.6 SF. Environment E2 produces cotton with high mean values of Fiber spinning traits, however it is not stable across the years. Moreover, E3 is stable but produces cotton with low mean values of traits, while E1 is totally unstable with the lowest mean values, especially for UHML and UI measurements. Our results are in agreement with those of Ünlü et al. [38] for Uniformity index that showed significant differences between environment and not irrigation treatments and genotypes. This observation is in line with the results reported by Karademir et al. [39] and other studies that showed that the effect of water shortage on uniformity index was too inconsistent to be definitively assessed [28,40]. The fact that the majority of the fiber traits did not respond to irrigation, is probably due to environmental differences and to the degree of water stress imposed by environmental conditions.
Concerning color traits, ANOVA showed that E was not the main source of variation as in previous traits groups. Alternatively, Y affected a high level of the total variation (from 19.3% to 31.8%), while combined climatic factors (E × Y) had an especially large influence on the instrument measuring color indexes +b and Rd. Greater SCI values in the E4 (Thessaly) environment could be related to variations in climate (temperature and precipitation), which is in agreement with SCI variation in previous studies [41]. The most stable environments for cotton color traits were E2 and E3 visualizing SCI mean values of 126.3 and 125.8, respectively. Although Thessaly (E4) and Thrace (E1) did not perform well in terms of stability, they are the winning environments for the best color at absolute prices. Color is negatively affected more by environment, especially by rainfall when the bolls are open. Growers can get significant discounts for poor color grades, as it participates in a high percentage of the configuration of price. Cases of severe staining of cotton have no direct bearing on processing ability; however, color differences can cause dyeing problems [27]. At the termination of the growing season, precipitation may affect cotton grade by changing the fiber color. Specifically, humidity or precipitation can increase microbial damage, potentially lowering color grades, leading to spotted or stained lint [13]; delayed harvests also expose clean lint to increased chances of weathering. Humid conditions or rainfall can change the cotton color from white to light spotted or spotted.
As already discussed, cotton trash traits were dominantly effected by the environment with Environments E1 (Thrace) and E3 (Central Greece) scoring as the superior environments for producing cotton, with TRCnt (Trash count number), TrAr (trash Area; %), TrID (Trash Grade; 1–7 index) at low values that did not differ statistically between the two areas. In general, late flowering and especially regrowth will cause fiber quality problems directly, which will be reflected in reduced micronaire and increased neps, and indirectly with poorer grades and higher trash content, while at the same time, poor and untimely defoliation can have a significant impact on the amount of leaf trash [35]. At the same time, severe weed competition in cotton can have strong effects on fiber properties as well as trash contamination [42]. Crop management to synchronize crop maturity dates and harvesting operations with climate and weather is one aspect of timeliness. Excess nitrogen rates or events that cause late regrowth (e.g., excess soil moisture at harvest) can interfere with defoliation practices and picking. Unnecessary and late-season rainfall supports late-season insects, which can damage yield and quality. In wet or humid weather leafy crops may also contribute to boll rot [43].
At this point we should point out that the complexity of fiber quality, and the very large number of parameters that affect it, demonstrate the need for a comprehensive study that will include, evaluate and correlate as many of these parameters. So far, the issue of fiber quality has been studied by many researchers, however the approach is always fragmentary. The presentation of the mega data of our research, combined with the assumption that the environment is a single and indivisible set of climatic, soil, agronomic, genetic, management, technological and even financial resources, paves the way for new research that will shed more light on cotton fiber quality.

5. Conclusions

The results of this work demonstrate that the effect of the environment and the effect of the interaction of the environment with year (season) were the important source of variance for almost all the qualitative characteristics studied. Each region therefore produces a different cotton, as a result of the influence many, different, interacting factors that need further study. Regional climatic characteristics such as temperature, humidity and rainfall also significantly affect to a greater or lesser extent all quality characteristics. For example, high temperatures > 35 °C for a long time combined with dry conditions or water deficit, increase the micronaire and the strength of the fiber due to falling bolls, however affect other quality characteristics less. Similarly, excessive rainfall in the critical stages of flowering and bolls set causes regrowth, which degrades most of the quality characteristics due to competition of vegetative and reproductive growth, leading to increased foreign matter (Trash) after the opening of the bolls to color degradation. The different cultivation regions in the broader sense of an environment that incorporates both climatic and management parameters, show stability in terms of the studied groups of quality parameters. This stability is independent of the high or low performance of the group features.

Author Contributions

Conceptualization, M.K.D., D.B. (Dimitrios Beslemes), E.T., D.B. (Dimitrios Bilalis) and I.K.; methodology, M.K.D., D.B. (Dimitrios Beslemes), V.K., E.T., D.B. (Dimitrios Bilalis), I.R., S.K., A.M., V.T., C.K., A.Z. and I.K.; validation, M.K.D., D.B. (Dimitrios Beslemes), E.T., D.B. (Dimitrios Bilalis), I.R. and I.K.; formal analysis, M.K.D., D.B. (Dimitrios Beslemes), E.T. and I.K.; investigation, M.K.D., D.B. (Dimitrios Beslemes), V.K., E.T., D.B. (Dimitrios Bilalis), I.R., S.K., A.M., V.T., C.K., A.Z. and I.K.; resources, D.B. (Dimitrios Beslemes), V.K., E.T., D.B. (Dimitrios Bilalis), I.R., S.K. and A.M.; data curation, M.K.D.; writing—original draft preparation, M.K.D., D.B. (Dimitrios Beslemes), V.K., E.T., D.B. (Dimitrios Bilalis), I.R., S.K., A.M. and I.K.; writing—review and editing, M.K.D., D.B. (Dimitrios Beslemes), V.K., E.T., D.B. (Dimitrios Bilalis), I.R., S.K., A.M. and I.K.; supervision, M.K.D., D.B. (Dimitrios Beslemes), E.T., D.B. (Dimitrios Bilalis) and I.K. All authors have read and agreed to the published version of the manuscript.

Funding

This research received no external funding.

Institutional Review Board Statement

Not applicable.

Informed Consent Statement

Not applicable.

Data Availability Statement

All data generated or analyzed during this study are included in this published article. Further inquiries can be addressed to the corresponding author.

Conflicts of Interest

The authors declare no conflict of interest.

References

  1. Engonopoulos, V.; Kouneli, V.; Mavroeidis, A.; Karydogianni, S.; Beslemes, D.; Kakabouki, I.; Papastylianou, P.; Bilalis, D. Cotton versus climate change: The case of Greek cotton production. Not. Bot. Horti Agrobot. Cluj-Napoca 2021, 49, 12547. [Google Scholar] [CrossRef]
  2. Freeland, T.B., Jr.; Pettigrew, B.; Thaxton, P.; Andrews, G.L. Agrometeorology and cotton production. World Meteorol. Organ. 2006, 10, 1–128. [Google Scholar]
  3. Patsiali, S.; Papastylianou, P.; Travlos, I.S.; Bilalis, D.J. Organic cropping system effects on fiber quality of three cotton cultivars in Greece. Agron. J. 2014, 106, 1365–1370. [Google Scholar] [CrossRef]
  4. Subhan, M.; Khan, H.U.; Ahmed, R.O. Population analysis of some agronomic and technological characteristics of upland cotton (Gossypium hirsutum L.). Pak. J. Biol. Sci. 2001, 1, 120–123. [Google Scholar] [CrossRef] [Green Version]
  5. Darawsheh, M.K.; Chachalis, D.; Aivalakis, G.; Khah, E.M. Cotton row spacing and plant density cropping systems II. Effects on seed cotton yield, boll components and lint quality. J. Food Agric. Environ 2009, 7, 262–265. [Google Scholar]
  6. Darawsheh, M.K. Cotton fiber quality parameters response to cultivation system as influenced by limited and normal irrigation. J. Food Agric. Environ. 2010, 8, 527–530. [Google Scholar]
  7. Christidis, G.V. The Cotton; University of Thessaloniki: Thessaloniki, Greece, 1965; pp. 145–152. (In Greek) [Google Scholar]
  8. Deussen, H. Stressing high strength, low micronaire may require are thinking of breeding and marketing methods. In Cotton International Edition, 53rd ed.; Spencer, W., Ed.; Meister Publishing Co.: Memphis, TN, USA, 1986; pp. 32–36. [Google Scholar]
  9. Wang, Y.H.; Zhao, X.H.; Chen, B.L.; Gao, X.B.; Zhou, Z.G. Relationship between the N concentration of the leaf subtending boll and the cotton fiber quality. J. Integr. Agric. 2012, 11, 2013–2019. [Google Scholar] [CrossRef]
  10. Read, J.J.; Reddy, K.R.; Jenkins, J.N. Yield and fiber quality of upland cotton as influenced by nitrogen and potassium nutrition. Eur. J. Agron. 2006, 24, 282–290. [Google Scholar] [CrossRef]
  11. Eaton, F.M.; Ergle, D.R. Effects of shade and partial defoliation on carbohydrate levels and the growth, fruiting and fiber properties of cotton plants. Plant Physiol. 1954, 29, 39. [Google Scholar] [CrossRef] [Green Version]
  12. Gipson, J.R.; Joham, H.E. Influence of night temperature on growth and development of cotton (Gossypium hirsutum L.). II Fiber properties. Agron. J. 1968, 60, 296–298. [Google Scholar] [CrossRef]
  13. Luo, Q.; Bange, M.; Johnston, D. Environment and cotton fibre quality. Clim. Change 2016, 138, 207–221. [Google Scholar] [CrossRef]
  14. Lokhande, S.; Reddy, K.R. Quantifying temperature effects on cotton reproductive efficiency and fiber quality. Agron. J. 2014, 106, 1275–1282. [Google Scholar] [CrossRef]
  15. Papastylianou, P.T.; Argyrokastritis, I.G. Effect of limited drip irrigation regime on yield, yield components, and fiber quality of cotton under Mediterranean conditions. Agric. Water Manag. 2014, 142, 127–134. [Google Scholar] [CrossRef]
  16. Saleem, M.F.; Sammar Raza, M.A.; Ahmad, S.; Khan, I.H.; Shahid, A.M. Understanding and mitigating the impacts of drought stress in cotton-a review. Pak. J. Agric. Sci. 2016, 53, 609–623. [Google Scholar]
  17. Khan, A.; Najeeb, U.; Wang, L.; Tan, D.K.Y.; Yang, G.; Munsif, F.; Ali, S.; Hafeez, A. Planting density and sowing date strongly influence growth and lint yield of cotton crops. Field Crops Res. 2017, 209, 129–135. [Google Scholar] [CrossRef]
  18. Abdelraheem, A.; Adams, N.; Zhang, J. Effects of drought on agronomic and fiber quality in an introgressed backcross inbred line population of Upland cotton under field conditions. Field Crops Res. 2020, 254, 107850. [Google Scholar] [CrossRef]
  19. Ergashovich, K.A.; Azamatovna, B.Z.; Toshtemirovna, N.U.; Rakhimovna, A.K. Ecophysiological effects of water deficiency on cotton varieties. J. Crit. Rev. 2020, 7, 244–246. [Google Scholar]
  20. Zulfiqar, F.; Datta, A.; Thapa, G.B. Determinants and resource use efficiency of “better cotton”: An innovative cleaner production alternative. J. Clean. Prod. 2017, 166, 1372–1380. [Google Scholar] [CrossRef]
  21. Institute for Environmental Research, National Observatory of Athens (IERSD/NOA). Available online: https://www.meteo.gr/Monthly_Bulletins.cfm (accessed on 21 February 2022).
  22. Keselman, H.J.; Rogan, J.C. The Tukey multiple comparison test: 1953–1976. Psychol. Bull. 1977, 84, 1050–1056. [Google Scholar] [CrossRef]
  23. Gabriel, K.R. The Biplot graphic display of matrices with application to principal component analysis. Biometrika 1971, 58, 453–467. [Google Scholar] [CrossRef]
  24. Williams, S.; Bange, M. The cotton plant. In Australian Cotton Production Manual; Cotton Research and Development Corporation: Canberra, Australia, 2015; pp. 8–10. [Google Scholar]
  25. Pettigrew, W.T. The effect of higher temperatures on cotton lint yield production and fiber quality. Crop Sci. 2008, 48, 278–285. [Google Scholar] [CrossRef] [Green Version]
  26. Rahman, M.H.; Ahmad, A.; Wajid, A.; Hussain, M.; Akhtar, J.; Hoogenboom, G. Estimation of temporal variation resilience in cotton varieties using statistical models. Pak. J. Agric. Sci. 2016, 53, 787–807. [Google Scholar]
  27. Vara Prasad, P.V.; Allen, L.H.; Boote, K.J. Crop responses to elevated carbon dioxide and interactions with temperature. J. Crop Improv. 2005, 13, 113–155. [Google Scholar] [CrossRef]
  28. Singh, R.P.; Prasad, P.V.; Sunita, K.; Giri, S.N.; Reddy, K.R. Influence of high temperature and breeding for heat tolerance in cotton: A Review. Adv. Agron. 2007, 93, 313–385. [Google Scholar]
  29. Bange, M. Preparing for harvest. In Australian Cotton Production Manual; Cotton Research and Development Corporation: Canberra, Australia, 2021; pp. 122–124. [Google Scholar]
  30. Van der Sluijs, R. Harvesting and delivering uncontaminated cotton. In Australian Cotton Production Manual; Cotton Research and Development Corporation: Canberra, Australia, 2018; pp. 125–130. [Google Scholar]
  31. Paterson, A.H.; Saranga, Y.; Menz, M.; Jiang, C.X.; Wright, R. QTL analysis of genotype × environment interactions affecting cotton fiber quality. Theor. Appl. Genet. 2003, 106, 384–396. [Google Scholar] [CrossRef]
  32. Campbell, B.T.; Jones, M.A. Assessment of genotype× environment interactions for yield and fiber quality in cotton performance trials. Euphytica 2005, 144, 69–78. [Google Scholar] [CrossRef]
  33. Torres-Salinas, D.; Robinson-García, N.; Jiménez-Contreras, E.; Herrera, F.; López-Cózar, E.D. On the use of biplot analysis for multivariate bibliometric and scientific indicators. J. Am. Soc. Inf. Sci. Technol. 2013, 64, 1468–1479. [Google Scholar] [CrossRef]
  34. Roberts, E.M.; Rao, N.R.; Huang, J.Y.; Trolinder, N.L.; Haigler, C.H. Effects of cycling temperatures on fiber metabolism in cultured cotton ovules. Plant Physiol. 1992, 100, 979–986. [Google Scholar] [CrossRef]
  35. Tian, J.S.; Hu, Y.Y.; Gan, X.X.; Zhang, Y.L.; Hu, X.B.; Ling, G.O.U.; Luo, H.H.; Zhang, W.F. Effects of increased night temperature on cellulose synthesis and the activity of sucrose metabolism enzymes in cotton fiber. J. Integr. Agric. 2013, 12, 979–988. [Google Scholar] [CrossRef]
  36. Crafts-Brandner, S.J.; Salvucci, M.E. Rubisco activase constrains the photosynthetic potential of leaves at high temperature and CO2. Proc. Natl. Acad. Sci. USA 2000, 97, 13430–13435. [Google Scholar] [CrossRef] [Green Version]
  37. Oosterhuis, D.M. Effect of temperature extremes on cotton yields in Arkansas. In Proceedings of the 1997 Cotton Research Meeting; Arkansas Agricultural Experiment Station, Univesity of Arkansas: Monticello, AR, USA, 1997; pp. 94–100. [Google Scholar]
  38. Ünlü, M.; Kanber, R.; Koç, D.L.; Tekin, S.; Kapur, B. Effects of deficit irrigation on the yield and yield components of drip irrigated cotton in a Mediterranean environment. Agric. Water Manag. 2011, 98, 597–605. [Google Scholar] [CrossRef]
  39. Karademir, C.; Karademir, E.; Ekinci, R.; Berekatoğlu, K. Yield and fiber quality properties of cotton (Gossypium hirsutum L.) under water stress and non-stress conditions. Afr. J. Biotechnol. 2011, 10, 12575–12583. [Google Scholar]
  40. Basal, H.; Dagdelen, N.; Unay, A.; Yilmaz, E. Effects of deficit drip irrigation ratios on cotton (Gossypium hirsutum L.) yield and fibre quality. J. Agron. Crop Sci. 2009, 195, 19–29. [Google Scholar] [CrossRef]
  41. Bilalis, D.J.; Patsiali, S.; Kakabouki, I.; Travlos, I.S.; Karkanis, A. Effects of cropping system (organic and conventional) on the fiber quality index, spinning consistency index and multiplicative analytic hierarchy process of cotton (Gossypium hirsutum L.). Not. Bot. Horti Agrobot. Cluj-Napoca 2015, 43, 388–391. [Google Scholar] [CrossRef] [Green Version]
  42. Tariq, M.; Abdullah, K.; Ahmad, S.; Abbas, G.; Khan, M.A. Weed management in cotton. In Cotton Production and Uses: Agronomy, Crop Protection, and Postharvest Technologies; Ahmad, S., Hasanuzzaman, M., Eds.; Springer: Singapore, 2020; pp. 145–161. [Google Scholar]
  43. Reddy, K.N.; Burke, I.C.; Boykin, J.C.; Williford, J. Narrow-row cotton production under irrigated and non-irrigated environment: Plant population and lint yield. J. Cotton Sci. 2009, 13, 48–55. [Google Scholar]
Figure 1. (a,b). Biplot analysis of micronaire (Mic), maturity index (Mat), strength (Str) and elongation (Elg), cotton quality measurements across four environments.
Agronomy 12 00943 g001
Figure 2. (a,b). Biplot analysis of upper half mean length (UHML), uniformity index (UI) and short fiber index (SF), cotton quality measurements across four Environments.
Agronomy 12 00943 g002
Figure 3. (a,b). Biplot analysis of reflectance (Rd), yellowness (+b), and spinning consistency index (SCI), cotton measurements across four environments.
Agronomy 12 00943 g003
Figure 4. (a,b). Biplot analysis of trash count (TrCnt), trash grade (TrID) and trash area (TrAr), cotton quality measurements across four environments.
Agronomy 12 00943 g004
Table 1. The thirteen evaluated cotton quality traits divided in four groups: (a) fiber maturity; (b) fiber length; (c) color; and (d) trash traits.
GroupQuality Trait
Fiber maturity traits Micronaire [MIC (fiber fineness)]
Maturity index (%) (MAT)
Fiber strength (STR) (gram/tex)
Elongation (%) (ELG)
Fiber length traits Upper half mean length in mm (UHML)
Uniformity index (%) (UI)
Short fiber index < 12.5 in mm (SF)
Color traitsReflectance (RD)
Yellowness (+b)
Spinning consistency index (SCI)
Trash traitsTrash count (number) (TRcnt)
Trash area (%) (TrAr)
Trash grade (1–7 index) (TrID)
Table 2. Mean monthly temperature (°C) and precipitation (mm) during the growing seasons of 2016–2020, in the four study areas: Thrace (E1); Macedonia (E2); Central Greece (E3); and Thessaly (E4).
YearMonthMean Temperature (°C)Precipitation (mm)
E1E2E3E4 E1E2E3E4
2016April15.7 ± 6.716.8 ± 6.517.9 ± 7.018.5 ± 6.5 27.612.13.75.2
May17.6 ± 5.818.8 ± 6.018.9 ± 6.619.9 ± 5.9 51.968.261.687.0
June24.2 ± 6.524.9 ± 6.525.1 ± 6.826.2 ± 6.4 40.941.526.625.0
July26.0 ± 7.326.7 ± 6.426.4 ± 6.827.9 ± 6.1 2.89.22.58.8
August26.4 ± 7.226.2 ± 6.425.6 ± 6.427.0 ± 6.0 1.830.518.722.7
September21.5 ± 6.921.8 ± 5.821.5 ± 5.722.2 ± 5.2 8.272.134.7104.0
Average 21.9 ± 6.722.5 ± 6.322.6 ±6.623.6 ± 6.0Sum133.2233.6147.8252.7
2017April12.8 ± 7.114.2 ± 6.414.6 ± 6.915.9 ± 6.5 6.314.430.826.3
May18.4 ± 6.419.7 ± 6.219.4 ± 6.421.0 ± 6.3 50.362.188.570.2
June23.6 ± 6.824.6 ± 6.624.2 ± 6.626.3 ± 6.6 36.324.374.644.5
July25.4 ± 7.326.3 ± 6.526.1 ± 6.727.7 ± 6.6 36.266.161.674.7
August26.2 ± 7.426.5 ± 7.025.8 ± 6.627.5 ± 6.8 13.216.412.619.6
September21.6 ± 7.022.2 ± 6.422.7 ± 6.723.6 ± 6.5 28.223.856.330.8
Average 21.3 ± 7.022.2 ± 6.522.1 ± 6.723.6 ± 6.5Sum231.5207.1324.4266.1
2018April16.6 ± 7.317.4 ± 7.116.7 ± 7.618.4 ± 6.6 1.310.110.416.6
May20.7 ± 6.521.4 ± 5.920.7 ± 6.122.1 ± 5.6 14.076.349.043.1
June23.3 ± 6.423.7 ± 5.723.5 ± 6.224.8 ± 5.8 103.2111.775.192.5
July25.1 ± 5.925.8 ± 6.126.3 ± 6.927.5 ± 6.3 73.861.840.843.3
August26.4 ± 6.826.2 ± 6.424.9 ± 6.223.2 ± 6.1 0.325.757.948.9
September21.6 ± 6.422.4 ± 6.621.5 ± 5.923.2 ± 6.0 23.911.8114.523.7
Average 22.3 ± 6.522.8 ± 6.322.3 ± 6.523.2 ± 6.1Sum216.5297.4347.7268.1
2019April12.7 ± 5.514.2 ± 5.413.5 ± 5.515.3 ± 5.4 84.971.355.136.3
May18.4 ± 5.818.6 ± 6.218.5 ± 6.620.4 ± 6.3 47.933.515.121.1
June24.5 ± 6.325.2 ± 6.724.8 ± 6.726.8 ± 6.5 48.546.716.531.8
July24.6 ± 6.826.0 ± 6.625.6 ± 6.727.3 ± 6.2 73.652.559.091.2
August26.1 ± 7.127.0 ± 7.126.2 ± 6.727.9 ± 6.7 26.76.93.110.7
September21.7 ± 6.922.7 ± 6.622.2 ± 6.723.9 ± 6.5 8.644.217.716.8
Average 21.3 ± 6.422.2 ± 6.421.8 ± 6.523.6 ± 6.2Sum290.2255.1166.5207.9
2020April11.7 ± 6.213.2 ± 6.112.8 ± 5.814.5 ± 5.8 74.9101.295.083.1
May17.7 ± 5.919.3 ± 6.519.4 ± 7.121.3 ± 6.7 43.643.039.237.5
June22.1 ± 6.323.1 ± 6.322.9 ± 7.024.9 ± 6.4 40.628.918.017.2
July25.8 ± 7.126.1 ± 6.425.5 ± 6.627.3 ± 6.1 2.228.719.717.9
August26.3 ± 7.126.1 ± 6.325.7 ± 6.927.3 ± 6.3 12.861.934.539.1
September23.3 ± 6.723.5 ± 6.623.0 ± 6.024.1 ± 5.8 8.215.381.7127.6
Average 21.1 ± 6.621.9 ± 6.421.5 ± 6.623.2 ± 6.2Sum182.3279.0288.2322.4
Total Average 21.6 ± 6.622.3 ± 6.422.06 ± 6.623.4 ± 6.2 210.7254.4254.9263.4
± Represents the mean maximum and minimum monthly temperatures.
Table 3. Combined analysis of variance for various cotton physical measurements produced across four environments for five years.
Environment (E)Year (Y)E × Y
MSEV%MSEV%MSEV%
DF3412
Fiber maturity traits
Mic77.6 **49.645.9 **39.24.4 **11.2
Mat0.27 **36.80.26 **47.40.03 **15.8
Str967.1 **44.9815.6 **39.992.1 **15.2
Elg686.2 **52.8395.4 **40.621.6 *6.6
Fiber length traits
UHML488.5 **53.6247.3 **36.223.3 **10.2
UI433.9 **62.9135.6 **14.851.1 **22.3
SF58.8 *17.1119.7 **46.331.6 **36.6
Color traits
Rd669 **22.99313 **31.813,307 **45.4
+b2232 **22.32328 **19.31109 **58.4
SCI54,976 **36.852,717 **47.15994 **16.1
Trash traits
TrCnt276,485 **85.129,164 **12.02411 **2.9
TrAr27.2 **80.61.8 **7.01.1 **12.3
TrID660.1 **80.254.0 **8.723.0 **11.1
DF (Degrees of Freedom), MS (Mean Squares) EV% (percentage of the sum of squares), Mic (Micronaire); MAT (Maturity Index; %), STR (Strength; g/tex), Elg (Elongation; %), UHML (Upper Half Mean Length; mm), UI (Uniformity Index; %), SF (Short Fiber index < 12.5 in mm), RD (Reflectance), +b (Yellowness), SCI (Spinning Consistency Index), TRcnt (Trash Count Number), TrAr (Trash Area; %), TrID (Trash Grade; 1–7 index); *, ** significant at p ≤ 0.05 and p ≤ 0.01, respectively.
Table 4. Values in each testing environment averaged across five years in quality attributes of Cotton.
Environments
E1E2E3E4
Fiber maturity traits
Mic4.7 c4.6 b4.4 a4.6 b
Mat0.859 c0.857 a0.858 b0.862 d
Str29.4 a29.6 b29.6 b30.3 c
Elg7.6 b7.7 c7.9 c7.0 a
Fiber length traits
UHML28.0 a28.7 c28.6 b28.8 c
UI82.4 a82.8 c82.6 b82.7 c
SF8.7 d8.4 a8.5 b8.6 c
Color traits
Rd72.7 c71.1 a72.4 b72.4 b
+b9.5 b9.8 c9.5 b9.2 a
SCI121.8 a126.3 c125.8 b129.9 d
Trash traits
TrCnt38.3 a51.6 c40.4 a53.2 b
TrAr0.52 a0.66 c0.51 a0.63 b
TrID3.83 a4.54 c3.84 a4.37 b
E1, Thrace; E2, Macedonia; E3, Central Greece; E4, Thessaly; Mic (Micronaire); MAT (Maturity Index; %), STR (Strength; g/tex), Elg (Elongation; %), UHML (Upper Half Mean Length; mm), UI (Uniformity Index; %), SF (Short Fiber index < 12.5 in mm), RD (Reflectance), +a,b,c (Yellowness), SCI (Spinning Consistency Index), TRcnt (Trash Count Number), TrAr (Trash Area; %), TrID (Trash Grade; 1–7 index); values followed by different letters within a row indicate significant differences according to the Tukey test (p ≤ 0.05).
Table 5. Values in each testing year averaged across four environments in quality attributes of Cotton.
Years
20162017201820192020
Fiber maturity traits
Mic4.7 d4.6 c4.6 c4.5 b4.5 a
Mat0.88 d0.87 c0.86 b0.87 c0.85 a
Str29.1 a29.4 b30.1 c29,8 c30.1 c
Elg7.5 b7.9 d7.6 c7.1 a7.6 c
Fiber length traits
UHML28.2 a28.4 b28.9 e28.7 d28.6 c
UI82.3 a82.5 b83.1 d82.7 c82.4 a
SF8.6 c8.7 d8.3 a8.8 e8.5 b
Color traits
Rd71.5 a73.3 c72.5 c71.6 a71.9 b
+b9.7 c9.3 a9.4 b9.3 a9.7 c
SCI120.6 a124.61 b130.5 d127.3 c126.9 c
Trash traits
TrCnt42.1 a45.3 b49.1 e47.9 d46.5 c
TrAr0.56 a0.57 a0.61 c0.57 a0.59 b
TrID4.03 a4.08 a4.33 c4.09 a4.18 b
Mic (Micronaire); MAT (Maturity Index; %), STR (Strength; g/tex), Elg (Elongation; %), UHML (Upper Half Mean Length; mm), UI (Uniformity Index; %), SF (Short Fiber index < 12.5 in mm), RD (Reflectance), +a,b,c (Yellowness), SCI (Spinning Consistency Index), TRcnt (Trash Count Number), TrAr (Trash Area; %), TrID (Trash Grade; 1–7 index); values followed by different letters within a row indicate significant differences according to the Tukey test (p ≤ 0.05).
Publisher’s Note: MDPI stays neutral with regard to jurisdictional claims in published maps and institutional affiliations.

