Abstract
Soybean (Glycine max) is a native field crop in Northeast Asia. The National Agrobiodiversity Center (NAC) in Korea has conserved approximately 26,000 soybean germplasm and distributed them to researchers and growers. The phenotype traits of soybean were investigated during periodic multiplication. However, it is time-consuming to collect sufficient data, especially on the width and height of seeds. During the last decade, the development of phenomics efficiently assisted the analysis of high-throughput phenotyping seed morphology. This study collected and analyzed seed morphological traits of 589 germplasm (53,909 seeds) from diverse origins using a digital camera and a computer-based seed phenotyping program. Measured traits included size and shape, 100-seed weight, height, width, perimeter, area, aspect ratio (AR), solidity, circularity, and roundness. The diversity of soybean germplasm seeds was analyzed based on 8-seed morphological traits and 100-seed weight, as determined by image phenotyping and direct weighting, respectively. The data obtained from 589 soybean germplasm were divided into five clusters by k-means clustering. Orthogonal projections to latent structures discriminant analysis (OPLS-DA) were performed to compare clusters. The major differences between clusters were in the order of area, perimeter, 100-seed weight, width, and height. Based on cultivar origins, the seed size of US origin was the largest, followed by Korea and China. We classified size, shape, and color according to the International Union for the Protection of New Varieties of Plants (UPOV) guidelines. In particular, we postulated that shape could be distinguished based on the AR and roundness values as secondary parameters. High-throughput phenotyping could make a decisive contribution to resolving the phenotyping bottleneck. In addition, rapid and accurate analysis of a large number of seed phenotypes will assist breeders and enhance agricultural competitiveness.
1. Introduction
Soybean (Glycine max) is an important protein and oil crop with a long history of use as a major food crop in the Asian continent, especially in Korea as well as China. Soybean was domesticated about 5000 years ago from Glycine soja, a wild-type soybean distributed throughout East Asia, including China, Japan, and Korea [1]. Due to domestication following improved breeding and crop systems, soybean is one of the most cultivated and utilized crops worldwide with production increasing by more than 200 million tonnes from the 1970s [2]. Germplasm contain useful traits such as high content of useful ingredients, disease resistance, and adaptability to climate change. Hence, they can be used as materials for breeding new cultivars. For this reason, genebanks are doing their best to secure the diversity of germplasm. Recognizing the importance of seed phenotype, international genebanks have continued to collect and conserve soybean germplasm. China and Korea have conserved the largest number of soybean germplasm, with 26,000 accessions at the Chinese Academy of Agricultural Sciences (CAAS) and 26,000 accessions at the National Agrobiodiversity Center (NAC) in Korea [3], followed by 17,000 accessions at the US Department of Agriculture (USDA) [4].
With the breakthrough of the next-generation sequencing technology, as the genome information increases, the need for a phenotype database is also required [5]. Nevertheless, the speed at which phenotyping data were built did not keep up with the speed at which genotyping data were built, resulting in the phenotyping bottleneck [6]. In all ancient countries, recognizing the importance of seed phenotypes, seed classification was selected as a way to increase the production and quality of crops [7], and it is presumed to be the oldest trait among agricultural characteristics. In particular, seed morphological traits including size and shape are important agricultural characters as they directly affect consumer preferences and market prices. As a result, traditional breeders have regarded high yields including grain size and shape as their ultimate goal. In rice, the long-grain shape is preferred [8], whereas large spherical grain in wheat is preferred as it is suitable for the milling process [9]. In general, vernier calipers are used to measure the seed phenotype, including length, width, and thickness. However, collecting phenotypic data is tedious and requires a lot of patience [10]. During the last decade, the fantastic development of phenomics has made it possible to analyze phenotypes by using two-dimensional (2D) [11] and three-dimensional (3D) images [12]. The images are made of cameras and scanners [13], magnetic resonance imaging (MRI) [14], and computed tomography (CT) [15], respectively. In spite of this advantage, the method of constructing a 3D image was limited in application to large amounts of germplasm because the method of constructing a 3D image not only damaged seeds by emitting strong energy but also required enormous costs [16]. On the other hand, the 2D image phenotyping is an accurate, non-destructive, and inexpensive method, making it an optimal method to use for a large number of germplasm [17]. The seed phenomics based on 2D image phenotyping has been conducted based on the needs of breeders and consumers. Herridge et al. [18] used a scanner and open source software to analyze the area of Arabidopsis (Arabidopsis thaliana) seeds and identified only the area of the seed, not the parameters of the seeds. Takanari et al. [19] developed a software called Smartgrain to measure seed size including the length, width, area, and perimeter of rice (Oryza sativa). Baek et al. [20] developed software to analyze the shape as well as the size of soybean (Glycine max) seeds, but studies related to the analysis of germplasm diversity are rare.
Seed morphological traits are important in agriculture to segregate them for a variety of purposes as well for purpose-based selection during initial sowing. The yield per unit area is a function of the number of plants per unit area, number of seeds per plant, and weight of 100 seeds. 100-seed weight is directly affected by the seed size, which is gauged in height, width, and thickness [21]. Despite this importance, it is difficult to measure the morphological traits using individual seeds, and there is a limit to applying them to a large number of germplasm. In this study, a high-throughput method was applied to a large number (589) of soybean germplasms (53,909 seeds) to conduct a diversity characterization using the seed morphological traits (size and shape including 100-seed weight, height, width, perimeter, area, AR, solidity, circularity, and roundness). In this study, it was possible to obtain image measurements similar to the actual measurement in a simple way with a large number of seeds. In addition, the seed phenotype information will be provided to breeders so that they can be utilized for breeding programs.
2. Materials and Methods
2.1. Soybean Germplasm
Soybean germplasms (589) were obtained from the NAC of the Rural Development Administration (RDA), Korea. The germplasms were derived from accessions of three countries: China (n = 264), the US (n = 263), and Korea (n = 62). To compare the seed morphological traits between cultivars, 183, 151, and 62 germplasms were randomly selected from the Chinese, US, and Korean collections. The seed morphological traits of 183 Chinese cultivars and 29 landraces were also compared. Furthermore, 164 germplasms with unknown status originating from China and the US were randomly selected for analysis.
2.2. High-Throughput Phenotyping and Morphological Indicators of Seed
High-throughput seed phenotyping was performed, including data preprocessing, processing, and analysis steps. Images were acquired according to Baek et al. [12]. In brief, a macro lens (SEL30M35 E30 mm F3.5 Macro; Sony, Tokyo, Japan) was mounted on the body of the camera (α-6000; Sony). The camera luminance was set to 1/8 (F11 ISO 125). The camera was set at a height of 43.5 cm. A CN-T96 light (ProDean; 832 lux) and VILTRONX light (VL-D85T; 2521 lux) were used to remove shadows from the seeds. Four images were acquired, each of one row of 25 seeds (100 seeds per germplasm). To isolate individual seeds in 2D images, we constructed a soybean seed phenotyping program (Korea Copyright Commission No: C-2020-0499644 [22]) using the Python programing language. By applying crop and scale functions, only the area with seeds in the 2D image was enlarged. Noise was then removed, and hue saturation value (HSV) and binary values were obtained to check whether the object (seed) and background were adequately separated. Images of individual seeds were saved. The hue aspect of HSV was used to differentiate soybeans with various seed coat colors from the background (e.g., hue of 5–24 for yellow seeds, 8–28 for black seeds, and 15–24 for green and brown seeds).
Data on the seed size parameters (height, width, perimeter, and area) were directly collected from processed images of single seeds. The area was the sum of each pixel of the seed in the 2D image. Secondary parameters such as the AR, solidity, circularity, and roundness were analyzed using formulas implemented in ImageJ [23]. The secondary parameters were based on the values of the seed size parameters [24]. The AR is the ratio of width to height. Solidity describes the hardness. Circularity values closer to 1.0 equate to more circular seeds, whereas values closer to 0.0 indicate a more elongated seed shape [24] (Figure 1). Thickness was measured with the soybean seeds placed in a sideways position. However, as the background and seed hilum could not be fully distinguished, seed thickness was directly measured using vernier calipers for all 53,909 seeds.
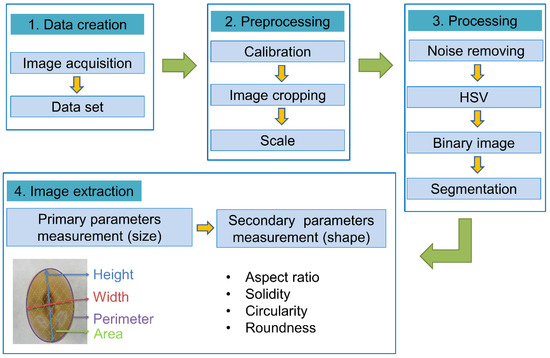
Figure 1.
Pipeline for high-throughput phenotyping and soybean seed morphological indicators [20,23]. In the case of the image sample, the seed phenotype was extracted by data creation, preprocessing, processing, and image extraction with germplasm (IT153948). The measured values of the primary parameter were directly extracted from the seed, and the measured value of the secondary parameter was extracted by applying the formula of ImageJ (all data adapted from imageJ).
2.3. Primary Parameters Measurement of Selected Soybean Germplasm Seeds
To determine whether the seed morphological traits were measured accurately, 10 germplasms were randomly selected. The height and width of 30 grains were measured with vernier calipers, and the AR was calculated.
2.4. The UPOV Guideline Classification Criteria
For classification according to the UPOV guidelines [25], the 100-seed weight, thickness, and seed coat color of 589 germplasms were measured. The size classes were large (>24 g), medium (13–24 g), and small (<13 g), based on the 100-seed weight. Seed shape was classified as spherical (width/height ratio ≥0.90), elongated (width/height ratio ≤0.89), flattened (thickness/width ratio <0.84) or non-flattened. There were eight seed coat color classes, including yellow, yellow-green, brown, and black, based on the UPOV guidelines. Purple was excluded because it was not observed in any of our germplasm.
2.5. Statistical Analyses
We checked the Bartlett sphericity test to see whether each variable was independent from the others. In addition, a Kaiser−Meyer−Olkin (KMO) test was performed to confirm the rationality of the data structure. A total of nine seed traits (eight morphological seed traits and 100-seed weight) were measured. Principal component analysis (PCA) was performed, with dimension reduction of the components. Two principal components with eigenvalues ≥1, and explaining ≥87.6% of the total variance, were selected, and k-means cluster analysis was performed. Orthogonal projections to latent structures discriminant analysis (OPLS-DA) were performed using SIMCA software analysis (ver. 13.3, Umetrics, Umeå, Sweden) to compare the clusters. Duncan’s multiple range test was performed to compare the means of five seed trait clusters.
3. Results
3.1. Variability of Seed Morphological Traits
In total, 589 soybean germplasms were analyzed in terms of the nine seed morphological traits. Except for 100-seed weight, all seed traits were measured using a high-throughput 2D image phenotyping platform. All traits showed significant variation among soybean germplasms (Figure 2). The 100-seed weight ranged from 5.04 to 40.52 g, with a mean of 19.06 g. The top 10 germplasms weighed over 30.57 g, whereas the bottom 10 weighed less than 5.04 g. The highest and lowest 100-seed weights were observed in IT269675 and IT267342, respectively (both from the US). IT269675 is a cultivar, whereas IT267342 is of unknown status. Seed height ranged from 4.74 to 10.50 mm, with a mean of 7.51 mm. Of all germplasms, 222 were between 7.04 and 7.62 mm, and 152 were between 7.62 and 8.20 mm; 63.5% of the germplasm had a seed height between 7.04 and 8.20 mm. The top 10 germplasms had a height >9.03 mm, whereas the bottom 10 were <5.51 mm in height. The greatest seed height was observed in IT208245, which originated from China. The lowest height was recorded for IT211812, originating from Korea. The germplasm status of accession IT208245 is unknown, while IT211812 is a cultivar. The seed width ranged from 3.10 to 7.80 mm, with a mean of 5.68 mm, and 204 (34.6%) germplasms were distributed between 5.45 and 5.92 mm. The top 10 germplasms had a width >6.86 mm, whereas the bottom 10 were <3.57 mm. The greatest seed width was observed in IT284568, which originated from China, and the lowest was in IT267342, which originated from the US. IT284568 is a landrace, whereas IT267342 is of unknown status. The perimeter size ranged from 14.66 to 29.93 mm, with a mean of 22.19 mm, and 360 (61.1%) germplasms were distributed between 20.77 and 23.82 mm. The top 10 accessions had a perimeter >26.70 mm, whereas the perimeter of the bottom 10 germplasms was <16.15 mm. The largest perimeter was observed in IT208245, which originated from China and the US, and the smallest was that of IT211812, which originated from Korea. Regarding germplasm status, that of IT208245 is unknown, while IT211812 is a cultivar. The area ranged from 13.69 to 55.31 mm, with a mean of 33.53 mm, and 346 germplasms (58.7%) were distributed between 30.34 and 38.67 mm. The area of the top 10 germplasms was >46.99 mm, whereas the bottom 10 germplasms had an area of <17.85 mm. The largest area was observed in IT269675, which originated from China, while that of IT267342 was the smallest. The 100-seed weight and seed height, width, perimeter, and area were all normally distributed.
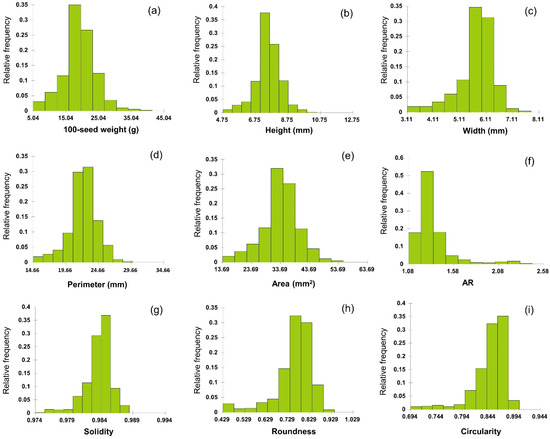
Figure 2.
Histogram of seed morphological traits of 589 germplasms. (a) 100-seed weight is the measured value. (b) height, (c) width, (d) perimeter, and (e) area are the values measured directly as primary parameters, and (f) AR, (g) solidity, (h) roundness, and (i) circularity are values obtained by formulating the values of the primary parameters.
3.2. Correlation Analysis
A correlation analysis was conducted to examine the associations between seed traits (Table 1). The results of correlation analysis indicate all types of correlations—positive, neutral, and negative—occurring between the studied parameters. A majority of the parameters (25 of 36) indicated a positive correlation, two were negligible or neutral, and nine correlations were negatively related to each other. Strong positive correlations (r > 0.7, p < 0.001) were found among 100-seed against height, width, perimeter, and area; height and width against perimeter and area followed perimeter against area. The correlation between perimeter against circularity and roundness was near neutral (r < ±0.1), which is logical. Strongly negative correlations (r > −0.7, p < 0.001) were found between AR against circularity and roundness.

Table 1.
Correlation analysis of morphological traits of soybean, 589 germplasms.
3.3. Clustering and Diversity Analysis
The KMO test coefficient is greater than 0.6, indicating that the sample had met the requirements of a reasonable data structure.
PCA was performed on the data for nine seed morphological traits of 589 germplasms, as stated above. The first principal component (PC1) explained 53.7% of the total variance, with an eigenvalue of 4.834, and the second principal component (PC2) explained 33.9% (eigenvalue of 3.05; Table S1). The correlations between the two principal components and nine quantitative traits were compared. PC1 had significant positive correlations (in order of magnitude) with width (r = 0.439), area (r = 0.432), 100-seed weight (r = 0.416), and perimeter (r = 0.402), whereas the correlation with AR (−0.233) was significantly negative. PC2 had significant positive correlations (in order of magnitude) with circularity (r = 0.488) and roundness (r = 0.487), whereas the correlations with AR (r = −0.476) and height (r = −0.430) were significantly negative. In PC1, traits related to seed size were highly correlated, while seed shape traits were positively correlated with each other in PC2.
A scatter plot of the soybean seed morphological traits, adjusted according to PC1 and PC2, is shown in Figure 3a. It can be observed that all the studied parameters have strong correlations with or against each other as none of them displayed zero weight in the PCA plot. All of the studied parameters were positively correlated with PC1 except AR. However, in the case of PC2, the parameters of circularity, roundness, width, and solidity were positively correlated, and 100-seed weight, area, perimeter, height, and AR were negatively correlated with the component. The values for AR seem to be negatively correlated for both the principal components PC1 and PC2. Circularity and roundness values were strongly positively correlated, and the same could be observed for 100-seed weight, area, and perimeter. In the case of the accessions, those from China and the US were widely distributed across all quadrants, with a majority of the accessions positively correlated to PC1 and PC2. Accessions from Korea had comparatively fewer outliers and indicated a positive trend toward PC2.
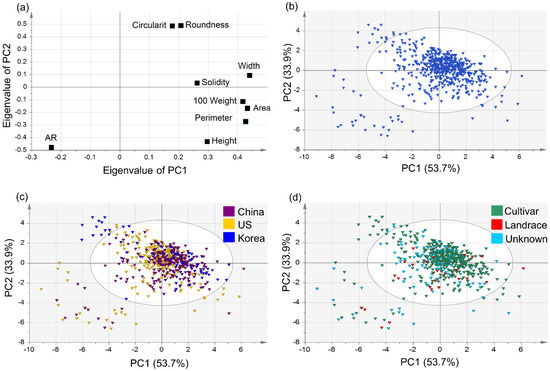
Figure 3.
Distribution of 9 seed morphological traits and 589 germplasms of (a) scatter plot of principal component 1 (53.7%) and 2 (33.9%) based on 9 morphological traits of 589 germplasms, (b) PCA of 589 germplasms, (c) PCA by germplasm of origin, and (d) PCA by germplasm status.
The PCA clusters were compared using OPLS-DA. The major variables for distinguishing clusters were (in order of importance) area, perimeter, 100-seed weight, width, and height (Figure 4). The most distinctive characteristics between adjacent clusters were area and perimeter. Generally, 100-seed weight is considered a representative agronomic trait and important target for breeders and researchers [26]. Cluster 5 in this study had the highest 100-seed weight (28.903 ± 12.375) value. In cluster 4, germplasm with small AR (1.299 ± 0.008) and large roundness (0.777 ± 0.002) values were included, so the seeds had a circular shape. In contrast, cluster 1 included small oval seeds with a large AR (1.545 ± 0.178) and small circularity (0.827 ± 0.004) and roundness (0.694 ± 0.026) values (Table 2). These phenotypes are typical of wild-type or landrace soybean.
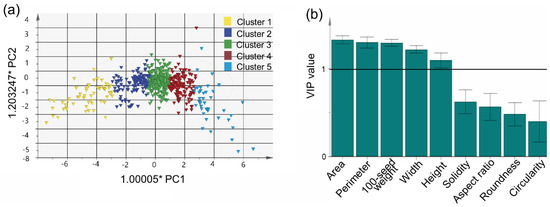
Figure 4.
Distribution of 9 seed morphological traits and 589 germplasms of soybean. (a) OPLS-DA applying 5 clusters obtained by applying k-means clustering, and (b) variable importance in the projection (VIP) value.
Table 2.
Comparison of 9 seed morphological traits between groups divided into 5 clusters using k-means clustering and origin within clusters.
3.4. Verification between Image Measurement and Actual Measurement
To determine classification accuracy, values obtained via 2D image measurements and actual values obtained using vernier calipers were compared. Thirty seeds from 10 randomly selected accessions were measured and compared in terms of height, width, and AR. The correlation coefficients (r2) between the image-based and actual height, width, and AR values were 0.9735, 0.9839, and 0.9382, respectively (Figure 5).
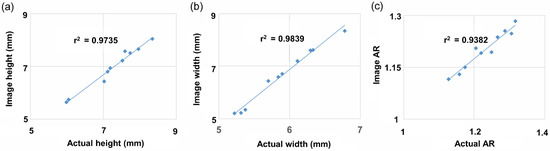
Figure 5.
Correlation between actual and image measurement of randomly selected 10 germplasms. Thirty seeds for each germplasm were repeated and measured with vernier calipers. (a) Height, (b) width, (c) AR.
3.5. Seed Phenotypic Chararcterization
The International Union for the Protection of New Varieties of Plants (UPOV) has established standards for individual crops. According to the UPOV guidelines for soybean [25], we classified 589 soybean germplasms in terms of shape, size and seed coat color. Regarding shape, 583 germplasms were categorized as elongated (width/height ratio ≤0.89) and 6 as spherical (width/height ratio ≥0.90). No flattened (thickness/width ratio ≤0.84) germplasm were found. Size was categorized as small (<13 g), medium (13–24 g), or large (>24 g) based on the 100-seed weight (33, 490, and 66 germplasms, respectively).
We created a seed coat color dataset with yellow, yellow-green, green, brown, and black classifications. A simple convolution neural network (CNN) was trained using the seed color coat image dataset. The classification accuracy of the model was 98%, and the loss rate was 0.051 (Figure S2). Yellow (n = 491) was the most frequent classification, followed by black (n = 40), dark brown (n = 22), yellow (n = 11), yellow-green (n = 11), and light brown (n = 10) (Figure 6). We also distinguished bicolor seed coats absent from the UPOV guidelines, including black with a white dot (n = 2) and brown with a white dot (n = 2).
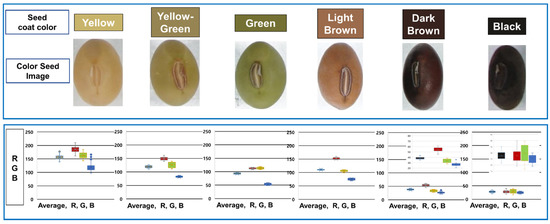
Figure 6.
Classification of soybean seed color according to the UPOV guideline. On the top, the seed coat color was assigned based on six colors: yellow (IT134357), yellow-green (IT162934), green (IT215881), light brown (IT262893), dark brown (IT165456), and black (IT2082671). The box plot shows the R (red), G (green), and B (blue) values of the germplasm classified by the seed coat color and their average. The boxes in each figure are in the order of average, R, G, and B.
4. Discussion
During the last decade, developments in phenomics have aided the analysis of high-throughput phenotyping seed morphology data. SmartGrain [19], ImageJ [27], Cell Profiler [28], P-TRAP [29], and WinSeedle [30] are commonly used by researchers as open-source programs to study seed phenotype. These programs can analyze complicated and perimeter areas, but the measurements are as cumbersome and laborious as those obtained using vernier calipers. There are limitations to the measurement of large numbers of germplasm in gene banks. Our program has the advantage of measuring the phenotype automatically in a large number of germplasm. To determine accuracy, measures performed on 2D images and actual measurements obtained by vernier calipers were compared. Ten germplasms (each with 30 seeds) were randomly selected, and the height, width, and AR were measured. Beak et al. [20] reported an average R2 of 0.94 between image-based and actual measurements of nine randomly selected seeds. In terms of distinguishing seed coat colors from the background during the initial imaging process, the accuracy of our HSV method was better than that based on red-blue-green (RGB) values.
No previous study has analyzed diversity via high-throughput phenotyping of a large number of seed germplasm. To analyze diversity based on seed morphological traits, we performed Pearson correlation analysis, PCA, and OPLS-DA. As shown in Table 1, 100-seed weight showed significant positive correlations with height, width, perimeter, and area. In contrast, the AR had significant negative correlations with circularity and roundness. Cober et al. [21] reported no correlation between the size and shape of 694 soybean germplasm. In another study [31], the correlation between roundness and area was low (r = 0.194, p < 0.001).
K-means clustering has been widely used over the past 70 years [32]. We divided the 589 germplasm into five clusters using k-means clustering and applied OPLS-DA to compare them, as shown in Figure 4. OPLS-DA is often used to distinguish between two or more groups based on certain variables [33]. In addition, the variable influence on projection (VIP) value, which can be obtained from OPLS-DA, can be used to identify significant variables. The VIP value reflects the difference in contribution between variables [34]. In this study, the clusters were distinguished based on area, perimeter, 100-seed weight, width, and height, all of which are related to seed size; these traits were also highly correlated with each other. Since 100-seed weight is efficient and easily measured, it could be used alone to distinguish soybean seeds.
Cui et al. reported that Chinese cultivar seeds were larger than US seeds [31]. In this study, we compared the size of seeds originating from China (n = 264), the US (n = 263), and Korea (n = 62). We also compared them based on type (cultivar (n = 396), landrace (n = 29), and unknown (n = 164). Contrary to previous reports [35], we found that the 100-seed weight (29.45 ± 11.607) and area (45.688 ± 10.948) of seeds from the US were larger than for seeds from China (28.199 ± 8.455 and 45.101 ± 14.05, respectively). In addition, the 100-seed weight (29.263 ± 8.13) of seeds from Korea was greater than that of seeds from China (28.199 ± 8.455). Regarding seed diversity, most cultivars showed significant differences in 100-seed weight, area, perimeter, roundness, and circularity, although large and round seeds predominated. Korean cultivars had small round seeds, whereas the Chinese and US had small oval seeds. Korean cultivars were developed by the National Institute of Crop Science, and small circular seeds were bred for bean sprouts. It is presumed that the small circular seeds bred in China were also bred by the CAAS as soybean sprouts (Figure S1).
Significant correlations between the 100-seed weight of soybeans and oil and protein content of the seeds have been reported [36,37]. Florencia et al. found that high-protein cultivars had smaller seeds [38]. China and Korea have implemented breeding programs to increase the protein content of soybean seeds [39,40]. Among cultivars from China and Korea, accessions with a small size, shown on the left of Figure 3c,d, are considered high-protein soybean seeds. In general, large seeds have been selected through breeding programs. While landrace is distributed over a wide range and has high diversity, breeders are biased toward large seed cultivars [41]. Among accessions of Chinese origin, landrace was distributed over a wide range and had high diversity, whereas cultivar seeds were mostly larger in size (Figure 3d).
In previous studies, the shape of soybean seeds was categorized as spherical or elongated according to UPOV guidelines [42,43]. The researchers directly measured width and height according to the UPOV standards and classified the seeds in terms of shape according to the width/height ratio. We classified seeds in terms of shape using the traditional method, i.e., according to the standards of the UPOV, and found that the classifications were consistent with those based on roundness and the AR.
Soybean seed coats have various colors, including yellow, green, brown, and black [44]. Despite the importance of seed coat color, classification is often subjective. We created a dataset to distinguish soybean seeds based on seed coat color according to UPOV standards, for accurate coat color identification. Our simple CNN model classifies seeds based on coat color according to UPOV standards; bicolor seed coats were also distinguished (black with a white dot and brown with a white dot).
We inferred phenotypes from 2D images of soybean germplasm conserved by the Korean Genebank and analyzed diversity. The results could be useful for breeders and breeding programs. Furthermore, this experimental method could be applied to determine seed phenotypes for other crops and to analyze other parts of crops such as roots and leaves.
5. Conclusions
In this study, the seed morphological traits and diversity of a large number of soybean genotypes (589 soybean germplasms) were analyzed using 2D images. The 100-seed weight significantly correlated with seed area, perimeter, width, and height. The 589 soybean germplasms were divided into five clusters using k-means clustering and OPLS-DA. The VIP values showed that the major variables determining the clusters were (in order of importance) area, perimeter, 100-seed weight, width, and height. Cluster 5 had the largest 100-seed weight, whereas cluster 1 had the smallest 100-seed weight. Cluster 4 included large, round seeds with a high 100-seed weight and small AR, circularity, and roundness values. The accessions included in cluster 4 could be used as breeding materials to improve soybeans. In this study, soybean seed sizes were analyzed for the first time according to their origin. The US seeds were the largest, followed by those from Korea and China. We followed the UPOV guidelines to distinguish seeds in terms of shape and seed coat color. Seed shape could be classified using the secondary parameters of roundness and AR. In addition, our CNN-based model distinguished the UPOV coat colors, as well as coats that were black with a white dot and brown with a white dot.
Supplementary Materials
The following supporting information can be downloaded at https://www.mdpi.com/article/10.3390/agronomy12051004/s1, Table S1: Eigenvalue and proportion of principal component to 9 seed traits of 589 soybean germplasms. Figure S1: PCA (a) between Chinese cultivar (183 germplasms), American cultivar (151 germplasms), and Korean cultivar (62 germplasms); (b) Comparison of Chinese Cultivar (183 germplasms) and landrace (29 germplasms). Figure S2: Accuracy (left) and loss (right) graphs of training and validation, respectively.
Author Contributions
Conceptualization, S.-H.K., B.-K.H. and B.-S.H.; methodology, J.W.J.; formal analysis, O.S.H., X.W. and M.-J.S.; investigation, O.S.H.; data curation, M.-J.S.; writing—original draft preparation, S.-H.K.; writing—review and editing, S.-H.K. and B.-K.H.; visualization, X.W.; supervision, B.-K.H.; project administration, B.-K.H.; funding acquisition, S.-H.K. All authors have read and agreed to the published version of the manuscript.
Funding
This study was supported by a grant allocated to S.-H.K. from the National Institute of Agricultural Sciences (Project No. PJ01424203), the Rural Development Administration, Republic of Korea.
Institutional Review Board Statement
Not applicable.
Informed Consent Statement
Not applicable.
Data Availability Statement
Not applicable.
Acknowledgments
We thank Hyun-Young Yu for assistance during creation of the image data.
Conflicts of Interest
The authors declare no conflict of interest.
References
- Hymowitz, T. The history of the soybean. In Soybeans; Elsevier: Amsterdam, The Netherlands, 2008; pp. 1–31. [Google Scholar]
- Boerema, A.; Peeters, A.; Swolfs, S.; Vandevenne, F.; Jacobs, S.; Staes, J.; Meire, P. Soybean trade: Balancing environmental and socio-economic impacts of an intercontinental market. PLoS ONE 2016, 11, e0155222. [Google Scholar] [CrossRef]
- RDA-Genebank. Available online: http://genebank.rda.go.kr/ (accessed on 22 February 2022).
- Carter, T.E., Jr.; Nelson, R.L.; Sneller, C.H.; Cui, Z. Genetic diversity in soybean. Soybeans Improv. Prod. Uses 2004, 16, 303–416. [Google Scholar]
- Furbank, R.T.; Tester, M. Phenomics–technologies to relieve the phenotyping bottleneck. Trends Plant Sci. 2011, 16, 635–644. [Google Scholar] [CrossRef]
- Minervini, M.; Scharr, H.; Tsaftaris, S.A. Image analysis: The new bottleneck in plant phenotyping [applications corner]. IEEE Signal Process. Mag. 2015, 32, 126–131. [Google Scholar] [CrossRef]
- El Masry, G.; Mandour, N.; Al-Rejaie, S.; Belin, E.; Rousseau, D. Recent applications of multispectral imaging in seed phenotyping and quality monitoring—An Overview. Sensors 2019, 19, 1090. [Google Scholar] [CrossRef]
- Juliano, B.O.; Villareal, C. Grain Quality Evaluation of World Rices; International Rice Research Institute: Manila, Philippines, 1993. [Google Scholar]
- Evers, A.; Cox, R.; Shaheedullah, M.; Withey, R. Predicting milling extraction rate by image analysis of wheat grains. Asp. Appl. Biol. 1990, 25, 417–426. [Google Scholar]
- Lee, S. Soybean seed phenotype study based on image analysis. Korea Soybean Res. Soc. 2020, 348, 5–7. [Google Scholar]
- Prasad, R.; Mukherjee, K.; Gangopadhyay, G. Image-analysis based on seed phenomics in sesame. Plant Breed. Seed Sci. 2014, 68, 119. [Google Scholar] [CrossRef][Green Version]
- Griffiths, M. A 3D Print repository for plant phenomics. Plant Phenomics 2020, 2020, 8640215. [Google Scholar] [CrossRef] [PubMed]
- Gregory, P.J.; Bengough, A.G.; Grinev, D.; Schmidt, S.; Thomas, W.B.T.; Wojciechowski, T.; Young, I.M. Root phenomics of crops: Opportunities and challenges. Funct. Plant Biol. 2009, 36, 922–929. [Google Scholar] [CrossRef]
- Yang, W.; Feng, H.; Zhang, X.; Zhang, J.; Doonan, J.H.; Batchelor, W.D.; Xiong, L.; Yan, J. Crop phenomics and high-throughput phenotyping: Past decades, current challenges, and future perspectives. Mol. Plant 2020, 13, 187–214. [Google Scholar] [CrossRef] [PubMed]
- Schmidt, J.; Claussen, J.; Wörlein, N.; Eggert, A.; Fleury, D.; Garnett, T.; Gerth, S. Drought and heat stress tolerance screening in wheat using computed tomography. Plant Methods 2020, 16, 15. [Google Scholar] [CrossRef] [PubMed]
- Fritsche-Neto, R.; Borém, A. Phenomics: How Next-Generation Phenotyping is Revolutionizing Plant Breeding; Springer: Berlin/Heidelberg, Germany, 2015. [Google Scholar]
- Gustin, J.L.; Settles, A.M. Seed phenomics. In Phenomics; Springer: Berlin/Heidelberg, Germany, 2015; pp. 67–82. [Google Scholar]
- Herridge, R.P.; Day, R.C.; Baldwin, S.; Macknight, R.C. Rapid analysis of seed size in arabidopsis for mutant and QTL discovery. Plant Methods 2011, 7, 3. [Google Scholar] [CrossRef] [PubMed]
- Tanabata, T.; Shibaya, T.; Hori, K.; Ebana, K.; Yano, M. SmartGrain: High-throughput phenotyping software for measuring seed shape through image analysis. Plant Physiol. 2012, 160, 1871–1880. [Google Scholar] [CrossRef]
- Baek, J.; Lee, E.; Kim, N.; Kim, S.L.; Choi, I.; Ji, H.; Chung, Y.S.; Choi, M.-S.; Moon, J.-K.; Kim, K.-H. High throughput phenotyping for various traits on soybean seeds using image analysis. Sensors 2020, 20, 248. [Google Scholar] [CrossRef]
- Niu, Y.; Xu, Y.; Liu, X.-F.; Yang, S.-X.; Wei, S.-P.; Xie, F.-T.; Zhang, Y.-M. Association mapping for seed size and shape traits in soybean cultivars. Mol. Breed. 2013, 31, 785–794. [Google Scholar] [CrossRef]
- Korea Copyright Commossion. Available online: https://www.cros.or.kr (accessed on 22 February 2022).
- Ferreira, T.; Rasband, W. ImageJ user guide. ImageJ Fiji 2012, 1, 155–161. [Google Scholar]
- Pérez, J.M.M.; Pascau, J. Image Processing with ImageJ; Packt Publishing Ltd.: Birmingham, UK, 2013. [Google Scholar]
- UPOV. Available online: https://www.upov.int/edocs/mdocs/upov/en/twa_46/tg_80_7_proj_3.pdf (accessed on 15 March 2021).
- Seo, E.; Kim, K.; Jun, T.-H.; Choi, J.; Kim, S.-H.; Muñoz-Amatriaín, M.; Sun, H.; Ha, B.-K. Population structure and genetic diversity in korean cowpea germplasm based on SNP markers. Plants 2020, 9, 1190. [Google Scholar] [CrossRef]
- Igathinathane, C.; Pordesimo, L.; Columbus, E.; Batchelor, W.; Methuku, S. Shape identification and particles size distribution from basic shape parameters using ImageJ. Comput. Electron. Agric. 2008, 63, 168–182. [Google Scholar] [CrossRef]
- Lamprecht, M.R.; Sabatini, D.M.; Carpenter, A.E. CellProfiler™: Free, versatile software for automated biological image analysis. Biotechniques 2007, 42, 71–75. [Google Scholar] [CrossRef]
- Faroq, A.-T.; Adam, H.; Dos Anjos, A.; Lorieux, M.; Larmande, P.; Ghesquière, A.; Jouannic, S.; Shahbazkia, H.R. P-TRAP: A panicle trait phenotyping tool. BMC Plant Biol. 2013, 13, 122. [Google Scholar]
- Groves, F.E.; Bourland, F.M. Estimating seed surface area of cottonseed. J. Cotton Sci. 2010, 14, 74–81. [Google Scholar]
- Cober, E.; Voldeng, H.; Frégeau-Reid, J. Heritability of seed shape and seed size in soybean. Crop Sci. 1997, 37, 1767–1769. [Google Scholar] [CrossRef]
- Jain, A.K. Data clustering: 50 years beyond K-means. Pattern Recognit. Lett. 2010, 31, 651–666. [Google Scholar] [CrossRef]
- Bylesjö, M.; Rantalainen, M.; Cloarec, O.; Nicholson, J.K.; Holmes, E.; Trygg, J. OPLS discriminant analysis: Combining the strengths of PLS-DA and SIMCA classification. J. Chemom. 2006, 20, 341–351. [Google Scholar] [CrossRef]
- Leem, J.-Y. Discrimination model of cultivation area of alismatis rhizoma using a GC-MS-based metabolomics approach. J. Korean Pharm. 2016, 60, 29–35. [Google Scholar] [CrossRef]
- Cui, Z.; Carter, T.E.; Burton, J.W.; Wells, R. Phenotypic diversity of modern chinese and north american soybean cultivars. Crop Sci. 2001, 41, 1954–1967. [Google Scholar] [CrossRef]
- Marega Filho, M.; Deednendstro, D.; Miranda, L.A.; Spinosa, W.A.; Carrão-Panizzi, M.C.; Montalván, R. Relationships among oil content, protein content and seed size in soybeans. Braz. Arch. Biol. Technol. 2001, 44, 23–32. [Google Scholar] [CrossRef]
- Maestri, D.M.; Guzmán, G.A.; Giorda, L.M. Correlation between seed size, protein and oil contents, and fatty acid composition in soybean genotypes. Grasasy Aceites 1998, 49, 450–453. [Google Scholar] [CrossRef]
- Poeta, F.; Borrás, L.; Rotundo, J.L. Variation in seed protein concentration and seed size affects soybean crop growth and development. Crop Sci. 2016, 56, 3196–3208. [Google Scholar] [CrossRef]
- Kim, Y.; Kim, S.; Hong, E. Present status and perspectives of soybean breeding program for high seed quality in Korea. Korea Soybean Dig. 1995, 12, 1–20. [Google Scholar]
- Wang, X.F.; Fu, J.; Meng, F.-G.; Ma, W. Factors influencing seed protein content in soybean and its improving ways. Soybean Sci. 2008, 27, 515–520. [Google Scholar]
- Hoeck, J.A. Molecular Marker Analysis of Seed Size in Soybean; Iowa State University: Ames, IA, USA, 2002. [Google Scholar]
- Gupta, A.; Mahajan, V.; Khati, P.; Srivastva, A. Distinctness in Indian soybean (Glycine max) varieties using DUS characters. Indian J. Agric. Sci. 2010, 80, 1081. [Google Scholar]
- Dhananjaya, P.; Channakeshava, B.; Mallikarjuna, M.; Swamy, M.; Chandramohan, S. Characterization of soybean (Glycine max (L.) Merrill) genotypes on the basis of seed and seedling morphology. BIOINFOLET Q. J. Life Sci. 2012, 9, 465–467. [Google Scholar]
- Song, J.; Liu, Z.; Hong, H.; Ma, Y.; Tian, L.; Li, X.; Li, Y.-H.; Guan, R.; Guo, Y.; Qiu, L.-J. Identification and validation of loci governing seed coat color by combining association mapping and bulk segregation analysis in soybean. PLoS ONE 2016, 11, e0159064. [Google Scholar] [CrossRef] [PubMed]


Publisher’s Note: MDPI stays neutral with regard to jurisdictional claims in published maps and institutional affiliations. |
© 2022 by the authors. Licensee MDPI, Basel, Switzerland. This article is an open access article distributed under the terms and conditions of the Creative Commons Attribution (CC BY) license (https://creativecommons.org/licenses/by/4.0/).