Article

Joint Effects of Developmental Stage and Water Deficit on Essential Oil Traits (Content, Yield, Composition) and Related Gene Expression: A Case Study in Two Thymus Species

by
Kazem Yousefzadeh
1,
Saadollah Houshmand
1,
Behrouz Shiran
1,2,
Sadegh Mousavi-Fard
3,*,
Hossein Zeinali
4,
Nikolaos Nikoloudakis
5,
Mohammad Mehdi Gheisari
6 and
Dimitrios Fanourakis
7
1
Department of Plant Breeding and Biotechnology, Faculty of Agriculture, Shahrekord University, Shahrekord P.O. Box 115, Iran
2
Institute of Biotechnology, Shahrekord University, Shahrekord P.O. Box 115, Iran
3
Department of Horticultural Science, Faculty of Agriculture, Lorestan University, Khorramabad P.O. Box 465, Iran
4
Natural Science Department, Isfahan Agricultural and Natural Resources, Research and Education Center, AREEO, Isfahan P.O. Box 81785199, Iran
5
Department of Agricultural Sciences, Biotechnology and Food Science, Cyprus University of Technology, Limassol 3603, Cyprus
6
Department of Science, Isfahan (Khorasgan) Branch, Islamic Azad University, Isfahan P.O. Box 81595-158, Iran
7
Laboratory of Quality and Safety of Agricultural Products, Landscape and Environment, Department of Agriculture, School of Agricultural Sciences, Hellenic Mediterranean University, Estavromenos, 71004 Heraklion, Greece
*
Author to whom correspondence should be addressed.
Agronomy 2022, 12(5), 1008; https://doi.org/10.3390/agronomy12051008
Submission received: 25 March 2022 / Revised: 14 April 2022 / Accepted: 16 April 2022 / Published: 22 April 2022
(This article belongs to the Special Issue It Runs in the Family: The Importance of the Lamiaceae Family Species)

Abstract

:
In this study, the joint effects of developmental stage and soil water availability on biomass accumulation, harvest index, as well as essential oil content, yield and composition were investigated in Thymus armeniacus. For comparison purposes, Thymus kotschyanus was also considered. Plants were irrigated to either 75 or 50% of field capacity, and were sampled at 50 or 100% blooming. In both species, water deficit exerted limited effect on the time required to initiate or complete flowering. In most critical aspects of yield (harvestable organs dry weight, essential oil yield), T. armeniacus was found to be superior than T. kotschyanus. In these traits, however, T. armeniacus underwent a more drastic water deficit-induced decrease. Across treatments, metabolite levels fairly correlated to transcript accumulation profiles of terpene synthases and cytochrome P450 genes. Indices affiliated with reactive oxygen species were inter-correlated with the activity of five major antioxidant enzymes, while the same was noted between leaf water status and pigment content. Taken together, these results indicate that when water availability can be achieved, higher yields will be obtained by cultivation of T. armeniacus. Under water deficit conditions, instead, the more drought tolerant T. kotschyanus stands out as the primary choice.

1. Introduction

In medicinal and aromatic plants, cultivated sources are increasingly gaining ground over wild populations [1]. This shift is underlain by many factors, including consistency of supply and alignment of product standards to market regulations and consumer preferences. Depending on the intended market, herbal material may be traded fresh or dried. Alternatively, the focus may be on the production of essential oils, and in this regard essential oil yield is of interest [2]. Since the composition of essential oil determines its properties, it also sets essential oil quality and market value [3]. Therefore, adjustments in cultivation protocols may be required to improve herbal material (fresh and dry) yield, essential oil yield or essential oil composition.
The dissemination of Thymus spp. (Lamiaceae) is centered in the Mediterranean area, where several species of the genus are also widely cultivated [4]. An extensive interspecific variation in every aspect of production has been documented. Although an important amount of information and knowledge has been gained, it is limited to certain species. Instead, data on other taxa is not publicly available for industrial use. For instance, both Thymus kotschyanus Boiss. and Hohen. and Thymus armeniacus Klokov and Des.-Shost. are widely cultivated in Iran. However, contrary to T. kotschyanus [5], data on biomass accumulation, essential oil yield and composition is essentially absent in T. armeniacus. In this perspective, there is a great demand of developing and establishing cultivation protocols.
The developmental stage at harvest is a factor affecting essential oil production. In some Thymus species, for instance, essential oil production is considerably affected by flowering induction, whereas flowering exerts a less pronounced effect in other taxa [6,7]. Therefore, the importance of harvesting time associated with essential oil features varies depending on the species of interest.
Although Thymus species are generally well adapted to water deficits, limited soil water availability may decrease productivity and alter essential oil composition [8]. These effects are underlain by a diverse range of processes. For instance, essential oil is highly concentrated in leaf trichomes, the density of which is affected by water deficit depending on the species. Another illustration is the water deficit-induced reduction in chlorophyll content, which impedes carbon assimilation. Furthermore, the water deficit elicits osmotic stress, impairing the activity of several enzymes and damaging the structure of critical macromolecules [2]. These effects may be effectively alleviated by the accumulation of specific osmolites (e.g., proline) [2]. In addition, plants under water deficit conditions generally experience an imbalance between the generation and scavenging of reactive oxygen species (ROS) such as hydrogen peroxide (H2O2). Ascorbate peroxidase (APX), catalase (CAT), guaiacol peroxidase (POX), polyphenol oxidase (PPO), and superoxide dismutase (SOD) are key ROS detoxification enzymes, while carotenoids and polyphenols are major non-enzymatic antioxidant metabolites [9,10,11]. Excessive ROS generation elicits a range of harmful effects, including lipid peroxidation [9,10,12].
The objectives of this study were to investigate for the first time the dual effects of harvesting time and soil water availability on herbal material marketable yield (leaves and flowers), as well as on essential oil yield and composition in T. armeniacus. For comparison purposes, T. kotschyanus was cultivated at the same stand and considered. To gain a more fundamental insight, several underlying processes were further investigated, including leaf trichome density, chlorophyll content, proline content, membrane lipid peroxidation and seven critical antioxidant defense elements. Βy studying the regulation of genes participating in the terpenoid biosynthetic pathway across developmental stages and species, the genetic-metabolic crosstalk was also elucidated.

2. Materials and Methods

2.1. Plant Material and Growth Conditions

Seeds of two Thymus species (T. kotschyanus, T. armeniacus) were sterilized, and then rinsed with distilled water. Seeds were then planted in a seedling tray (30 × 18 × 5 cm) filled with peat and perlite (9:1, v/v; Meegaa substrates BV, Rotterdam, The Netherlands). At the cotyledon stage, seedlings were transferred to 6 L pots (dimensions of 30 × 25 cm) containing the same mixture. Following sufficient growth (~six weeks), a single plant per species was selected as the mother plant. Experimental plants were further obtained by cutting propagation. For each species, branch cuttings were collected from the same (mother) plant, and were thus considered identical clones.
Following six weeks of cultivation, cuttings were fully rooted. Rooted cuttings with uniform height (~15 cm) and architecture were selected for potting. These were transplanted to 6 L pots (dimensions of 30 × 25 cm) containing a mixture of soil, sand, and animal manure (4:2:1, v/v/v). Pots were transferred in a multi-span plastic greenhouse, which was located to Shahrekord (32°19′32″ N 50°51′51″ E). A density of four plants m−2 was employed. The air temperature was set to 24 °C, and relative air humidity to 70%. Supplementary light was set at 250 µmol m−2 s−1 photosynthetic photon flux density at the top of the plant canopy for 16 h d−1, and was provided by red (90%) and blue LED modules (Iraneon Co., Birjand, South Khorasan, Iran). Potting-media moisture was maintained by regular watering. With the dual purpose of inducing the same initial status among individuals and of ensuring that herbal material growth would take place under experimental conditions (described below), all plants were pruned at 5 cm above root-to-shoot interface.
Immediately afterwards, three factors [2 species (T. kotschyanus, T. armeniacus) × 2 irrigation levels (full, and deficit irrigation) × 2 sampling stages (50, and 100% blooming)] were applied as a factorial experiment based on a completely randomized design. Irrigation was adjusted daily to 75 and 50% of field capacity, representing full and deficit irrigation, respectively. Under these irrigation schemes, substrate volumetric water content corresponded to circa 8–10 and 5–7%, respectively. These irrigation levels were selected based on growth reduction in a preliminary study. Irrigation to 100% of field capacity was not performed in order to avoid potential adverse effects related to waterlogging. Given daily irrigation and the large substrate volume (6 L), day-to-day variation in substrate moisture content is expected to be rather minimal. The irrigation scheme was maintained until the final harvest, which was conducted at the 100% blooming developmental stage (15 August 2019). Experimental plants were collected for evaluation at two developmental stages (50 and 100% blooming), based on the percentage of branches bearing open flowers. When half of the branches had open flowers, it was considered as 50% blooming. Accordingly, when all branches were in that state, it was considered as 100% blooming.
Plants were cultivated for three months (15 May–15 August 2019). During this period, the mean air temperature was 23.8 ± 1.6 °C, while the mean relative air humidity was 66 ± 7%. The average daily light integral was 20.6 ± 0.3 mol m−2 d−1 (LI-250A, LI-COR, Lincoln, NE, USA).
Plant and leaf level measurements were conducted. For leaf-level measurements, leaves were selected from the upper (toward the apex) one-third of the leaf-bearing nodes. Sampled leaves had grown under direct light, and were fully expanded. In all evaluations, three replicates were assessed per treatment.

2.2. Growth, Flowering and Harvest Index

The time required for initiation of flowering, as well as for reaching the two developmental stages (50 and 100% blooming) under study was recorded. The inflorescence height and the number of flowers per inflorescence were also documented.
The length of five branches (from the root-to-shoot junction to the apical meristem) per plant was recorded and averaged to compute plant height.
By considering the overhead (top-view) 2D plant silhouette, a convex hull (the minimal polygon that encloses the entire silhouette perimeter) [13] was fitted. The maximum and the minimum distance spanned by pairs of points crossing the convex hull center were considered as plant length and width, respectively. Based on these data, canopy area ( π × plant   length 2 × plant   width 2 ) was computed.
For individual leaf trait assessment, leaves were scanned (HP Scanjet G4010, Irvine, CA, USA) and then evaluated by using the Digimizer software (version 4.1.1.0, MedCalc Software, Ostend, Belgium) [14]. Leaf length (midvein length; major axis), width (widest point perpendicular to the leaf major axis) and area (one-sided surface area) were digitally assessed [13,15].
Aerial plant and shoot (fresh and dry) masses were recorded. For measuring dry weight, samples were placed in a forced-air drying oven for 72 h at 80 °C. Economic yield was considered the combined mass of leaves and flowers (thus excluding shoots). Harvest index ( economic   yield plant   dry   weight × 100 % ) was also computed.

2.3. Essential Oil Content

The essential oil content is as important as essential oil yield, since it determines the extraction cost and, therefore, the profitability of essential oil production [2]. Shade-dried samples were subjected to hydro-distillation using a Clevenger apparatus [3]. These (20 g) were added to a 1 L flask containing 200 mL of distilled water. The flask was then heated for 3.5 h. Essential oil content was recorded. The isolated essential oils were first dried over anhydrous sodium sulfate, and then kept in glass vials at −20 °C before further analysis [3]. Three replicates were assessed per sample.

2.4. Essential Oil Composition

Gas chromatography-mass spectrometry (GC–MS) analysis was conducted using a gas chromatograph (Model 7890A, Agilent, Palo Alto, CA, USA) coupled with a mass selective detector (Model 5673, Agilent, Palo Alto, CA, USA). A fused silica capillary column (30 m length × 0.25 mm i.d.; 0.25 μm BP-5 film thickness) was used to separate the oil compounds. The oven temperature was increased from 40 to 290 °C (at a rate of 7 °C min−1 for 40–200 °C, and of 40 °C min−1 for 200–290 °C), and finally held isothermal at 290 °C for 10 min. Ion source and transfer-line temperature was 290 °C. Ultra-pure helium was used as the carrier gas. Injector and interface temperatures were 290 °C and 280 °C, respectively. The mass spectrum was acquired over the mass range of 35–450 amu in full-scan acquisition mode. The split ratio was 1:50.
The GC-FID analysis of the essential oils was conducted using a Thermoquest Finnigan apparatus equipped with a flame ionization detector (FID) and a fused silica capillary column (30 m length ×0.25 mm i.d.; 0.25 μm BP-5 film thickness). The oven temperature was programmed as stated above. Injector and detector temperatures were 250 °C and 300 °C, respectively. Ultra-pure helium was used as the carrier gas with a flow rate of 2.1 mL min−1. The split ratio was 1:10.
Retention indices (RI) of each compound were calculated using a homologous series of n-alkanes (C6–C24) injected to HP-5MS column in the same condition. Identification of oil constituents was performed by comparison of (1) their retention times with those of authentic standards, (2) their spectral mass with those of the internal reference mass spectra library (NIST08 and Wiley 9.0), and (3) their RI with those reported in the literature [16]. Quantification was conducted by the external standard method through calibration curves generated by running GC analysis of representative authentic compounds [3]. The relative percentage of each essential oil constituent was obtained according to the respective area under the curve by using the area normalization method and ignoring response factors [3].

2.5. Leaf Trichome Density

Glandular trichomes secrete essential oils. In this perspective, treatment effects on glandular trichome density of either leaf side were studied. The sampling area (1 × 1 cm) was located midway between the leaf base and tip, and between the midrib and lateral margin. Images were acquired using an optical microscope (Leitz Aristoplan; Ernst Leitz Wetzlar GmbH, Wetzlar, Germany) connected to a digital camera (Nikon DXM-1200; Nikon Corp., Tokyo, Japan). Glandular trichome density was counted on five non-overlapping fields of view per leaf (magnification × 100). Image processing was performed with ImageJ software (https://imagej.nih.gov/).

2.6. Leaf Water Status

Leaf water status was in situ assessed by measuring relative water content (RWC). Samples were collected 3 h following the onset of the photoperiod [17]. Following excision, fresh weight was gravimetrically obtained (±0.0001 g; Mettler AE 200, Giessen, Germany). Immediately after, samples were floated on distilled water inside a Petri dish covered with a lid. Following 24 h of incubation, the recorded weight was regarded as turgid (saturated). Then, dry weight (48 h at 80 °C) was determined. RWC was calculated according to Taheri-Garavand et al. [18].

2.7. Leaf Chlorophyll and Carotenoid Content

Leaf chlorophyll content is critical for photosynthesis, while carotenoids are important non-enzymatic antioxidants [1,11]. Samples were processed immediately after collection. Following fine chopping, portions weighing 0.1 g were homogenized with the addition of 10 mL of 100% acetone. The extract was then centrifuged (14,000× g for 20 min), and the supernatant was collected. Since chlorophyll is light sensitive, the extraction took place in a dark room [9,10]. The obtained extract was subjected to reading on a spectrophotometer (Mapada UV-1800; Shanghai Mapada Instruments Co., Ltd., Shanghai, China). Total chlorophyll and carotenoid contents were calculated according to Lichtenthaler and Wellburn [19].

2.8. Leaf Proline Content

Proline is actively involved in cell osmotic regulation via decreasing cell water potential, and in this way enzyme activity and the macromolecules’ structure are protected [2]. In this perspective, the treatment effect on leaf proline content was assessed. Freshly cut leaf discs (0.5 g) were homogenized and then added in 10 mL of 3% (w/v) aqueous sulphosalycylic acid. The extract was filtered through Whatmann No. 2 filter paper, and 2 mL of the filtrate were mixed with 2 mL acid-ninhydrin and 2 mL of glacial acetic acid. The obtained solution was heated (100 °C for 1 h). The reaction mixture was extracted with 4 mL toluene, and the chromophore containing toluene was aspirated from liquid phase. After equilibration at 25 °C, the absorbance was measured at 520 nm with a spectrometer (Mapada UV-1800, Shanghai. Mapada Instruments Co., Ltd., Shanghai, China). Proline concentration was determined using a calibration curve [20].

2.9. Leaf Hydrogen Peroxide Content

H2O2 is a critical ROS which accumulates under adverse conditions [10]. Leaf H2O2 content was, therefore, assessed. The reaction mixture consisted of tissue extract supernatant, 0.5 mL 0.1% trichloroacetic acid, 0.5 mL of 0.1 M potassium-phosphate buffer (pH 7.0), and 1 mL of 1 M KI (w/v). Color developed for 45 min in darkness, and absorbance was then spectrophotometrically assessed at 390 nm (UV-1800, Shimadzu, Kyoto, Japan). H2O2 content was calculated by using a calibration curve prepared with eight known H2O2 concentrations.

2.10. Leaf Lipid Peroxidation

The treatment effects on the malondialdehyde (MDA) content, taken as an indication of lipid peroxidation level, were evaluated by employing the thiobarbituric acid reactive substance assay [2]. Freshly-cut leaf discs (0.1 g) were homogenized, and then added in 5 mL of 20% (w/v) trichloroacetic acid and 0.5% (w/v) thiobarbituric acid. The suspension was subsequently centrifuged (6000× g for 15 min). The obtained solution was heated (100 °C for 25 min). After equilibration at 25 °C, the precipitate was removed by centrifugation (6000× g for 5 min). The amount of MDA was calculated from the absorbance at 535 nm after subtracting the non-specific absorption at 450 and 600 nm (Mapada UV-1800; Shanghai Mapada Instruments Co., Ltd., Shanghai, China). The extinction coefficient 156 mmol MDA L−1 cm−1 was used. Four discs were assessed per replicate sample.

2.11. Antioxidant Defense Elements

2.11.1. Total Phenolic Content

As phenolics exhibit strong antioxidant properties, they can be beneficial for plant antioxidant defense [12]. Leaf total phenolic content was therefore assessed. Leaf samples (0.1 g) were ground with a mortar and pestle with liquid nitrogen, extracted with 1 mL of 80% aqueous methanol in an ultrasonic bath for 10 min, and were then centrifuged (15,000× g for 10 min). The content of total phenolics was determined by using the Folin-Ciocalteu assay [12]. The absorbance against prepared re-agent blank was determined using a microplate reader (Infinite 200 PRO, TECAN, Männedorf, Switzerland). For total phenolic content, gallic acid was used as the standard reference and gallic acid equivalent (GAE) was expressed as mg per g dry mass [12].

2.11.2. Activity of Five Antioxidant Enzymes

The treatment effects on the activity of five critical antioxidant enzymes (APX, CAT, POX, PPO, SOD) was assessed.
APX activity was assessed using the method described by Ahmadi-Majd et al. [9,10]. Fresh frozen leaf segments (0.1 g) were ground in liquid nitrogen, homogenized with 1 mL of 50 mM sodium phosphate buffer (pH 7.0) containing 2 mM EDTA and 1% polyvinylpyrrolidone (PVP), and centrifuged (14,000× g for 20 min) at 4 °C. APX activity in the supernatant was assessed by following the decrease in absorbance at 290 nm for 2 min (10 s intervals) in a reaction mixture containing sodium phosphate buffer, ascorbic acid, and H2O2. The extinction coefficient of 2.8 mM−1 cm−1 was used. APX activity was expressed as μmol of ascorbate oxidized min−1 g−1 tissue.
CAT activity was measured as described by Ahmadi-Majd et al. [9,10]. Fresh frozen leaf segments (0.3 g) were ground in liquid nitrogen, homogenized with 1.5 mL of K phosphate buffer (containing 1 mM EDTA and 2% PVP), and centrifuged (14,000× g for 20 min) at 4 °C. CAT activity in the supernatant was assessed by following the decrease in absorbance at 240 nm for 2 min (10 s intervals) in a reaction mixture containing potassium phosphate buffer and H2O2. The extinction coefficient of 39.4 M−1 cm−1 was used. CAT activity was expressed as μmol of H2O2 reduced min−1 g−1 tissue.
SOD activity was determined by the method of Ahmadi-Majd et al. [9,10] and was assayed by monitoring the inhibition of the photochemical reduction of nitro-blue tetrazolium chloride (NBT). Fresh frozen leaf segments (0.5 g) were ground in liquid nitrogen, homogenized with 1 mL of 50 mM sodium phosphate buffer (pH 7.0) containing 2 mM EDTA and 1% PVP, and centrifuged (14,000× g for 20 min) at 4 °C. A reaction mixture of sodium phosphate buffer, methionine, NBT, EDTA, and riboflavin was used. The mixture was placed for 20 min at 25 °C under a fluorescent light (30 Watt). Absorbance at 560 nm was monitored using a spectrophotometer (Mapada UV-1800; Shanghai Mapada Instruments Co., Ltd., Shanghai, China). A SOD enzyme activity unit was considered as 50% of the NBT photoreduction and expressed as unit min−1 g−1 tissue.
PPO activity was determined according to Chen et al. [11], using a commercial assay kit (Nanjing Jiancheng Bioengineering Institute, Nanjing, China). Briefly, 0.15 mL supernatant was mixed with 0.6 mL phosphate buffer (25 mM) and 0.15 mL catechol (20 mM), and incubated for 10 min at 25 °C. It was then was immediately placed into boiling water for 10 min and cooled to room temperature (25 °C). Next it was centrifuged (10,000× g for 10 min) at 25 °C. Thereafter, using distilled water as a blank, the absorbance was measured at 410 nm with a microplate reader (Infinite 200 PRO, TECAN, Switzerland). One unit of PPO activity was defined as the amount of enzyme required to increase the absorbance by 0.01 min−1 under the assay conditions.
POX activity was performed according to the method of Narwal et al. [21]. The reaction mixture contained 1350 μL of 0.1 M potassium phosphate buffer (pH 6), 500 μL of 44 mM H2O2 solution, 100 μL of 45 mM guaiacol and 200 μL of extracted enzyme extract. Absorbance at 470 nm was monitored using a spectrophotometer (Mapada UV-1800; Shanghai Mapada Instruments Co., Ltd., Shanghai, China).

2.12. QPCR Expression Analysis

Total RNA from each sample was extracted using the total RNA isolation kit (S-1010-1, Dena Zist Asia, Mashhad, Iran). The genomic DNA was eliminated by DNAse I treatment according to the manufacturer’s instructions (ThermoFisher, Waltham, MA, USA). Subsequently, first strand cDNA was amplified using M-MLV (Moloney Murine Leukemia Virus) Reverse Transcriptase and oligo (dT)18 primer, from 2 μg total RNA to 20 μL final volume (Cat. No. 18080-044; Invitrogen, Carlsbad, CA, USA).
All the RT-qPCR reactions were performed using RT-Master Mix (Cat. No. RR820L, Takara Bio, Shiga, Japan) containing SYBR Green on a Rotor Gene Q (Qiagen, Hilden, Germany). The following PCR profile was employed: (1) 95° C for 30 s (pre-denaturation step), (2) 95 °C for 15 s (denaturation step), (3) 56–57 °C for 20 s (annealing), and eventually (4) 72 °C for 25 s (extension). This sequence was repeated for 35 cycles. Then a melting curve (55–95 °C) was performed at the default ramp rate. The primers efficiency was acquired from calibration curves with 1:5 dilution series and at least three points fitted in a linear regression with R-square over 0.98.
The primer used in this study was designed based on gene sequences in the NCBI database and primers designed in previous reports (Crocell et al., 2010). The accuracy of sequences and size of primers were checked using the Primer-BLAST software of NCBI (Supplementary Table S1). The qRT-PCR analysis was carried out with elongation factor-1α (EF-1α) gene as the internal standard and was analyzed using the 2−ΔΔCT method [22].

2.13. Statistical Analysis

Data analysis was performed using the SPSS software (version 23; SPSS Inc., Chicago, IL, USA). A three-way ANOVA was employed (species × irrigation level × sampling stage). The data were first tested for normality (Shapiro–Wilk test) and homogeneity of variances (Levene’s test). The means were compared using Fisher’s least significant difference test to be significant at p ≤ 0.05.
For the four experimental units, eigenvalues were extracted and the most contributing variables for each dimension were computed and identified. The first two eigenvalues cumulated more than 77% of the total variance, and were retained to produce the principal components. A biplot principal component analysis (PCA) was produced to depict correlations across the traits, species and contributions to principal components. Individuals were grouped (by discrete color) and variables by their contribution to the principal components (gradient colors). The “FactoMineR”, “factoextra” and “readxl” libraries were used under the R-studio integrated development environment (RStudio suite V 1.2.5033).

3. Results

3.1. Growth, Flowering and Harvest Index

The onset of flowering occurred much earlier in T. armeniacus as compared to T. kotschyanus (49.3 versus 79.3 d), though time to 100% blooming was rather similar among them (115–120 d; Table 1). Thymus armeniacus had shorter (47.6%) inflorescence length, and a lower (34.6%) number of flowers per inflorescence. Water deficit (50 as compared to 75% field capacity) reduced (~5%) time to 100% blooming similarly among the two species. In both species, the water deficit also decreased inflorescence length, and the number of flowers per inflorescence. The latter was more decreased in T. armeniacus, while the former in T. kotschyanus.
In both species, water deficit decreased plant height, length, and individual leaf dimensions (length, width, area) (Table 2). For plant height and individual leaf dimensions, this effect was less prominent in T. armeniacus.
Thymus armeniacus had higher plant fresh weight, dry weight, economic yield (dry weight of leaves and flowers), and harvest index (dry weight of leaves and flowers relative to plant dry weight) as compared to T. kotschyanus (111.6, 95.0, 122.7, and 14.3%, respectively; Table 3). In both species, water deficit decreased plant fresh weight, dry weight, economic yield, and harvest index. For plant fresh weight and economic yield, this effect was more pronounced in T. armeniacus.

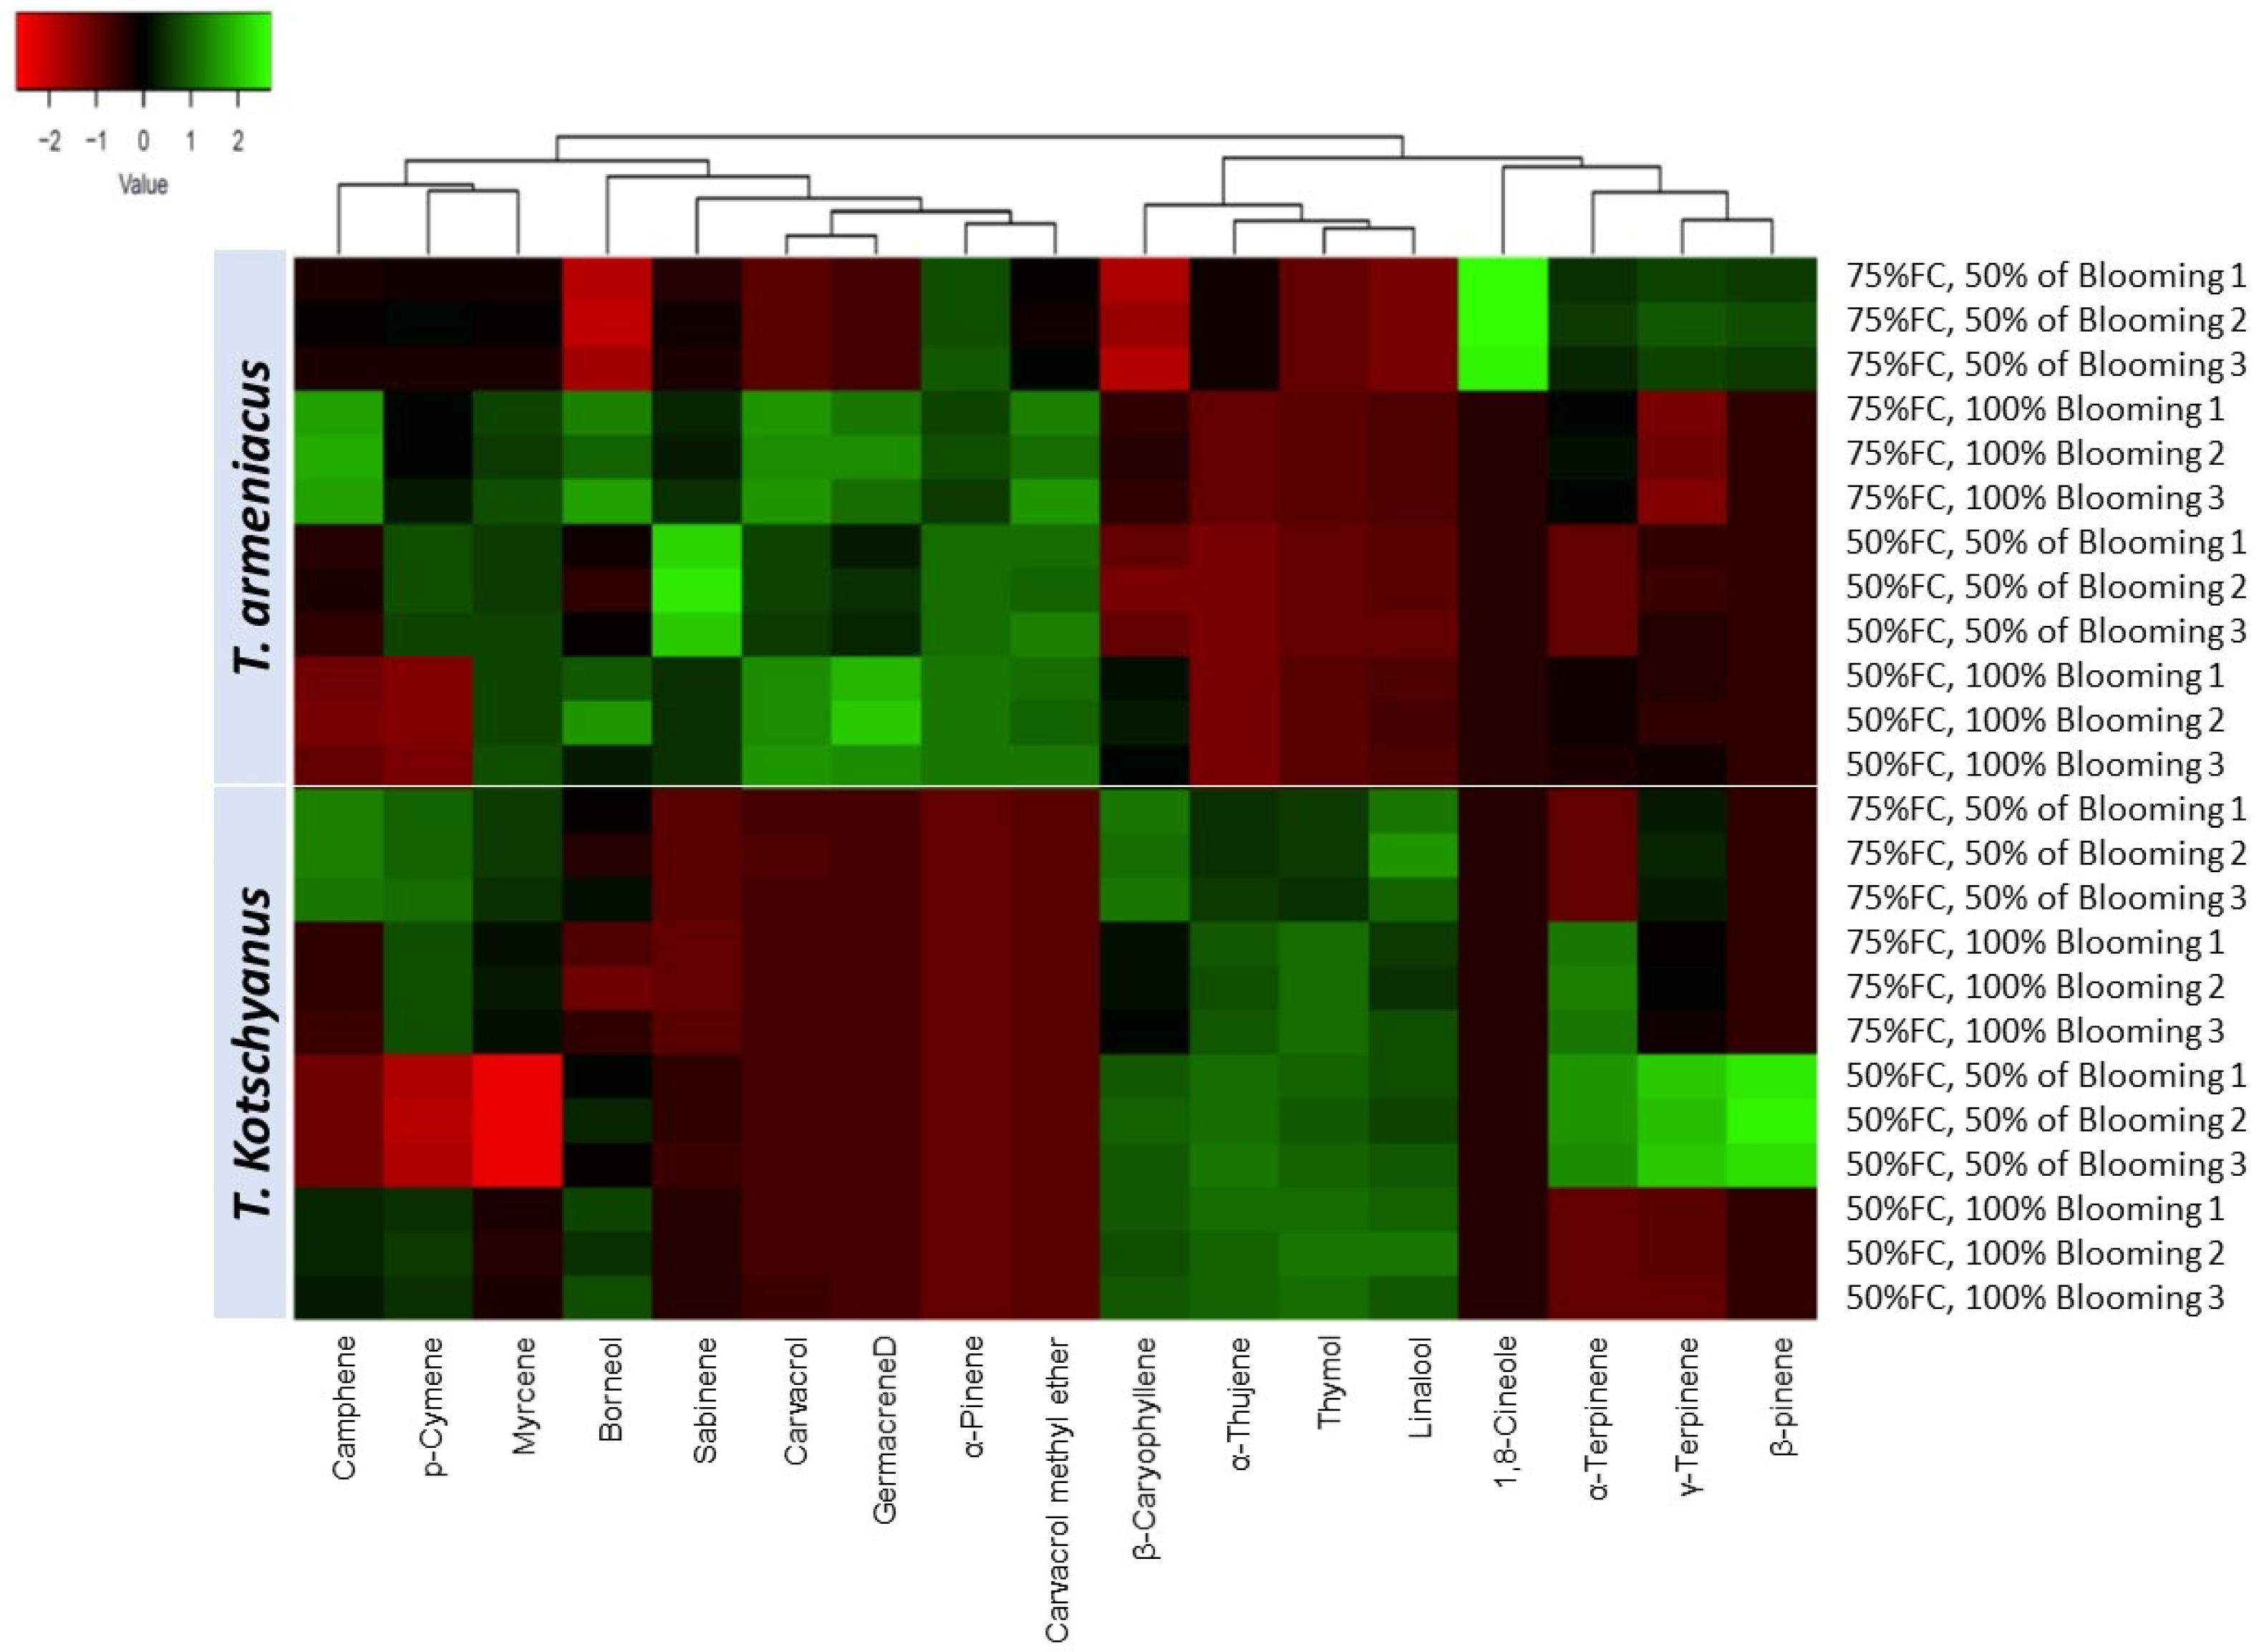
3.2. Essential Oil Content, Yield and Composition

Thymus armeniacus had lower (49.9%) essential oil content, and higher (13.2%) essential oil yield as compared to T. kotschyanus (Table 4). The water deficit decreased (49.9%) the essential oil content in T. kotschyanus, whereas it exerted a minor effect (1.4%) in T. armeniacus. The water deficit decreased essential oil yield in both taxa, an effect that was more prominent in T. armeniacus (30.5 versus 24.6%).
By using gas chromatography–mass spectrometry, essential oil composition was further analyzed (Table 5). For T. armeniacus, the most abundant metabolites were γ-Terpinene (16.65–23.58%), p-Cymene (6.70–16.56%) and α-Pinene (12.16–15.78%). The former two (i.e., γ-Terpinene, p-Cymene) were also the most abundant metabolites in T. kotschyanus (17.69–28.11 and 4.19–17.78%, respectively), whereas α-Pinene was not detected in this species. In T. kotschyanus, thymol was also a very abundant metabolite (11.41–15.73%).
The water deficit affected substance content depending on the metabolite and the species (Table 5; full range of documented compounds in Supplementary Table S2).
Hierarchical clustering of essential oil components revealed that these could be organized primarily based on species and secondarily on irrigation treatments (Figure 1). However, neither growth stage nor irrigation regime severely distorted essential oil fractions.

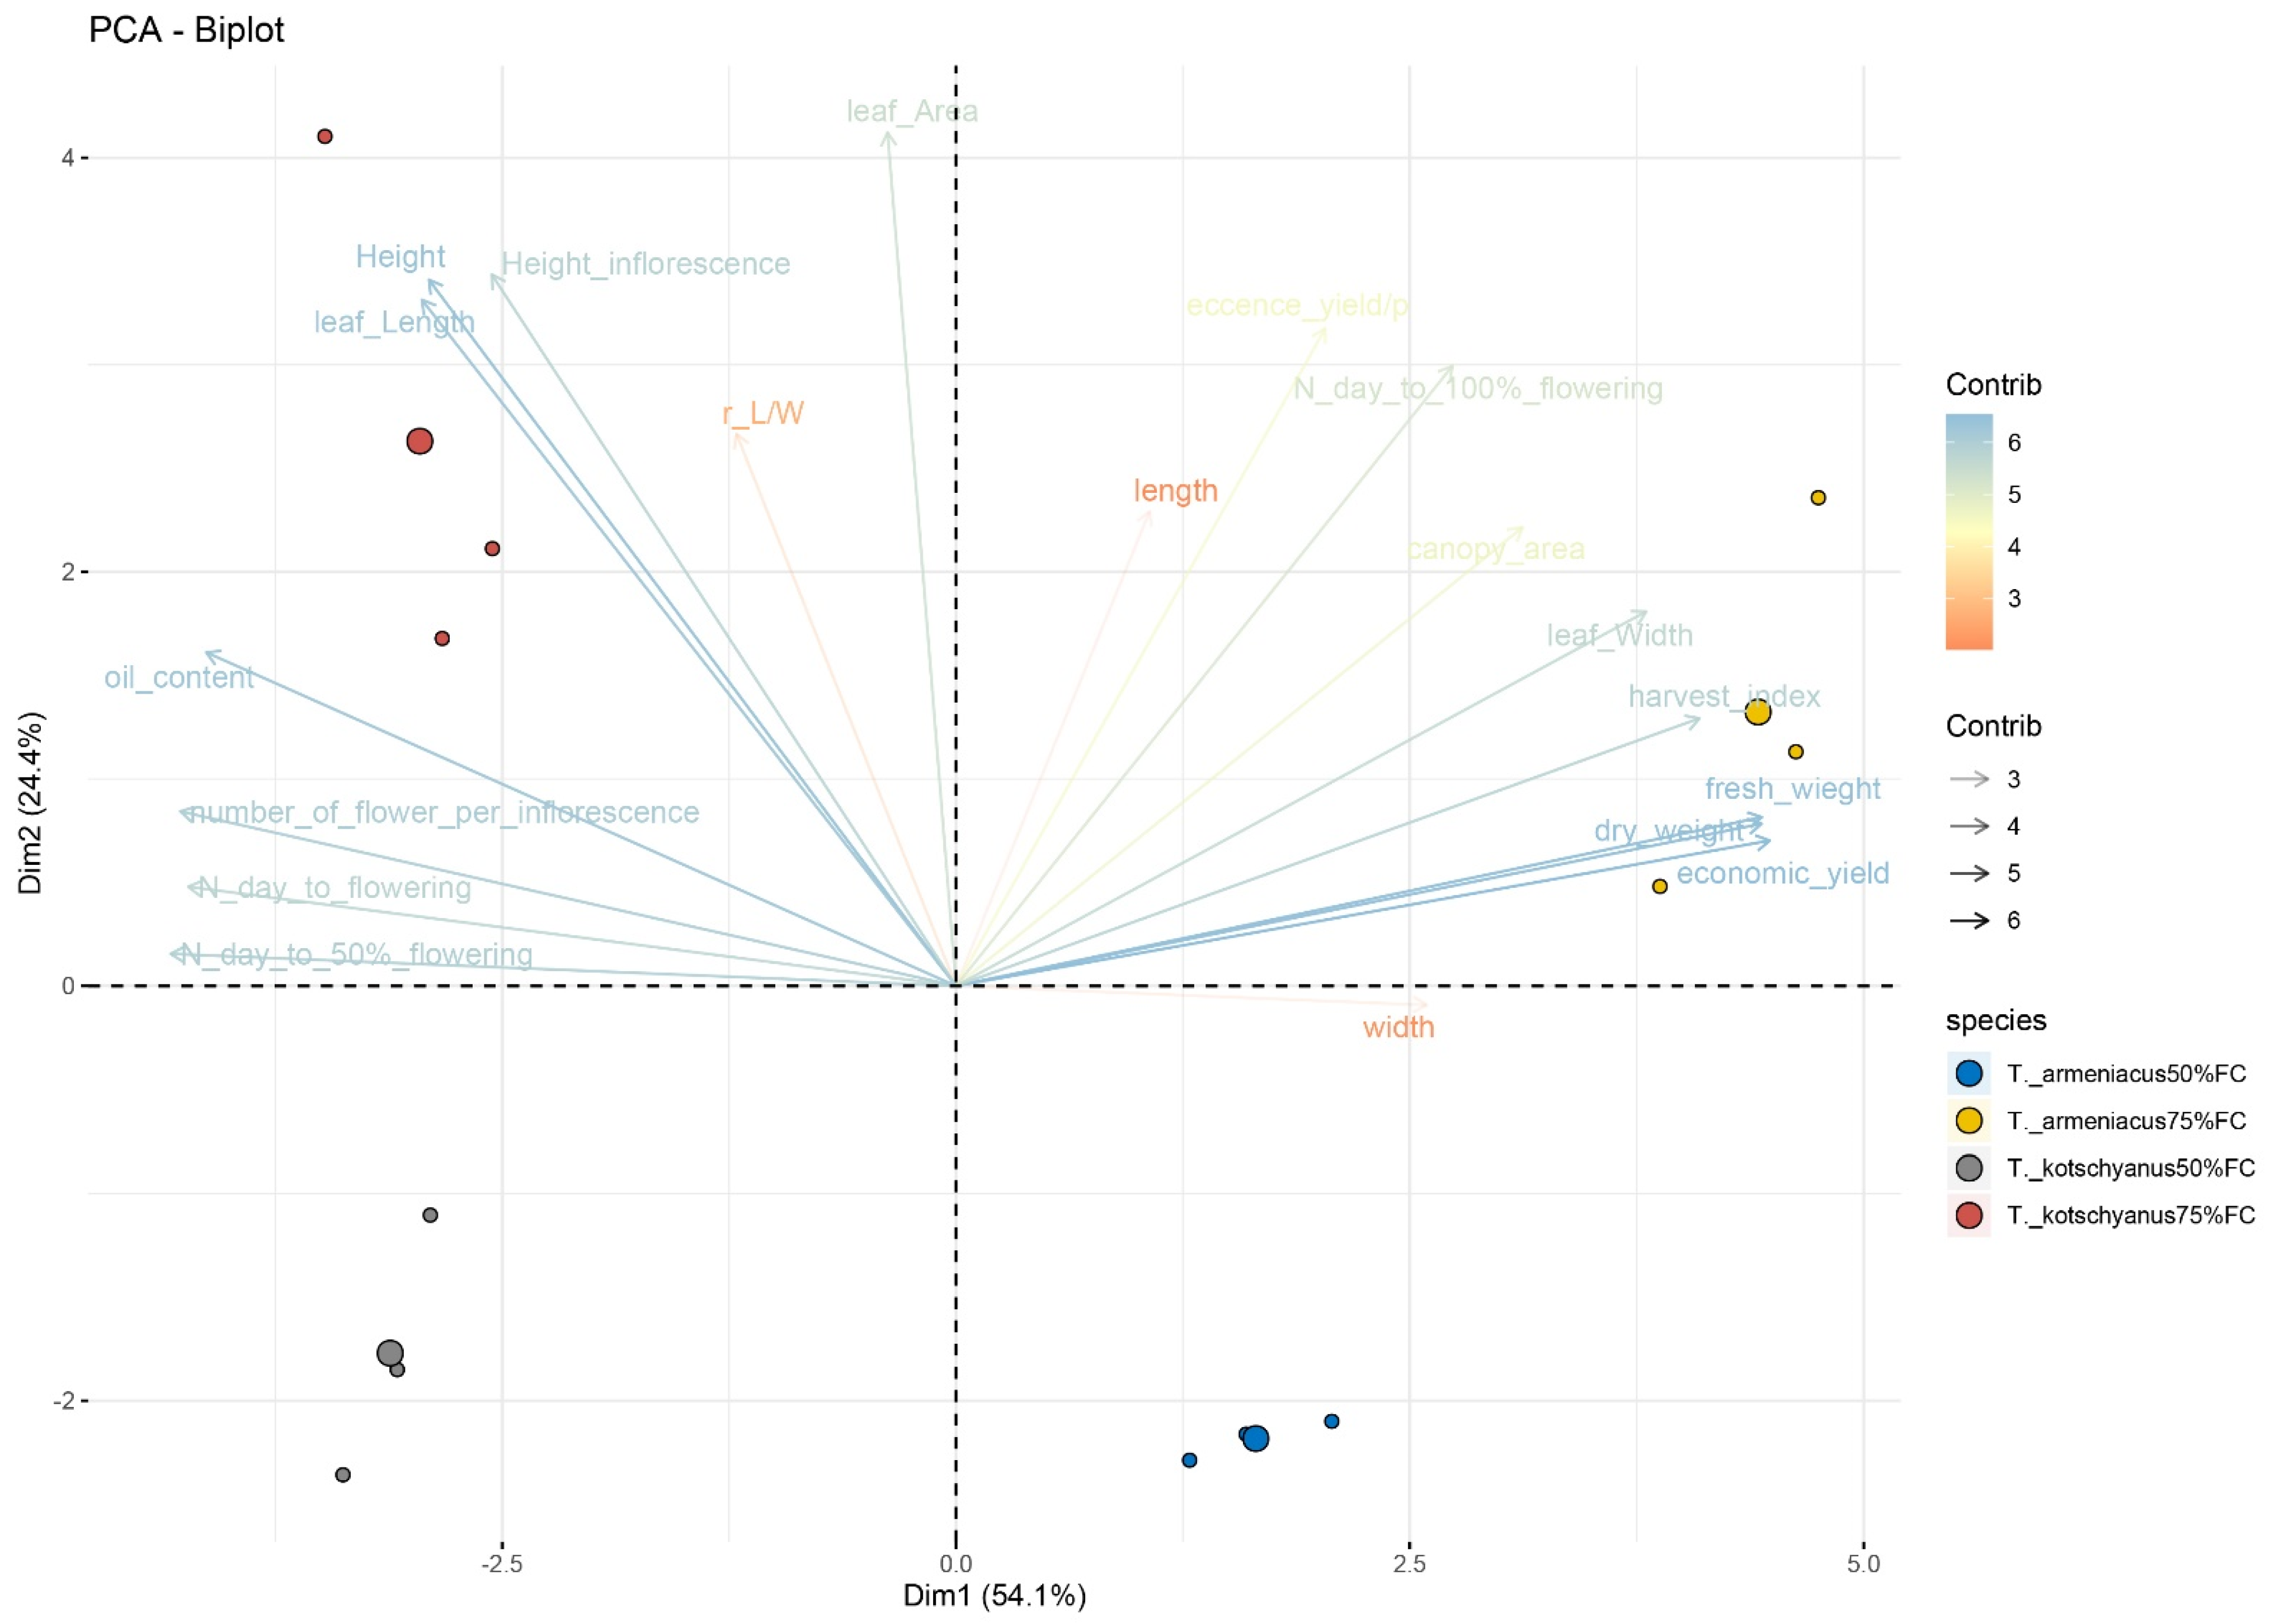
3.3. Principal Component Analysis in Plant Growth and Yield Traits

In order to identify and quantify the components that regulate the connections among the two Thymus species, as well as the effect of irrigation regime to the delineation of differential responses, a biplot PCA was conducted (Figure 2). In this analysis, all the growth traits were included (data in Table 1, Table 2, Table 3 and Table 4 excluding trichome density). Eigenvalues were examined to determine the number of considered principal components (PC). The first two dimensions explained more than 77% of the total variance percentage (Supplementary Figure S1). The level of significant contribution of morphological traits to the PCA was estimated by using the cos2 index (Supplementary Figure S2). Among these descriptors, the plant fresh and dry weights as well as the economic yield and flowering/inflorescence indices had a profound impact for the categorization of species and treatments. The biplot PCA based on the first two components revealed the complex relationships among genotypes and treatments (Figure 2). The first axis revealed that T. armeniacus and T. kotschyanus can be clearly demarcated based on genotypic discrepancies under control conditions (75% of field capacity), while the second axis displays the discriminating effects imposed by water deficit within the same species. Furthermore, positive and negative correlations across morphological components were evident. Flowering and inflorescence indices were highly homogenous (indicating co-regulation) as were the plant fresh weight, dry weight and economic yield. Interestingly, the above-mentioned clusters had an inter-negative association showing that the earliness in blooming is an index of high biomass yield.

3.4. Leaf Trichome Density

Thymus armeniacus had lower (~45%) trichome density in either leaf side as compared to T. kotschyanus (Table 4). Most trichomes were generally situated on the abaxial leaf side as compared to the adaxial one, besides T. armeniacus cultivated under water deficit.
The water deficit increased trichome density in either leaf side of both species (Table 4). This increase was considerably more prominent in T. armeniacus as compared to T. kotschyanus (126–281% versus 13%).

3.5. Leaf Water Status

Leaf RWC was determined as an indication of hydration status. In both species, water deficit impaired leaf hydration status at 100% blooming (Table 6). This effect was more prominent in T. kotschyanus, as compared to T. armeniacus.

3.6. Leaf Chlorophyll, and Proline Contents

In T. armeniacus, the water deficit improved leaf chlorophyll content at either developmental stage (Table 6). In T. kotschyanus, the water deficit decreased (21.7%) leaf chlorophyll content at 50% blooming, but not at 100%.
At 100% blooming, water deficit induced a sizeable increase (~1500%) in leaf proline content (Table 6). This effect was comparable among the two species.

3.7. Leaf Hydrogen Peroxide Content and Lipid Peroxidation Level

H2O2 is a critical ROS. At either developmental stage, water deficit increased (~95%) leaf H2O2 content in both species (Table 6). This effect was comparable among the two species.
MDA content was assessed as an indication of lipid peroxidation level [2]. At 100% blooming, the water deficit induced an increase in leaf MDA content (Table 6). This increase was more prominent in T. armeniacus as compared to T. kotschyanus (45.3 versus 36.4%).

3.8. Enzymatic and Non-Enzymatic Antioxidant Defense Elements

Carotenoids and polyphenols are critical non-enzymatic antioxidants, while APX, CAT, POX, PPO, SOD are important antioxidant enzymes.
In T. armeniacus, water deficit improved leaf carotenoid content at either developmental stage (Table 6). In T. kotschyanus, instead, no effect on carotenoid content was noted.
Water deficit decreased leaf total phenolic content in both species (Table 6). This effect was more prominent in T. armeniacus as compared to T. kotschyanus (15.6 versus 10.4%).
Different effects of the water deficit were noted among enzymes, species and developmental stages (Table 6).

3.9. Interplay of Physiological Traits

In order to delineate the interaction responses of each species to the watering regime across the two developmental stages, a hierarchical clustering was performed (Figure 3). In this analysis, all the physiological traits were included (data in Table 6). Two major clusters were acknowledged. The first contained oxidative indices (H2O2, proline and MDA levels) affiliated with ROS induction, as well as antioxidant enzymes (APX, CAT, POX, PPO, SOD). Oxidative indices were inter-correlated with antioxidant enzymes, suggesting a joint regulatory biosynthetic pathway. Further correlations among MDA and proline contents, as well as among H2O2 content and POX enzyme activity, were determined, suggesting a related biochemical connection. The second cluster contained the RWC index as well as chlorophyll and carotenoid contents.
Similar patterns across physiological traits were recorded among the two species under study (Figure 3). Specifically, a tight upregulation under water deficit that was mostly unaffected by the developmental stage, was demonstrated. Still, there were some instances where the species effect was more prominent and several discrepancies among the two species were recorded.

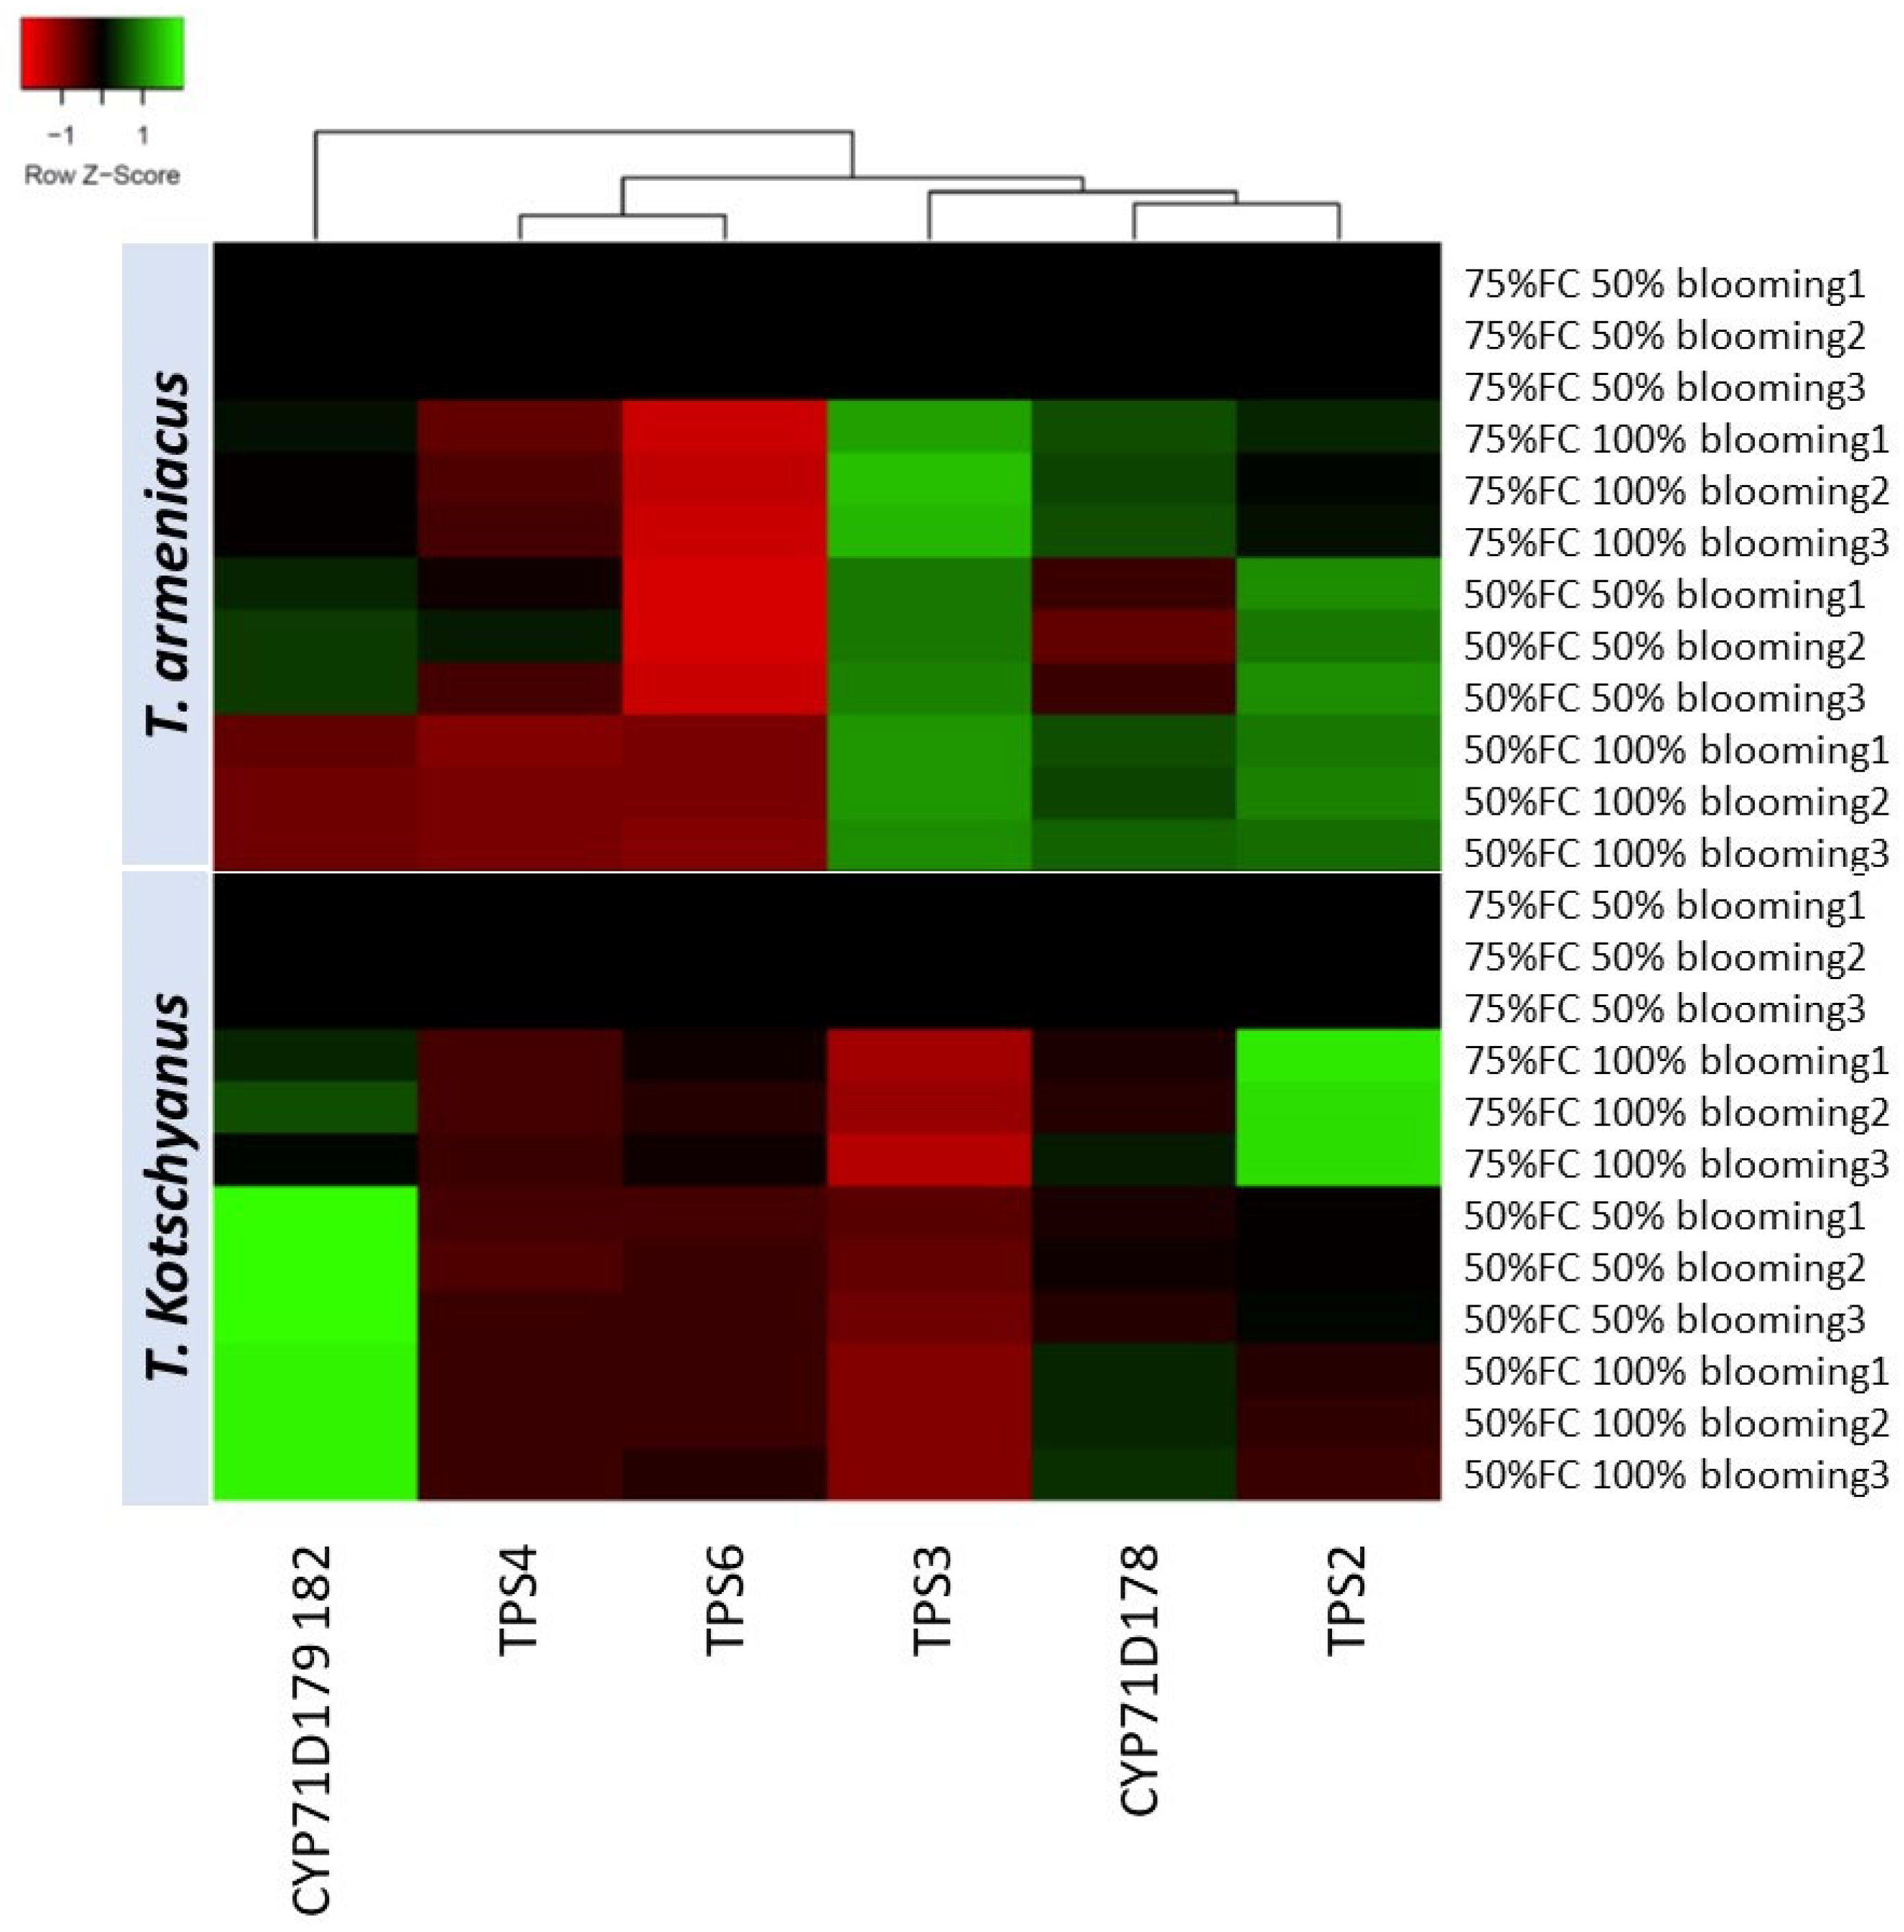
3.10. Relative Expression of Terpene Synthesis

The simultaneous analysis of transcript accumulation indicates that there are distinct developmentally regulated pathways as well as stress-induced responses (Figure 4). Moreover, gene regulation in the terpene pathway seems to follow different routes based primarily on the species. Hence, major discrepancies were detected among the two species under study. In T. armeniacus, a significant downregulation was evident for TERPENE SYNTHASE 6 (TPS6) at the 100% blooming stage, which was not specifically correlated to the water deficit. In contrast, the same isoform seems unaffected in T. kotschyanus, having a rather conserved expression pattern. Genes encoding CYTOCHROME P450 (CYP) monooxygenases enzymes were also differentially regulated among the two species. CYP71D179 182 seems to be linked to water availability, since in T. kotschyanus a significant upregulation was detected under water deficit regardless of the developmental stage. In T. armeniacus, transcription patterns fluctuated at a much lesser pace. By contrast, TERPENE SYNTHASE 2 (TPS2) seems to correlate to water deficit only in T. armeniacus, since there was a significant upregulation under the water deficit. In T. kotschyanus, instead, a peak was established under adequate water supply (75% of field capacity) at the 100% blooming stage. TERPENE SYNTHASE 3 (TPS3) had a complete opposite transcript accumulation among the two species. A clear developmental upregulation was established in T. armeniacus, while blooming progression was accompanied by a significant reduction in transcription of T. kotschyanus. Similar patterns were recorded during the water deficit, where in the former a notable increase of TPS3 transcripts was established, as opposed to the latter. Nonetheless, TERPENE SYNTHASE 4 (TPS4) was found to be equally responsive for both species and a general downregulation pattern was observed when compared to the adequate water supply and 50% blooming stage.

4. Discussion

In Iran, Thymus spp. hold a wide distribution and long history of cultivation [4,23]. Thymus kotschyanus and T. armeniacus are not only highly popular amongst farmers, but they are also considered as greatly adapted for cultivation in Iran. Regardless, research has principally focused on the former [5], while information and knowledge on the yield traits of the latter is scarce. In this study and for the first time, the combined effects of developmental stage at harvest and soil water availability on several yield features were assessed in T. armeniacus. Evaluations included T. kotschyanus for comparison purposes.
Despite the little interspecies difference in the time required for full (100%) blooming, T. armeniacus underwent the beginning of flowering much sooner than T. kotschyanus (Table 1). Therefore, the overall period of blooming is considerably more extended in T. armeniacus as compared to T. kotschyanus (66 versus 41 d). Minor effects of soil water availability on flowering time were generally noted in both species under study (Table 1). Therefore, water deficit in the extent applied in the current study did not substantially affect the transition from the vegetative to the generative phase.
Thymus armeniacus developed shorter inflorescences with less flowers as compared to T. kotschyanus (Table 1). Both inflorescence traits were adversely affected by water deficit. Length was more decreased in T. kotschyanus, whereas the number of flowers per inflorescence was more impaired in T. armeniacus (Table 1). These results indicate that water deficit downgraded inflorescence features, though species differences were inconsistent among traits.
As discussed, yield may encompass fresh or dry herbal material, which in the case of Thymus spp. principally includes leaves and flowers. In all relevant aspects of yield, T. armeniacus was found to be superior than T. kotschyanus (Table 3). Nevertheless, the water deficit decreased plant fresh weight and economic yield more in T. armeniacus than T. kotschyanus (Table 3). In T. kotschyanus, a negative effect of drought on agronomic traits has also been earlier documented [24,25,26]. Complementarily or alternatively, the yield may be comprised of essential oil features [2,3]. Despite lower essential oil content, essential oil yield was higher in T. armeniacus than T. kotschyanus (Table 4). Similarly to plant fresh weight and economic yield, the water deficit decreased essential oil yield more in T. armeniacus than T. kotschyanus (Table 4). Taken together, these results indicate that when water availability can be secured, the cultivation of T. armeniacus will be associated with higher yield (thus returns), whereas under water deficit conditions the choice may be shifted to T. kotschyanus, which is more drought tolerant. In this perspective, T. kotschyanus bares a better potential for water limiting environments. Importantly, this potential is expected to increase in the near future, provided that global climate models project declining rainfall patterns allied with elevated temperatures [27].
Trichomes comprise highly dedicated secretory cells where most essential oils are anabolized and subsequently amassed in subcuticular cavities [28,29]. Although T. armeniacus had lower (46%) leaf trichome density as compared to T. kotschyanus, it underwent a much more drastic water stress-induced increase (197 vs. 13%; Table 4). Nonetheless, essential oil content was practically unaffected (1.33% reduction) in T. armeniacus, whereas a 15.48% reduction was noted in T. kotschyanus (Table 4). Still, under the molecular prism, a significant downregulation of terpene synthases and cytochromes was noted in T. armeniacus (Figure 4), which potentially reduces terpene precursors and thus leads to a decreased concentration of moieties in leaf trichomes.
Across Thymus taxa, over 360 discrete essential oil components have been characterized. An excessive part (>90%) of these moieties are attributable to the nature of monoterpenes. Among these derivatives, carvacrol and thymol are considered the most common [30]. In the current study, significant differences in terms of qualitative essential oil profiles across developmental stages at harvest and irrigation regimes were noted among the two species. Thymus armeniacus’ terpene palette was mostly composed of terpinenes, although monoterpenes were positively regulated by the developmental stage, as well as the water deficit (Figure 1). In contrast, several pinene class terpenes were not detected in T. kotschyanus, revealing an inferior complexity of essential oil chemical markup. Nonetheless, several monoterpenes and monoterpene alcohols (thymol, linalool, a-Thujene) were found to be largely unaffected by the developmental stage at harvest or by soil water availability. Hence, at least in the case of T. armeniacus and T. kotschyanus, it seems that the main factor of chemical markup differences is predominantly species dependent.
In terms of physiological traits and ROS detoxifying responses, both species under study were affected by the water deficit (Table 6). Comparable patterns have been observed recently [31]. In some traits (MDA content, total phenolic content), T. armeniacus was more adversely affected than T. kotschyanus, while in others (chlorophyll content) the opposite was apparent. A comparable effect of water deficit among the two species was also documented on some traits (proline content, H2O2 content). Across treatments, metabolites affiliated with oxidative stress (H2O2, proline and MDA levels) were inter-correlated with antioxidant enzymes (APX, CAT, POX, PPO, SOD) (Figure 3). This correlation might be taken to indicate a combined regulatory biosynthetic pathway, which has also been earlier suggested [9,10,11]. Leaf hydration status (RWC) was also inter-correlated with leaf pigment (chlorophyll, carotenoid) content (Figure 3). Similar patterns have also previously recorded [8,31,32,33].
Since the present field study included a single growing season, additional research is evidently essential to reach solid results and conclusions. Nevertheless, the obtained findings serve both as a first step and a reference of how the cultivation protocol shapes marketable yield and the essential oil quality (composition) of a previously non-studied Thymus species.

5. Conclusions

For the first time, the dual effects of developmental stage at harvest and soil water availability on plant growth, marketable herbal material yield, as well as essential oil content, yield and composition were investigated in Thymus armeniacus. Thymus kotschyanus was also included for comparison purposes. Irrigation was adjusted to either 75 or 50% of field capacity, and plants were collected at 50 or 100% blooming. Water deficit did not substantially affect the time required for the transition from the vegetative to generative phase in either species. However, the water deficit decreased inflorescence length and the number of flowers per inflorescence. Thymus armeniacus was associated with enhanced yield (e.g., dry weight of harvestable organs, essential oil yield) as compared to T. kotschyanus, but was more affected by water deficit. Water deficit triggered an increase in leaf trichome density, an effect that was sizeable in T. armeniacus. Essential oil composition was largely unaffected by developmental stage at harvest or soil water availability. Oxidative stress indicators (proline, H2O2 and malondialdehyde levels) were inter-correlated with the activity of five key antioxidant enzymes, while a respective correlation was found for leaf water status and pigment (chlorophyll, carotenoid) accumulation. Collectively, these results denote that higher yields will be obtained by cultivating T. armeniacus when soil water is readily available. In contrast, under conditions of limited soil water availability, the choice shifts to the more drought tolerant T. kotschyanus.

Supplementary Materials

The following supporting information can be downloaded at: https://www.mdpi.com/article/10.3390/agronomy12051008/s1, Table S1. Primers used for the qPCR experiments. Table S2. Effect of irrigation regime on essential oil composition of two Thymus species at two developmental stages (50 and 100% blooming). Within each column, different letters indicate significant differences (n = 3). Retention indices (RI) were generated with a standard solution of n-alkanes (C6–C24) on the HP-5MS column. Figure S1. The first ten principal components and percentages of attributed variation. The first two eigenvalues were used to construct the principal component analysis biplot (accounting for the 77.4% of the cumulative percentage explained). Figure S2. Quality of representation (cos2) of the variables on factor map. variables on the first five dimensions are displayed. Size and colour intensity correlate to a better representation of specific morphological traits.

Author Contributions

Conceptualisation, S.H., B.S., S.M.-F. and D.F.; methodology, K.Y., S.M.-F., N.N. and D.F.; software, S.M.-F., N.N. and D.F.; validation, D.F.; formal analysis, N.N. and D.F.; resources, K.Y. and H.Z.; data curation, K.Y., S.M.-F., N.N. and D.F.; writing-original draft preparation, S.M.-F., K.Y. and D.F.; writing-review and editing, N.N. and D.F.; supervision, S.H. and B.S.; project administration, and funding acquisition, S.H., B.S. and M.M.G. All authors have read and agreed to the published version of the manuscript.

Funding

This research received no external funding.

Institutional Review Board Statement

Not applicable.

Informed Consent Statement

Not applicable.

Data Availability Statement

Raw data are available upon request from the corresponding author.

Acknowledgments

The authors gratefully acknowledge the laboratory staff for their contributions, continued diligence, and dedication to their craft. The valuable comments of the editor and two anonymous reviewers are greatly appreciated.

Conflicts of Interest

All authors declare that they have no conflict of interest.

Abbreviations

APX, ascorbate peroxidase; AsA, ascorbic acid; CAT, catalase enzyme; CYP, CYTOCHROME P450; dw, dry weight; fw, fresh weight; GAE, gallic acid equivalent; H2O2, hydrogen peroxide; MDA, malondialdehyde; NBT, nitro-blue tetrazolium chloride; PC, principal components; PCA, principal component analysis; POX, guaiacol peroxidase; PPO, polyphenol oxidase; PVP, polyvinylpyrrolidone; ROS, reactive oxygen species; RWC, relative water content; SOD, superoxide dismutase; TPS2, TERPENE SYNTHASE 2; TPS3, TERPENE SYNTHASE 3; TPS4, TERPENE SYNTHASE 4; TPS6, TERPENE SYNTHASE 6; u, unit.

References

  1. Paschalidis, K.; Fanourakis, D.; Tsaniklidis, G.; Tzanakakis, V.A.; Bilias, F.; Samara, E.; Kalogiannakis, K.; Debouba, F.J.; Ipsilantis, I.; Tsoktouridis, G.; et al. Pilot cultivation of the vulnerable Cretan endemic Verbascum arcturus L. (Scrophulariaceae): Effect of fertilization on growth and quality features. Sustainability 2021, 13, 14030. [Google Scholar] [CrossRef]
  2. Hassanvand, F.; Rezaei Nejad, A.; Fanourakis, D. Morphological and physiological components mediating the silicon-induced enhancement of geranium essential oil yield under saline conditions. Ind. Crops Prod. 2019, 134, 19–25. [Google Scholar] [CrossRef]
  3. Taheri-Garavand, A.; Mumivand, H.; Fanourakis, D.; Fatahi, S.; Taghipour, S. An artificial neural network approach for non-invasive estimation of essential oil content and composition through considering drying processing factors: A case study in Mentha aquatica. Ind. Crops Prod. 2021, 171, 113985. [Google Scholar] [CrossRef]
  4. Mumivand, H.; Shayganfar, A.; Tsaniklidis, G.; Emami Bistgani, Z.; Fanourakis, D.; Nicola, S. Pheno-Morphological and Essential Oil Composition Responses to UVA Radiation and Protectants: A Case Study in Three Thymus Species. Horticulturae 2022, 8, 31. [Google Scholar] [CrossRef]
  5. Tohidi, B.; Rahimmalek, M.; Trindade, H. Review on essential oil, extracts composition, molecular and phytochemical properties of Thymus species in Iran. Ind. Crops Prod. 2019, 134, 89–99. [Google Scholar] [CrossRef]
  6. Christensen, L.P.; Grevsen, K. Effect of development stage at harvest on the composition and yield of essential oils from thyme and oregano. Dev. Food Sci. 2006, 43, 261–264. [Google Scholar]
  7. Abu-Darwish, M.S.; Alu’datt, M.H.; Al-Tawaha, A.R.; Ereifej, K.; Almajwal, A.; Odat, N.; Al Khateeb, W. Seasonal variation in essential oil yield and composition from Thymus vulgaris L. during different growth stages in the south of Jordan. Nat. Prod. Res. 2012, 26, 1310–1317. [Google Scholar] [CrossRef]
  8. Amiri, H.; Dousty, B.; Hosseinzedeh, S.R. Water stress-induced changes of morphological, physiological and essential oil compounds in Thymus eriocalyx from Iran. J. Essent. Oil-Bear. Plants. 2018, 21, 1210–1223. [Google Scholar] [CrossRef]
  9. Ahmadi-Majd, M.; Mousavi-Fard, S.; Rezaei Nejad, A.; Fanourakis, D. Carbon nanotubes in the holding solution stimulate flower opening and prolong vase life in carnation. Chem. Biol. Technol. Agric. 2022, 9, 15. [Google Scholar] [CrossRef]
  10. Ahmadi-Majd, M.; Rezaei Nejad, A.; Mousavi-Fard, S.; Fanourakis, D. Postharvest application of single, multi-walled carbon nanotubes and nanographene oxide improves rose keeping quality. J. Hortic. Sci. Biotechnol. 2021, 1–15. [Google Scholar] [CrossRef]
  11. Chen, Y.; Fanourakis, D.; Tsaniklidis, G.; Aliniaeifard, S.; Yang, Q.; Li, T. Low UVA intensity during cultivation improves the lettuce shelf-life, an effect that is not sustained at higher intensity. Postharvest Biol. Technol. 2021, 172, 111376. [Google Scholar] [CrossRef]
  12. Fanourakis, D.; Papadakis, V.M.; Psyllakis, E.; Tzanakakis, V.A.; Nektarios, P.A. The role of water relations and oxidative stress in the vase life response to prolonged storage: A case study in chrysanthemum. Agriculture 2022, 12, 185. [Google Scholar] [CrossRef]
  13. Fanourakis, D.; Kazakos, P.; Nektarios, P.A. Allometric individual leaf area estimation in chrysanthemum. Agronomy 2021, 11, 795. [Google Scholar] [CrossRef]
  14. Javadi Asayesh, E.; Aliniaeifard, S.; Askari, N.; Roozban, M.R.; Sobhani, M.; Tsaniklidis, G.; Woltering, E.J.; Fanourakis, D. Supplementary light with increased blue fraction accelerates emergence and improves development of the inflorescence in Aechmea, Guzmania and Vriesea. Horticulturae 2021, 7, 485. [Google Scholar] [CrossRef]
  15. Fanourakis, D.; Papadopoulou, E.; Valla, A.; Tzanakakis, V.A.; Nektarios, P.A. Partitioning of transpiration to cut flower organs and its mediating role on vase life response to dry handling: A case study in chrysanthemum. Postharvest Biol. Technol. 2021, 181, 111636. [Google Scholar] [CrossRef]
  16. Adams, R.P. Identification of Essential oil Components by Gas Chromatography/Mass Spectrometry, 4th ed.; Allured Publishing Corporation Carol Stream: Carol Stream, IL, USA, 2007. [Google Scholar]
  17. Seif, M.; Aliniaeifard, S.; Arab, M.; Mehrjerdi, M.Z.; Shomali, A.; Fanourakis, D.; Li, T.; Woltering, E. Monochromatic red light during plant growth decreases the size and improves the functionality of stomata in chrysanthemum. Funct. Plant Biol. 2021, 48, 515–528. [Google Scholar] [CrossRef]
  18. Taheri-Garavand, A.; Rezaei Nejad, A.; Fanourakis, D.; Fatahi, S.; Ahmadi-Majd, M. Employment of artificial neural networks for non-invasive estimation of leaf water status using color features: A case study in Spathiphyllum wallisii. Acta Physiol. Plant. 2021, 43, 78. [Google Scholar] [CrossRef]
  19. Lichtenthaler, H.K.; Wellburn, A.R. Determinations of total carotenoids and chlorophylls a and b of leaf extracts in different solvents. Biochem. Soc. Trans. 1983, 11, 591–592. [Google Scholar] [CrossRef] [Green Version]
  20. Bates, L.; Waldren, R.; Teare, I. Rapid determination of free proline for water-stress studies. Plant Soil 1973, 39, 205–207. [Google Scholar] [CrossRef]
  21. Narwal, S.S.; Bogatek, R.; Zagdanska, B.M.; Sampietro, D.A.; Vattuone, M.A. Plant Biochemistry; Studium Press LLC: Houston, TX, USA, 2009. [Google Scholar]
  22. Livak, K.J.; Schmittgen, T.D. Analysis of relative gene expression data using real-time quantitative PCR and the 2−ΔΔCT method. Methods 2001, 25, 402–408. [Google Scholar] [CrossRef]
  23. Bistgani, Z.E.; Hashemi, M.; DaCosta, M.; Craker, L.; Maggi, F.; Morshedloo, M.R. Effect of salinity stress on the physiological characteristics, phenolic compounds and antioxidant activity of Thymus vulgaris L. and Thymus daenensis Celak. Ind. Crops Prod. 2019, 135, 311–320. [Google Scholar] [CrossRef]
  24. Asghari, B.; Mafakheri, S.; Rejali, F. Assessment of morphological, physiological, and biochemical characteristics of thymus kotschyanus bioss. And hohen under different bio and chemical fertilizers. J. Agric. Sci. Technol. 2021, 23, 1309–1325. [Google Scholar]
  25. Moradi, P.; Ford-Lloyd, B.; Pritchard, J. Plant-water responses of different medicinal plant thyme (Thymus spp.) species to drought stress condition. Aust. J. Crop Sci. 2014, 8, 666. [Google Scholar]
  26. Ashrafi, M.; Azimi-Moqadam, M.-R.; MohseniFard, E.; Shekari, F.; Jafary, H.; Moradi, P.; Pucci, M.; Abate, G.; Mastinu, A. Physiological and Molecular Aspects of Two Thymus Species Differently Sensitive to Drought Stress. BioTech 2022, 11, 8. [Google Scholar] [CrossRef]
  27. Spinoni, J.; Barbosa, P.; Bucchignani, E.; Cassano, J.; Cavazos, T.; Christensen, J.H.; Christensen, O.B.; Coppola, E.; Evans, J.; Geyer, B.; et al. Future global meteorological drought hotspots: A study based on CORDEX data. J. Clim. 2020, 33, 3635–36561. [Google Scholar] [CrossRef]
  28. Turner, G.; Gershenzon, J.; Nielson, E.E.; Froehlich, J.E.; Croteau, R. Limonene synthase, the enzyme responsible for monoterpene biosynthesis in peppermint, is localized to leucoplasts of oil gland secretory cells. Plant Physiol. 1999, 120, 879–886. [Google Scholar] [CrossRef] [Green Version]
  29. Kowalski, R.; Kowalska, G.; Jankowska, M.; Nawrocka, A.; Kałwa, K.; Pankiewicz, U.; Włodarczyk-Stasiak, M. Secretory Structures and Essential Oil Composition of Selected Industrial Species of Lamiaceae. Acta Sci. Pol. Hortorum Cultus 2019, 18, 53–69. [Google Scholar] [CrossRef]
  30. Wiese, N.; Fischer, J.; Heidler, J.; Lewkowski, O.; Degenhardt, J.; Erler, S. The terpenes of leaves, pollen, and nectar of thyme (Thymus vulgaris) inhibit growth of bee disease-associated microbes. Sci. Rep. 2018, 8, 14634. [Google Scholar] [CrossRef] [Green Version]
  31. Seifikalhor, M.; Niknam, V.; Aliniaeifard, S.; Didaran, F.; Tsaniklidis, G.; Fanourakis, D.; Teymoorzadeh, M.; Mousavi, S.H.; Bustachi, M.; Li, T. The regulatory role of γ-Aminobutyric acid in chickpea plants depends on drought tolerance and water scarcity level. Sci. Rep. 2022, in press. [Google Scholar] [CrossRef]
  32. Safari, M.; Mousavi-Fard, S.; Rezaei Nejad, A.; Sorkheh, K.; Sofo, A. Exogenous salicylic acid positively affects morpho-physiological and molecular responses of Impatiens walleriana plants grown under drought stress. Int. J. Environ. Sci. Technol. 2022, 19, 969–984. [Google Scholar] [CrossRef]
  33. Bijalwan, P.; Sharma, M.; Kaushik, P. Review of the Effects of Drought Stress on Plants: A Systematic Approach. Preprints 2022, 2022020014. [Google Scholar] [CrossRef]
Figure 1. Heatmap of standardized values indicating percentages of essential oil components across treatments. The effect of irrigation regime (75 or 50% of field capacity) on essential oil composition of two Thymus species (T. armeniacus, T. kotschyanus) was investigated at two developmental stages (50 and 100% blooming). Essential oil composition is presented in Table 5. Color may indicate up- or downregulation (green and red, respectively). A scale of intensity is provided.
Agronomy 12 01008 g001
Figure 2. Principal Component Analysis (PCA) biplot depicting Principal Components (PC) scores of Thymus species and treatments (dots) and loadings of vector variables. The contribution of each morphological trait (data in Table 1, Table 2, Table 3 and Table 4) in the two dimensions is indicated by a gradient scale and colour intensity (legend). Vectors near the plot center have lower cos2 values. Larger dots indicate mean values calculated from three discrete biological replications.
Agronomy 12 01008 g002
Figure 3. Heatmap of standardized values indicating physiological trait regulation across treatments. The effect of irrigation regime (75 or 50% of field capacity) on several physiological traits (data in Table 6) of two Thymus species (T. armeniacus, T. kotschyanus) was investigated at two developmental stages (50 and 100% blooming). Color may indicate up- or downregulation (green and red, respectively). A scale of intensity is provided.
Agronomy 12 01008 g003
Figure 4. Heat map of relative transcript accumulation (log2) of the terpene biosynthetic pathway across treatments. The effect of irrigation regime (75 or 50% of field capacity) on relative mRNA abundance of two Thymus species (T. armeniacus, T. kotschyanus) was investigated at two developmental stages (50 and 100% blooming). This was assessed using real-time RT-qPCR and three distinct biological repeats. Color may indicate up- or down regulation (green and red, respectively). A scale of intensity is provided.
Agronomy 12 01008 g004
Table 1. Effect of irrigation regime on time to flowering (initiation, 50 and 100%) and two key inflorescence characteristics of two Thymus species. The latter was evaluated at 100% flowering. Within each column, different letters indicate significant differences (n = 3).
SpeciesIrrigation (% of Field Capacity)Time (d)Inflorescence Length (cm)Number of Flowers per Inflorescence
Onset of Flowering50% Flowering100% Flowering
T. armeniacus7549.3 c63.0 c120.3 a2.31 b50.22 c
5047.7 c66.3 c113.0 b1.64 c33.84 d
T. kotschyanus7579.3 b88.0 b114.7 ab4.41 a76.78 a
5088.0 a96.0 a108.7 b2.34 b63.07 b
Table 2. Effect of irrigation regime on plant and individual leaf dimensions of two Thymus species. Assessments were conducted at 100% flowering. Within each column, different letters indicate significant differences (n = 3).
SpeciesIrrigation (% of Field Capacity) PlantCanopy Area (cm2)Individual Leaf
Height (cm)Length (cm)Width (cm)Length (mm)Width (mm)Area (mm2)
T. armeniacus7514.6 bc35.3 a31.0 a858 a12.9 b5.64 a47.4 b
5013.1 c28.8 bc28.3 ab640 b11.2 c4.89 b41.9 c
T. kotschyanus7520.3 a31.3 b27.3 b670 c18. 5 a4.71 b57.1 a
5015.9 b28.02 c29.0 ab637 d14.0 b3.74 c38.1 c
Table 3. Effect of irrigation regime on plant (fresh and dry) weight, economic yield (dry mass of leaves and flowers) and harvest index ( economic   yield plant   dry   weight × 100 % ) of two Thymus species. Assessments were conducted at 100% flowering. Within each column, different letters indicate significant differences (n = 3).
SpeciesIrrigation (% of Field Capacity)Plant Harvest Index (%)
Fresh Weight (g)Dry Weight (g)Economic Yield (g)
T. armeniacus75116.93 a42.37 a34.1 a81.97 a
5083.78 b32.2 b23.71 b76.63 b
T. kotschyanus7555.26 c21.73 c15.313 c71.71 c
5042.81 d16.413 d12.167 c63.99 d
Table 4. Effect of irrigation regime on essential oil content and yield, as well as on leaf trichome density of two Thymus species. Assessments were conducted at 100% flowering. Within each column, different letters indicate significant differences (n = 3).
SpeciesIrrigation (% of Field Capacity)Essential Oil Content (%)Essential Oil Yield (g)AdaxialAbaxialLeaf (Adaxial + Abaxial)
Trichome Density (mm−2)
T. armeniacus751.180 c0.3870 a4.75 c5.640 c10.38 c
501.164 c0.2689 b18.1 a12.74 a30.84 a
T. kotschyanus752.353 a0.3420 a8.88 b10.32 b19.2 b
501.988 b0.2578 b10.0 b11.65 ab21.67 b
Table 5. Effect of irrigation regime on essential oil composition of two Thymus species at two developmental stages (50 and 100% blooming). Within each column, different letters indicate significant differences (n = 3). Retention indices (RI) were generated with a standard solution of n-alkanes (C6–C24) on the HP-5MS column. nd—no difference. The full range of documented compounds is provided in Supplementary Table S2.
CompoundRIT. armeniacusT. kotschyanus
75% Field Capacity 50% Field Capacity75% Field Capacity50% Field Capacity
50% Flowering100% Flowering50% Flowering100% Flowering50% Flowering100% Flowering50% Flowering100% Flowering
α-Thujene9285.76 e0.903 f0 g0 g9.35 d11.337 c12.893 a12.34 b
Camphene9343.62 d8.12 a3.13 e1.34 g7.19 b2.82 f1.307 g4.883 c
α-Pinene93412.987 b12.157 c15.42 a15.78 a0 d0 d0 d0 d
β-pinene9672.26 b0 c0 c0 c0 c0 c5.623 a0 c
Sabinene9714.4067 d6.42 c12.43 a6.873 b2.347 f2.137 f3.71 e4.06 de
Myrcene9886.1 d8.483 ab8.34 ab8.623 a8.13 b7.22 c0 e5.73 d
α-Terpinene10184.63667 c3.53 d0 f2.623 e0 f7.1 b7.797 a0 f
p-Cymene103412.067 e13.507 d16.56 b6.703 f17.783 a16.63 b4.187 g15.267 c
1,8-Cineole103712.53 a0 b0 b0 b0 b0 b0 b0 b
γ-Terpinene107323.583 b16.65 h19.21 f19.84 e21.93 c20.74 d28.11 a17.69 g
linalool11050 d0.28 c0.187 c0.29 c1.463 a1.1 b1.213 b1.347 a
Borneol11680.87 f2.78 a1.847 d2.54 ab1.927 d1.48 e2.067 cd2.37 bc
Carvacrol methyl ether12480.88 c2.417 a2.187 b2.153 b0000
Thymol12980.11 f0.577 de0.32 ef0.66 d11.41 c15.66 a14.337 b15.73 a
Carvacrol13130.827 d11.483 a7.657 b11.34 a1.45 c1.653 c1.52 c1.78 c
β-Caryophyllene14292.31333 f5.22 d3.803 e6.693 c8.917 a6.52 c8.3 b8.193 b
Germacrene D1484nd0.923 b0.48 c1.197 a0 d0 d0 d0 d
Table 6. The effect of irrigation regime on the content of chlorophyll, carotenoids, total phenolics, proline, malondialdehyde (MDA), and hydrogen peroxide (H2O2), as well as on relative water content and five antioxidant enzymes activity of two Thymus species at two developmental stages (50 and 100% blooming). Within each column, different letters indicate significant differences (n = 3). APX, ascorbate peroxidase; AsA, ascorbic acid; CAT, catalase; dw, dry weight; fw, fresh weight; GAE, gallic acid equivalent; POX, guaiacol peroxidase; PPO, polyphenol oxidase; SOD, superoxide dismutase; U, unit.
TraitT. armeniacusT. kotschyanus
75% Field Capacity50% Field Capacity75% Field Capacity50% Field Capacity
50% Flowering100% Flowering50% Flowering100% Flowering50% Flowering100% Flowering50% Flowering100% Flowering
Chlorophyll content
(mg g−1 FW)
a0.261 b0.31 a0.22 c0.23 c0.278 b0.28 b0.226 c0.269 b
b0.09 abc0.099 a0.082 bc0.086 abc0.086 bc0.094 ab0.058 d0.078 c
total0.351 c0.409 a0.302 de0.316 d0.364 bc0.374 b0.285 e0.348 c
Non-enzymaticCarotenoid content (mg g−1 FW)2.611 c3.444 a1.596 e2.611 c2.55 c3.085 ab2.171 d2.769 bc
Total phenol content (mg GAE g−1 DW)-31.422 b-26.513 c-34.718 a-31.108 b
Relative water content (%)74.97 b68.794 c66.394 c55.621 d76.681 b83.144 a74.467 b57.048 d
OsmoliteProline content (μmol g−1 FW)0.515 cd0.378 d0.839 bcd6.9 a0.921 bc0.491 cd1.156 b7.088 a
MDA content (nmol g−1 FW)10.938 f12.874 e12.018 ef18.707 b12.565 e16.355 c14.598 d22.323 a
H2O2 content (nmol g−1 FW)478.57 d587.52 c663.09 b1154.65 a422.8 e350.25 f702.41 b677.79 b
EnzymaticAPX activity (μmol AsA min−1 mg−1 protein)0.4641 de0.3968 e0.5707 cd0.6533 bc0.7366 b0.4886 de0.9265 a0.6066 c
CAT activity (μmol H2O2 min−1 mg−1 protein)5.446 f6.576 de9.805 a8.43 b7.105 cd6.23 e7.901 b7.735 bc
POX activity (U mg−1 protein min−1)34.561 c35.915 c86.375 b163.423 a35.928 c33.459 c94.706 b92.627 b
PPO activity (U mg−1 protein min−1)0.556 e0.666 d0.882 b0.974 ab0.771 c0.678 cd0.962 ab0.988 a
SOD activity (U mg−1 protein min−1)11.9416 b6.553 d13.987 a9.941 c7.797 d7.663 d9.975 c10.350 c
Publisher’s Note: MDPI stays neutral with regard to jurisdictional claims in published maps and institutional affiliations.

