Abstract
Vitamin A deficiency (VAD) is a public health issue worldwide. Provitamin A (PVA) biofortified maize serves as an alternative to help combat VAD. Breeding efforts to develop maize varieties with high PVA carotenoid content combine molecular and phenotypic selection strategies. The phenotypic assessment of carotenoids is currently done using liquid chromatography, a precise but time- and resource-consuming methodology. Using near-infrared spectroscopy (NIRS) could increase the breeding efficiency. This study used ultra-performance liquid chromatography (UPLC) data from 1857 tropical maize genotypes as a training set and NIRS data to do an independent test of a set of 650 genotypes to predict PVA carotenoids using Bayesian and modified partial least square (MPLS) regression models. Both regression methods produced similar prediction accuracies for the total carotenoids (r2 = 0.75), lutein (r2 = 0.55), zeaxanthin (r 2= 0.61), β-carotene (r2 = 0.22) and β-cryptoxanthin (BCX) (r2 = 0.57). These results demonstrate that Bayesian and MPLS regression of BCX on NIRS data can be used to predict BCX content, the current focus on PVA enhancement, and thus offers opportunities for high-throughput phenotyping at a low cost, especially in the early stages of PVA maize breeding pipeline when many genotypes must be screened.
1. Introduction
Vitamin A deficiency (VAD) remains a public health problem in many low- and middle-income countries. Although the global prevalence of VAD in children under the age of 5 years has declined from approximately 39% to 30% over the past two decades, little progress has been made in South Asia and sub-Saharan Africa, where VAD still affects 44 and 48% of children under 5 years, respectively [1].
Provitamin A (PVA) carotenoids, (e.g., β-cryptoxanthin, α- and β-carotene) are the precursors of vitamin A, which is an essential nutrient for different systems of the human body that helps prevent morbidity, mortality from infections, and childhood blindness [2]. These carotenoids are found in many vegetables, fruits, and, albeit in lower concentrations, in yellow maize. In addition to PVA carotenoids, lutein, and zeaxanthin are the predominant carotenoids in yellow maize [3,4].
The analysis and quantification of carotenoids can be challenging due to the large number of naturally occurring carotenoids, the susceptibility of these compounds to degradation, and the wide range of concentrations of carotenoids and their various isomers found in nature [5]. Several methods have been considered in search of a fast, accurate, and cheap assay to screen PVA content in maize grain to support PVA maize breeding programs. Some of the proposed methods have included visual color scoring, the use of colorimetry, and liquid chromatography [6,7]. Currently, PVA maize breeding pipelines rely mainly on lab wet chemical techniques based on liquid chromatography and DNA markers to select for PVA carotenoids [7,8]. However, due to logistical and technical reasons, DNA markers may not be a practical option for small breeding programs in develloping countries. Still, even when DNA markers are used, validation of PVA content with accurate phenotypic data is necessary.
Ultra-performance liquid chromatography (UPLC) has been an effective method for generating high-quality PVA data for maize biofortification programs. However, it can be laborious, expensive, and generates chemical waste [7,9]. Given the chemical structure and characteristics of the different carotenoids present in maize, visual color determination and colorimetric tests may help selection in the early stages, but they fail to precisely discriminate among provitamin A carotenoids. Further, visual color scoring has low throughput and can be subjective [6,7,10].
Recently, researchers have used low-cost non-destructive tools such as near-infrared spectroscopy (NIRS) and nuclear magnetic resonance as a high-throughput phenotype for predicting grain yield and other end quality traits in various crop species [11,12]. NIRS is considered a high-throughput phenotyping tool and is especially suited to the needs of maize breeding programs because the equipment can be installed on research plot combiners and information on quality traits and routine yield data can be obtained simultaneously [9,13,14]. It is fast, simple, and, in some cases, it can be non-destructive; it also allows for measuring different compounds at the same time. NIRS covers the range from 780 nm to 2500 nm of the electromagnetic spectrum, and thus it measures the interactions between electromagnetic radiation and vibrational properties of chemical bonds [13,15]. For maize breeding programs, NIRS has been successfully used to screen for protein, oil, starch, kernel density, anthocyanins, tryptophan, lysine, and popping capacity, among many other traits [14,16,17,18,19].
Different mathematical methods have been applied to NIRS spectral data to make predictions on other samples where the response variables were not measured. Partial least squares (PLS) is a useful multivariate method, it can analyze data with strong collinearity (correlated), noise, and several X- and Y-variables [20]. The PLS method is a practical approach for cases where the number of predictors is larger than the number of observations and has demonstrated better performance than principal component regression. The PLS approach was originally developed by World-systems analysis and for predicting chemical variables from spectral data [21,22], where the number of variables is larger than the number of observations and there is high collinearity among variables. Details of the PLS theory and its similarities with principal components regression and stepwise multiple linear regression are described by Aastveit and Martens [23].
Rincent et al. [12] used high-throughput phenotyping for wheat lines and a tree species (poplar) irradiated with infrared measured absorbance from 400 to 2500 nm. Using the NIR wavelength data analyzed as NIR Best Linear Unbiased Predictor (NIR BLUP) (NIR similarity matrix) in grains and leaves, the authors obtained better prediction accuracy than using GBLUP (genomic similarity matrix). Hayes et al. [11] used a multi-trait approach incorporating NIR and nuclear magnetic resonance information to the genomic models for end-use quality traits in wheat. The authors found that genomic predictions ranged from 0.00–0.47, whereas after adding information using NIR and nuclear magnetic resonance, prediction accuracy increased from 0.00 to 0.69.
Cuevas et al. [24] used a wheat dataset including NIR, genomic information, and pedigree information. Results from the Bayesian NIR linear regression model (NB) showed that NIR wavelength alone achieved less prediction accuracy than the genomic information alone. Interestingly, pedigree + NIR information achieved slightly lower prediction accuracy than genomic information + NIR. For fitting the models and making predictions, Cuevas et al. [24] used the BGGE function from the library of the same name [25].
The main objectives of this study were to: (1) investigate whether NIR can be used to predict carotenoid content in maize grain samples, and (2) compare the prediction accuracies for two regression models: Bayesian and PLS. We used data from 1857 samples as a training set to predict carotenoid content in an independent set of 650 maize samples.
2. Materials and Methods
2.1. Maize Samples and Sample Preparation
The grain samples used in this study were obtained from the PVA maize breeding program at the International Maize and Wheat Improvement Center (CIMMYT) and included samples from 5 growing seasons (2018 to 2019) and environments in Mexico and Zimbabwe, as well as from different crop management conditions. We used 3 groups of datasets. Group 1 included 1857 cultivars that were used to develop the NIRS calibrations and as training sets and fitting the Bayesian model. Group 2 included 390 cultivars that were used for prediction, and group 3 included 650 cultivars used for prediction or as independent validation. Out of those 650 cultivars, only 260 were completely new, since the remaining 390 were the ones included in group 2. See Data Availability Statement.
A total of 50–100 kernels per sample were milled using a cyclotec mill (FOSS Tecator 1093) with a 0.5 mm sieve. A sub-sample of the obtained flour was used for chemical carotenoid analysis by UPLC and the remnant flour was stored at −80 °C in paper envelopes until they were scanned to obtain the NIRS spectra. Moisture content in each sample was between 8–10%.
2.2. Chemicals and Reagents
All chemicals used for UPLC analyses were HPLC-grade and purchased from Millipore-Sigma. Ultrapure water was used for UPLC and carotenoid extraction. The standards for β-carotene (BC) were purchased from Millipore-Sigma, while those for lutein (LUT), zeaxanthin (ZEA), and β-cryptoxanthin (BCX) were purchased from Carotenature.
2.3. Carotenoid Analysis
Carotenoid extraction and quantification were performed as described by Palacios-Rojas [26]. Briefly, 600-mg samples (fine powder of maize kernels) in 6 mL of ethanol (with 0.1% butylated hydroxytoluene) underwent 5 min precipitation in an 85 °C water bath before being subjected to 10 min saponification with 500 μL of 80% (w/v) KOH in water. After saponification, samples were immediately placed in ice to which 3 mL of cold deionized water was added. Two hundred microliters of the internal standard (β-apo-8′-carotenal) were added, and samples were vortexed. Carotenoids were extracted three times with 3 mL of hexane by centrifugation at 800 g, and the hexane fraction was extracted. The combined extracted hexane layers were dried under nitrogen and reconstituted in 500 μL of 50:50 methanol:dichloroethane (v/v). All carotenoid extraction procedures and analyses were conducted under yellow light. Two microliters of the sample were injected into Acquity UPLC Water equipment. Separation was performed using an Acquity UPLC BEH C18 1.7 μm, 2.1 × 100 mm column, and an Acquity column in-line filter. LUT, ZEA, BCX, and BC were identified based on their characteristic spectra and by comparing their retention times with known standard solutions. 9-cis-β-Carotene (9-cis-BC) and 13-cis-β-carotene (13-cis-BC) were identified and quantified based on BC standards. PVA was computed as all-trans-BC + (1/2) (13-cis-BC) + (1/2) (9-cis-BC) + (1/2) (BCX). Total carotenoids (TC) were computed as all-trans-BC + 9-cis-BC + 13-cis-BC + LUT + ZEA + BCX.
2.4. NIRS Analysis
The milled material (2–3 g per sample) was scanned by NIRS monochromator model FOSS 6500 (FOSS NIRSystem, Inc., Silver Spring, MD, USA) using small ring cups (internal diameter of 35 mm and depth of 8 mm). Spectra of the samples were collected between 400 and 2500 nm at 2 nm intervals, and each spectrum consisted of 32 scans, which were automatically averaged and saved as absorbance intensity [log (1/R)].
2.5. NIRS Equations
All mathematical procedures on the spectral information and calibration development using PLS were performed with WinISI III software from Infrasoft International (FOSS NIRSystems, Inc., Silver Spring, MD, USA). The Bayesian NIR linear regression model was implemented using R codes [27] (see Appendix A).
2.6. Partial Least Square Models Using WinISI III Software
The main purpose of PLS modeling is to decompose both the design matrix predictor (X) and matrix of response (Y) as and where and are projection matrices of and scores and and are orthogonal loading matrices. The method will produce the PLS regression estimates for the response predicted value. In this research, the coefficients of PLS regression were generated with dataset 1 by using the WinISI III software (FOSS NIRSystems, Inc., Silver Spring, MD, USA).
Prior to the PLS regression, spectra were pretreated by applying a first-derivative transformation defined by 1,4,4,1 for ZEA, BCX, 13-cis-BC, BC, PVA, and TC, and 2,4,4,1 for LUT and 9-cis-BC, where the first number is the degree of the derivative, the second number is the gap between data points for subtraction, and the third and fourth numbers are the data points used for smoothing. This mathematical pretreatment of the spectral data eliminates the background of constant correlation due to any existing correlation between carotenoid content and particle size [28].
The results of the prediction calculations were monitored by checking the t outliers with t > 2.5; the global neighborhood distances (GH) values which are used to determine outliers or samples with unique characteristics; and the X outliers (not the usual spectral data) >10; samples with t > 2.5 were deleted from the sample file. Between 3.61 and 4.79% of the samples were left out for each carotenoid.
The standard deviation (SD) between NIRS and reference determinations for the calibration [the standard error of calibration (SEC)] and validation sets [the standard error of prediction (SEP)] were calculated. We also calculated the coefficient of determination of calibration (R2c) and the coefficient of determination of validation (R2v) (the fraction of the variance of the reference values explained by the variance of NIRS determinations) [29].
The ratio of standard deviation (RPD) was calculated as the ratio between the SD of the reference value and the standard error of cross-validation (SECV). RPD is indicative of the usefulness of the NIRS calibrations. If this ratio exceeds a value of 3, the prediction accuracy of the calibration equation is higher compared to ratio values lower than 2. In addition, we determined the ratio between the SD and the SEP of each trait because the quality and robustness of a NIRS calibration can also be judged by the SEP and SD/ SEP [19]; an SD/SEP ratio lower than 2 indicates unsuitable calibrations, while ratios between 2 and 3, 3 and 5, and 5 and 10 indicate calibrations with limited, satisfactory, and good quality, respectively. Caution is required when interpreting the SD/SEP ratio because it depends strongly on the distribution and number of reference values. Therefore, the SD/SEP ratio cannot be regarded as the ultimate criterion for prediction quality. However, in combination with SEP, the SD/SEP ratio is helpful for judging the predicted values and may prevent erroneous conclusions concerning the real quality of a calibration model [29].
2.7. Bayesian NIR Linear Regression Model
The Bayesian regression model is represented by:
where the response vector representing the values of PVA measured in n maize genotypes is explained by an overall mean plus a random vector related to the NIR data and a random error .
The component that explains the variation in PVA due to NIR comprises the incidence matrix that joins the NIR to the observations of PVA of the maize genotypes; also, is a random vector with normal distribution ), where the variance-covariance is a positive semidefinite matrix previously constructed with the NIR data. In addition, is the vector of random errors with normal distribution with mean zero and constant variance For simplicity, we denote matrix as the matrix of the first or second derivative of the NIRs. Thus, models the relationships between the NIRs and is a function of , and when models the linear relationship between NIRs, it could be named NIRS BLUP (NB) and is computed as , where represents the number of columns of and the NB establishes the NIR similarity between maize lines, that is, how each cultivar is related to the others based on the electromagnetic spectrum.
With the first and second derivatives of the NIR, we formed matrices NIR BLUP, NB1, and NB2, respectively, for the linear NIRs relationship. For the first and second derivatives of the matrix of NIRs, we used the Savitzky Golay function from the prospectr package [30] in R software (R Core Team, 2021). For fitting the models and making predictions, we used the BGGE function from the BGGE library [25]. As mentioned in Granato et al., 2018, the BGGE is an algorithm constructed to fit models within a Bayesian framework that uses the Gibbs sampler for the Monte Carlo Markov Chain (MCMC), which allows convergence to a posterior predictive distribution that provides the predictive values. The R codes used to analyze the data can be found in the Appendix A.
The model was fit to the training dataset of 1857 genotypes and 1050 NIRS data ranging in wavelength from 400 nm to 2498 nm (see Table 1). Therefore, the training dataset was a matrix of order 1857 × 1050. The software ‘prospectr’ [30] was used to compute the first and second derivative of the NIRs (X) using the Savitzky–Golay method, to better the noise from the NIR evaluation process.

Table 1.
Average Pearson predictive correlation PVA, BCX, and BC. Standard deviations (in parentheses). Methods representing the NB = NIR BLUP for NIR1 and NIR2.
To evaluate the model with dataset of group 1 (1857 cultivars), we formed 50 random partitions, and in each partition, we randomly selected 70% of the data to form the training set and 30% of the data for the testing set. Additionally, we formed 50 random partitions, and, in each one, we randomly selected 60% of the data to form the training set and 40% of the data for the testing set. For both random partitions, we computed the Pearson correlations between the observed values versus the predicted ones. The average Pearson correlation across all partitions and their associated standard deviations are presented in Table 1.
We performed the prediction of the 650 cultivars of group 3 (testing set) using as the training set the 1857 cultivars from group 1. The prediction accuracy (correlation between observed and predictive values) for each trait can be observed on the last column of Table 2. The second validation was performed forming 50 random samples where for each sample the training set is formed with 1857 cultivars from dataset group 1 and 8 (2%) randomly selected cultivars from group 2. Thus, the testing set comprises the 382 remaining cultivars from group 2 (382). Results of this validation are presented in the last column of Table 1.
Table 2.
Reference values and external validations statistics of the NIRS calibrations for carotenoid contents in maize using Bayesian NIR linear regression and MPLS methods. A total of 1857 maize lines were used as training (TRN) and 650 maize lines were used as testing (TST) (unobserved).
3. Results
3.1. Carotenoid Concentration in Maize Kernels
The summary statistics for each carotenoid of all the genotypes used in the calibration of the models are shown in Table 3. A wide range was observed for all carotenoids, which was expected due to the genotypic differences and environmental effects resulting from the use of samples from different environments. As expected, ZEA and LUT were the predominant carotenoids (about 42.7% of the TC; with values up to 29.06 and 10.88 mg kg−1, respectively). Some high levels of BC were also observed (values up to 20.93 mg kg−1, 25.2% of the TC). BCX values up to 19.16 mg kg−1 (18.59% of the TC) were found in this germplasm, most likely due to recent breeding efforts to increase BCX in the PVA biofortified germplasm at CIMMYT. Breeding for increased BCX is justified by the increasing evidence indicating that BCX is more stable and bioaccessible than BC [31,32,33,34]. Thus, the BCX concentration in this set of samples is higher compared to other reports in temperate and tropical germplasm [32,35,36]. The data ranges for BC and PVA content are similar to those previously reported in maize [3,36]. A wide range of variation in the carotenoid content ensures that NIR calibration models are robust. When the PVA breeding program was started, variation for PVA carotenoids was limited, and, as a result, many attempts to develop NIR models were not successful [3].
Table 3.
Reference values for NIRS calibration, and cross-validation statistics in the calibration set of the maize lines.
As expected, high and positive correlation coefficients between 13-cis-BC, BC, and 9-cis-BC with PVA were observed, because these parameters are used to calculate PVA carotenoids (Table 4). LUT and ZEA contents are correlated with each other (R2 = 0.89) and they are also highly correlated with total carotenoids (TC) (R2 = 0.614 and 0.719, respectively); this is because LUT and ZEA are the two major carotenoid compounds present in maize. Similar correlations were reported by Sutko et al. [37] between LUT and ZEA with TC (r = 0.69 and 0.81, respectively). BC did not significantly relate to TC (R2 = 0.189), possibly because it is an intermediate compound in the carotenoid biosynthesis pathway, whereas LUT and ZEA are final products [37,38].
Table 4.
Correlation coefficients between concentrations of individual carotenoid fractions in maize (N = 1857) samples determined by Ultra performance liquid chromatography (UPLC).
3.2. Partial Least Squares PVA NIRS Models Using WinISI III Software
NIRS calibration equations had high coefficients of determination (R2C = 0.70–0.93) and slightly lower coefficients of determination for cross-validations (R2Cv = 0.65–0.93) (Table 3), indicating that the calibrations were homogeneous. Based on the RPD values (above 1.5), all calibrations can provide meaningful estimates of each carotenoid [13,19] and therefore they can be very useful for PVA biofortification breeding programs.
The results of the independent validation for the different carotenoids, including standard errors of prediction (SEP) and R2 values for each trait, are summarized in Table 2. The SEP obtained in the validation were lower than their respective SD, indicating that NIRS models can predict carotenoid content in maize flour [28]. In addition, the SD/SEP ratio for all calibrations was between 2.52–5.88 (Table 2), suggesting that the calibrations were of good quality. However, the coefficients of determination were low for BC, 9-cis-BC, 13-cis-BC, and PVA (R2v = 0.12–0.22) and moderate to high for BCX, ZEA, LUT, and TC (R2v = 0.55–0.75). According to Martínez-Valdivieso et al. [28], R2 values above 0.50 would indicate that over 50% of the variation in predicted values (carotenoid content) would be attributable to variation in NIRS data, allowing for discrimination between genotypes with high carotenoid concentration and genotypes with low carotenoid concentration. Previous studies have shown that models with an R2 of 0.60–0.82 can be used for screening and approximate quantitative carotenoid predictions [13,28].
Pearson’s correlations were calculated between observed and predicted values, and for BCX, ZEA, LUT, and TC they were between 0.74 and 0.87. The data suggest that these carotenoids could be adequately predicted with NIR spectroscopy data.
3.3. NIRS Using Statistical Bayesian Linear Regression Model with R
The package R BGGE [25] with 30,000 iterations was used for fitting the model in Equation (1). First, we fitted dataset 1 with 1857 maize samples (without discriminating for outliers). In addition to predicting all 650 maize lines (TST) using all the training sets of 1857 maize lines (TRN) (as shown in Table 2), we performed a random cross-validations study considering dataset 1, dataset 2, and both (as explained above). The results of the Bayesian prediction models are shown in Table 1. Using NIR1 BLUP, the correlation between the fitted values and the observed values for PVA was 0.91, whereas this correlation when using NIR2 BLUP was 0.90; both results are like those obtained with PLS.
Table 1 shows results for PVA, BCX, and BC from the random cross-validation of dataset 1 considering 50 random samples each with a sample size of 70% for training (TRN) and sample size of 30% for testing (TST). The mean NIR1 BLUP prediction accuracy for 50 random samples (70% training and 30% testing) measured by the correlations between the observed and the predicted values was 0.88 and 0.834 for PVA and BCX, respectively, and 0.87, 0.825, and 0.825 for NIR2. Furthermore, when 50 random samples (60% training and 40% testing) were taken from the data training dataset of the 1847 genotypes for PVA, but with a TRN set of 60% and a TST set of 40%, the mean correlation between the observed and predicted values was 0.878 for NIR1 and 0.865 for NIR2. For BCX, the mean correlation was 0.829 and 0.821 for NIR1 and NIR2, respectively.
The NIR prediction accuracy for 10 random samples using as TRN all data from dataset 1 (1857 maize lines) plus 8 randomly selected from the 392 maize lines (from dataset 2), with the rest of the 384 lines from dataset 2 comprising the TST, is also included in Table 1. The PVA mean correlations between the observed and the predicted value were 0.38 for NIR1 BLUP versus 0.32 for NIR2 BLUP. For BCX, the predicted value was 0.753 and 0.754 for NIR1 BLUP and NIR2 BLUP, respectively. Based on these results, the rest of the analyses were done using the NIR1 model.
For BC, the accuracy of the NIR predictions NIR accuracy was very similar to those obtained for BCX except for the last case of NIR prediction using 10 random samples where the mean correlations between the observed and the predicted value were 0.395 and 0.326 for NIR1 BLUP and NIR2 BLUP, respectively.
3.4. Comparison of Bayesian and Least Squares Linear Regression Models
The correlations between observed and predicted values for both MPLS and Bayesian NIR linear regression models are shown in Table 2. The differences between R2 and Pearson correlation coefficients are because the WinISI software discarded outliers, whereas the codes used for fitting the Bayesian NIR linear regression used all the data. In general, the MPLS gave a slight increase in prediction accuracy when predicting the traits of the 650 lines as compared to the results obtained by the Bayesian NIR linear regression.
4. Discussion
In a previous study, Brenna and Berardo [39] developed PLS predictions models by NIRS, for LUT, ZEA, BCX, BC, and TC content using 61 varieties of Italian yellow maize (82 samples for calibration and cross-validation and 40 samples to test the goodness of fit of the developed equations). They obtained high values for both R2C (0.82–0.97) and R2v (0.64–0.95). As the first step in our efforts to apply NIR in the breeding program for PVA biofortified maize, the reported parameters and models were used in tropical germplasm. Although the R2C values for LUT, ZEA, BCX, BC and TC were between 0.68 and 0.9, the R2v were lower: LUT (0.44), ZEA (0.5), BCX (0.48), BC (0.06) and TC (0.73). Thus, we tested alternative parameters and models and obtained higher R2v (Table 2) than when using the parameters described by Brenna and Berardo [37]. The poor fit of the Brenna and Berardo NIR models to the tropical germplasm dataset used in this study could be, as they pointed out, due to scarce genetic and agronomic diversity in the sample set used to develop the models. In this study, we used grain samples from a diverse set of tropical PVA genotypes from varying agronomic management practices, over 2 years. In contrast, Brenna and Berardo [39] used 61 Italian maize genotypes with narrow variation for BC (0–2.8 mg kg−1) and BCX (0–6.1 mg kg−1), compared to the ranges in the PVA samples used in this study (BC, 0.09–20.93 mg kg−1 and BCX, 0.04–19.16 mg kg−1). It is also worth noting that the percentage of outliers eliminated to calibrate in Brenna and Berardo [39] was 10 to 22%, except for LUT (1.3%), while in this research the percentage of eliminated outliers was between 3.61 and 4.79%.
Recently, Kahrıman et al. [40] developed NIRS models for carotenoid content in yellow maize using 250 samples of landraces and breeding material improved for higher total carotenoid content (200 samples for calibration and 50 samples for validation). However, the R2v for both PVA carotenoids was low (0.233 for BC and 0.161 for BCX). Differences in the scanning interval (1200–2400 nm), and the range of concentrations for TC, BC, BCX, and ZEA could explain the differences in the results obtained in this study.
Similar R2v values obtained for LUT (0.55), ZEA (0.61) and BCX (0.57) were reported for LUT, violaxanthin and BC in potato flour (0.60) and for LUT in banana flour (0.56) [41,42]. For potatoes, Bonierbale et al. [42] indicated that the developed calibrations can be used at least to differentiate samples with high, medium, and low concentrations of carotenoids. On the other hand, Davey et al. [41] mentioned that their model was unsuitable for measuring lutein content, but this was because the RPD value was <1.5.
As mentioned above, for PVA breeding purposes, currently the focus is on the selection of high BCX germplasm. Using the PLS NIR model described here and selecting the top 20% BCX values resulted in the selection of more than 75% of the high BCX values according to the reference method. Such percentages increase to more than 87% if only the top 10% BCX values are selected. Thus, the prediction model can increase the efficiency and throughput of phenotypic selection in the breeding program.
To meet current and future maize and other crops production challenges there is a need to increase breeding efficiency. Advances in high-throughput genotyping are providing fast and inexpensive genomic information. However, molecular breeding strategies, such as marker-assisted recurrent selection (MARS) and genomic selection still require phenotypic data [43]. Maize breeding programs focused on increasing carotenoid content around the world require robust, fast, and inexpensive methods to screen large numbers of genotypes. Liquid chromatography (HPLC or UPLC) can accurately identify and quantify carotenoids. However, this technique is slow, labor-intensive, and expensive [6,19,39]. In comparison to NIRS methodology, UPLC requires extensive sample preparation, long analysis time (24 to 26 h per sample, compared to 7 to 10 min by NIR per sample), experienced technicians, and expensive equipment and chemical reagents. NIRS offers a fast and simple screening option, with the capability to measure multiple traits at the same time. Based on estimates of our laboratory costs, the NIR analysis cost is approximately 10 times cheaper (US 4.8 per sample) compared with US 48 per sample by UPLC.
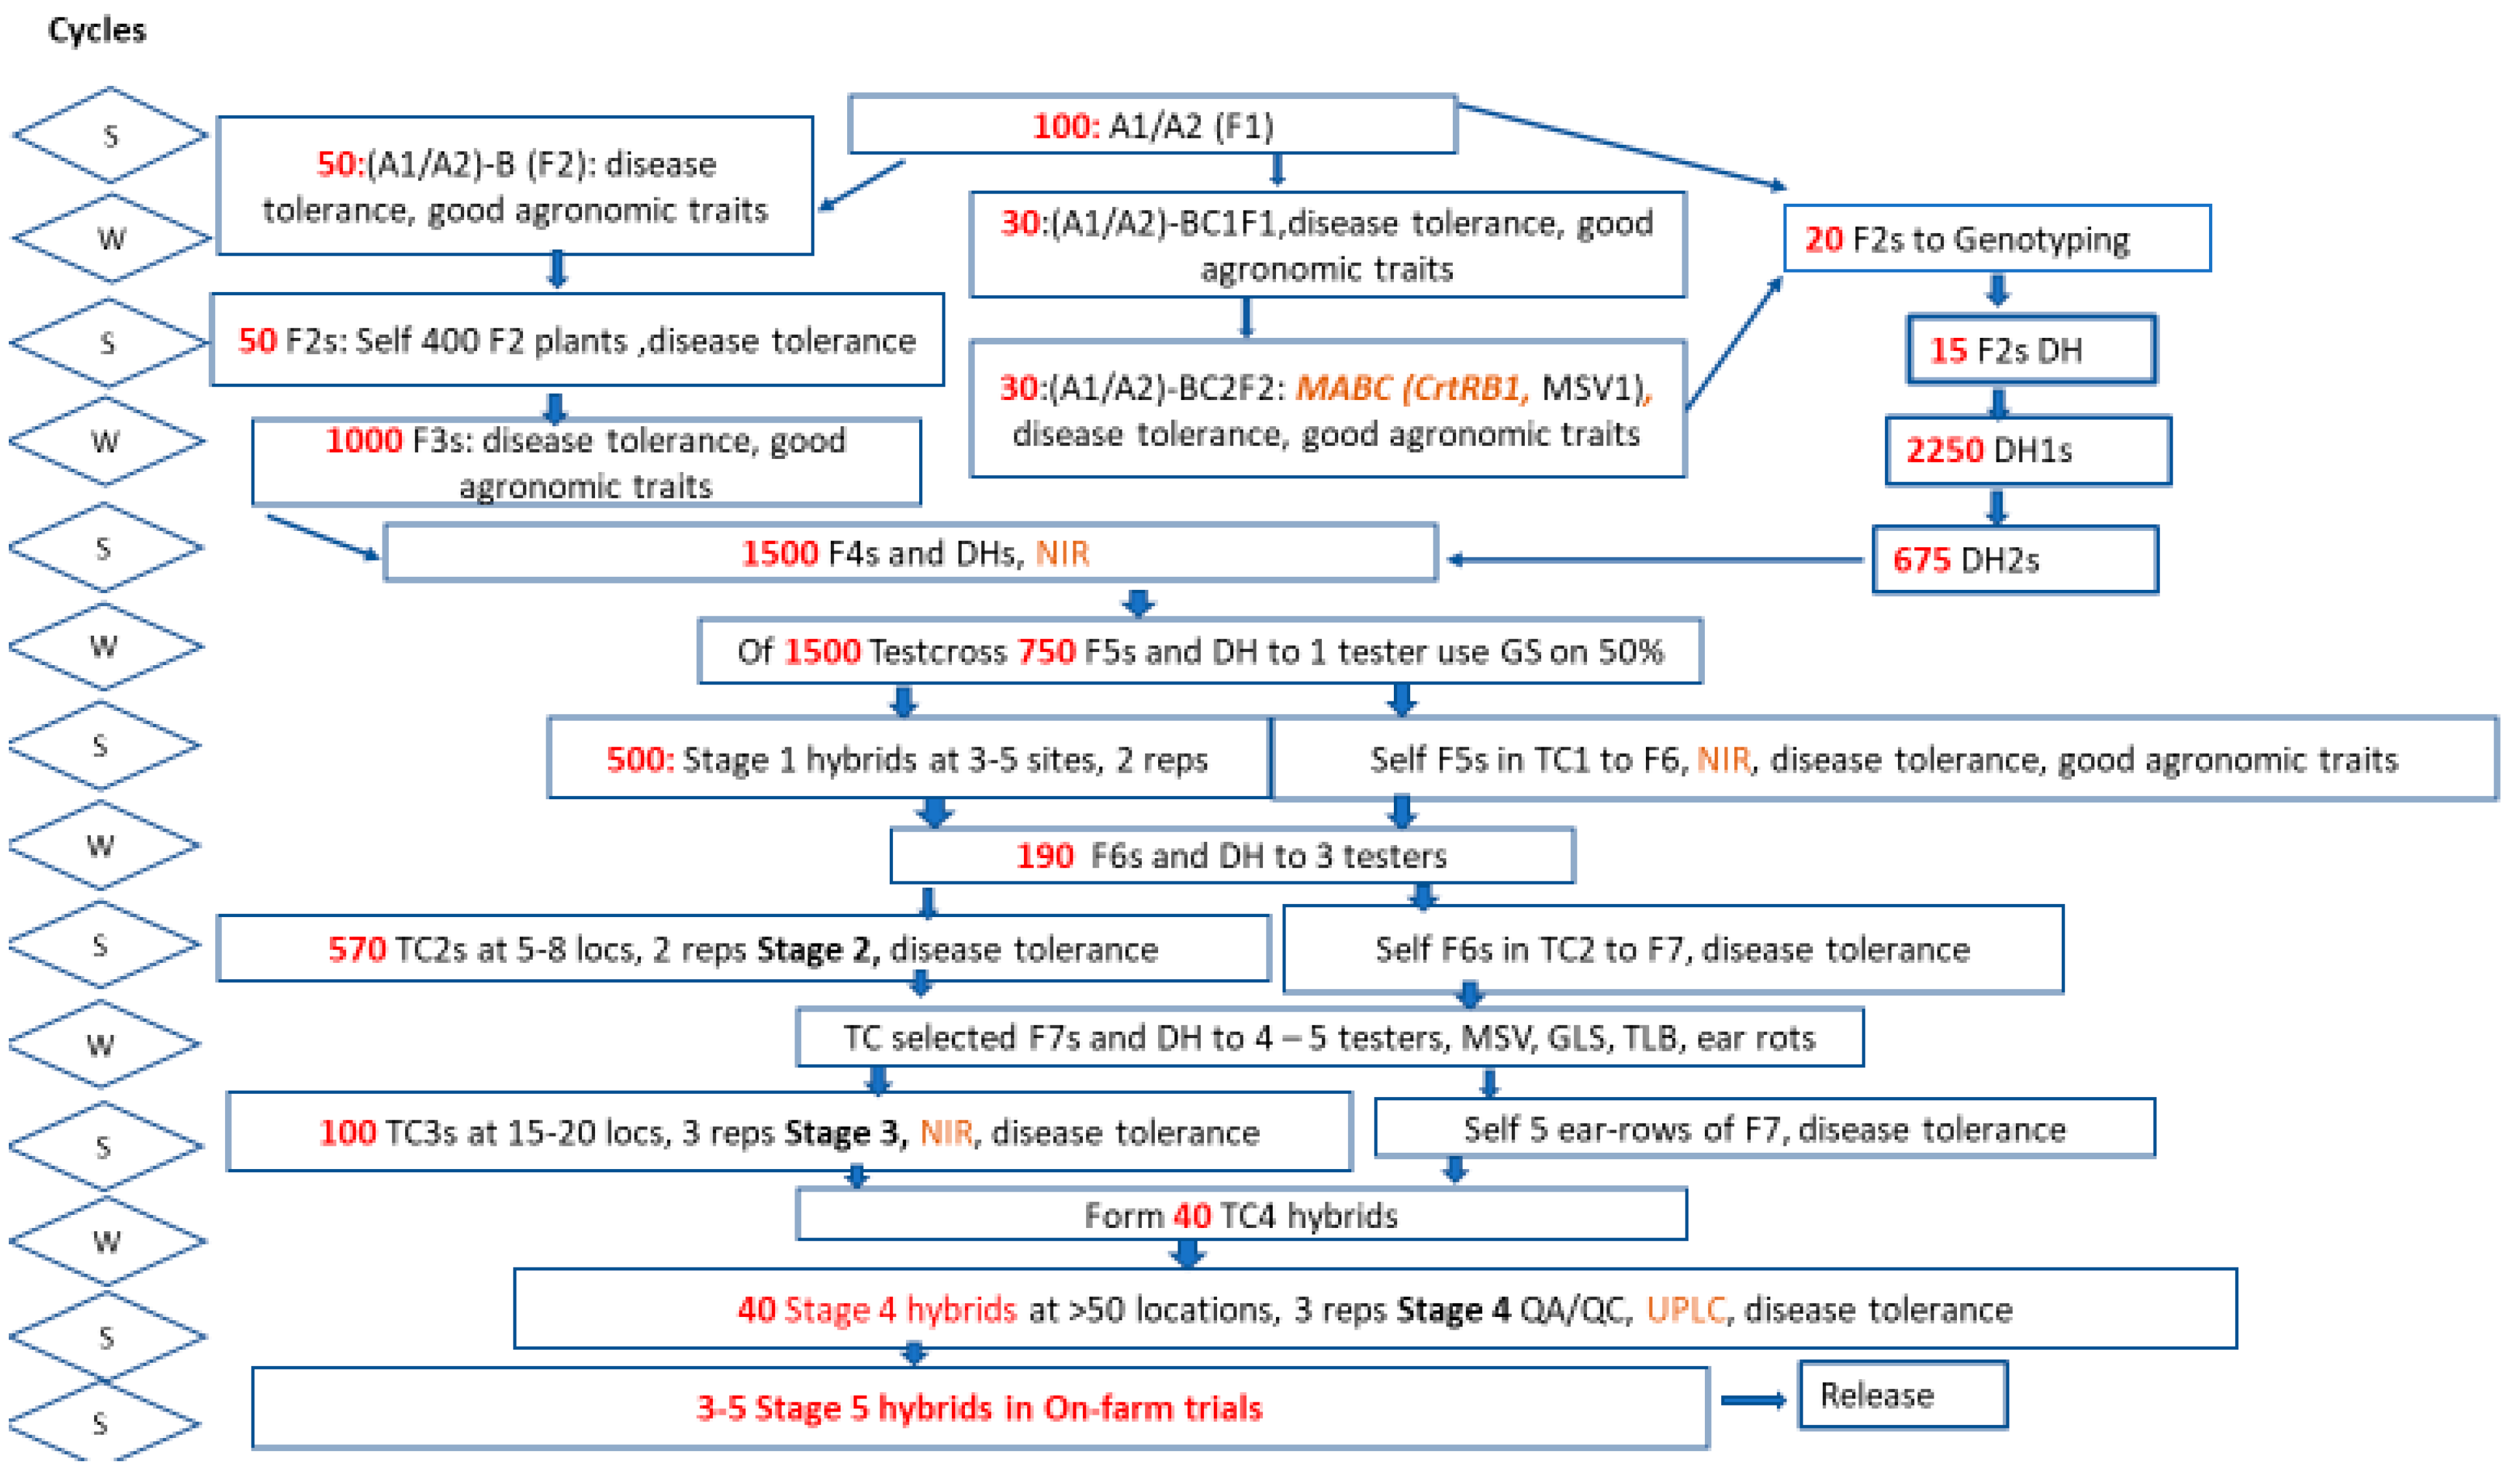
Taking the general PVA breeding scheme used at CIMMYT (Figure 1), the cost of screening 1550 samples with NIR and 120 samples with UPLC would be US 7440. If the same number of samples is screened with UPLC alone, the cost would be US 80,160. Thus, the development and use of the proposed NIR models presented here may help breeding programs reduce phenotyping costs and increase throughput, especially when NIRS equipment is installed on research plot combines.
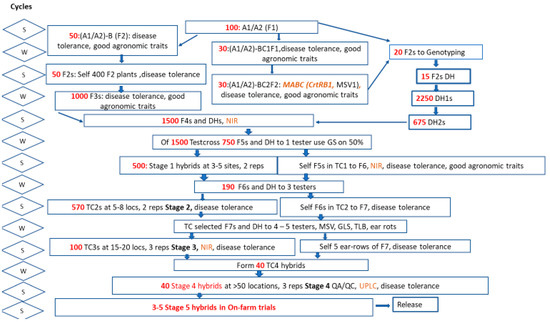
Figure 1.
PVA breeding scheme used at CIMMYT. In red, number of lines or crosses used at each stage. In orange, stages where PVA traits are screened either genotypically (bold and italics) or phenotypically. Abbreviations: S: Summer cycle; W: Winter cycle; MABC: Marker assistant backcrosses; DH: double haploids; CrtRB1: β-carotene hydroxylase 1; MSV: Mosaic streak virus; GS: Genomic selection; TC: test cross; GLS: Gray leaf spot; TLB: Turcicum leaf bright; QA/QC: quality assurance/quality control; UPLC: Ultra performance liquid chromatography.
5. Conclusions
High-throughput phenotyping helps breeders to quickly make evaluations and timely select the desired genotypes in the breeding populations. Although molecular tools accelerate and facilitate this process, phenotypic data are very relevant, especially in complex traits. However, phenotyping can increase the breeding process and, in some cases, could also slow down the breeding process as data can be obtained at the end of the growing cycle or just before the next planting season. NIR technology is a powerful high-throughput technology that meets the demand of plant breeding for large-scale evaluation of seed and grain composition in short periods of time. It can provide several compounds simultaneously.
Using a large and diverse set of data, it was possible to develop NIR calibration models by two methods: by using the software provided by NIR suppliers and by developing the equations independently using Bayesian models developed in R.
With the NIRS models developed here, it is possible to differentiate samples with high, medium, and low concentrations of LUT and BCX. During validation, it was possible to demonstrate the selection of more than 80% of BCX genotypes with concentrations higher than 3 mg kg−1, which is very relevant for PVA breeding programs. For ZEA and TC, NIRS models can be used for approximate quantitative predictions. In the case of BC, 13-cis-BC, and 9-cis-BC, the coefficient of determination in calibration and the RPD suggest that prediction models have the potential to be useful but must be improved.
Using NIR models will greatly decrease the breeding cost and enhance the efficiency of the program. Nevertheless, for the final stage of breeding and before varietal registration, wet chemistry analysis is always recommended for more precise and accurate data.
Author Contributions
Conceptualization, N.P.-R. and A.R.; methodology, N.P.-R., A.R., J.C. (José Crossa) and J.C. (Jaime Cuevas); validation, A.R. and J.C. (José Crossa); formal analysis, N.P.-R., A.R., J.C. (José Crossa) and J.C. (Jaime Cuevas); investigation, N.P.-R., A.R. and J.C. (José Crossa); resources, L.C.-S., T.D. and T.N.; data curation, N.P.-R. and A.R.; writing—original draft preparation, N.P.-R. and A.R.; writing—review and editing, N.P.-R., J.C. (José Crossa), T.D. and T.N.; visualization, N.P.-R.; supervision, N.P.-R.; project administration, N.P.-R. and T.D.; funding acquisition, N.P.-R. and T.D. All authors have read and agreed to the published version of the manuscript.
Funding
We are thankful for the financial support provided by Harvest Plus and MAIZE CRP, as well as the Foundations for Research Levy on Agricultural Products (FFL) and the Agricultural Agreement Research Fund (JA) in Norway through NFR grant 267806. Open Access fees are received from the Bill and Melinda Gates Foundation. We acknowledge the financial support provided by the Bill and Melinda Gates Foundation [INV-003439 BMGF/FCDO Accelerating Genetic Gains in Maize and Wheat for Improved Livelihoods (AG2MW)] as well as USAID projects [Amend. No. 9 MTO 069033, USAID-CIMMYT Wheat/AGGMW, AGG-Maize Supplementary Project, AGG (Stress Tolerant Maize for Africa)].
Data Availability Statement
The datasets can be downloaded from the link https://hdl.handle.net/11529/10548607 (accessed on 24 April 2022).
Acknowledgments
The authors kindly thank Andrea Susana Cruz, research assistant at CIMMYT, for her field work and for facilitating the maize germplasm used in the study. They also thank the Maize Quality Laboratory “Evangelina Villegas” at CIMMYT for support in analyzing the samples).
Conflicts of Interest
The authors declare no conflict of interest.
Appendix A
- R code for the Bayesian NIR linear regression using BGGE library.
- ###Clear work space
- rm(list=ls())
- ### Install BGGE and prospectr packages for only one time
- install.packages(“BGGE”)
- install.packages(“prospectr”)
- ### load BGGE and prospectr packages
- library(BGGE)
- library(prospectr)
- ############################# Fitted Dataset 1 #############
- ##########Load data Data_set_1
- setwd(“~/Directory”)
- Datos1<-read.csv(file=“Data_set_1.csv”,header=T)
- Y1<-as.matrix(Datos1[,6:13]) #Traits
- Y<-Y1
- N1<-Datos1[,14:ncol(Datos1)] #NIRS
- ############### First derivative and NB
- NIR1<-savitzkyGolay(N1,m=1,p=2,w=11)
- X<-scale(NIR1)
- NB<-tcrossprod(X)/ncol(X)
- ### Fitted with BGGE
- Fitted<-matrix(0,nrow=1857,ncol=ncol(Y))
- COR<-numeric(ncol(Y))
- for(i in 1:ncol(Y)){
- y<-Y[,i]
- K0<-list(list(Kernel=NB,Type=“D”))
- fit<-BGGE(y=y,K=K0,ne=1,ite=30000,burn=5000,thin=2)
- Fitted[,i]<-fit$yHat
- COR[i]<-cor(fit$yHat,y,use=“pairwise.complete.obs”)
- }
- ## save in Rdata
- save(Fitted,COR,file=“Fitted_1857_NB.RData”)
- ############ Prediction traits Dataset 2 #####
- ##########Load data Dataset 3
- Datos3<-read.csv(file=“Data_set_3.csv”,header=T)
- Y3<-as.matrix(Datos3[,2:9]) #Traits
- N3<-Datos3[,10:ncol(Datos3)] #NIRS
- Y<-rbind(Y1,Y3)
- ############ First derivative
- NIR<-rbind(N1,N3)
- NIR1<-savitzkyGolay(NIR,m=1,p=1,w=11) #First derivative
- X<-scale(NIR1)
- NB<-tcrossprod(X)/ncol(X)
- Pred<-matrix(0,nrow=650,ncol=ncol(Y))
- for(i in 1:ncol(Y)){
- y<-Y[,i]
- yna<-y
- test<-1858:nrow(Y)
- yna[test]<-NA
- K0<-list(list(Kernel=NB,Type=“D”))
- fit<-BGGE(y=yna,K=K0,ne=1,ite=30000,burn=5000,thin=2)
- Pred[,i]<-fit$yHat[test]
- COR[i]<- COR[i]<-cor(fit$yHat[test],y[test],use=“pairwise.complete.obs”)
- }
- save(COR,Pred,file=“Pred_650.RData”)
References
- UNICEF. Estimates of Vitamin A Supplementation Coverage in Preschool-Age Children: Methods and Processes for the UNICEF Global Database; United Nations Children’s Fund: New York, NY, USA, 2020. [Google Scholar]
- Williams, A.M.; Tanumihardjo, S.A.; Rhodes, E.C.; Mapango, C.; Kazembe, B.; Phiri, F.; Kang’ombe, D.D.; Sheftel, J.; Orchardson, V.; Tripp, K.; et al. Vitamin A Deficiency Has Declined in Malawi, but with Evidence of Elevated Vitamin A in Children. Am. J. Clin. Nutr. 2021, 113, 854–864. [Google Scholar] [CrossRef] [PubMed]
- Ortiz-Monasterio, J.I.; Palacios-Rojas, N.; Meng, E.; Pixley, K.; Trethowan, R.; Peña, R.J. Enhancing the Mineral and Vitamin Content of Wheat and Maize through Plant Breeding. J. Cereal Sci. 2007, 46, 293–307. [Google Scholar] [CrossRef]
- Pixley, K.; Palacios-Rojas, N.; Babu, R.; Mutale, R.; Surles, R.; Simpungwe, E. Biofortification of Maize with Provitamin A Carotenoids. In Carotenoids and Human Health; Tanumihardjo, S.A., Ed.; Humana Press: New York, NY, USA, 2013; pp. 271–292. [Google Scholar]
- Rodríguez-Amaya, D.B.; Kimura, M. HarvestPlus Handbook for Carotenoid Analysis; HarvestPlus Technical Monograph 2; International Center for Tropical Agriculture (CIAT): Cali, Colombia, 2004. [Google Scholar]
- Guild, G.E.; Parkes, E.; Nutti, M.; Palacios-Rojas, N.; Stangoulis, J. High-Throughput Measurement Methodologies for Developing Nutrient-Dense Crops. Afr. J. Food Agric. Nutr. Dev. 2017, 17, 11941–11954. [Google Scholar] [CrossRef]
- Prasanna, B.M.; Palacios-Rojas, N.; Hossain, F.; Muthusamy, V.; Menkir, A.; Dhliwayo, T.; Ndhlela, T.; San Vicente, F.; Nair, S.K.; Vivek, B.S. Molecular Breeding for Nutritionally Enriched Maize: Status and Prospects. Front. Genet. 2020, 10, 1392. [Google Scholar] [CrossRef] [PubMed] [Green Version]
- Babu, R.; Palacios-Rojas, N.; Gao, S.; Yan, J.; Pixley, K. Validation of the Effects of Molecular Marker Polymorphisms in LcyE and CrtRB1 on Provitamin A Concentrations for 26 Tropical Maize Populations. Theor. Appl. Genet. 2013, 126, 389–399. [Google Scholar] [CrossRef] [PubMed] [Green Version]
- Jiang, G.L. Comparison and Application of Non-Destructive NIR Evaluations of Seed Protein and Oil Content in Soybean Breeding. Agronomy 2020, 10, 77. [Google Scholar] [CrossRef] [Green Version]
- Chandler, K.; Lipka, A.E.; Owens, B.F.; Li, H.; Buckler, E.S.; Rocheford, T.; Gore, M.A. Genetic Analysis of Visually Scored Orange Kernel Color in Maize. Crop Sci. 2013, 53, 189–200. [Google Scholar] [CrossRef] [Green Version]
- Hayes, B.J.; Panozzo, J.; Walker, C.K.; Choy, A.L.; Kant, S.; Wong, D.; Tibbits, J.; Daetwyler, H.D.; Rochfort, S.; Hayden, M.J.; et al. Accelerating Wheat Breeding for End-Use Quality with Multi-Trait Genomic Predictions Incorporating near Infrared and Nuclear Magnetic Resonance-Derived Phenotypes. Theor. Appl. Genet. 2017, 130, 2505–2519. [Google Scholar] [CrossRef] [PubMed]
- Rincent, R.; Charpentier, J.P.; Faivre-Rampant, P.; Paux, E.; Le Gouis, J.; Bastien, C.; Segura, V. Phenomic Selection Is a Low-Cost and High-Throughput Method Based on Indirect Predictions: Proof of Concept on Wheat and Poplar. G3 Genes Genomes Genet. 2018, 8, 3961–3972. [Google Scholar] [CrossRef] [PubMed] [Green Version]
- Alamu, E.O.; Nuwamanya, E.; Cornet, D.; Meghar, K.; Adesokan, M.; Tran, T.; Belalcazar, J.; Desfontaines, L.; Davrieux, F. Near-Infrared Spectroscopy Applications for High-Throughput Phenotyping for Cassava and Yam: A Review. Int. J. Food Sci. Technol. 2021, 56, 1491–1501. [Google Scholar] [CrossRef] [PubMed]
- Ferreira de Oliveira, G.H.; Murray, S.C.; Cunha Júnior, L.C.; Gomes de Lima, K.M.; de Lelis Medeiros de Morais, C.; Henrique de Almeida Teixeira, G.; Môro, G.V. Estimation and Classification of Popping Expansion Capacity in Popcorn Breeding Programs Using NIR Spectroscopy. J. Cereal Sci. 2020, 91, 102861. [Google Scholar] [CrossRef]
- Tallada, J.G.; Palacios-Rojas, N.; Armstrong, P.R. Prediction of Maize Seed Attributes Using a Rapid Single Kernel near Infrared Instrument. J. Cereal Sci. 2009, 50, 381–387. [Google Scholar] [CrossRef]
- Armstrong, P.R.; Tallada, J.G. Prediction of Kernel Density of Corn Using Single-Kernel near Infrared Spectroscopy. Appl. Eng. Agric. 2012, 28, 569–574. [Google Scholar] [CrossRef]
- Hernández-Quintero, J.D.; Rosales-Nolasco, A.; Molina-Macedo, A.; Miranda-Piliado, A.; Willcox, M.; Hernández-Casillas, J.M.; Palacios-Rojas, N. Quantification of Anthocyanins through near Infrared Spectroscopy and Liquid Chromatography in Pigmented Maize. Rev. Fitotec. Mex. 2017, 40, 219–226. [Google Scholar]
- Jiang, H.Y.; Zhu, Y.J.; Wei, L.M.; Dai, J.R.; Song, T.M.; Yan, Y.L.; Chen, S.J. Analysis of Protein, Starch and Oil Content of Single Intact Kernels by near Infrared Reflectance Spectroscopy (NIRS) in Maize (Zea mays L.). Plant Breed. 2007, 126, 492–497. [Google Scholar] [CrossRef]
- Rosales, A.; Galicia-Flores, L.A.; Oviedo, E.; Islas-Caballero, C.; Palacios-Rojas, N. Near-Infrared Reflectance Spectroscopy (NIRS) for Protein, Tryptophan, and Lysine Evaluation in Quality Protein Maize (QPM) Breeding Programs. J. Agric. Food Chem. 2011, 59, 10781–10786. [Google Scholar] [CrossRef] [PubMed]
- Wold, S.; Sjöström, M.; Eriksson, L. PLS-Regression: A Basic Tool of Chemometrics. Chemom. Intell. Lab. Syst. 2001, 58, 109–130. [Google Scholar] [CrossRef]
- Wold, H.O.A. Nonlinear Estimation by Iterative Least Squares Procedures. In Research Papers in Statistics, Festschrift for J. Neyman; David, F.N., Ed.; Wiley: New York, NY, USA, 1966; pp. 411–444. [Google Scholar]
- Wold, H.O.A. Path Models with Latent Variables: The NIPALS Approach; Academic Press, Inc.: Cambridge, MA, USA, 1975. [Google Scholar]
- Aastveit, A.H.; Martens, H. ANOVA Interactions Interpreted by Partial Least Squares Regression. Biometrics 1986, 42, 829. [Google Scholar] [CrossRef]
- Cuevas, J.; Montesinos-López, O.; Juliana, P.; Guzmán, C.; Pérez-Rodríguez, P.; González-Bucio, J.; Burgueño, J.; Montesinos-López, A.; Crossa, J. Deep Kernel for Genomic and near Infrared Predictions in Multi-Environment Breeding Trials. G3 Genes Genomes Genet. 2019, 9, 2913–2924. [Google Scholar] [CrossRef] [PubMed] [Green Version]
- Granato, I.; Cuevas, J.; Luna-Vázquez, F.; Crossa, J.; Montesinos-López, O.; Burgueño, J.; Fritsche-Neto, R. BGGE: A New Package for Genomic-Enabled Prediction Incorporating Genotype × Environment Interaction Models. G3 Genes Genomes Genet. 2018, 8, 3039–3047. [Google Scholar] [CrossRef] [PubMed] [Green Version]
- Palacios-Rojas, N. Calidad Nutricional e Industrial de Maíz. Protocolos; CIMMYT: El Batan, Mexico, 2018; ISBN 9786078263783. [Google Scholar]
- R Core Team. R: A Language and Environment for Statistical Computing; R Foundation for Statistical Computing: Vienna, Austria, 2021; Available online: https://www.R-project.org/ (accessed on 29 March 2022).
- Martínez-Valdivieso, D.; Font, R.; Blanco-Díaz, M.T.; Moreno-Rojas, J.M.; Gómez, P.; Alonso-Moraga, Á.; Del Río-Celestino, M. Application of Near-Infrared Reflectance Spectroscopy for Predicting Carotenoid Content in Summer Squash Fruit. Comput. Electron. Agric. 2014, 108, 71–79. [Google Scholar] [CrossRef]
- Montes, J.M.; Utz, H.F.; Schipprack, W.; Kusterer, B.; Muminovic, J.; Paul, C.; Melchinger, A.E. Near-Infrared Spectroscopy on Combine Harvesters to Measure Maize Grain Dry Matter Content and Quality Parameters. Plant Breed. 2006, 125, 591–595. [Google Scholar] [CrossRef]
- Stevens, A.; Ramirez-Lopez, L. An Introduction to the Prospectr Package. R Package Version 0.2.0. R Packag. Vignette 2013, 1, 1–22. [Google Scholar]
- Suwarno, W.B.; Pixley, K.V.; Palacios-Rojas, N.; Kaeppler, S.M.; Babu, R. Genome-Wide Association Analysis Reveals New Targets for Carotenoid Biofortification in Maize. Theor. Appl. Genet. 2015, 128, 851–864. [Google Scholar] [CrossRef] [PubMed] [Green Version]
- Taleon, V.; Mugode, L.; Cabrera-Soto, L.; Palacios-Rojas, N. Carotenoid Retention in Biofortified Maize Using Different Post-Harvest Storage and Packaging Methods. Food Chem. 2017, 232, 60–66. [Google Scholar] [CrossRef] [PubMed]
- Liu, Y.-Q.; Davis, C.R.; Schmaelzle, S.T.; Rocheford, T.R.; Cook, M.E.; Tanumihardjo, S.A. β-Cryptoxanthin Biofortified Maize (Zea mays) Increases β-Cryptoxanthin Concentration and Enhances the Color of Chicken Egg Yolk. Poult. Sci. 2011, 15, 171–181. [Google Scholar] [CrossRef] [PubMed]
- Davis, C.R.; Jing, H.; Howe, J.A.; Rocheford, T.R.; Tanumihardjo, S.A. β-Cryptoxanthin from Supplements or Carotenoid enhanced Maize Maintains Liver Vitamin A in Mongolian Gerbils (Meriones unguiculatus) Better than or Equal to β-Carotene Supplements. Br. J. Nutr. 2008, 100, 786–793. [Google Scholar] [CrossRef] [PubMed] [Green Version]
- Ortiz-Covarrubias, Y.; Dhliwayo, T.; Palacios-Rojas, N.; Ndhlela, T.; Magorokosho, C.; Aguilar-Rincón, V.H.; Cruz-Morales, A.S.; Trachsel, S. Effects of Drought and Low Nitrogen Stress on Provitamin a Carotenoid Content of Biofortified Maize Hybrids. Crop Sci. 2019, 59, 2521–2532. [Google Scholar] [CrossRef] [Green Version]
- Saenz, E.; Borrás, L.; Gerde, J.A. Carotenoid Profiles in Maize Genotypes with Contrasting Kernel Hardness. J. Cereal Sci. 2021, 99, 103206. [Google Scholar] [CrossRef]
- Sukto, S.; Lomthaisong, K.; Sanitchon, J.; Chankaew, S.; Scott, M.P.; Lübberstedt, T.; Lertrat, K.; Suriharn, B. Zeaxanthin of Yellow Small-Ear Waxy Corn Germplasm. Int. J. Agron. 2020, 2020, 8818768. [Google Scholar] [CrossRef]
- Vallabhaneni, R.; Gallagher, C.E.; Licciardello, N.; Cuttriss, A.J.; Quinlan, R.F.; Wurtzel, E.T. Metabolite Sorting of a Germplasm Collection Reveals the Hydroxylase3 Locus as a New Target for Maize Provitamin A Biofortification. Plant Physiol. 2009, 151, 1635–1645. [Google Scholar] [CrossRef] [PubMed] [Green Version]
- Brenna, O.V.; Berardo, N. Application of Near-Infrared Reflectance Spectroscopy (NIRS) to the Evaluation of Carotenoids Content in Maize. J. Agric. Food Chem. 2004, 52, 5577–5582. [Google Scholar] [CrossRef] [PubMed]
- Kahrıman, F.; Onaç, İ.; Mert Türk, F.; Öner, F.; Egesel, C.Ö. Determination of Carotenoid and Tocopherol Content in Maize Flour and Oil Samples Using Near-Infrared Spectroscopy. Spectrosc. Lett. 2019, 52, 473–481. [Google Scholar] [CrossRef]
- Davey, M.W.; Saeys, W.; Hof, E.; Ramon, H.; Swennen, R.L.; Keulemans, J. Application of Visible and Near-Infrared Reflectance Spectroscopy (Vis/NIRS) to Determine Carotenoid Contents in Banana (Musa spp.) Fruit Pulp. J. Agric. Food Chem. 2009, 57, 1742–1751. [Google Scholar] [CrossRef]
- Bonierbale, M.; Grüneberg, W.; Amoros, W.; Burgos, G.; Salas, E.; Porras, E.; Felde, T. Zum Total and Individual Carotenoid Profiles in Solanum Phureja Cultivated Potatoes: II. Development and Application of near-Infrared Reflectance Spectroscopy (NIRS) Calibrations for Germplasm Characterization. J. Food Compos. Anal. 2009, 22, 509–516. [Google Scholar] [CrossRef]
- Araus, J.L.; Cairns, J.E. Field High-Throughput Phenotyping: The New Crop Breeding Frontier. Trends Plant Sci. 2014, 19, 52–61. [Google Scholar] [CrossRef]
Publisher’s Note: MDPI stays neutral with regard to jurisdictional claims in published maps and institutional affiliations. |
© 2022 by the authors. Licensee MDPI, Basel, Switzerland. This article is an open access article distributed under the terms and conditions of the Creative Commons Attribution (CC BY) license (https://creativecommons.org/licenses/by/4.0/).