Article

Impact of Irrigation Levels and Weed Control Treatments on Annual Weeds, Physiological Traits and Productivity of Soybean under Clay Soil Conditions

1
Weed Control in Field Crop Research Department, Weed Research Central Laboratory, Agricultural Research Centre, Giza 12619, Egypt
2
Business Administration Department, Community College, King Khalid University, Guraiger, Abha 62529, Saudi Arabia
3
Faculty of Agriculture, Tanta University, Tanta 31512, Egypt
4
Food Legume Research Department, Field Crops Research Institute, Agricultural Research Centre, Giza 12619, Egypt
5
Water Requirements and Field Irrigation Research Department, Soils, Water and Environment Research Institute, Agricultural Research Centre, Giza 12619, Egypt
6
Plant Protection Department, Faculty of Agriculture, New Valley University, El-Kharga 72511, Egypt
7
Excellence Center (EPCRS), Plant Pathology and Biotechnology Laboratory, Faculty of Agriculture, Kafrelsheikh University, Kafr Elsheikh 33516, Egypt
8
Crop Physiology Research Department, Field Crops Research Institute, Agricultural Research Centre, Giza 12619, Egypt
*
Author to whom correspondence should be addressed.
Agronomy 2022, 12(5), 1037; https://doi.org/10.3390/agronomy12051037
Submission received: 3 March 2022 / Revised: 23 April 2022 / Accepted: 24 April 2022 / Published: 26 April 2022
(This article belongs to the Section Weed Science and Weed Management)

Abstract

:
Water scarcity and weed infestation are major challenges to soybean production. Therefore, two field experiments were conducted in a strip plot design including three replicates in the 2019 and 2020 summer seasons at Sakha Agricultural Research Station, Agricultural Research Centre, Egypt, to investigate the effect of three irrigation levels (I0 (100%), I1 (90%), and I2 (80%)), and six weed control treatments of pendimethalin (T1), oxyfluorfen (T2), bentazon + clethodim (T3), imazethapyr (T4), hand-hoeing twice (T5), and untreated check (T6) on annual weeds, physiological traits, water relations, and yield and its components of soybean cv Giza 111. Results indicated that intermediate irrigation levels lead to the highest yield and economic return, while the herbicide program that resulted in the greatest weed control gave the highest yield. The rate of weed infestation in field experiments was 19.7 and 21.8 t ha−1 dry weights, which decreased soybean yield by 56.9 and 57.1%, compared to treatment (T4). The interactions between 100 irrigation level (I0) and imazethapyr (T4), bentazon + clethodim (T3), and hand-hoeing twice (T5) gave the highest significant values of the most studied characters. Furthermore, under 90% irrigation, all weed control treatments give the best control of weeds and the highest values of the economic criteria.

1. Introduction

Soybean (Glycine max L. Merrill) is an important economic crop belonging to the Fabaceae family. In Egypt, the total cultivated area with soybean in 2018 was 12271.25 hectares with a total seed production of 15070 tons [1]. The soybean crop needs a sufficient water supply during its growth process to achieve high yields [2]. Plant growth and yield have been shown to be negatively affected by many stress factors such as salinity [3,4,5,6,7] and drought [8,9,10]. Water deficit is the main limitation to the yield production of many plants in many regions [11]; consequently, understanding the crop response to scarcity stress can lead to better irrigation water utilization and better yield even under drought stress conditions [12].
Water stress conditions induce morpho-physiological and biochemical changes, which negatively affect the growth and yield of soybean [13], maize [14] and sugar beet [15]. Chlorophyll content in leaves is an important indicator of stress and the amount of chlorophyll in the plant and the total absorption of light by the plant could be reduced under various stresses [16,17,18,19,20]. Soybean exposed to water deficit stress showed a significant decrease in the chlorophyll content of leaves [21]. Relative water content (RWC) is a major determinant of metabolic activity in leaves and is closely associated with plant drought resistance [22]; moreover, RWC was decreased in stressed plants compared to those under normal conditions [23]. Hao et al. [24] reported that the relative water content decreased by 33% under drought stress compared to the control treatment. Proline is an important osmotic adjustment that protects the membrane system; it accumulates in the cytoplasm of plants under several stresses [17,22,25,26], and, under water deficit, the production of reactive oxygen species (ROS) was increased, which is considered to be toxic for plant and to cause severe destruction to DNA, proteins, and lipids [27]. Plants have various protective mechanisms against ROS, such as the antioxidant system which, can actively scavenge it. Catalase (CAT) as an enzymatic antioxidant plays a key role in the degradation of H2O2 which is known as a toxic ROS [22]. Malondialdehyde (MDA) is the final outcome of the peroxidation of membrane lipids in the presence of ROS and increases under water stress [27], salinity [28,29], under biotic stress [30]. Lower oil and higher protein content were observed in grains under water stress in the reproductive stage [31].
Weeds are considered the most important problem in all soybean-producing countries, as the presence of weeds can cause a reduction in yield of up to 40% [32]. Weed control plays an important role in increasing the productivity of crops. Herbicides can be defined as chemicals used in crop protection to control weedy plants and/or interrupt their normal growth, an economical and effective way to manage weeds [33]. Weed management is essential for agricultural production and could play an important role in achieving future food production goals [34] associated with the improvement in plant growth characteristics [35]. El-Metwally et al. [36] demonstrated that two hand-hoeing or herbicide applications of bentazone + clethodim combined with Giza 111 cultivars effectively improved the growth and productivity of soybean. The application of imazethapyr at 75 or 100 g/ha applied at 15 or 25 days after sowing (DAS) recorded almost similar weed density, weed dry matter, plant height, and seed yield of soybean as compared to the unweeded check [37]. Moreover, Ariunaa et al. [38] found that imazethapyr 0.10 kg/ha was superior for controlling weeds in soybean which recorded the lowest weed count, weed dry matter, and weed index. Further impacts on the agronomics and economics of soybean production, include effects on the quality of grain and seeds [39]. Thus, chemical weed control is widely applied because it is relatively expensive and provides good control of competing weeds during crop establishment. Irrigation scheduling includes knowing the most appropriate amount of required water for irrigation in a timely manner for cultivated plants. The cultivated area with soybeans is limited due to the limited amount of irrigation water [34]. The main objective of this study was to evaluate the effects of four promising herbicides in mitigating the harmful effects of weeds under three irrigation levels and study the growth characters of weed, physiological traits, and productivity of soybean to obtain a high seed yield with saving irrigation water.

2. Materials and Methods

A field investigation was carried out at Sakha Agricultural Research Station, Kafr El-Sheikh Governorate, Agricultural Research Centre (A.R.C.), Egypt, during the two successive summer growing seasons in 2019 and 2020 to study the effect of irrigation levels and weed control treatments on soybean productivity, associated weed species, and some physiological characteristics under conditions of the experimental site. Soil samples were taken at various depths up to 60 cm to study the physical and chemical properties (Table 1 and Table 2). Soil texture was clay loam according to Klute [40]. The mean of the electrical conductivity (EC) was 4.13 dS m−1 according to Jackson, [41]. The meteorological data for Kafr El-Sheikh during 2019 are shown in Table 3.
The experimental design was a strip plot with three replications; the main plots were randomly assigned to irrigation treatments:
  • I0 = irrigation with 100% from water requirements (check treatment) as control
  • I1 = irrigation with 90% from water requirements
  • I2 = irrigation with 80% from water requirements
Subplots were randomly allocated to weed control treatments (Table 4). Each subplot unit was 21 m2 (3.5 m length − 6 m width) and each plot contained 5 ridges 3.5 m in length and 70 cm in width. Soybean cv. Giza 111 was sown on May 15 and 18 and harvested on 3 and 7 October in the 2019 and 2020 seasons, respectively, and was planted in hills 15 cm apart within each row. The recommended doses of NPK were added as the following: ammonium nitrate (33.5% N) at the rate of 50 kg N ha−1 was used as a source of nitrogen fertilizer and added in four equal rations, the first dose after 20 days and applied in one dose before the first irrigation. Phosphorus fertilizer was added as superphosphate (15.5% P2O5) during land preparation using 55 kg ha−1 and potassium as potassium sulfate K2SO4 was added after 35 days from sowing 72 kg ha−1. Herbicides in the 2019 and 2020 seasons were sprayed via a Knapsack sprayer CP3 (manual hand) with a water volume of 477 L ha−1. All agriculture practices for growing soybean plants were performed as recommended in soybean fields in these regions.

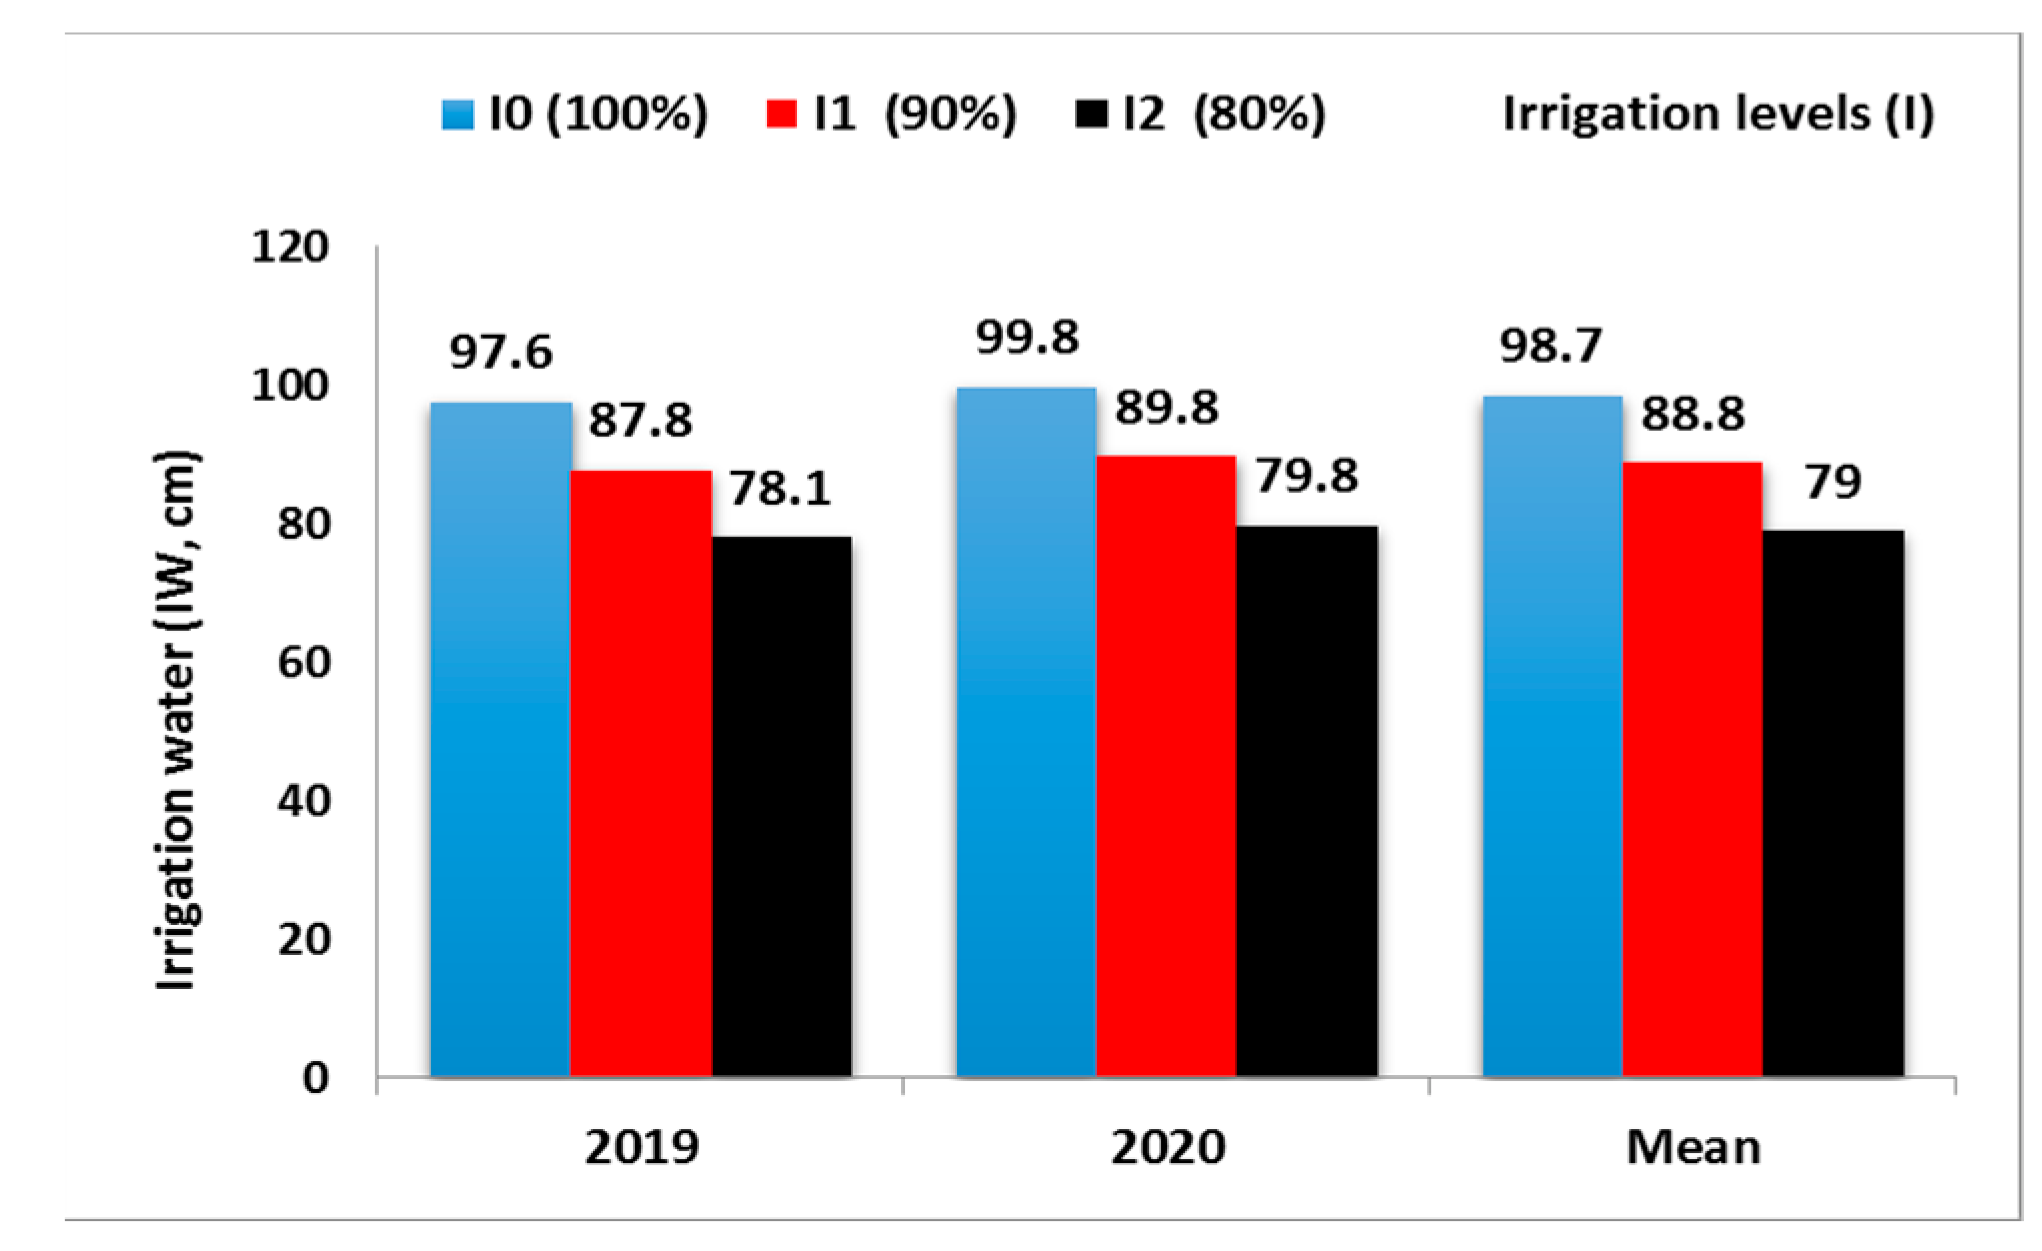
2.1. The Amount of Irrigation Water (IW, m3 ha−1)

As shown in Figure 1, there were three water irrigation levels as follows: I0 included the amount of applied water requirements (100%) for soybean crop, depending on the official recommendations of the Egyptian Ministry of Agriculture and reclaimed soil. I0 (100%) reached 9760 m3 ha−1 and 9980 m3 ha−1 during both 2019 and 2020, respectively. I1 (90%) from water requirements reached 8780 m3 ha−1 and 8980 m3 ha−1 during the 2019 and 2020 seasons, respectively. I2 (80%) was 7810 m3 ha−1 and 7980 m3 ha−1, respectively, in the 2019 and 2020 seasons. The amount of irrigation water for different weed control treatments was the same under every irrigation level.

2.2. Evaluation of Weed Control Efficacy

The susceptibility of weed species to herbicides was measured after 60 days from sowing depending on the reduction percentage of the dry weight of each species compared to the untreated check according to Frans and Talbert [42] as follows:
Referring to the percentage of dead plants, a weed species is considered:
  • Susceptible (S) = >90%
  • Moderately susceptible (MS) = between 80 and 90%
Efficacy > 90%; 80% < MS < 90%.
Weed control efficacy was evaluated in the form of percent reduction (R%) in the dry weight of each of the broad-leaved, grassy, and total weeds. The percent of reduction (R%) was calculated as follows:
R % = (A − B/A) × 100
where A = the dry weight of weeds in untreated plot; B = the dry weight of weeds in treated plot.
The scientific, common, and family names for weeds in the experimental plots are shown in Table 5.

2.3. Determination of Dry Weight of Annual Broad-Leaved, Grassy Weeds and Total Weeds

Weed plants were hand-pulled from one square meter from each plot after 60 and 80 days after sowing (DAS) then identified into species and classified into three categories (broad-leaved, grassy, and total weeds). After that, the weeds were air-dried for 3 days then oven-dried at 70 °C for 72 h. The dry weight of annual broad-leaved, grassy weeds, and total weeds was estimated as g m−2.

2.4. Morphological Characteristics of Soybean and Yield

At harvest, a random sample of 10 soybean plants was taken from each plot to determine plant height (cm), number of branches/plants, weight of seed yield/plant, weight of 100-seeds (g), and seed yield (t ha−1) from the whole plot.

2.5. Physiological and Biochemical Characteristics

Fully developed leaves from the top of ten plants from each plot were randomly taken to determine the physiological and biochemical characteristics as follows:

2.5.1. Chlorophyll Content

Chlorophyll a (Chl a) and b (Chl b) as µg mL−1 at two times (30 and 60 days from herbicides application) were determined with approximate ratios of 1:100 (w/v) for fresh leaves and N,N-dimethylformamide, respectively. The plant material was placed in N,N-dimethylformamide, saved in the refrigerator overnight, and determined spectrophotometrically at two wavelengths (664 and 647) according to Moran [43] as follows:
Chl a = 12.64 A664 − 2.99 A647
Chl b = −5.6 A664 + 23.26 A647
where A664: the absorbance at wavelength 664; A647: the absorbance at wavelength 647.

2.5.2. Relative Water Content (RWC %)

RWC was determined according to Gonzalez and Gonzalez [44]. Leaf discs were cut from the center of the leaf and weighed as fresh weight (FW) then soaked for 4 h in distilled water and weighed again to obtain the turgid weight (TW). Then, they were dried and weighed to obtain DW. RWC% was calculated using the following equation:
RWC% = FW − DW/TW − DW × 100

2.5.3. Lipid Peroxidation

The level of lipid peroxidation was measured as malondialdehyde (MDA µmol g−1 FW) by homogenizing 0.1 gm of fresh leaf tissue by adding 0.5 mL 0.1% (w/v) trichloroacetic acid (TCA) then centrifuging the homogenate for 10 min (15,000× g 4.0 °C). Then, 0.5 mL of the supernatant was mixed with 1.5 mL of 0.5% thiobarbituric acid diluted in 20% TCA and incubated in a water bath at 95 °C for 25 min and before measuring the absorbance at 532 and 600 nm according to Heath and Packer [45].

2.5.4. Enzymatic Antioxidant Catalase

Enzymatic antioxidant catalase activity (CAT) was measured as μmol min−1 g−1 protein where the leaf sample (500 mg) was frozen in liquid nitrogen and finely ground by pestle in a chilled motor. Then, 10 mL of phosphate buffer (pH 7.0) was added. The homogenate was centrifuged at 15,000× g for 10 min at 4 °C. The assay mixture consisting of a volume of 3 mL contained 0.5 mL of 0.2 M phosphate buffer (pH 7.0), 0.3 mL of (v/v) H2O2, and 0.1 mL of enzyme. The final volume was increased to 3 mL by adding distilled water. The resulting mixture was measured at 240 nm with a UV/Vis spectrophotometer according to Lum et al. [46].

2.5.5. Proline Content

Proline content was recorded as mg g−1. FW leaf samples (0.5 g) were homogenized in a mortar and pestle with 10 mL sulphosalicylic acid (3% w/v). Then, 2 mL of the supernatant was added to a test tube, and 2 mL glacial acetic acid and 2 mL freshly prepared acid ninhydrin solution were added to the tube. The test tubes were incubated in a water bath for 1 h at 100 °C and then allowed to cool. Then, 4 mL of toluene was then added to the tubes and mixed for 20 s. The toluene and aqueous phases were allowed to separate. The resulting mixture was measured at 520 nm with a spectrophotometer according to Bates et al. [47].
After harvest, samples of seeds were randomly taken to determine the protein content. A known weight of the finely powdered seeds (0.1 g) was digested using the micro-Kjeldahl method and oil% according to AOAC [48].

2.6. Determination of Irrigation Water Volume (IW)

Irrigation water was measured by a flow meter installed in the water delivery unit of the irrigation pump.

2.7. Productivity of Irrigation Water (PIW, kg m−3)

Productivity of irrigation water was determined according to Ali et al. [49].
PIW = Y/IW
where:
  • PIW = productivity of irrigation water (kg m−3);
  • Y = marketable yield, kg (seed yield or oil yield or protein yield);
  • IW = irrigation water applied (m3).

2.8. Economic Evaluation

The economic evaluation of the interaction between irrigation levels and weed control treatments was employed was described by Cimmyt [50].
  • Gross income = yield t ha−1 × price of ton.
  • Net income (NI) = Gross income − Total costs.
  • Profitability (P) = (Net income/Total costs) × 100.
  • Benefit/cost ratio (B/C) = Gross income/Total costs.

2.9. Correlation Analysis

The correlation analysis was carried out to study the relationship between the dry weight of two categories of weeds (broad-leaved and grassy weeds), their total weeds, and soybean yield as well as its components according to Steel and Torrie [51].

2.10. Statistical Analysis

Analysis of variance was performed for the strip plot design according to Gomez and Gomez [52] using MSTATC computer software. Data mean values were compared with Duncan’s multiple range.

3. Results

3.1. Herbicide Efficacy

The data in Table 6 show that Corchorus olitorius, Xanthium strumarium, Amaranthus retroflexus, Hibiscus trionum, Portulaca oleracea, and Sida alba as annual broad-leaved weeds were susceptible (S) with scores of 91–96%, and Echiomnchloa colonum and Dinebra retroflexa, as annual grasses, were susceptible (S) and moderately susceptible (MS) with scores of 87–87%, respectively, by imazethapyr 60% at 57.12 g a.i. ha−1 (T4), as post-emergence. Bentazon 48% at 571.2 g a.i. ha−1 was the second most effective herbicide which gave a score of 90% (S) for Portulaca oleracea and moderately susceptible (MS) for the remining of the broad-leaved and grassy weeds (81–98%). The herbicides pendimethalin 45.5% at 1624.2 g a.i. ha−1 and oxyfluorfen 24% at 427.2 g a.i. ha−1 (T2), each as post-sowing, were moderately susceptible (MS) for all studied weeds with scores from 81–98% for broad-leaved weeds and 85–98% for grassy weeds (the first season). The second season data showed similar results as those observed in the first season with very minor differences.

3.2. Effect of Irrigation Levels, Weed Control Treatments and Their Interactions
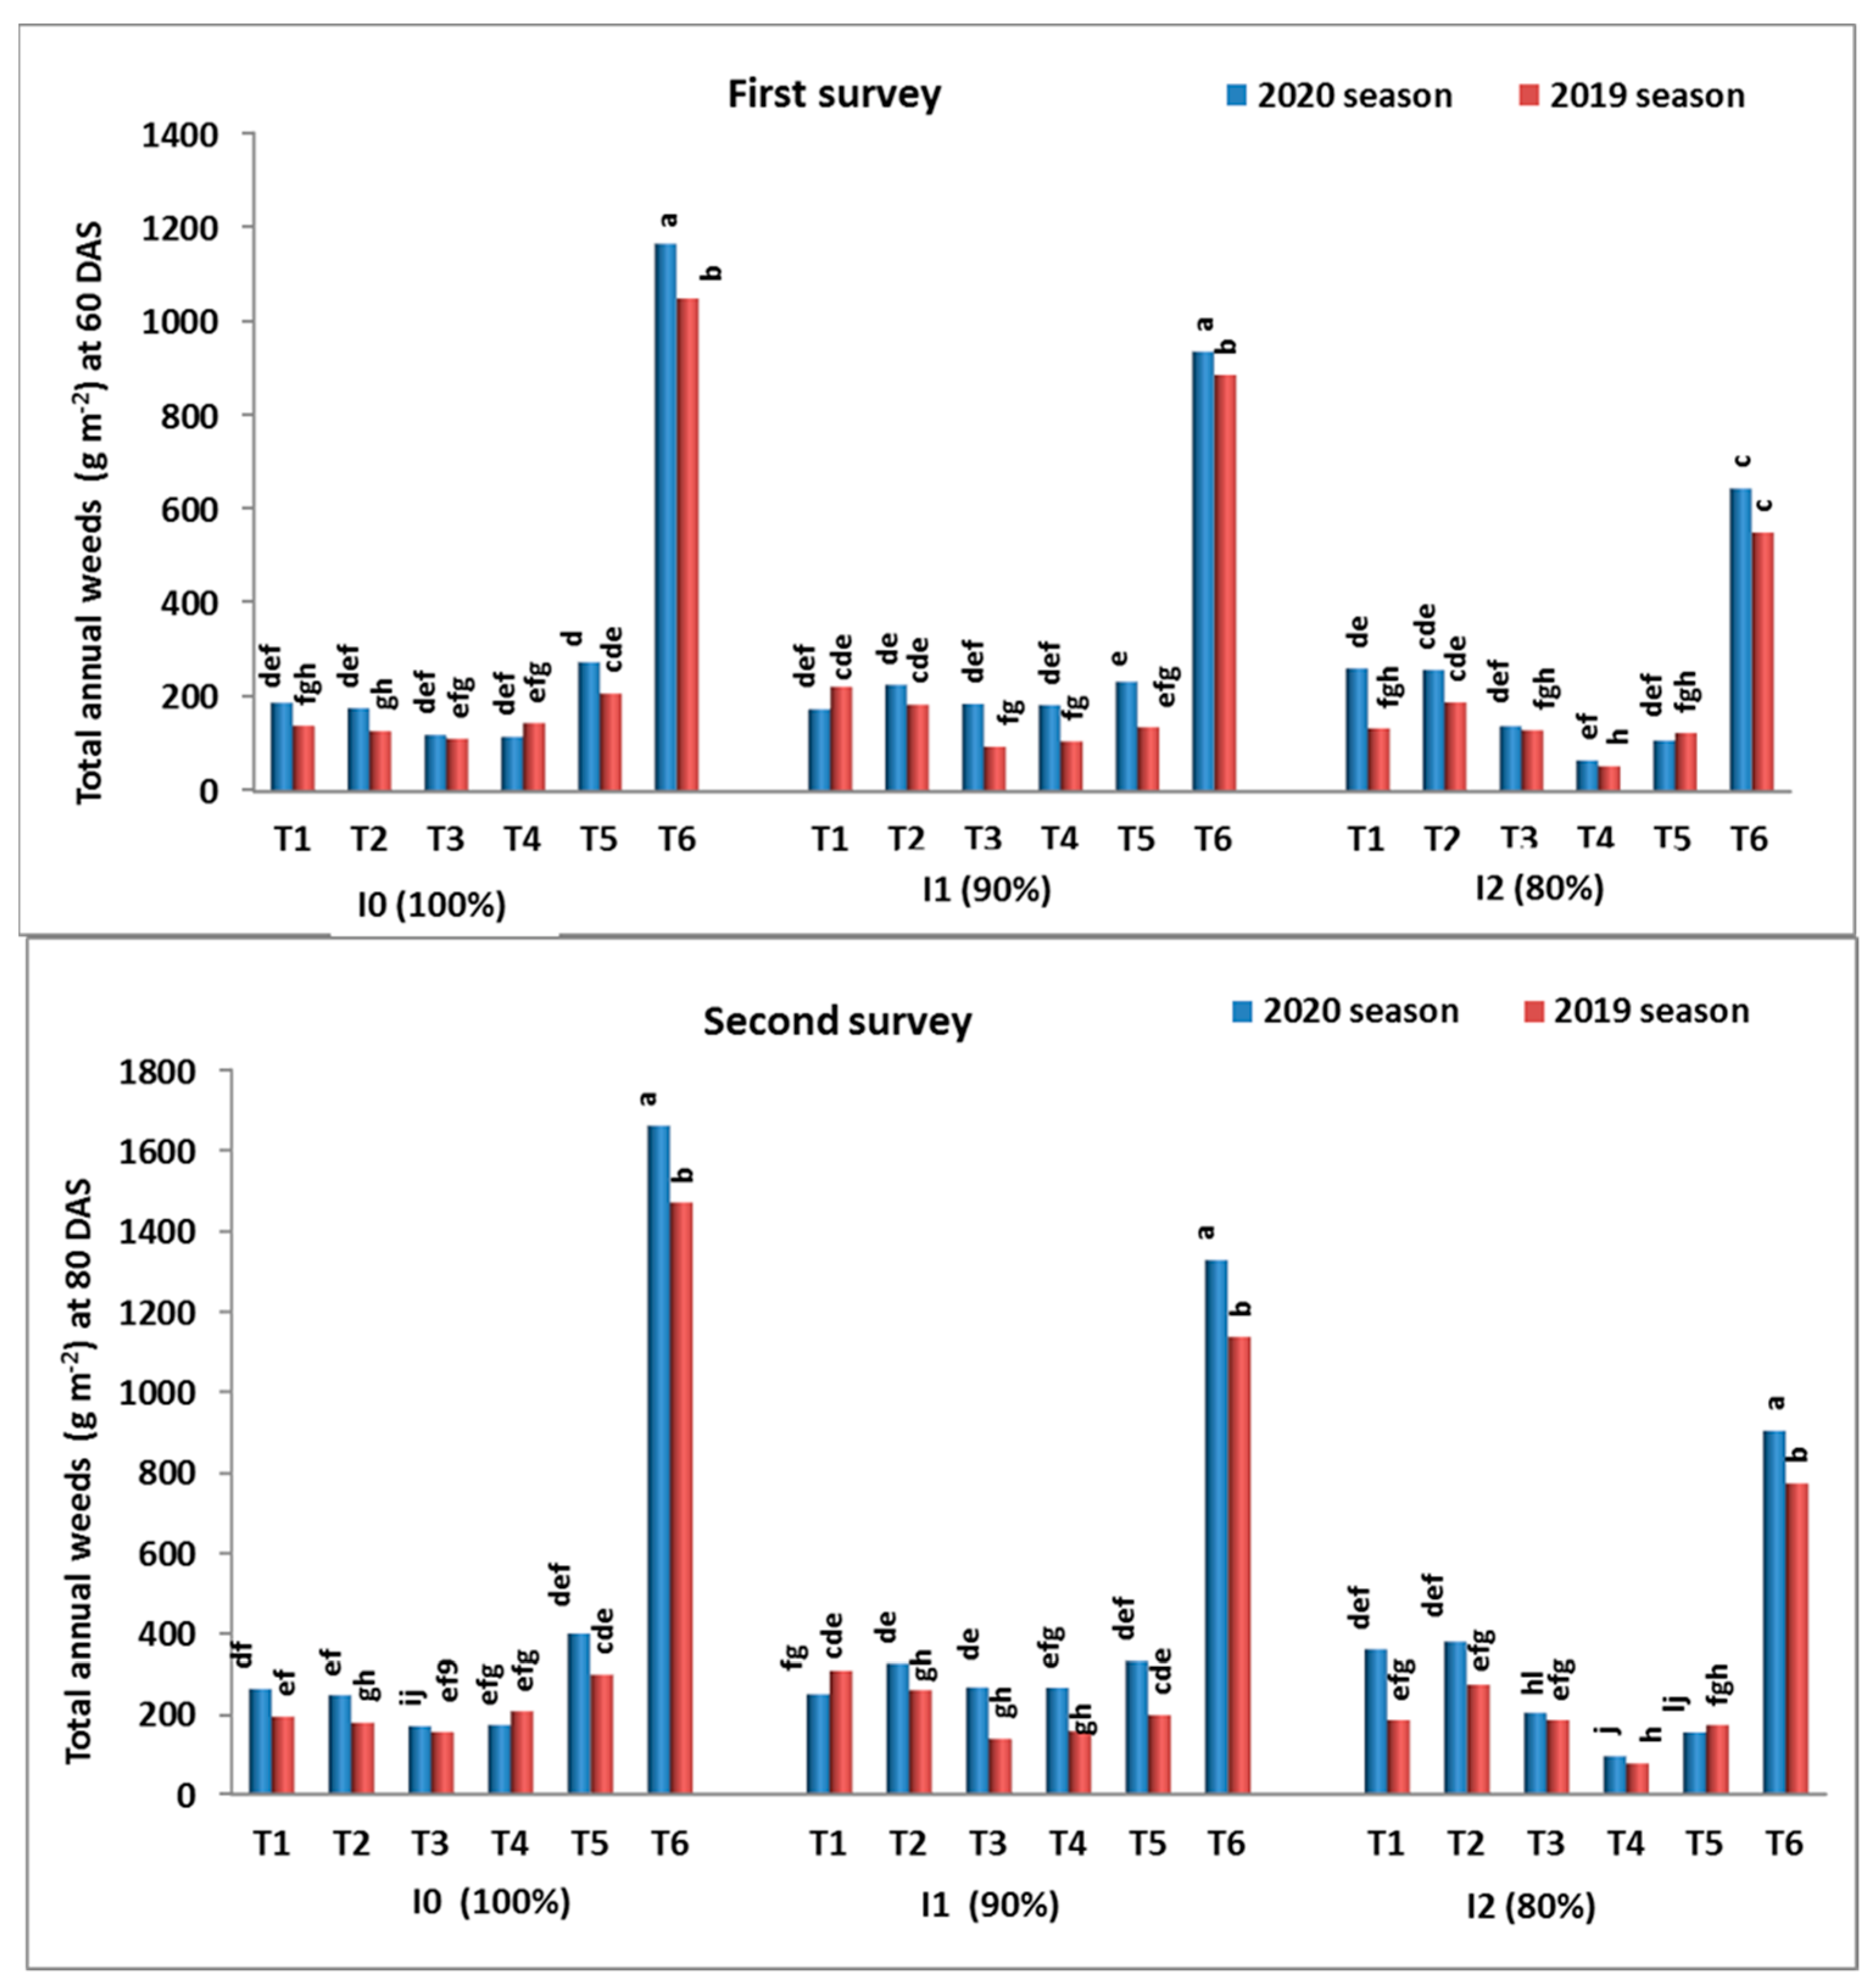
3.2.1. Annual Weeds

Water deficit led to a significant effect on the two categories of weeds (broad-leaved and grassy weeds) as well as the total dry weights of associated weeds of soybean. For this connection, the irrigated soybean plants with a 100% irrigation level showed increases in the dry weight of annual weeds (broad-leaved, grassy, and total weeds), followed by the irrigation treatment of 90% (Table 7). However, the application of 80% of water requirements gave the lowest dry weight values of annual weeds. Reducing irrigation levels from 100% to 80% led to decreases in the dry weight of broad-leaved, grassy, and total weeds by (34.3 and 22.0%), (32.2 and 35.2%), and (33.7 and 27.9%) in the two surveys in the 2019 and 2020 seasons, respectively. The obtained results in Table 7 also indicated that the amount of weed infestation in annual weeds reached 8.28 and 9.14 t ha−1 (dry weight) in the first survey in 2019 and 2020 seasons, respectively. All weed control treatments led to a significant decrease in the two categories of annual weeds (dry weight g m−2) compared to the untreated check in the two surveys in the 2019 and 2020 seasons. As averaged in the two surveys, imazethapyr at 57.12 g a.i. ha−1 as post-emergence (T4) significantly decreased the dry weight of broad-leaved weeds, grassy weeds, and their total weeds by 91.3, 79.0, and 87.6%, respectively, in the first season and 91.1, 80.2 and 86.6%, respectively, in the second seasons making it the best of overall treatments. Bentazon at 571.2 g a.i. ha−1 + clethodim at 372.2 g a.i. ha−1 (T3) as post-emergence reduced broad-leaved weeds by 87.8 and 85.7% in the 2019 and 2020 seasons, respectively, making it the best treatment for of broad-leaved weeds. The most effective treatment for reducing grassy weeds was pendimethalin at 1624.4 g a.i. ha−1 (T1) by 88.8 and 87.4 in 2019 and 2020 seasons, respectively. The other two treatments, hand-hoeing twice and oxyfluorfen 427.2 g a.i. ha−1 (T2) as pre-emergence, gave the lowest reduction of the two weed categories of total weeds.
Significant interactions were found between irrigation levels and weed control treatments on the total dry weight of (broadleaved and grasses) after 60 and 80 days in the 2019 and 2020 seasons (Figure 2). Application of 90% or 100% of irrigation levels in combination with imazethapyr WG 60% at 57.12 g a.i. ha−1 (T4) and/or bentazon AS 48% at 571.2 g a.i. ha−1 + clethodim EC 12.5% at 372.2 g a.i. ha−1 (T3) exhibited the highest weed control efficacy in soybean plants. In the untreated check T6, weeds exhibited higher dry weight with the irrigation treatment of 100% than 90%. Therefore, 90% of water requirement (I1) combined with imazethapyr WG 60% at 57.12 g a.i. ha−1 (T4) improved weed control and gave soybean plants the chance to grow well with less weed competition than at a 100% irrigation level over the two surveys.

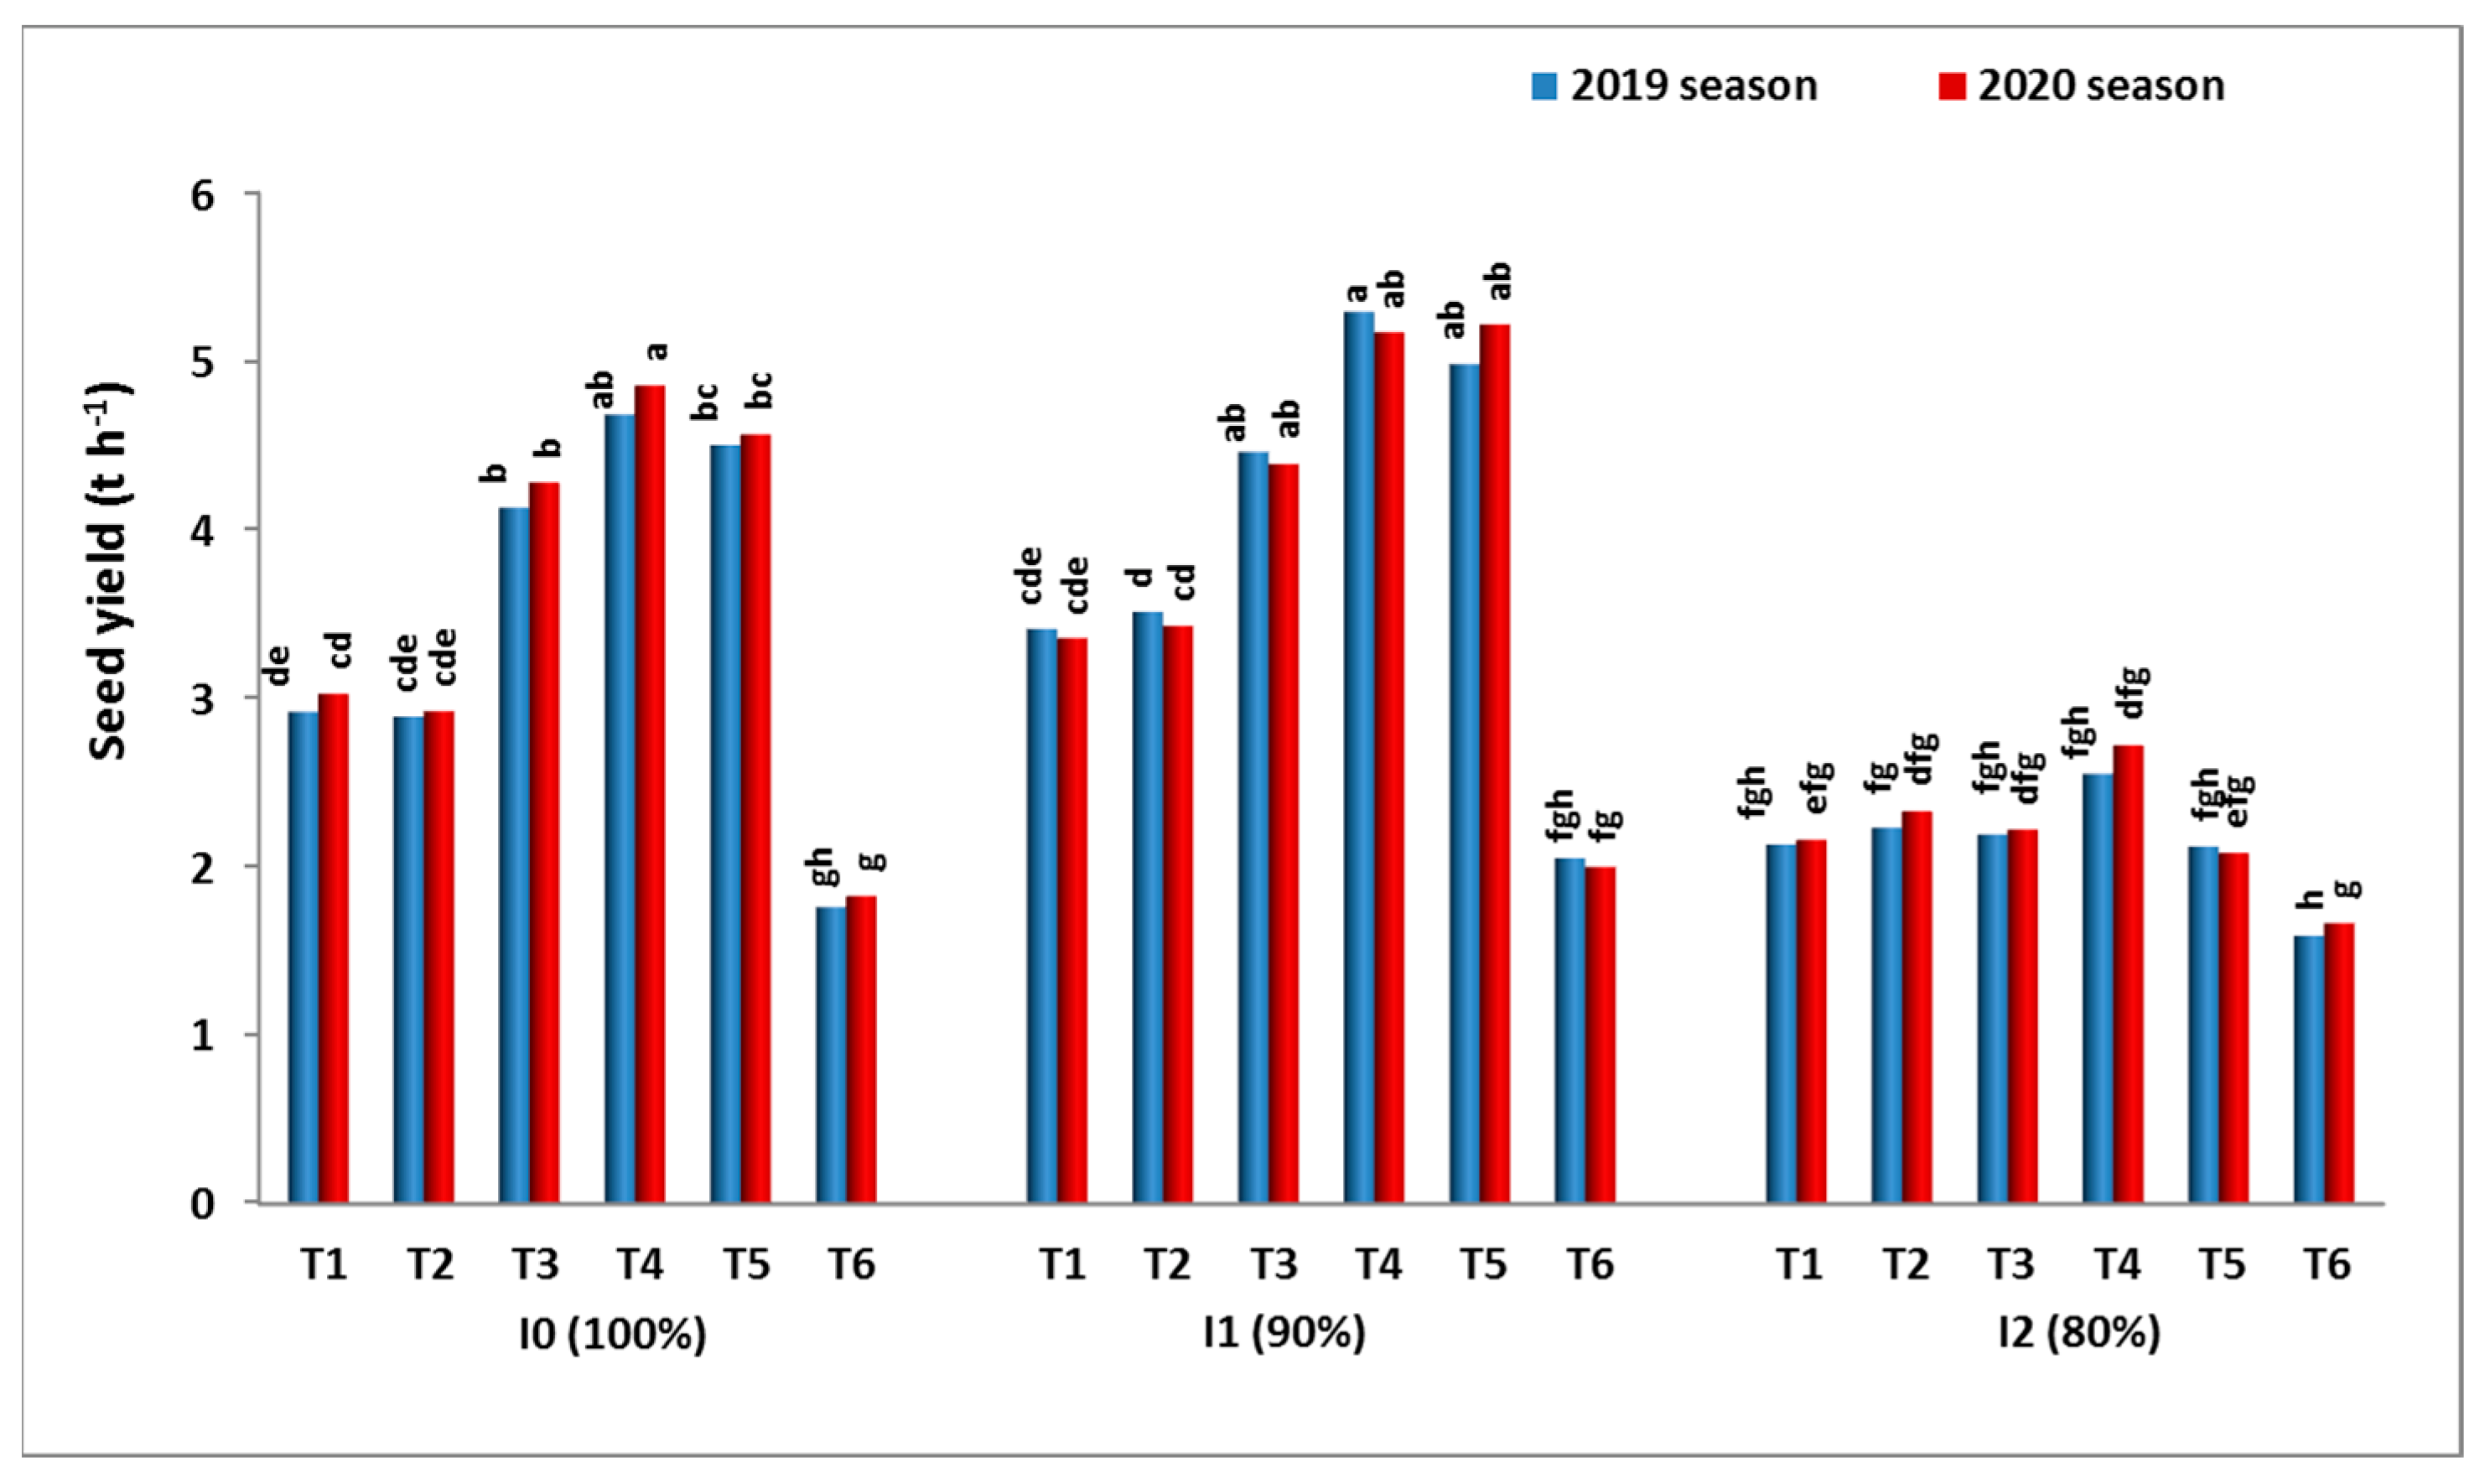
3.2.2. Soybean Yield and Its Components

The data presented in Table 8 show that there was a significant effect of the treatments on plant height (cm), number of branches plant−1, weight of seeds plant−1 (g), and weight of 100-seeds (g) as well as seed yields (ton ha−1). Application of 100% or 90% of irrigation levels led to the maximum values of previous growth characteristics and yield of soybean and the three water irrigation levels I1 > I0 > I2 over the 2019 and 2020 seasons. I1 was the superior treatment and gave the highest values of plant height (116.3 cm), number of branches per plant (15.7), 100-seed weight (15.1 g), seed soybean yield per plant (45.8 g), and seed yield (2.45 t ha−1). The 80% irrigation level recorded the lowest values of the previous characteristics, i.e., 101.9 cm, 4.8, 13.8 g, 34.3 g, and 2.14 t ha−1, respectively, over the two seasons. Moreover, the results indicated no significant differences between 100% and 90% of irrigation levels, which indicates a 90% level application was optimal. The effect of weed control treatments resulted in a significant increase in growth characteristics and soybean yield in the 2019 and 2020 seasons. Averaged over the two seasons, the highest increasing percentage of plant height, number of branches/plants, 100-seed weight, seed yield/plant, and seed yield t ha−1 was obtained by T4 imazethapyr at 57.12 g a.i. ha−1 (114.8 cm, 6.3, 16.5 g, 44.0 g, and 4.18 t ha−1) followed by hand-hoeing twice (116.5 cm, 5.5, 15.1 g, 40.9 g, and 3.87 t ha−1). The other weed control treatments increased the growth characteristics and soybean yield incrementally by T3 > T2 > T1 for a number of branches/plants, 100-seed weight, seed yield/plant, and seed yield t ha−1; except for plant height T1 > T2 > T3 (Table 8).
The interactions between the three irrigation levels and weed control treatments increased the seed yield of soybean plants (Figure 3). The highest value of seed yield was obtained with the interactions between the 90% (I1) irrigation level and imazethapyr WG 60% applied at 57.12 g a.i. ha−1 (T4), compared to the untreated check and the 80% irrigation level. The interactions between the three water irrigation levels and the remining herbicidal treatments (each of T3, T1, and T2) gave the following increasing values of seed yield of soybean plants. The lowest soybean yield was obtained with the untreated check and 80% of water irrigation requirement. The highest increase in seed yield was obtained by the interactions between the three water irrigation levels and T4 and T5. However, the interactions among the three water irrigation levels and the other herbicidal treatments (each of T3, T1, and T2) resulted in increasing values of seed yield of soybean plants.

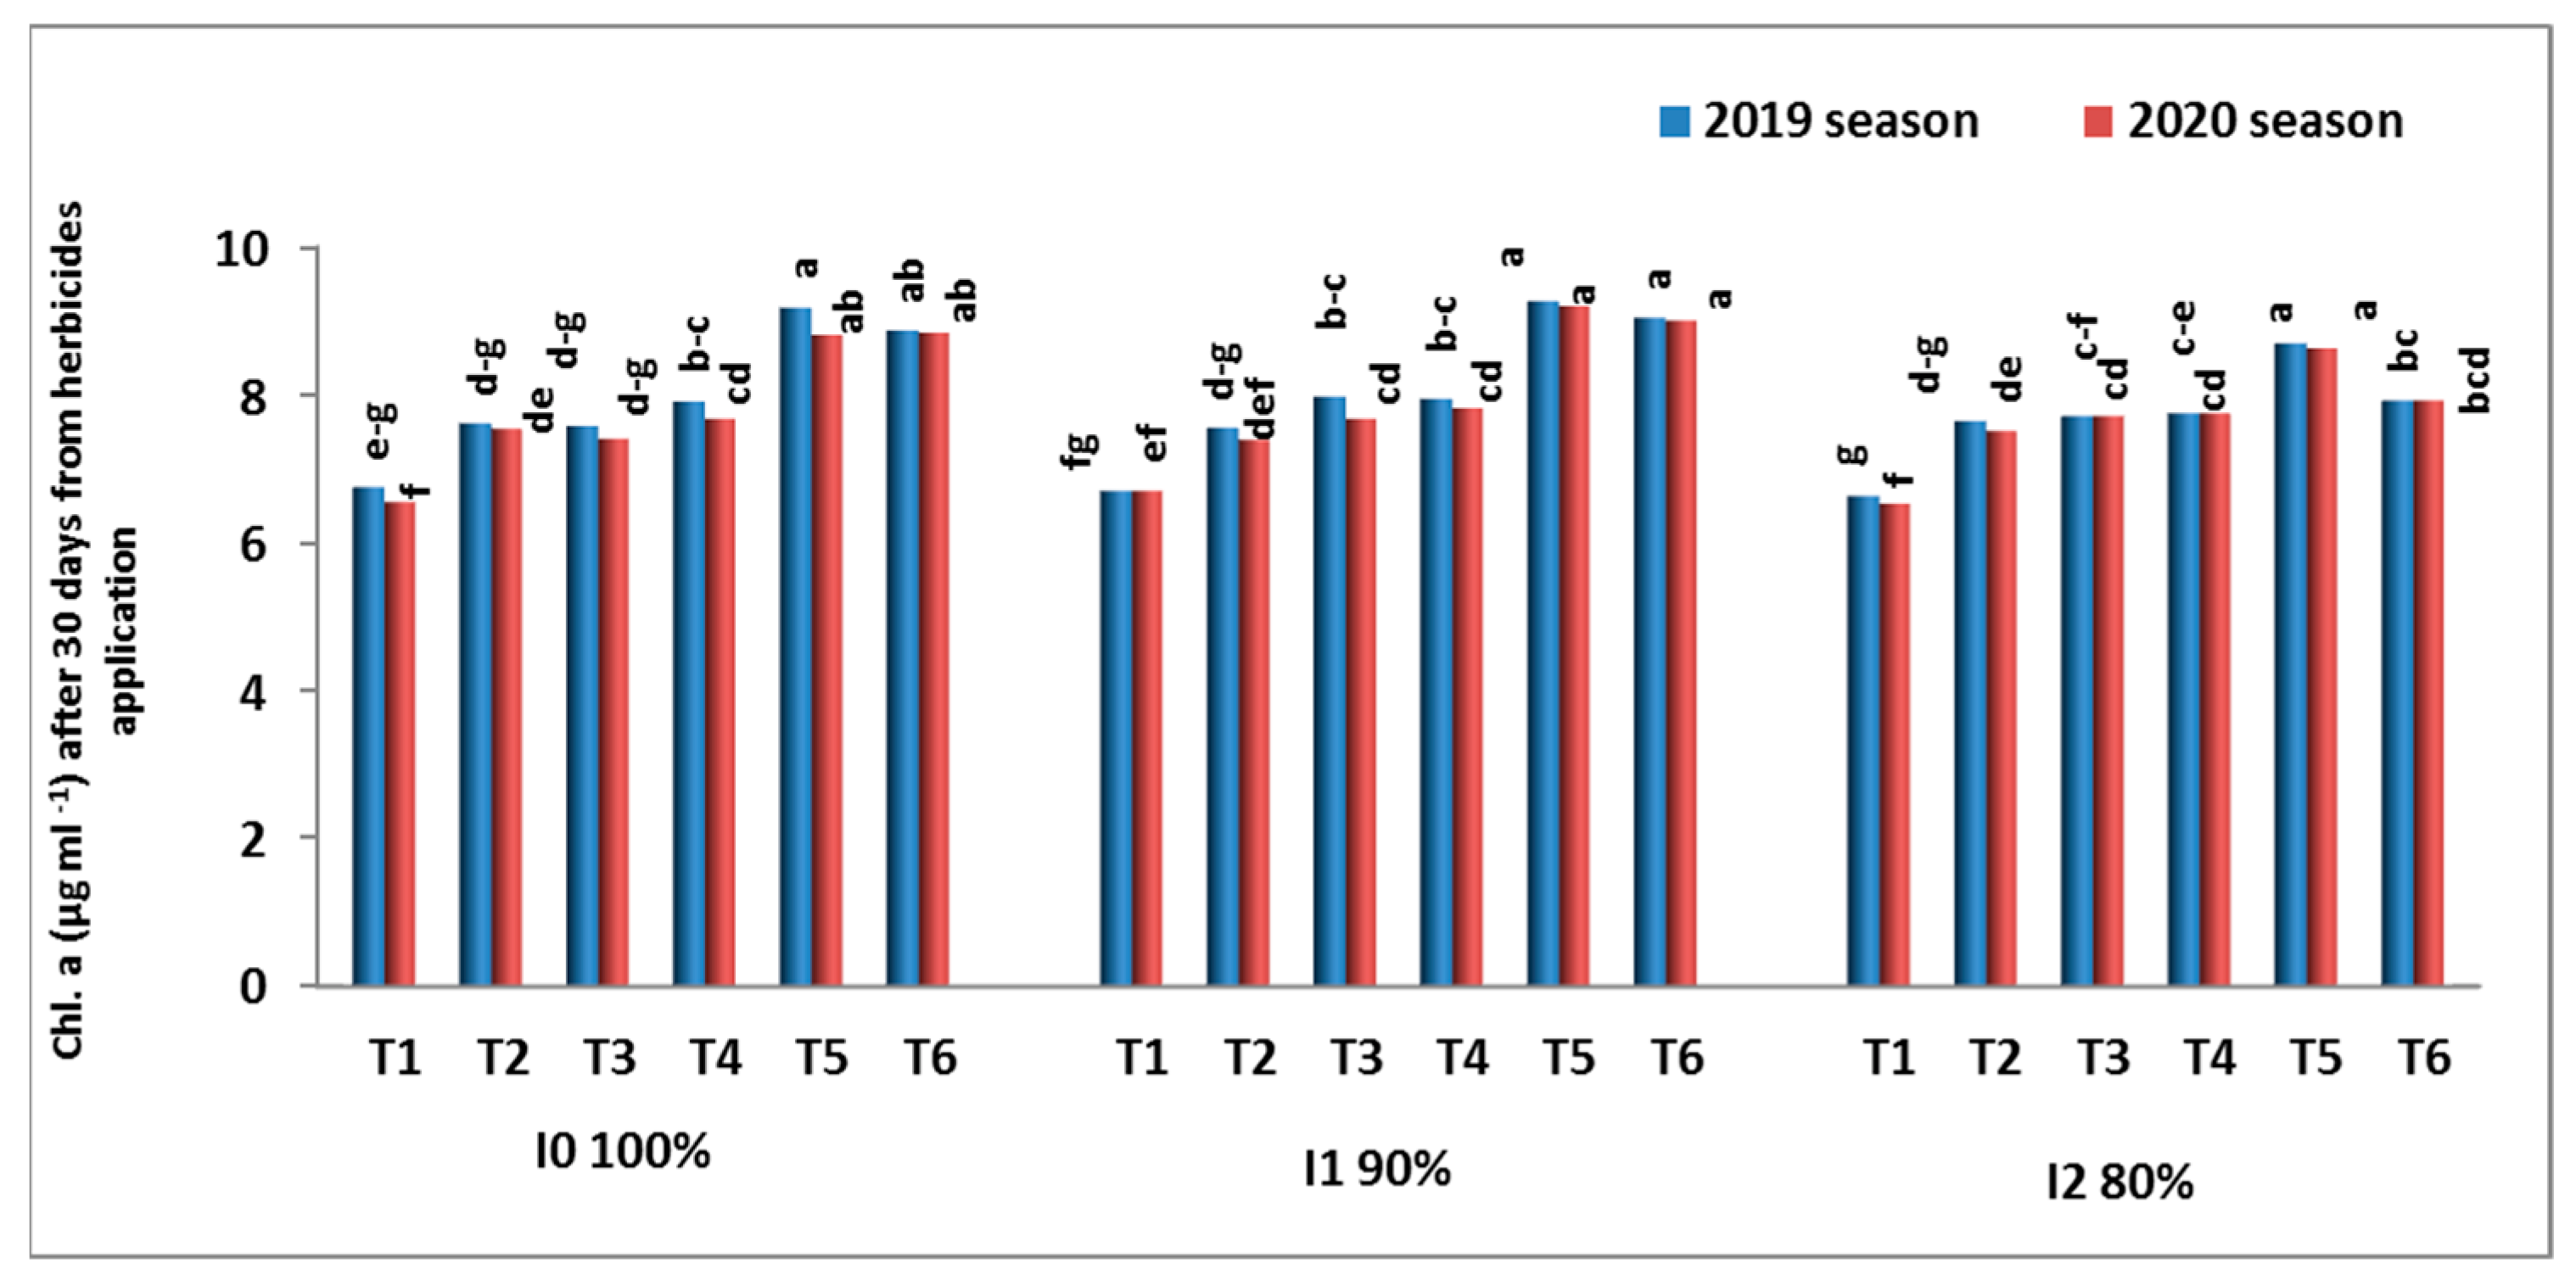
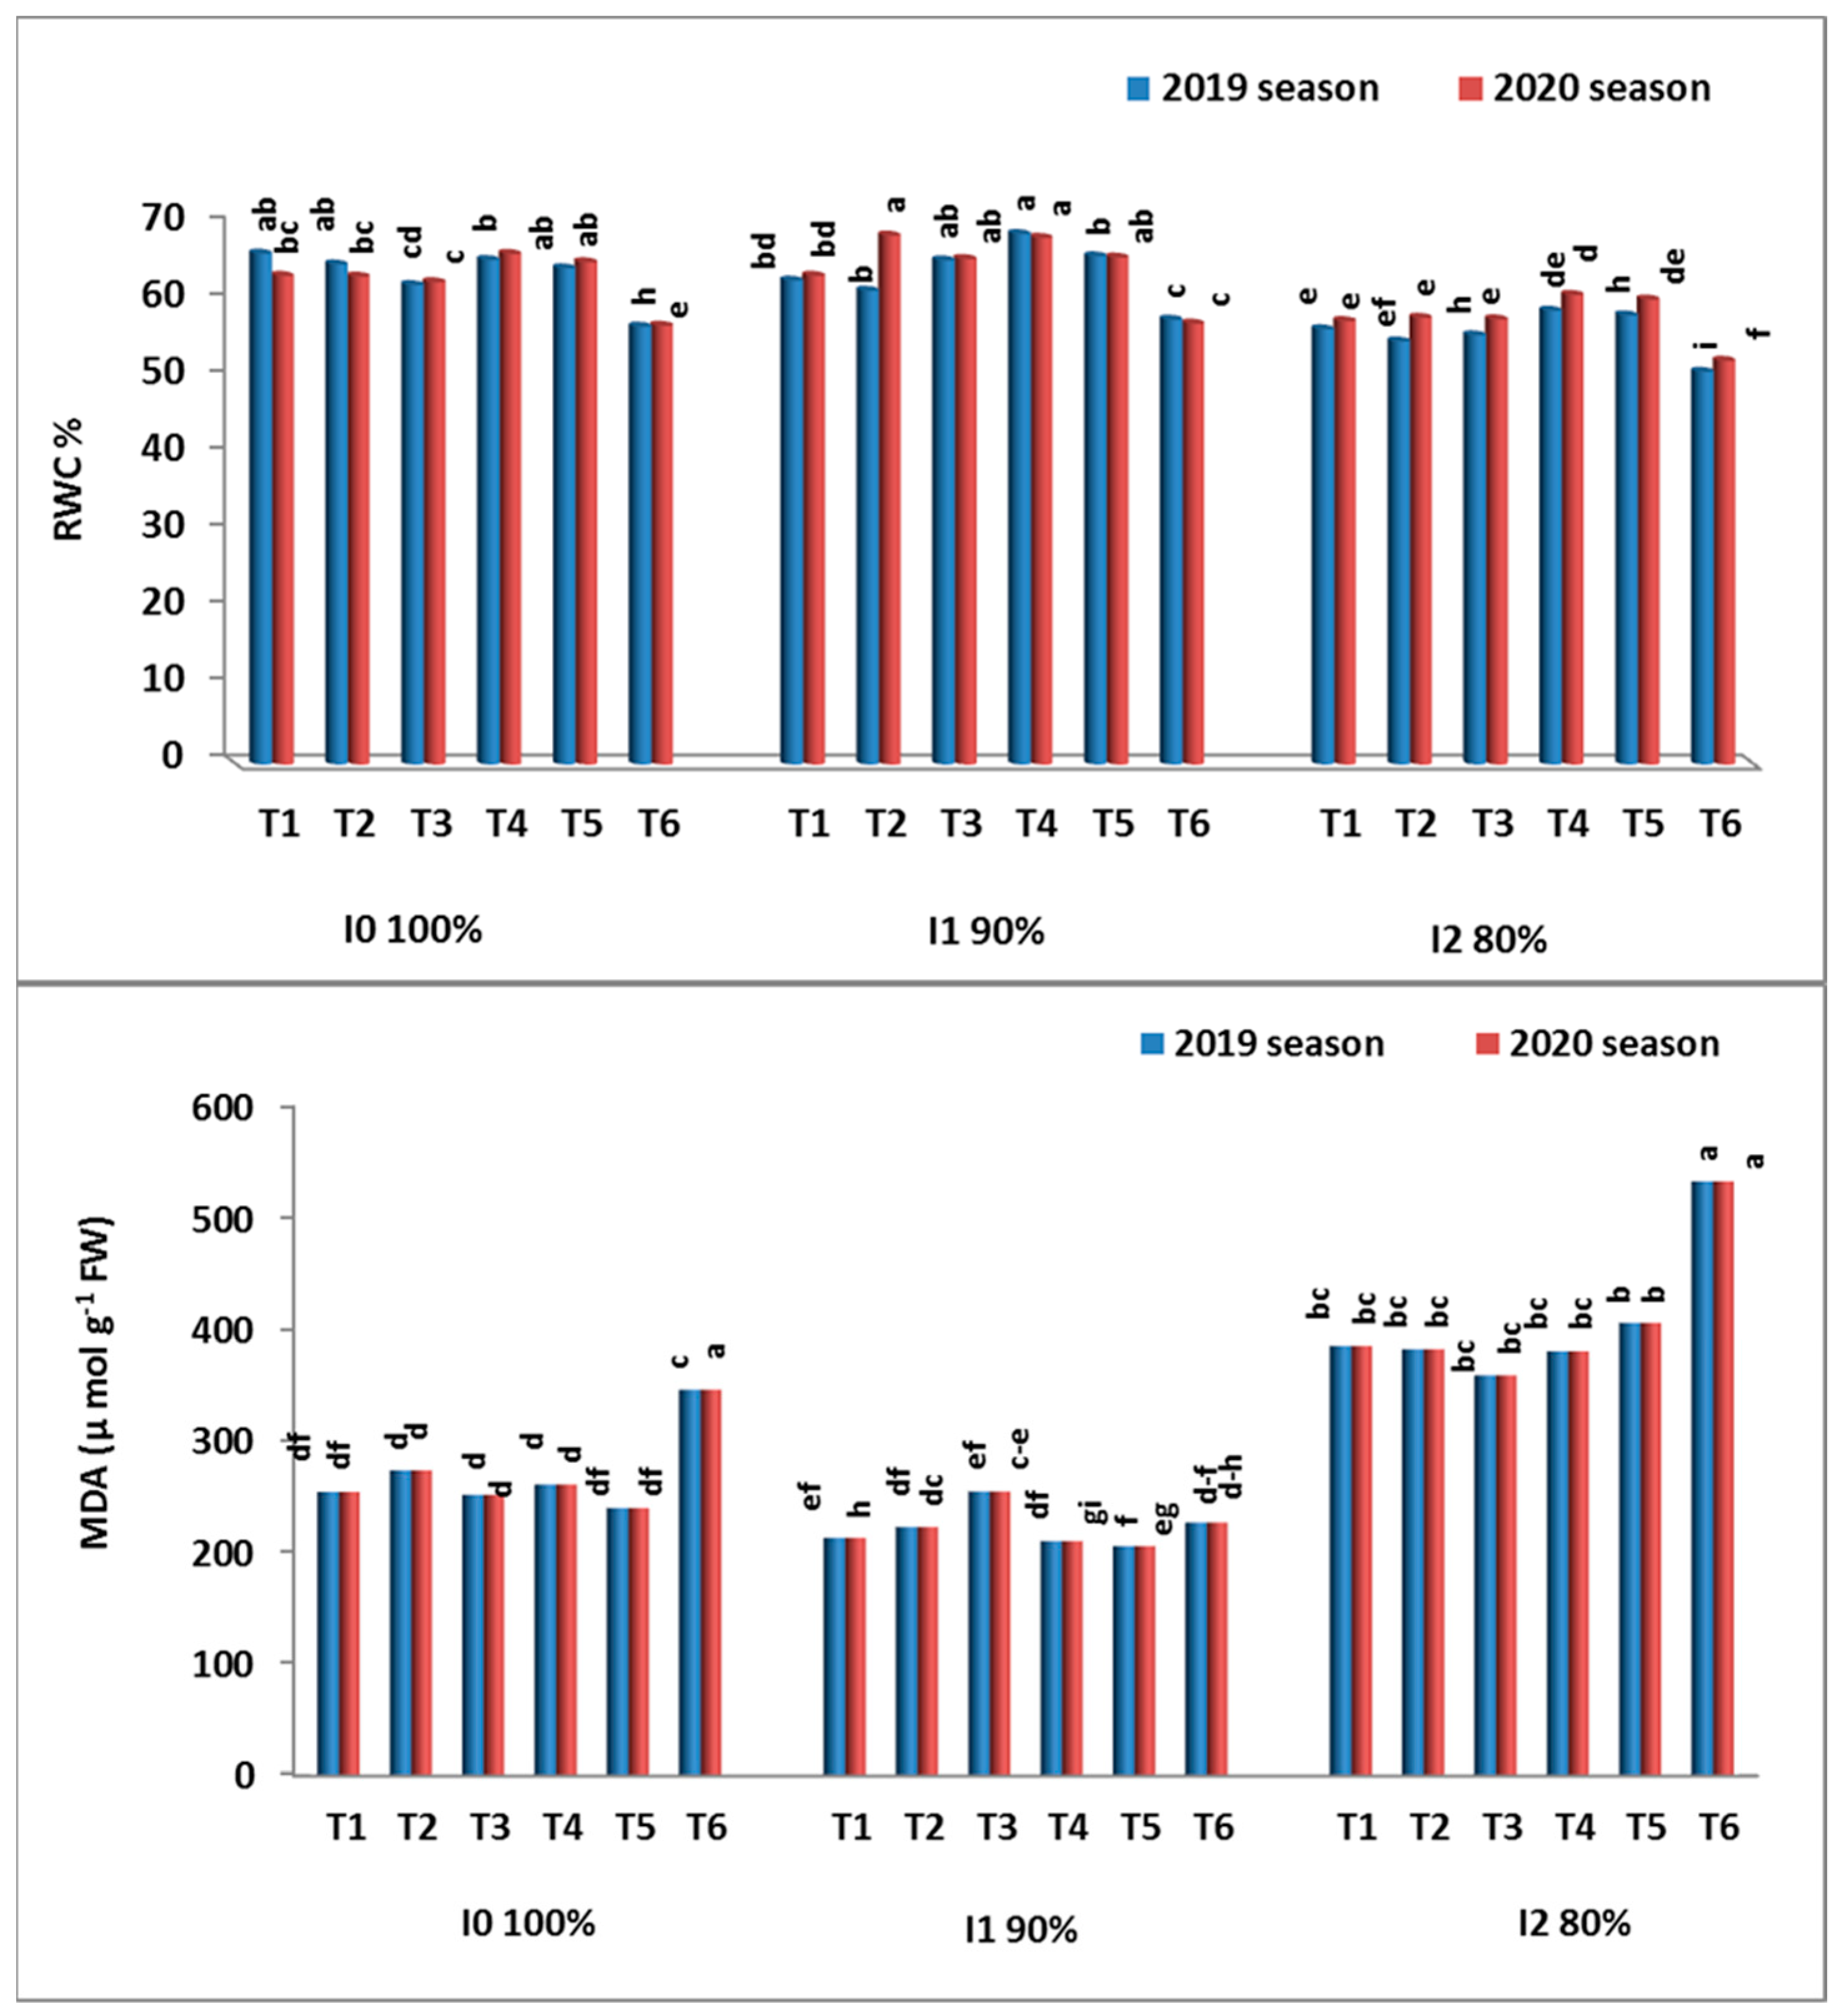
3.2.3. Physiological and Biochemical Characteristics

The results presented in Table 9 and Figure 4 showed no significant differences among the three irrigation levels on both Chl a and b in the first sample (30 days from application) in the two seasons, while significant differences between them were observed in the second sampling (60 days after application), where I1 (90%) recorded the highest concentrations of Chl a (10.25 and 9.12 µg mL−1) and Chl b (4.44 and 4.40 µg mL−1) in the two seasons, respectively, while I2 (80%) gave the lowest Chl a (8.206 and 7.11 µg mL−1) and Chl b (3.05 and 3.92 µg mL−1) in the two seasons, respectively. Regarding weed control treatments, (T5) hand-hoeing twice recorded the highest values of both Chl a (10.05 and 9.88 µg mL−1) and Chl b (3.73 and 3.80 µg mL−1) in the two seasons, respectively, followed by T6 untreated check treatment (9.62 and 9.59 µg mL−1). Chemical weed control treatments gave the lowest values of chlorophyll pigments a and b in the 2019 and 2020 seasons in the first sample. The results of the second sample (60 days from application) showed that imazethapyr at 57.12 g a.i. ha-1 (T4) and hand-hoeing twice gave the highest values of Chl a (10.38 and 10.03 µg mL−1) in the first season and (10.00 and 9.082 µg mL−1) in the second one and Chl b (4.119 and 4.030 µg mL−1) in the first season and (4.04 and 4.12 µg mL−1) for imazethapyr (T4) and hand-hoeing twice, respectively.
The interaction among the three irrigation levels and the six weed control treatments had significant effects on Chl a (after 30 days from application) in the 2019 and 2020 seasons (Figure 4). The results show that T5 (hand-hoeing twice) recorded the highest concentration of Chl a either at I0 (100%) or I1 (90%), while the lowest values were obtained at T1 pendimethalin at 1624.4 g a.i. ha−1 with any of the three irrigation levels. For the second sample (after 60 days from application), the highest values of Chl a were obtained from T4 imazethapyr at 57.7 g a.i. ha−1 and T5 with I1. The untreated check T6 with the least amount of irrigation levels I2 (80%) recorded the lowest concentration of Chl a in the 2019 and 2020 seasons (Figure 4).
The data in Table 10 and Figure 5 indicate that the highest percentage of RWC% was obtained from I1 (90%) (63.83 and 64.96%), followed by I0 (100%) (63.48 and 63.08%) in the two seasons, respectively, with no significant differences between them. While I2 (80%) recorded the lowest values (55.98 and 57.94%) in the two seasons, respectively. Concerning weed control treatments, imazethapyr at 57.12 g a.i. ha−1 (T4) and hand-hoeing twice (T5) had the highest percent of RWC with no significant differences between them, while the lowest percentages were obtained from the untreated check (55.28 and 54.63%), in the two seasons, respectively. Malondialdehyde (MDA) increased under water deficit, where the highest MDA values were recorded from I2 (80%) (407.2 and 365.7 µmol g−1 FW) in the 2019 and 2020 seasons, respectively. I1 (90%) recorded the lowest values (221.9 and 275.8 µmol g−1 FW) of MDA in the two seasons, respectively. No significant differences were observed among chemical weed control treatments in the 2019 and 2020 seasons, while untreated check treatment gave the highest values (368.3 and 413.1 µmol g−1 FW) and ranked first in the 2019 and 2020 seasons.
Regarding proline content and CAT activity, the results in Table 10 indicate no significant differences between I0 (100%) and I1 (90%) in the 2019 and 2020 seasons, but I2 (80%) differed significantly and gave the highest proline content and the highest activity of CAT. Hand-hoeing twice T5, followed by T4, recorded the highest values of proline content and CAT in the first season but in the second season, there were no significant differences among the four herbicidal treatments, while T6 treatment had the lowest contents of both proline and activity of CAT and ranked last in the 2019 and 2020 seasons.
The interaction effect between irrigation levels and weed control treatments on RWC % also exhibited significant differences in the 2019 and 2020 seasons (Figure 5). The highest percentage of water content in soybean leaves was recorded with imazethapyr at 57.7 g a.i. ha−1 T4 and T5 with I1 (90%) in the first season and in the second season, T2, T4, and T5 gave the best percentage of RWC. The lowest value in the 2019 and 2020 seasons was for the untreated check T6 with irrigation level I2 (80%). The results presented in Figure 4 show that T6 with the third irrigation level I2 (80%) in the first season, gave the highest MDA content which is considered an indicator of the degree of injury to the cell membrane as a result of the adverse effects of both water deficit and weeds on plants.

3.2.4. Chemical Composition of Seeds

The results presented in Table 11 indicate that the oil% was decreased under water deficit treatments whereas the highest percentage in the two seasons (22.57 and 22.31%) was obtained from I1 (90%). Protein content significantly increased by decreasing the amount of irrigation water and the highest values (37.94 and 38.14%) were obtained from I2 (80%). All weed control treatments recorded high values of oil% compared to the untreated check over the two seasons; conversely, the lowest values of protein were observed in all weed control treatments in both seasons, while the untreated check gave the highest percentage of protein in both seasons.

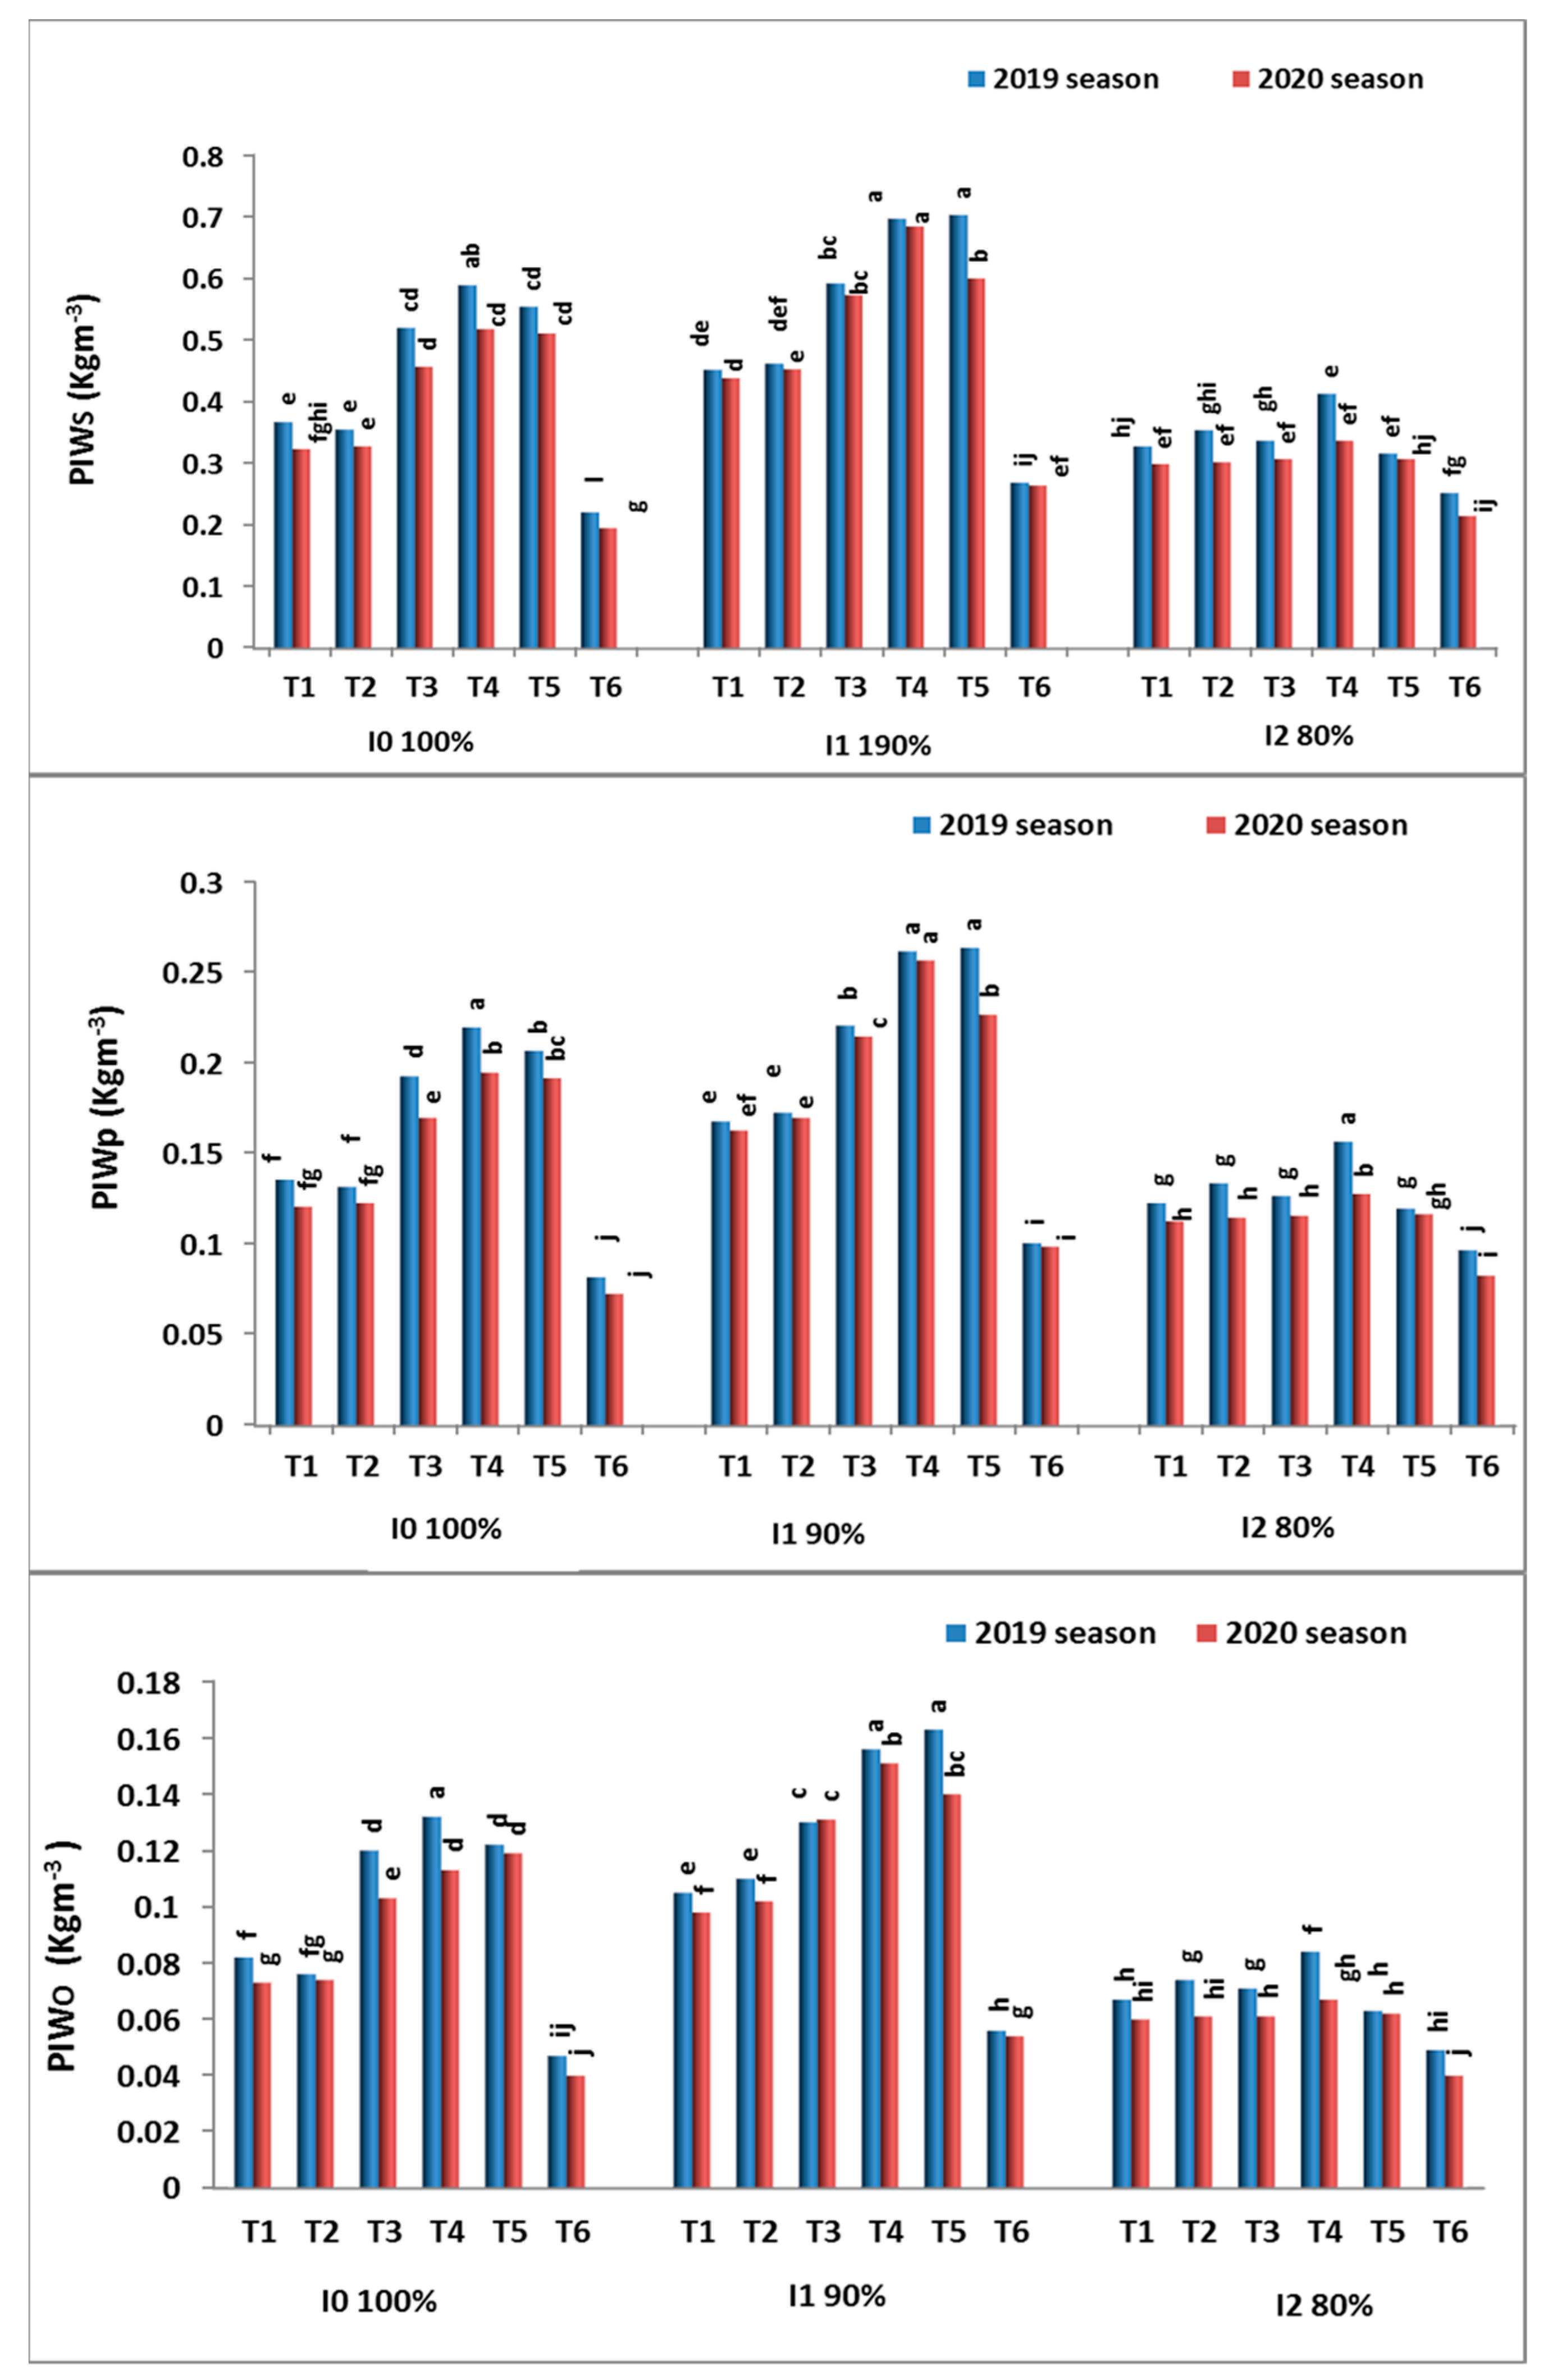
3.2.5. Effect on Productivity of Irrigation Water (PIW, kg m−3)

The productivity generated by irrigation water via three parameters is dependent on seed yield (PIWs), oil yield (PIWo), and protein yield (PIWp). The data presented in Table 12 and Figure 6 reveal that the average values in the 2019 and 2020 seasons for PIW were affected by both irrigation treatments and weed control treatments. The highest average values were registered with irrigation treatment I1 (90%) with imazethapyr at 57.7 g a.i. ha−1 treatment T4, in the 2019 and 2020 seasons, and the values for PIWs, PIWo and PIWp were 0.603, 0.135, and 0.226 kg m−3, respectively. Meanwhile, the lowest outright average values were under irrigation level I0 with untreated check treatment T6 (0.191, 0.038, and 0.067 kg m−3) for PIWs, PIWo, and PIWp, respectively. Generally, the outright average values for PIW progressed in the order I1 > I0 > I2 and the outright average values for productivity of irrigation water (PIW) were 0.450, 0.355, and 0.271 kg m−3 under PIWs, 0.102, 0.079, and 0.055 kg m−3 under PIWo, and 0.169, 0.133, and 0.103 kg m−3 under PIWp, respectively. Concerning the effect of weed control treatments, the highest average values for (PIW) were observed under T4 imazethapyr at 57.7 g a.i. ha−1 with every irrigation treatment. As a rule, the average values for (PIW) descended in order from T4 > T5 > T3 > T2 > T1 > T6 (Figure 6).
The highest average PIWs, PIWo and PIWp values were observed for irrigation treatment I1 (90%) with imazethapyr at 57.7 g a.i. ha−1 treatment T4, in the 2019 and 2020 seasons and the values were 0.691, 0.154, and 0.259 kg m−3, respectively. Meanwhile, the lowest outright average values were under irrigation level I0 with untreated check treatment T6 (0.208, 0.044, and 0.078 kg m−3) for PIWs, PIWo, and PIWp, respectively. Generally, average values for PIW were observed progressively in the order I2 > I0 > I1 and the outright average values for productivity of irrigation water (PIW) were 0.516, 0.412, and 0.314 kg m−3 under PIWs, 0.116, 0.091, and 0.063 kg m−3 under PIWo, and 0.193, 0.154, and 0.119 kg m−3 under PIWp, respectively. Concerning the effect of weed control treatments, the highly outright average values for (PIW) were present under T4 imazethapyr at 57.7 g a.i. ha−1 with every irrigation treatment. As a rule, the outright average values for (PIW) descended in order fromT4 > T5 > T3 > T2 > T1 > T6 (Figure 6).

3.2.6. Economic Evaluation

The results in Table 12 show that the minimum total cost was obtained with all weed control treatments under irrigation I1 followed by I0 irrigation. However, all weed control treatments under I1 irrigation gave the highest values of the studied economic criteria mainly due to the criteria of soybean yield. Imazethapyr at 57.7 g a.i. ha−1 under I1 irrigation increased the cross income, net return, profitability, and benefit/cost ratio, by 2.515, 1.160 thousand US/ ha−1, 85.6%, and 1.86, respectively, and the treatments of hand-hoeing twice under I1 irrigation gave the previous values, respectively, charity by 2.445, 0.882 thousand USD/ha−1, 56.4, and 1.56%, and bentazon at 571.2 g a.i. ha−1 + clethodim at 372.5 g a.i. ha−1 under I1 irrigation level gave values of 2.110, 0.736, thousand USD/ha−1, 53.6, and 1.54%, respectively, during the two seasons.

3.2.7. Correlation Analysis

The data presented in Table 13 indicate that the correlation coefficient among the dry weight of broad-leaf weeds, grassy weeds, and total weeds and soybean yield was statistically significant and inversely proportional by −0.481, −0.313, and −0.440 t ha−1 and −0.482, −0.331, and −0.432 t ha−1, respectively, in the 2019 and 2020 seasons, at 1% and/or 5% proportionality that reflected the yield components reduction. Nevertheless, the correlation coefficient among yield components, i.e., plant height (cm), number of branches/plants, seed yield/plant, 100-seed weight, and seed yield t ha−1 was directly proportional by 0.402, 0.684, 0.615, and 0.616 t ha−1 in 2019 and 0.585, 0.710, 0.515, and 0.607 t ha−1 in the 2020 season, respectively. Hence, weed control plays a major role in increasing soybean productivity if applied at the suitable time, rate, and stage of weed growth.

4. Discussion

Our results revealed that increased irrigation levels led to increased dry weights of accompanying weeds; furthermore, 100% irrigation recorded the highest values of the total dry weight of weeds in both seasons. Moreover, there was a significant reduction with the 80% irrigation level in the two weed categories, which may be due to the fact that an irrigation level of 100% can encourage weeds to emerge early and require hand-hoeing twice [23]. The decrease in the dry weight of total weeds could be due to the reduction in weed growth as an adaptive strategy in response to water deficit [53]. These results are consistent with El-Metwally et al. [54]. Our results indicate that all chemical herbicides at pre and/or post-emergence were effective compared to the untreated check. The reduction in dry weight of broad-leaved and grassy weeds may be ascribed to the inhibitory influence of herbicidal treatments on the growth stages and development of associated weeds [34,53]. We showed that the imazethapyr (T4) and/or bentazon + clethodim (T3) with I1 treatment gave the highest percent reduction in dry weight of annual weeds at 60 and 80 days after sowing (DAS). Moreover, the application of 90% irrigation water (I1) combined with T4 led to improved control of weeds and gave soybean plants the opportunity to grow well without weed competition in the two surveys. This reduction in the dry weight of weeds may be attributed to the inhibitory effect of treatments on the growth stages and development of associated weeds. These results are consistent with El-Metwally et al. [54], Masoumi [27], and Chowdhury et al. [23].
The control of total weeds during the crucial period for the first soybean growth stages gave the highest values of soybean yield and increased seed production. We showed there was a significant effect on growth characteristics and yield of soybean in the 2019 and 2020 seasons. I1 was the superior treatment and gave the highest values of growth characteristics and soybean yield. In contrast, using I2 resulted in the lowest values. This result may be attributed to less irrigation water, the rate of soil water absorption by plants becomes less than the rate of evapotranspiration, consequently leading to reduced photosynthesis, decreased seed filling, and decreased seed yield may occur [34]. The application of 100% or 90% of water requirement provides soybean plants with sufficient irrigation levels with necessary nutrients for the processes of cell division and enlargement as well as for meristematic activity [17]. All herbicide treatments were effective on broad-leaved and grassy weeds and led to a significant decrease in dry weight while increasing the seed yield of soybean compared to the control (untreated check). The application of imazethapyr caused a reduction in the dry weight of weeds and was found to be superior for controlling both grassy and broad-leaved weeds in soybean. By contrast, the untreated check produced the lowest yield of soybean, due to the heavy infestation of weeds, especially broad-leaved weeds, which grow faster and suppress crop growth, thus causing a reduction in yield [36]. This efficacy of imazethapyr led to improve the soybean yield and its components. Furthermore, I1 and T4 gave high values compared to I2 and T6 in the two surveys during the 2019 and 2020 seasons. Such treatments with imazethapyr combined with optimal irrigation constitute promising weed control treatments to promote soybean yield and can play an important role where labor is too expensive and time is a constraint. These results corroborate the findings of El-Metwally et al. [36].
Chlorophyll a and b are the main pigments of absorption, transport, and conversion of light energy; they are important parameters indicating photosynthetic performance. In our study, chlorophyll a and b decreased in both samples and the differences were significant in the second sample. These results may be due to the fact that under water deficit conditions, leaves are damaged and turn yellowish and exceed the production of reactive oxygen species (ROS) which leads to damage of the chloroplasts and a subsequent decrease in chlorophyll content [21]. Hand-hoeing twice and control treatments gave the highest concentration of chlorophyll pigments, while all herbicide treatments caused a significant decrease in both Chl a and b in the early growth stage (first sample). This may have been due to temporarily damage in the roots and/or shoots of soybean plants depending on the mode of action of the herbicide. Conversely, the second untreated sample recorded the lowest chlorophyll content as a result of the increase in weed growth and resulting increase in competition with soybean plants which adversely affected the chlorophyll content in the leaves. Relative water content is an important determinant of metabolic activity in leaves and is closely associated with plant drought tolerance [22,23]. A decreasing amount of irrigation water significantly decreased RWC% as a result of the shortage of available water to the plant. Malondialdehyde (MDA) is a product of membrane lipid peroxidation by ROS; the amount of MDA reflects the degree of cell membrane damage under stress, and this amount increases with decreasing amounts of irrigation water. In this experiment, the highest MDA was obtained from I2 (80%) which led to an increase in membrane permeability and loss in the of the cell’s its ability to control its contents. These results are in harmony with those obtained by Dong et al. [22]. Under water stress, the activities of catalase (CAT) usually increase and CAT plays an important role in the control and scavenging of ROS in the cell, and this decreases the harmful effects on the plasma membrane and the MDA content in the plant [9,17,19,22]. The superiority of weed control treatments T4 and T5 in physiological and biochemical traits may be attributed to their high efficiency in controlling soybean weeds and decreasing the competition between weeds and plants, consequently improving the growth of soybean plants. These results are in agreement with those reported by El-Metwally et al. [54], Lamptey et al. [55], and EL-Sayed et al. [56,57]. The lowest values of all physiological and biochemical characteristics were obtained from I2 with untreated treatments and this may be due to the competition between soybean plants and weeds for available water under shortage of irrigation levels.
Our economic evaluation revealed that the reduction in weed dry weight and the increase in yield production of soybean while improving the quality of seed yield results in an increased economic return. Correlation analysis revealed that the yield increases due to the type of weed group competition were positively contributed to the increases in growth characteristics and yield components. The correlation between total weeds and soybean yield was highly statistically significant and may be due to the fact that plants absorb their optimum water requirement under weed control treatments, leading to improved yield and its components. The values of IW for I1 (90% from crop water requirement) gave the highest yield of soybean, as a result of reduced competition allowing soybean crop to obtain its actual water requirements. Irrigation water was associated with more favorable as long as it was at a volume that discouraged high levels of weed infestation [12]. Generally, diminishing values of irrigation water requirements (IW) resulted in increasing the value of productivity of irrigation water (PIW) (inverse relationship between PIW and IW) and increasing soybean yield (positive relationship between PIW and yield); therefore, increased IW was associated with diminishing average values for PIW [56].

5. Conclusions

Based on our study’s results, it could be concluded that each incremental increase in the irrigation levels was accompanied by an increase in the dry weight of the weeds associated with soybean plants. We found that, 100% or 90% of irrigation levels recorded the highest values of the total dry weight of total weeds and seed yield in the 2019 and 2020 seasons. On the other hand, the application of herbicides (pendimethalin, oxyfluorfen, bentazon + clethodim, and imazethapyr) caused a significant decrease in the dry weight of total weeds. Application of imazethapyr WG 60% at 57.12 g a.i. ha−1 (T4) gave the highest reduction in dry weight of weeds associated with soybean plants. Generally, the application of I1 (90%) of water requirement combined with imazethapyr WG 60% at 57.12 g a.i. ha−1 (T4) led to improved chlorophyll a, chlorophyll b, relative water content%, and activity of CAT accompanied by optimal soybean yield and its components. In addition, all weed control treatments under 90% irrigation resulted in the highest values of the studied economic criteria.

Author Contributions

Conceptualization, A.E.K., R.A.K., A.R.M., M.A.M.E.-M. and K.A.; methodology, A.E.K., R.A.K., A.R.M., M.A.M.E.-M. and K.A.; software, A.E.K., R.A.K., A.R.M., M.A.M.E.-M. and K.A.; validation, A.E.K., R.A.K., A.R.M., M.A.M.E.-M. and K.A.; formal analysis, A.E.K., R.A.K., A.R.M., Y.S.A.M., Y.H., A.I.E.-T. and K.A.; investigation, A.E.K., R.A.K., A.R.M., M.A.M.E.-M. and K.A.; resources, A.E.K., R.A.K., A.R.M. and M.A.M.E.-M.; data curation, A.E.K., R.A.K., A.R.M., M.A.M.E.-M. and K.A.; writing—original draft preparation, A.E.K., R.A.K., A.R.M., Y.S.A.M., Y.H., A.I.E.-T. and K.A.; writing—review and editing, A.E.K., R.A.K., A.R.M., M.A.M.E.-M., Y.H. and K.A.; supervision, A.E.K. and R.A.K.; funding acquisition, Y.S.A.M., Y.H., A.I.E.-T. and K.A. All authors have read and agreed to the published version of the manuscript.

Funding

The authors acknowledge the Deanship of Scientific Research at King Khalid University for funding this work through the Program of Research Groups under grant number (RGP 2/67/43).

Institutional Review Board Statement

Not applicable.

Informed Consent Statement

Not applicable.

Data Availability Statement

Not applicable.

Acknowledgments

The authors would like to thank the Deanship of Scientific Research at KingKhalid University, Saudi Arabia (RGP 2/67/43) and all members of PPB Lab., and EPCRS Excellence Centre (Certified according to ISO/9001, ISO/14001 and OHSAS/18001), Department of Agricultural Botany, Faculty of Agriculture, Kafrelsheikh University, Kafr-Elsheikh, Egypt. We also extend our thanks to the Weed Research Central Laboratory, (ISO 9001), Department of Weed Control in Field Crop Research, Agricultural Research Centre, Giza, Egypt.

Conflicts of Interest

The authors declare no conflict of interest.

References

  1. Bulletin of the Agriculture Statistics, Part (2) Summer & Nili Crops; Ministry of Agriculture and Land Reclamation: Cario, Egypt, 2019; p. 45.
  2. Buezo, J.; Sanz-Saez, Á.; Moran, J.F.; Soba, D.; Aranjuelo, I.; Esteban, R. Drought tolerance response of high-yielding soybean varieties to mild drought: Physiological and photochemical adjustments. Physiol. Plantarum. 2019, 166, 88–104. [Google Scholar] [CrossRef] [PubMed] [Green Version]
  3. El-Banna, M.F.; Abdelaal, K.A.A. Response of Strawberry Plants Grown in the Hydroponic System to Pretreatment with H2O2 Before Exposure to Salinity Stress. J. Plant Prod. Mansoura Univ. 2018, 9, 989–1001. [Google Scholar] [CrossRef]
  4. Helaly, M.N.; Mohammed, Z.; El-Shaeery, N.I.; Abdelaal, K.A.A.; Nofal, I.E. Cucumber grafting onto pumpkin can repre sent an interesting tool to minimize salinity stress. Physiological and anatomical studies. Middle East J. Agric. Res. 2017, 6, 953–975. [Google Scholar]
  5. Hasan, M.K.; El Sabagh, A.; Sikdar, M.S.; Alam, J.; Ratnasekera, D.; Barutcular, C.; Abdelaal, K.A.A.; Islam, M.S. Comparative adaptable agronomic traits of Blackgram and mungbean for saline lands. Plant Arch. 2017, 17, 589–593. [Google Scholar]
  6. ALKahtani, M.D.F.; Attia, K.A.; Hafez, Y.M.; Khan, N.; Eid, A.M.; Ali, M.A.M.; Abdelaal, K.A.A. Chlorophyll Fluorescence Parameters and Antioxidant Defense System Can Display Salt Tolerance of Salt Acclimated Sweet Pepper Plants Treated with Chitosan and Plant Growth Promoting Rhizobacteria. Agronomy 2020, 10, 1180. [Google Scholar] [CrossRef]
  7. Hafez, Y.; Elkohby, W.; Mazrou, Y.S.A.; Ghazy, M.; Elgamal, A.; Abdelaal, K.A. Alleviating the detrimental impacts of salt stress on morpho-hpysiological and yield characters of rice plants (Oryza sativa L.) using actosol, Nano-Zn and Nano-Si. Fresenius Environ. Bull. 2020, 29, 6882–6897. [Google Scholar]
  8. Abdelaal, K.A.A.; AlKahtani, M.D.F.; Attia, K.; Hafez, Y.; Király, L.; Künstler, A. The pivotal role of plant growth promoting bacteria in alleviating the adverse effects of drought and facilitating sustainable agriculture. Biology 2021, 10, 520. [Google Scholar] [CrossRef]
  9. AlKahtani, M.D.F.; Hafez, Y.M.; Attia, K.; Rashwan, E.; Husnain, L.A.; AlGwaiz, H.I.M.; Abdelaal, K.A.A. Evaluation of Silicon and Proline Application on the Oxidative Machinery in Drought-Stressed Sugar Beet. Antioxidants 2021, 10, 398. [Google Scholar] [CrossRef]
  10. Rashwan, E.; Alsohim, A.S.; El-Gammaal, A.; Hafez, Y.; Abdelaal, K.A.A. Foliar application of nano zink-oxide can alleviate the harmful effects of water deficit on some flax cultivars under drought conditions. Fresenius Environ. Bull. 2020, 29, 8889–8904. [Google Scholar]
  11. Parvin, S.; Uddin, S.; Fitzgerald, G.; Tausz-Posch, S.; Armstrong, R.; Tausz, M. Free air CO2 enrichment (FACE) improves water use efficiency and moderate drought effect on N2 fixation of Pisum sativum L. Plant Soil 2019, 436, 587–606. [Google Scholar] [CrossRef]
  12. Wei, Y.; Jin, J.; Jiang, S.; Ning, S.; Liu, L. Quantitative Response of Soybean Development and Yield to Drought Stress during Different Growth Stages in the Huaibei Plain, China. Agronomy 2018, 8, 97. [Google Scholar] [CrossRef] [Green Version]
  13. Zhao, T.; Aleem, M.; Sharmin, R.A. Adaptation to water stress in soybean: Morphology to genetics. In Plant, Abiotic Stress Responses Climate Change; Andjelkovic, V., Ed.; Intech Open: Shanghai, China, 2018; pp. 34–68. [Google Scholar]
  14. EL Sabagh, A.; Hossain, A.; Barutçular, C.; Abdelaal, A.A.; Fahad, S.; Anjorin, F.B.; Islam, M.S.; Ratnasekera, D.; Kizilgeçi, F.; Yadav, S.; et al. Sustainable maize (Zea mays L.) production under drought stress by understanding its adverse effect, Survival mechanism and drought tolerance indices. J. Exp. Biol. Agric. Sci. 2018, 6, 282–295. [Google Scholar] [CrossRef]
  15. Abdelaal, K.A.A.; Rashed, S.H.; Ragab, A.; Hossian, A.; El Sabagh, A. Yield and quality of two sugar beet (Beta vulgaris L. ssp. vulgaris var. altissima Doll) cultivars are influenced by foliar application of salicylic Acid, irrigation timing, and plant ing density. Acta Agric. Slov. 2020, 115, 239–248. [Google Scholar] [CrossRef]
  16. Fakhari, R.; Tobeh, A.; Mohammad, T.; Mehdizadeh, A.M.; Khiavi, H.K. The Effect of Weed Control with Common Herbicides on Yield and Components of Soybean Yield (Glycin max L.). Int. J. Adv. Biol. Biomed. Res. 2020, 8, 92–99. [Google Scholar]
  17. Abdelaal, K.A.A.; Attia, K.A.; Alamery, S.F.; El-Afry, M.M.; Ghazy, A.I.; Tantawy, D.S.; Al-Doss, A.A.; El-Shawy, E.S.E.; Abu-Elsaoud, A.M.; Hafez, Y.M. Exogenous Application of Proline and Salicylic Acid can Mitigate the Injurious Impacts of Drought Stress on Barley Plants Associated with Physiological and Histological Characters. Sustainability 2020, 12, 1736. [Google Scholar] [CrossRef] [Green Version]
  18. El-Flaah, R.F.; El-Said, R.A.R.; Nassar, M.A.; Hassan, M.; Abdelaal, K.A.A. Effect of rhizobium, nano silica and ascorbic acid on morpho-physiological characters and gene expression of POX and PPO in faba bean (Vicia faba L.) under salinity stress conditions. Fresenius Environ. Bull. 2021, 30, 5751–5764. [Google Scholar]
  19. Arafa, S.A.; Attia, K.A.; Niedbała, G.; Piekutowska, M.; Alamery, S.; Abdelaal, K.; Alateeq, T.K.; Ali, M.A.M.; Elkelish, A.; Attallah, S.Y. Seed Priming Boost Adaptation in Pea Plants under Drought Stress. Plants 2021, 10, 2201. [Google Scholar] [CrossRef]
  20. Mosalem, M.; Mazrou, Y.; Badawy, S.; Abd Ullah, M.A.; Mubarak, M.G.; Hafez, Y.M.; Abdelaal, K.A. Evaluation of sowing methods and nitrogen levels for grain yield and components of durum wheat under arid region of Egypt. Rom. Biotechnol. Lett. 2021, 26, 3031–3039. [Google Scholar] [CrossRef]
  21. Basal, O.; Szabo, A.; Veres, S. Physiology of soybean as affected by PEG-induced drought stress. Curr. Plant Biol. 2020, 22, 100–135. [Google Scholar] [CrossRef]
  22. Dong, S.; Yingze, J.; Dong, Y.; Wang, L.; Wang, W.; Zezhong, M.; Yan, C.; Ma, C.; Liu, C. A study on soybean responses to drought stress and rehydration. Saudi J. Biol. Sci. 2019, 26, 2006–2017. [Google Scholar] [CrossRef]
  23. Chowdhury, J.A.; Karim, M.A.; Khaliq, Q.A.; Ahmed, A.U.; Mondol, A.T.M.I. Effect of drought stress on water relation traits of four soybean genotypes. SAARC J. Agri. 2017, 15, 163–175. [Google Scholar] [CrossRef] [Green Version]
  24. Hao, L.; Wang, Y.; Zhang, J.; Xie, Y.; Zhang, M.; Duan, L.; Li, Z. Coronatine enhances drought tolerance via improving antioxidative capacity to maintaining higher photosynthetic performance in soybean. Plant Sci. 2013, 2, 1–9. [Google Scholar] [CrossRef] [PubMed]
  25. Abdelaal, K.A.A.; El-Afry, M.; Metwaly, M.; Zidan, M.; Rashwan, E. Salt tolerance activation in faba bean plants using proline and salicylic acid associated with physio-biochemical and yield characters improvement. Fresenius Environ. Bull. 2021, 30, 3175–3186. [Google Scholar]
  26. El-Shawa, G.M.R.; Rashwan, E.M.; Abdelaal, K.A.A. Mitigating salt stress effects by exogenous application of proline and yeast extract on morphophysiological, biochemical and anatomical characters of calendula plants. Sci. J. Flowers Ornam. Plants 2020, 7, 461–482. [Google Scholar] [CrossRef]
  27. Masoumi, H.; Darvish, F.; Daneshian, J.; Nourmohammadi, G.; Habibi, D. Chemical and biochemical responses of soybean (Glycine max L.) cultivars to water deficit stress. Aust. J. Crop Sci. 2011, 5, 544–553. [Google Scholar]
  28. Alnusairi, G.S.H.; Mazrou, Y.S.A.; Qari, S.H.; Elkelish, A.A.; Soliman, M.H.; Eweis, M.; Abdelaal, K.; El-Samad, G.A.; Ibrahim, M.F.M.; ElNahhas, N. Exogenous Nitric Oxide Reinforces Photosynthetic Efficiency, Osmolyte, Mineral Uptake, Antioxidant, Expression of Stress-Responsive Genes and Ameliorates the Effects of Salinity Stress in Wheat. Plants 2021, 10, 1693. [Google Scholar] [CrossRef]
  29. El Nahhas, N.; AlKahtani, M.D.F.; Abdelaal, K.A.A.; Al Husnain, L.; AlGwaiz, H.; Hafez, Y.M.; Attia, K.; El-Esawi, M.; Ibrahim, M.; Elkelish, A. Biochar and jasmonic acid application attenuates antioxidative systems and improves growth, physiology, nutrient uptake and productivity of faba bean (Vicia faba L.) irrigated with saline water. Plant Physiol. Biochem. 2021, 166, 807–817. [Google Scholar] [CrossRef]
  30. Omara, R.I.; Abdelaal, K.A.A. Biochemical, histopathological and genetic analysis associated with leaf rust infection in wheat plants (Triticum aestivum L.). Physiol. Mol. Plant Pathol. 2018, 104, 48–57. [Google Scholar] [CrossRef]
  31. Mertz-Henning, M.L.; Ferreira, L.C.; Henning, F.A.; Mandarino, J.M.G.; Santos, E.D.; Oliveira, M.C.N.D.; Nepomuceno, A.L.; Farias, J.R.B.; Neumaier, N. Effect of water deficit-induced at vegetative and reproductive stages on protein and oil Content in soybean grains. Agronomy 2018, 8, 3. [Google Scholar] [CrossRef] [Green Version]
  32. Soliman, I.E.; Morsi, A.R.; Khaffagy, A.E. Effect of competitive abilities of some soybean genotypes, plant densities and weed control treatments on soybean (Glycine Max L. Merr) and its associated weeds. J. Plant Prod. Mansoura Univ. 2015, 6, 1413–1429. [Google Scholar]
  33. Anonymous. Introduction to Weeds Herbicides; Pennsylvania State Extension, The Pennsylvania State University: State College, PA, USA, 2007. [Google Scholar]
  34. Morsy, A.; Tantawy, M. Impact of Plant Spacing and Weed Control Treatments on Yield, Quality of Soybean (Glycine Max L.) and Associated Weeds Characters under Middle Egypt Conditions. Assiut J. Agric. Sci. 2018, 49, 27–46. [Google Scholar] [CrossRef]
  35. Abdelaal, K.A.A.; El Menofy, E.M.; Nessem, A.A.; Elhaak, M.A. The allelopathy potential and glyphosate influence on anatomical features of Egyptian clover plant (Trifolium alexandrinum L.) infested with dodder weed (Cuscuta campestris L.). Fresenius Environ. Bull. 2019, 28, 1262–1269. [Google Scholar]
  36. El-Metwally, I.M.; Elewa, T.A.E.; Dawood, M.G. Response of soybean cultivars to weed control treatments. Agric. Eng. Int. J. 2017, 159–165. [Google Scholar]
  37. Hari, R.; Singh, G.; Aggarwal, N.; Buttar, G.S.; Singh, O. Standardization of Rate and Time of Application of Imazethapy Weedicide in Soybean. Indian J. Plant Prot. 2013, 41, 33–37. [Google Scholar]
  38. Ariunaa, O.; Otgonsuren, O.M.; Bayarsukh, N. Effect of chemical weed control of soybean (Glycine max L.) field in Mongolia. Int. J. Adv. Res. Biol. Sci. 2016, 3, 192–198. [Google Scholar]
  39. Suciaty, T.; Wijaya, W.; Dukat, D. Advances in Social Science. Educ. Humanit. Res. 2019, 429, 121–124. [Google Scholar]
  40. Klute, A.C. Water retention: Laboratory Methods. In Methods of Soil Analysis, Part 1, 2nd ed.; Koute, A., Ed.; Agron Monogr.9; ASA: Madison, WI, USA, 1986; pp. 635–660. [Google Scholar]
  41. Jackson, M. Soil Chemical Analysis; Prentice Hall of India Private Ltd.: New Delhi, India, 1973. [Google Scholar]
  42. Frans, R.E.; Talbert, R. Design of field experiment and the measurement and analysis of plant response. Res. Methods in Weed Sci. 1977, 1977, 15–23. [Google Scholar]
  43. Moran, R. Formulae for determination of chlorophyll pigments with N-N-dimethyl formamid. Plant Physiol. 1982, 69, 1376–1381. [Google Scholar] [CrossRef] [Green Version]
  44. Gonzalez, L.; Gonzalez-Vilar, M. Determination of relative water content. In Handbook of Plant Ecophysiology Techniques; Reigosa, M.J., Ed.; Kluwer Academic Publishers: Dordrecht, The Netherlands, 2001; pp. 207–212. [Google Scholar]
  45. Heath, R.L.; Packer, L. Photoperoxidation in isolated chloroplasts. I. Kinetics and biochiometry of fatty acid peroxidation. Arch. Biochem. Biophys. 1968, 125, 189–198. [Google Scholar] [CrossRef]
  46. Lum, M.S.; Hanafi, M.M.; Rafii, Y.M.; Akmar, A.S.N. Effect of drought stress on growth, proline and antioxidant enzyme activities of upland rice. J. Anim. Plant Sci. 2014, 24, 1487–1493. [Google Scholar]
  47. Bates, L.S.; Walden, R.P.; Teare, I.D. Rapid determination of free proline for water studies. Plant Soil 1973, 39, 205–208. [Google Scholar] [CrossRef]
  48. AOAC. Official Methods of Analysis of the Association of Official Edition; AOAC: Washington, WA, USA, 1990. [Google Scholar]
  49. Ali, M.H.; Hoque, M.R.; Hassan, A.A.; Khair, A. Effects of deficit irrigation on yield, water productivity and economic returns of wheat. Agric. Water Manag. 2007, 92, 151–161. [Google Scholar] [CrossRef]
  50. CIMMYT. From Agronomic Data to Farmer Recommendations: An Economics Training Manual; Completely Revised Edition; CIMMYT: Veracruz, Mexico, 1988; pp. 31–33. [Google Scholar]
  51. Steel, R.G.D.; Torrie, J.H. Principles and Procedures of Statistics; MC. Graw Hill Book Company Inc.: New York, NY, USA, 1980; p. 481. [Google Scholar]
  52. Gomez, K.A.; Gomez, A.A. Statistical Procedures Agricultural Research, (2/E). In An International Rice Research Institute Book; A Wiley Inter Science Publication; John Wiley and Sons: New York, NY, USA, 1984. [Google Scholar]
  53. Gonçalves, C.G.; Junior, A.C.S.; Scarano, M.; Pereira, M.R.R.; Martins, D. Chlorimuron--ethyl in conventional and transgenic soybean cultivars under water deficit stress. Rev. Caatinga Mossoró 2018, 31, 832–842. [Google Scholar] [CrossRef]
  54. El-Metwally, I.M.; Abido, W.A.E.; Saadoon, S.M.; Gad, S.B. The integrated effect of deficit irrigation and weed control treatments on soybean productivity under sandy soil conditions with reference to nematode infection. Plant Arch. 2020, 20, 2581–2593. [Google Scholar]
  55. Lamptey, S.; Yeboah, S.; Sakodie, K.; Berdjour, A. Growth and yield response of soybean under different weeding regimes. Asian J. Agric. Food Sci. 2015, 3, 155–163. [Google Scholar]
  56. EL-Sayed, A.A.; Mazrou, Y.; Khaffagy, A.E.; Shaheen, F.E.M.; Hafez, Y.; Abdelaal, K.h.A.A.; EL-Hag, D.A.A. Impacts of herbicides and some growth characters of maize and associated weeds. Fresenius Environ. Bull. 2021, 30, 9380–9388. [Google Scholar]
  57. El-Sayed, A.A.; Khaffagy, A.E.; Shaheen, F.E.M.; Hafez, Y.; Abdelaal, K.h.A.A.; Hassan, F.; AElhag, D. Comparative efficiency of new herbicides for weed control on quality, yield and its component in maize (Zea mays). Fresenius Environ. Bull. 2021, 30, 5340–5349. [Google Scholar]
Figure 1. Amount of irrigation water (IW, cm) for soybean crop during the two growing seasons.
Agronomy 12 01037 g001
Figure 2. Effect of interactions between irrigation levels and weed control treatments on total annual weeds (g m−2) in the first survey and second survey during the two seasons. I0: 100% irrigation level T1: pendimethalin CS 45.5% T4: imazethapyr WG 60%; I1: 90% irrigation level T2: oxyfluorfen EC 24% T5: hand-hoeing twice; I2: 80% irrigation level T3: bentazon AS 48% + clethodim EC 12.5% T6: untreated check. Different letters represent significant differences (0.05).
Agronomy 12 01037 g002
Figure 3. Effect of interaction between irrigation levels and weed control treatments on seed yield of soybean in the 2019 and 2020 seasons. I0: 100% irrigation level, T1: pendimethalin CS 45.5%, T4: imazethapyr WG 60%; I1: 90% irrigation level, T2: oxyfluorfen EC 24%, T5: hand-hoeing twice; I2: 80% irrigation level, T3: bentazon AS 48% + clethodim EC 12.5%, T6: untreated check. Different letters represent significant differences (0.05).
Agronomy 12 01037 g003
Figure 4. Effect of interactions between irrigation levels and weed control treatments on chlorophyll a content after 30 days from application during the 2019 and 2020 seasons. I0: 100% irrigation level T1: pendimethalin CS 45.5% T4: imazethapyr WG 60%; I1: 90% irrigation level T2: oxyfluorfen EC 24% T5: hand-hoeing twice; I2: 80% irrigation level T3: bentazon AS 48% + clethodim EC 12.5% T6: untreated check. Different letters represent significant differences (0.05).
Agronomy 12 01037 g004
Figure 5. Effect of interactions between irrigation levels and weed control treatments on RWC% and MDA during the 2019 and 2020 seasons; I0: 100% irrigation level T1: pendimethalin CS 45.5% T4: imazethapyr WG 60%; I1: 90% irrigation level T2: oxyfluorfen EC 24% T5: hand-hoeing twice; I2: 80% irrigation level T3: bentazon AS 48% + clethodim EC 12.5% T6: untreated check. Different letters represent significant differences (0.05).
Agronomy 12 01037 g005
Figure 6. Effect of interactions between irrigation levels and weed control treatments on productivity of irrigation water PIWs, PIWo, and PIWp in the 2019 and 2020 seasons. I0: 100% irrigation level T1: pendimethalin CS 45.5% T4: imazethapyr WG 60%; I1: 90% irrigation level T2: oxyfluorfen EC 24% T5: hand-hoeing twice; I2: 80% irrigation level T3: bentazon AS 48% + clethodim EC 12.5% T6: untreated check; PIWs: productivity of irrigation water based on seed yield; PIWo: productivity of irrigation water based on oil yield; PIWp: productivity of irrigation water based on protein yield. Different letters represent significant differences (0.05).
Agronomy 12 01037 g006
Table 1. Physical properties, water parameters and bulk density of the experimental soil.
Soil
Depth
(cm)
Particle Size DistributionTextureField Capacity (%)Permanent Wilting Point (%)Available Water (%)Soil Bulk Density (mg/m3)
Sand (%)Silt (%)Clay (%)
0–2015.623.660.8Clayey45.023.321.71.20
20–4021.422.356.3Clayey39.621.118.51.24
40–6023.121.755.2Clayey37.820.817.01.27
Mean20.022.557.4Clayey40.821.719.11.24
Table 2. Chemical properties of the experimental soil.
Soil
Depth
(cm)
EC (dS/m)PH
(1:2.5)
Soil Water
Suspension
Soluble Cations and Anions (meq/L)
Ca2+Mg2+Na+K+CO3HCO3ClSO4
0–203.718.2310.86.618.10.270.004.613.617.6
20–403.958.1812.68.417.50.250.004.414.020.4
40–604.738.1415.710.920.90.320.004.315.128.4
Mean4.13-------13.08.618.80.280.004.414.222.1
Table 3. Meteorological data for Kafr El-Sheikh during 2019 and 2020 summer seasons.
MonthTemperature (°C)Relative Humidity (%)Wind Speed
(m/s)
Pan
Evaporation
(mm/day)
Max.Min.AverageMax.Min.Average
2019 season
June33.028.030.581.550.065.81.198.46
July33.528.431.085.354.469.90.978.08
August34.225.930.189.755.672.70.806.82
September32.427.930.283.452.968.20.895.90
2020 season
June31.125.228.278.042.660.31.298.44
July33.727.330.584.251.167.71.188.79
August34.628.231.485.349.667.51.078.03
September34.627.130.986.747.767.21.086.24
Table 4. Common, chemical names, chemical group, mode of action rate and time of the test herbicides.
Active IngredientChemical GroupMode of ActionRate
(g a.i.ha−1)
Time of Application
T1: Pendimethalin CS 45.5%Dinitroaniline
  • Inhibition of VLCF (very long chain fatty acids).
1624.4After sowing and before irrigation directly
T2: Oxyfluorfen
EC 24%
Diphenyl ether
  • Inhibition of PPO (Protoporphyrinogen oxidase inhibitor)
427.2After sowing and before irrigation directly
T3: Bentazon
AS 48%
Benzothiadiazinone
  • Inhibition of photosystem (PS II) photosynthesis (nonmobile within plant).
571.215 days after sowing (DAS) [(V1) first unrolled unifoliate leaves]
+
  • Inhibition of ACCase (acetyl CoA carboxylase) (conjugation of acetyl Co enzyme A and other sulfhydryl).
Clethodim
EC 12.5%
Cyclohexanedione
  • Inhibition of ACCase (acetyl CoA carboxylase) (conjugation of acetyl Co enzyme A and other sulfhydryl)
372.530 days after sowing (DAS)
Imazethapyr 45%Imidazolinone
  • Inhibitor of branched chain amino acid synthesis (ALS or AHAS).
57.1230 days after sowing
+ [Beginning bloom plants have at least one open flower at any node (R1)]
Chlorimuron-ethyl (15%) WG 60%Sulfonylurea
  • Inhibition of ALS (AHAS)
T5Hand-hoeing twice carried out at 18 and 35 days after sowing (DAS).
T6Untreated check
Table 5. Scientific, common, and family names for weeds associated with soybean crop in 2019 and 2020 seasons.
CategoriesScientific NameCommon NameFamily
Broad-leaved weedsXanthium strumarium L.CockleburAsteraceae
Corchorus olitorius L.Nalta juteTiliaceae
Hibiscus trionum L.Bladder hibiscusMalvaceae
Amaranthus retroflexus L.Redroot pig weedAmaranthaceae
Portulaca oleracea L.Common purslanePortulacaceae
Sida alba L.Prickly sidaMalvaceae
Grassy weedsEchinochloa colonum L.Jungle ricePoaceae
Dinebra retroflexa (Vahl.) panz.Bent grassPoaceae
Table 6. Susceptibility score of weed species to herbicides after 60 days from application during the 2019 and 2020 seasons.
CharacteristicControlling % of Weed Species Susceptibility to Herbicides
Weed Species
Herbicides
Species of Annual Broad-Leaved WeedsSpecies of Annual Grassy Weeds
Corchorus olitoriusXanthium strumariumPortulaca oleroceaHibiscus trionumAmaranthus albumSida albaEchionchloa colonumDinebra retroflexa
(T)2019 season
T1
T2
T3
T4
82 (MS)
84 (MS)
88 (MS)
94 (S)
86 ((MS)
82 (MS)
81 (MS)
91 (S)
87 (MS)
89 (MS)
90 (S)
96 (S)
85 (MS)
87 (MS)
87 (MS)
91 (S)
86 (MS)
86 (MS)
89 (MS)
91 (S)
86 (MS)
81 (MS)
88 (MS)
90 (S)
87(MS)
86 (MS)
88 (MS)
87 (MS)
85 (MS)
88 (MS)
89 (MS)
88 (MS)
2020 season
T1
T2
T3
T4
86 (MS)
85 (MS)
87 (MS)
97 (S)
87 (MS)
85 (MS)
86 (MS)
96 (S)
85 (MS)
86 (MS)
88 (MS)
95 (S)
83 (MS)
85 (MS)
86 (MS)
95 (S)
84 (MS)
86 (MS)
87 (MS)
94 (S)
84 (MS)
82 (MS)
86 (MS)
92 (S)
86 (MS)
84 (MS)
86 (MS)
86 (MS)
85 (MS)
86 (MS)
88 (MS)
87 (MS)
Susceptible (S) = or > 90%. Moderately susceptible (MS) = 80–89%; T1: pendimethalin CS 45.5%; T2: oxyfluorfen EC 24%; T3: bentazon AS 48% + clethodim; T4: imazethapyr WG 60%.
Table 7. Effect of irrigation levels and weed control treatments on dry weight of annual weeds (g m−2) at 60 and 80 days after sowing in the 2019 and 2020 seasons.
Weed CategoriesDry Weight of Annual Weeds (g m−2)
At 60 Days after SowingAt 80 Days after Sowing
Broad-Leaved WeedsGrassy WeedsTotal WeedsBroad-Leaved WeedsGrassy WeedsTotal Weeds
Season201920202019202020192020201920202019202020192020
Irrigation levels (I)
I0203.9192.192.93148.3296.9340.4275.6259.6140.8224.7416.4484.3
I1183.8183.187.99140.2271.8323.2248.4247.4133.3212.3381.7459.7
I2133.9149.963.0396.13196.9246.1181.0202.695.50145.7276.5348.3
LSD 5%40.218.317.738.8339. 537.7554.324.7526.858.853.956.7
Weed control treatments (T)
T1137.9161.827.3446.72165.3208.5186.4218.941.4470.76227.8289.4
T2108.4111.359.13109.42167.5220.6146.5150.489.60165.8236.1316.2
T371.1578.1541.3270.23112.5148.496.20105.662.63106.4158.8212.0
T450.8248.6551.1273.25101.9121.968.6865.7477.44111.0146.1176.8
T591.00105.265.24100.3156.3205.5122.9142.198.82152.0221.8294.1
T6584.1545.2243.8368.2827.8914.4789.3736.8369.3559.411581296
LSD 5%53.329.916.1426.651.836.272.139.924.540.370.251.6
Analysis of variance (F test)
I****************
T************************
I × T************************
Values followed by * are significant (p = 0.05). Values followed by ** are highly significant (p = 0.01). I0: 100% irrigation level T1: pendimethalin CS 45.5% T4: imazethapyr WG 60%; I1: 90% irrigation level T2: oxyfluorfen EC 24% T5: hand-hoeing twice; I2: 80% irrigation level T3: bentazon AS 48% + clethodim EC 12.5% T6: untreated check.
Table 8. Effect of irrigation levels and weed control treatments on yield and its components in the 2019 and 2020 seasons.
CharacteristicsPlant Height (cm)No. Branches
Plant−1
Seed Yield Plant−1 (g)100-Seed
Weight (g)
Seed Yield
(t ha−1 )
Season2019202020192020201920202019202020192020
Irrigation levels (I)
I0107.3111.15.415.2536.5736.7914.7414.323.5783.384
I1113.7118.95.575.7945.5646.0115.2915.023.9263.977
I2100.0103.84.924.7734.6934.9314.0313.622.1962.075
LSD 5%1.390.5770.1150.1117.567.840.5220.6580.6370.625
Weed control treatments (T)
T1106.0109.74.804.7636.3136.5813.8213.412.8472.797
T2104.4109.55.335.3038.8939.1914.6114.192.8942.857
T3103.8105.75.355.3340.2940.6115.1814.763.6293.787
T4110.3119.36.276.2343.8444.2016.5416.414.2474.101
T5115.3117.75.475.4540.7641.0715.3414.893.9533.787
T6102.3105.94.574.5433.5333.8212.6112.251.8291.769
LSD 5%6.726.170.4360.4342.031.970.7150.7120.4430.386
Analysis of variance (F test)
I*****************
T********************
I × T******************
Values followed by * are significant (p = 0.05); Values followed by ** are highly significant (p = 0.01). I0: 100% irrigation level T1: pendimethalin CS 45.5% T4: imazethapyr WG 60%; I1: 90% irrigation level T2: oxyfluorfen EC 24% T5: hand-hoeing twice; I2: 80% irrigation level T3: bentazon AS 48% + clethodim EC 12.5% T6: untreated check.
Table 9. Effect of irrigation levels and weed control treatments on (Chl b µg mL−1) at 30 days from herbicides application and (Chl a and Chl b µg mL−1) at 60 days from herbicides applications in the 2019 and 2020 seasons.
CharacteristicsAt 30 Days from ApplicationAt 60 Days from Application
Chl b Chl bChl aChl aChl bChl b
Season201920202019202020192020
Irrigation levels (I)
I03.3053.4119.7248.9354.1083.90
I13.2183.40010.2609.1124.4424.44
I23.0053.3778.2067.1133.0533.29
LSD at 5%NSNS0.3010.3220.4220.183
Weed control treatments (T)
T12.5822.8938.9608.5843.6873.74
T22.923.1978.7967.7293.7173.81
T33.3243.5379.6778.0583.9873.87
T43.2503.55710.3810.004.1194.04
T53.7333.80010.039.0824.0304.12
T63.2593.3928.5366.8633.6683.26
LSD at 5%0.3470.2940.5360.3540.3460.253
Analysis of variance (F test)
INSNS********
T*********
I × TNSNSNSNSNSNS
Values followed by * are significant different (p = 0.05); Values followed by ** are highly significant (p = 0.01). I0: 100% irrigation level T1: pendimethalin CS 45.5% T4: imazethapyr WG 60%; I1: 90% irrigation level T2: oxyfluorfen EC 24% T5: hand-hoeing twice; I2: 80% irrigation level T3: bentazon AS 48% + clethodim EC 12.5% T6: untreated check.
Table 10. Effect of irrigation levels and weed control treatments on CAT activity (μmol min−1 g−1 protein) and Proline content (mg g−1 FW) of seed soybean in the 2019 and 2020 seasons.
CharacteristicsCAT
(μmol min−1 g−1 Protein)
Proline
(mg g−1 FW)
Season 2019202020192020
I025.1224.890.3600.306
I124.6324.090.3370.281
I239.2138.640.4400.439
LSD at 5%6.947.120.510.414
Weed control treatments (T)
T127.3028.170.3530.349
T228.2030.840.3720.346
T331.5627.280.3990.341
T431.1830.850.4030.354
T531.7530.100.4260.360
T627.9426.810.3200.302
LSD at 5%4.296NS0.430.304
I******
T*NS**
I × TNSNSNSNS
Values followed by * are significant (p = 0.05); Values followed by ** are highly significant (p = 0.01). I0: 100% irrigation level T1: pendimethalin CS 45.5% T4: imazethapyr WG 60%; I1: 90% irrigation level T2: oxyfluorfen EC 24% T5: hand-hoeing twice; I2: 80% irrigation level T3: bentazon AS 48% + clethodim EC 12.5% T6: untreated check.
Table 11. Effect of irrigation levels and weed control treatments on chemical composition of soybean seeds in the 2019 and 2020 seasons.
CharacteristicsOil (%)Protein (%)
Season 2019202020192020
Irrigation levels (I)
I022.0922.2137.2737.45
I122.5722.3137.4237.56
I220.3519.8637.9438.14
LSD at 5%0.4521.610.2390.494
Weed control treatments (T)
T121.9921.7437.3037.48
T221.7921.7437.5337.72
T322.0821.7137.3937.54
T421.6721.3137.6037.77
T521.9622.337.6937.83
T620.5219.9637.7437.95
LSD at 5%0.5770.7130.1520.169
Analysis of variance (F test)
I********
T*****
I × TNSNSNSNS
Values followed by * are significant different (p = 0.05); Values followed by ** are highly significant (p = 0.01). I0: 100% irrigation level T1: pendimethalin CS 45.5% T4: imazethapyr WG 60%; I1: 90% irrigation level T2: oxyfluorfen EC 24% T5: hand-hoeing twice; I2: 80% irrigation level T3: bentazon AS 48% + clethodim EC 12.5% T6: untreated check.
Table 12. Effect of interaction between irrigation levels and weed control treatments on economic evaluation of soybean crop (combined data from 2019 and 2020 seasons).
Irrigation Levels
(I)
Weed Control Treatments
(T)
Cross Income
Thousand
USD/ha−1
Total Income
Thousand USD/ha−1
Net Return
USD/ha−1
Profitability
%
Benefit/Cost
Ratio
I0T1
T2
T3
T4
T5
T6
1.377
1.403
1.404
1.370
1.578
1.340
1.459
1.445
2.065
2.341
2.252
0.801
82
42
661
971
674
−460
6.0
3.0
47.1
70.9
42.7
−34.3
1.06
1.03
1.47
1.71
1.43
0.66
I1T1
T2
T3
T4
T5
T6
1.363
1.388
1.374
1.355
1.563
1.325
1.705
1.755
2.110
2.515
2.445
1.025
343
367
736
1160
881
−3004
25.1
26.5
53.6
85.6
56.4
−22.7
1.25
1.26
1.54
1.86
1.56
0.77
I2T1
T2
T3
T4
T5
T6
1.348
1.373
1.374
1.340
1.548
1.311
1.065
1.115
1.095
1.275
1.060
0.795
−283
−258
−279
−652
−489
−516
−21.0
−18.8
−20.3
−4.9
−31.5
−39.3
0.79
0.81
0.80
0.95
0.68
0.61
I0: 100% irrigation level T1: pendimethalin CS 45.5% T4: imazethapyr WG 60%; USD: US dollar; I1: 90% irrigation level T2: oxyfluorfen EC 24% T5: hand-hoeing twice; I2: 80% irrigation level T3: bentazon AS 48% + clethodim EC 12.5% T6: untreated check.
Table 13. Correlation coefficient between the studied characteristics and soybean yield and its components, in 2019 and 2020 seasons.
Characteristics Grassy Weeds
(g m−2)
Total Weeds
(g m−2)
Plant Height (cm)No. Branches
Plant−1
Seed
Yield Plant−1
(g)
100-Seed Weight
(g)
Seed Yield (t ha−1)
2019 season
Broad-leaved weeds (g/m2)0.883 **0.989 **−0.049−0.415 **−0.544 **−0.315 *−0.481 **
Grassy weeds (g/m2) 0.944 **0.031−0.213−0.401 **−0.220−0.313 *
Total weeds (g/m2) −0.024−0.361 **−0.512 **−0.292 *−0.440 **
Plant height (cm) 0.296 *0.351 **0.345 *0.402 **
No. branches/plants 0.614 **0.485 **0.684 **
Seed yield/plant (g) 0.774 **0.615 **
100-seed weight (g) 0.616 **
2020 season
Broad-leaved weeds (g/m2)0.833 **0.965 **−0.230−0.401 **−0.443 **−0.323 *−0.482 **
Grassy weeds (g/m2) 0.949 **0.051−0.191−0.289 *−0.202−0.331 *
Total weeds (g/m2) −0.108−0.319 *−0.390 **−0.280 *−0.432 **
Plant height (cm) 0.472 **0.445 **0.598 **0.585 **
No. branches/plants 0.525 **0.595 **0.710 **
Seed yield/plant (g) 0.801 **0.515 **
100-seed weight (g) 0.607 **
*, ** Correlation is significant at the 0.01 level (2-tailed).
Publisher’s Note: MDPI stays neutral with regard to jurisdictional claims in published maps and institutional affiliations.

