Article

Integrated Transcriptome and Proteome Analyses of Maize Inbred lines in Response to Salt Stress

1
College of Agronomy, Gansu Agricultural University, Lanzhou 730070, China
2
Gansu Provincial Key Lab of Aridland Crop Science, Gansu Agricultural University, Lanzhou 730070, China
3
Gansu Key Lab of Crop Improvement & Germplasm Enhancement, Lanzhou 730070, China
*
Author to whom correspondence should be addressed.
Agronomy 2022, 12(5), 1053; https://doi.org/10.3390/agronomy12051053
Submission received: 9 March 2022 / Revised: 14 April 2022 / Accepted: 22 April 2022 / Published: 28 April 2022

Abstract

:
To better understand the resistance of maize (Zea mays L.) to salt stress, maize inbred lines 8723 and P138, which are salt-tolerant and salt-sensitive, respectively, were investigated using the transcriptional and proteomic profiling of seedling roots under normal conditions and 180 mM NaCl stress. The screening criteria for differentially expressed proteins (DEPs) were a fold change (FC) ≥1.20 (up-regulated) or ≤0.83 (down-regulated). Additionally, the screening criteria for differentially expressed genes (DEGs) were FC >2 or <0.5. We analyzed the correlation between the protein and mRNA levels of two maize inbred lines under salt stress and found that a total of 3152 associated genes/proteins were identified in line 8723 under salt stress. However, only 14 DEGs were also identified by their corresponding DEPs, with a correlation coefficient of 0.07. A similar comparison of the 3159 genes/proteins affected by salt stress in line P138 identified just 8 DEGs with corresponding DEPs, with a correlation coefficient of 0.05. This indicates major differences in the regulation of transcriptional and translational processes in response to salt stress. In addition, in line 8723, we identified just eight DEGs with the same expression trend as their corresponding DEPs and six DEGs that behaved in contrast to their DEPs under salt stress. Compared to P138, the root response to salt stress in line 8723 involved the following processes. First, the up-regulation of lipid transporters and the lipid transfer-like protein VAS resulted in an increased lipid metabolism. Next, the increased expression of CAD6, as well as PRP1 and PRP10 under salt stress, promoted lignin synthesis and activated the abscisic acid signal pathway, respectively. In addition, the up-regulation of ADK2 and adenylate kinase expression regulated the concentration of purine ribonucleoside to help maintain dynamic energy balance in the maize cells. Furthermore, reactive oxygen species (ROS) scavenging and protective mechanisms were effectively enhanced by the up-regulation of peroxidase 12, peroxidase 67, glutathione transferase 9 and the putative laccase family protein, and the down-regulation of peroxidase 72. Therefore, maize enhances its salt tolerance by enhancing its lipid metabolism, promoting lignin biosynthesis, activating the abscisic acid signaling pathway, maintaining the dynamic energy balance of the maize cells, and enhancing the ROS clearance and protection mechanisms. Our study identified some genes and proteins related to salt tolerance in maize, and has thus provided new and important clues to better understand the resistance of maize to salt stress.

1. Introduction

With global shortages of water resources, increasing soil salinization has become the main hazard factor of global crop production and a serious threat to food security [1,2,3]. The global annual loss of agricultural production due to salt damage exceeds USD 12 billion [4]. Maize is a C4 crop with a high yield per unit area, and provides raw materials for food, feed, and biofuel [5,6,7]. However, it is sensitive to salt stress [8]. Salt stress leads to the slow growth of maize seedlings, low survival rate, and damage to the photosynthetic system, affecting development and yield [3,9]. Therefore, studying the molecular mechanisms of the salt stress responses in maize is of great importance.
A number of stress responsive genes that play important roles in plant resistance to salt stress have been identified in maize. For example, ZmSIMK1 (Zea Mays salt-induced mitogen-activated protein kinase 1) which encodes an MAPK. The ectopic expression of ZmSIMK1 in Arabidopsis thaliana increases its resistance to salt stress [10]. Wu et al. [11] cloned the maize MYB transcription factor family gene ZmMYB3R, and Arabidopsis plants overexpressing ZmMYB3R displayed significantly enhanced growth performance, survival rate, and tolerance to drought and salt stress. Drought-induced protein 19 (Di19), an important member of the zinc finger family, is involved in the abiotic stress response. Zhang et al. [12] identified its maize homologue, ZmDi19-1, and found that the overexpression of ZmDi19-1 in A. thaliana increased relative water content and proline content, decreased malondialdehyde content, and enhanced tolerance to salt stress.
The mutual verification of multi-omics data can reduce the false positive conclusions drawn from single-group data [13]. The joint analysis of multi-omics data, such as proteomics and transcriptome data association analysis, has been proven to be useful for the study of complex regulatory mechanisms in biological models [14]. However, most studies indicate a lack of consistency between the changes in the expression levels of mRNAs and their corresponding proteins [15]. For example, Muers [16] pointed out that the degree of association between mRNAs and their corresponding proteins ranges from 27 to 40%. Nevertheless, quantitative information at a taxonomic level can be used as the basis for the study of gene expression regulation which, in turn, can be addressed by the joint analysis of proteome and transcriptome data [16]. Using joint analysis of the transcriptome and proteome of hazelnut overy (Corylus spp.), Liu et al. [17] found that the ethylene, jasmonic acid, and salicylic acid signal transduction pathways may contribute to the formation of abortive ovaries. Similarly, through the comprehensive proteome and transcriptome analysis of two Clematis florida strains with different levels of heat tolerance, Jiang et al. [18] identified 15 genes associated with increased heat resistance, including two heat shock proteins (Hsp18 and Hsp70) and six other genes related to carbohydrate metabolism and antioxidant pathways. Ye et al. [19] analyzed the transcriptome and proteome of the graft infection of jujube (Zizyphus jujuba Mill.) contaminated with jujube witches’ broom, and found that most of the up-regulated genes and proteins were mainly involved in phenylpropanoid and flavonoid biosynthesis at 37 and 48 weeks after transplanting. Their analysis indicated that phytoplasma infection affected plant auxin and jasmonic acid content, as well as photosynthesis.
There have been no reports on the study of salt tolerance mechanisms in maize using transcriptome sequencing combined with quantitative proteomics technology. Therefore, we carried out a joint analysis of maize roots, the organ exposed to salt stress in the soil [20]. The inbred lines 8723 (salt-tolerant) and P138 (salt-sensitive) were used as experimental materials for the study, while transcriptome sequencing and isobaric tags for the relative and absolute quantitation (iTRAQ) of the proteins were used to discover the genes and proteins involved in salt tolerance, and to provide insights into the underlying mechanisms. Several candidates were identified, including putative cinnamyl alcohol dehydrogenase 6, lipid transfer-like protein VAS, pathogenesis-related protein 1, peroxidase 12, and other genes. The results provide new clues to further understand the molecular mechanism of salt tolerance in maize.

2. Materials and Methods

2.1. Plant Material

As previously reported, salt-tolerant maize inbred line 8723 and salt-sensitive maize inbred line P138 were used for the study [21]. First, the seeds were disinfected with 0.5% sodium hypochlorite solution for 10 min, then rinsed with distilled water 5 times and soaked in either distilled water (control, CK) or 180 mM NaCl solution (salt stress, S) for 12 h. Seeds were then sown in a 15 cm × 13 cm bowl (10 seeds per bowl). The bowls contained essential nutrients. Each treatment had three replicates. The seeds were germinated in an artificial climate box under the following conditions: 25 ± 2 °C, 12 h/day light, a light intensity of 600 μ mol/s−1·m−2, and a relative humidity of 60%. Fifty mL of deionized water was added every other day, and 50 mL of the corresponding treatment solution was added every 3 days. The root tissues of the seedlings at the three leaf-stage were harvested and stored at −80 °C for further use at about 10 days after sowing.

2.2. Proteome Sequencing and Analysis of the Differentially Expressed Proteins

iTRAQ analysis was performed by the Beijing Genomics Institution (BGI) (Shenzhen, China). The protein extraction protocol was carried out by BGI as previously reported [22,23]. The extracted protein samples were treated by reductive alkylation, and the protein concentration was determined using the Bradford method [24]. The experimental process followed our previous study [25]. All protein samples were hydrolyzed into peptides by trypsin. The seeding root proteins of the P138 and line 8723 control treatments were labeled with iTRAQ 113, 114 and 119 and 121, respectively, and the seeding root proteins of the P138 and line 8723 samples under salt stress were labeled with iTRAQ 115, 116 and 117 and 118, respectively. Finally, the eight labeled samples were mixed with the same amounts, and the mixed peptides were pre-separated by strong cation exchange chromatography. After separation, a 2D LC-MS/MS analysis was carried out, and protein assignments were determined using the mascot search engine (Version 2.3.02; Matrix Science, London, UK) by comparison with the Uniport database (https://www.uniprot.org/) (accessed on 8 January 2018). The mass spectrometric data can be found by ProteomeXchange with identifier PXD014409. The screening criteria for the DEPs (differentially expressed proteins) were p-value < 0.05 and FC (fold change) ≥ 1.20 (up-regulated), or FC ≤ 0.83 (down-regulated).

2.3. Transcriptome Sequencing and Analysis of Differentially Expressed Genes

TRIzol Reagent (Invitrogen) was used to extract RNA from the maize root tissues, and the RNA samples were sent to BGI for sequencing, as previously described [26]. The raw sequencing data were filtered, and the low-quality reads were removed. The clean reads were aligned to the third version of the B73 maize reference genome (http://ftp.maizesequence.org/) (accessed on 23 January 2018) by HISAT software (Version 2.0.4; Johns Hopkins University School of Medicine, Baltimore, MD, USA) [27]. The gene expression values for the 12 samples were determined using RSEM software (Version 1.2.12; University of Wisconsin-Madison, Madison, WI, USA) [28]. The original sequencing data have been submitted to NCBI’s SRA (login number: PRJNA611672). The screening criteria for the DEGs (differentially expressed genes) were FC >2 or <0.5, FDR (false discovery rate) < 0.01, and p-value < 0.05.

2.4. Association Analysis

The method described by Lan et al. [29] was used to calculate the Pearson correlation coefficient between the proteins levels and transcripts levels in lines 8723 and P138 under salt stress.

2.5. Bioinformatics Analysis

Based on GO (gene ontology) annotations, we functionally classified the associated genes/proteins. The phyper function in the R software was used for the enrichment analysis. According to the results of the KEGG (Kyoto Encyclopedia of Genes and Genomes) annotations, we classified the associated genes/proteins into biological pathways and used the phyper function in the R software for the enrichment analysis. We regarded the functions or pathways with a p-value < 0.05 as a significant enrichment of the GO terms or KEGG pathways.

2.6. RNA Extraction and qRT-PCR

According to the instructions of the manufacturer, total RNA was extracted using the RNA Simple Total RNA kit (Tiangen, Shanghai, China), and reverse transcribed into cDNA using FastKing cDNA (Tiangen, Shanghai, China). Using the primer blast in NCBI, 12 gene-specific PCR primers were designed (Table S1). The QuantStudio5 real-time PCR system (Thermo Scientific, Waltham, MA, USA) was used to amplify samples and standards with Hyperreal Premix Plus (SYBR Green) (Tiangen, Shanghai, China). Three biological replicates were used. The experimental process was described by Chen et al. [26]. The relative transcription levels of the selected genes were calculated by the 2−ΔΔCT method [30], and normalized to the expression levels of the actin gene (Table S1).

3. Results

3.1. Proteome and Transcriptome Data Analysis

In the early stage, the iTRAQ technique was used to quantitatively analyze the proteins from the root tissues of the salt-tolerant inbred line 8723 and the salt-sensitive inbred line P138 under salt stress compared to the controls. Compared with CK, we identified 626 DEPs in line 8723 under salt treatment, including 378 up-regulated and 248 down-regulated DEPs, and 473 DEPs (212 up-regulated and 261 down-regulated) in line P138 under salt treatment (Figure 1A). In addition, our previous study reported that a total of 3369 DEGs (1941 up-regulated and 1428 down-regulated) were identified in line 8723 in response to salt stress, and 2607 DEGs (965 up-regulated and 1642 down-regulated) were identified in line P138 (Figure 1B). We speculate that this result may imply that the salt-tolerant inbred line 8723 in response to salt stress is consistent at both protein and transcription levels, and enhanced its salt tolerance by up-regulating more DEPs/DEGs.

3.2. Correlation Analysis between Transcriptome and Protein

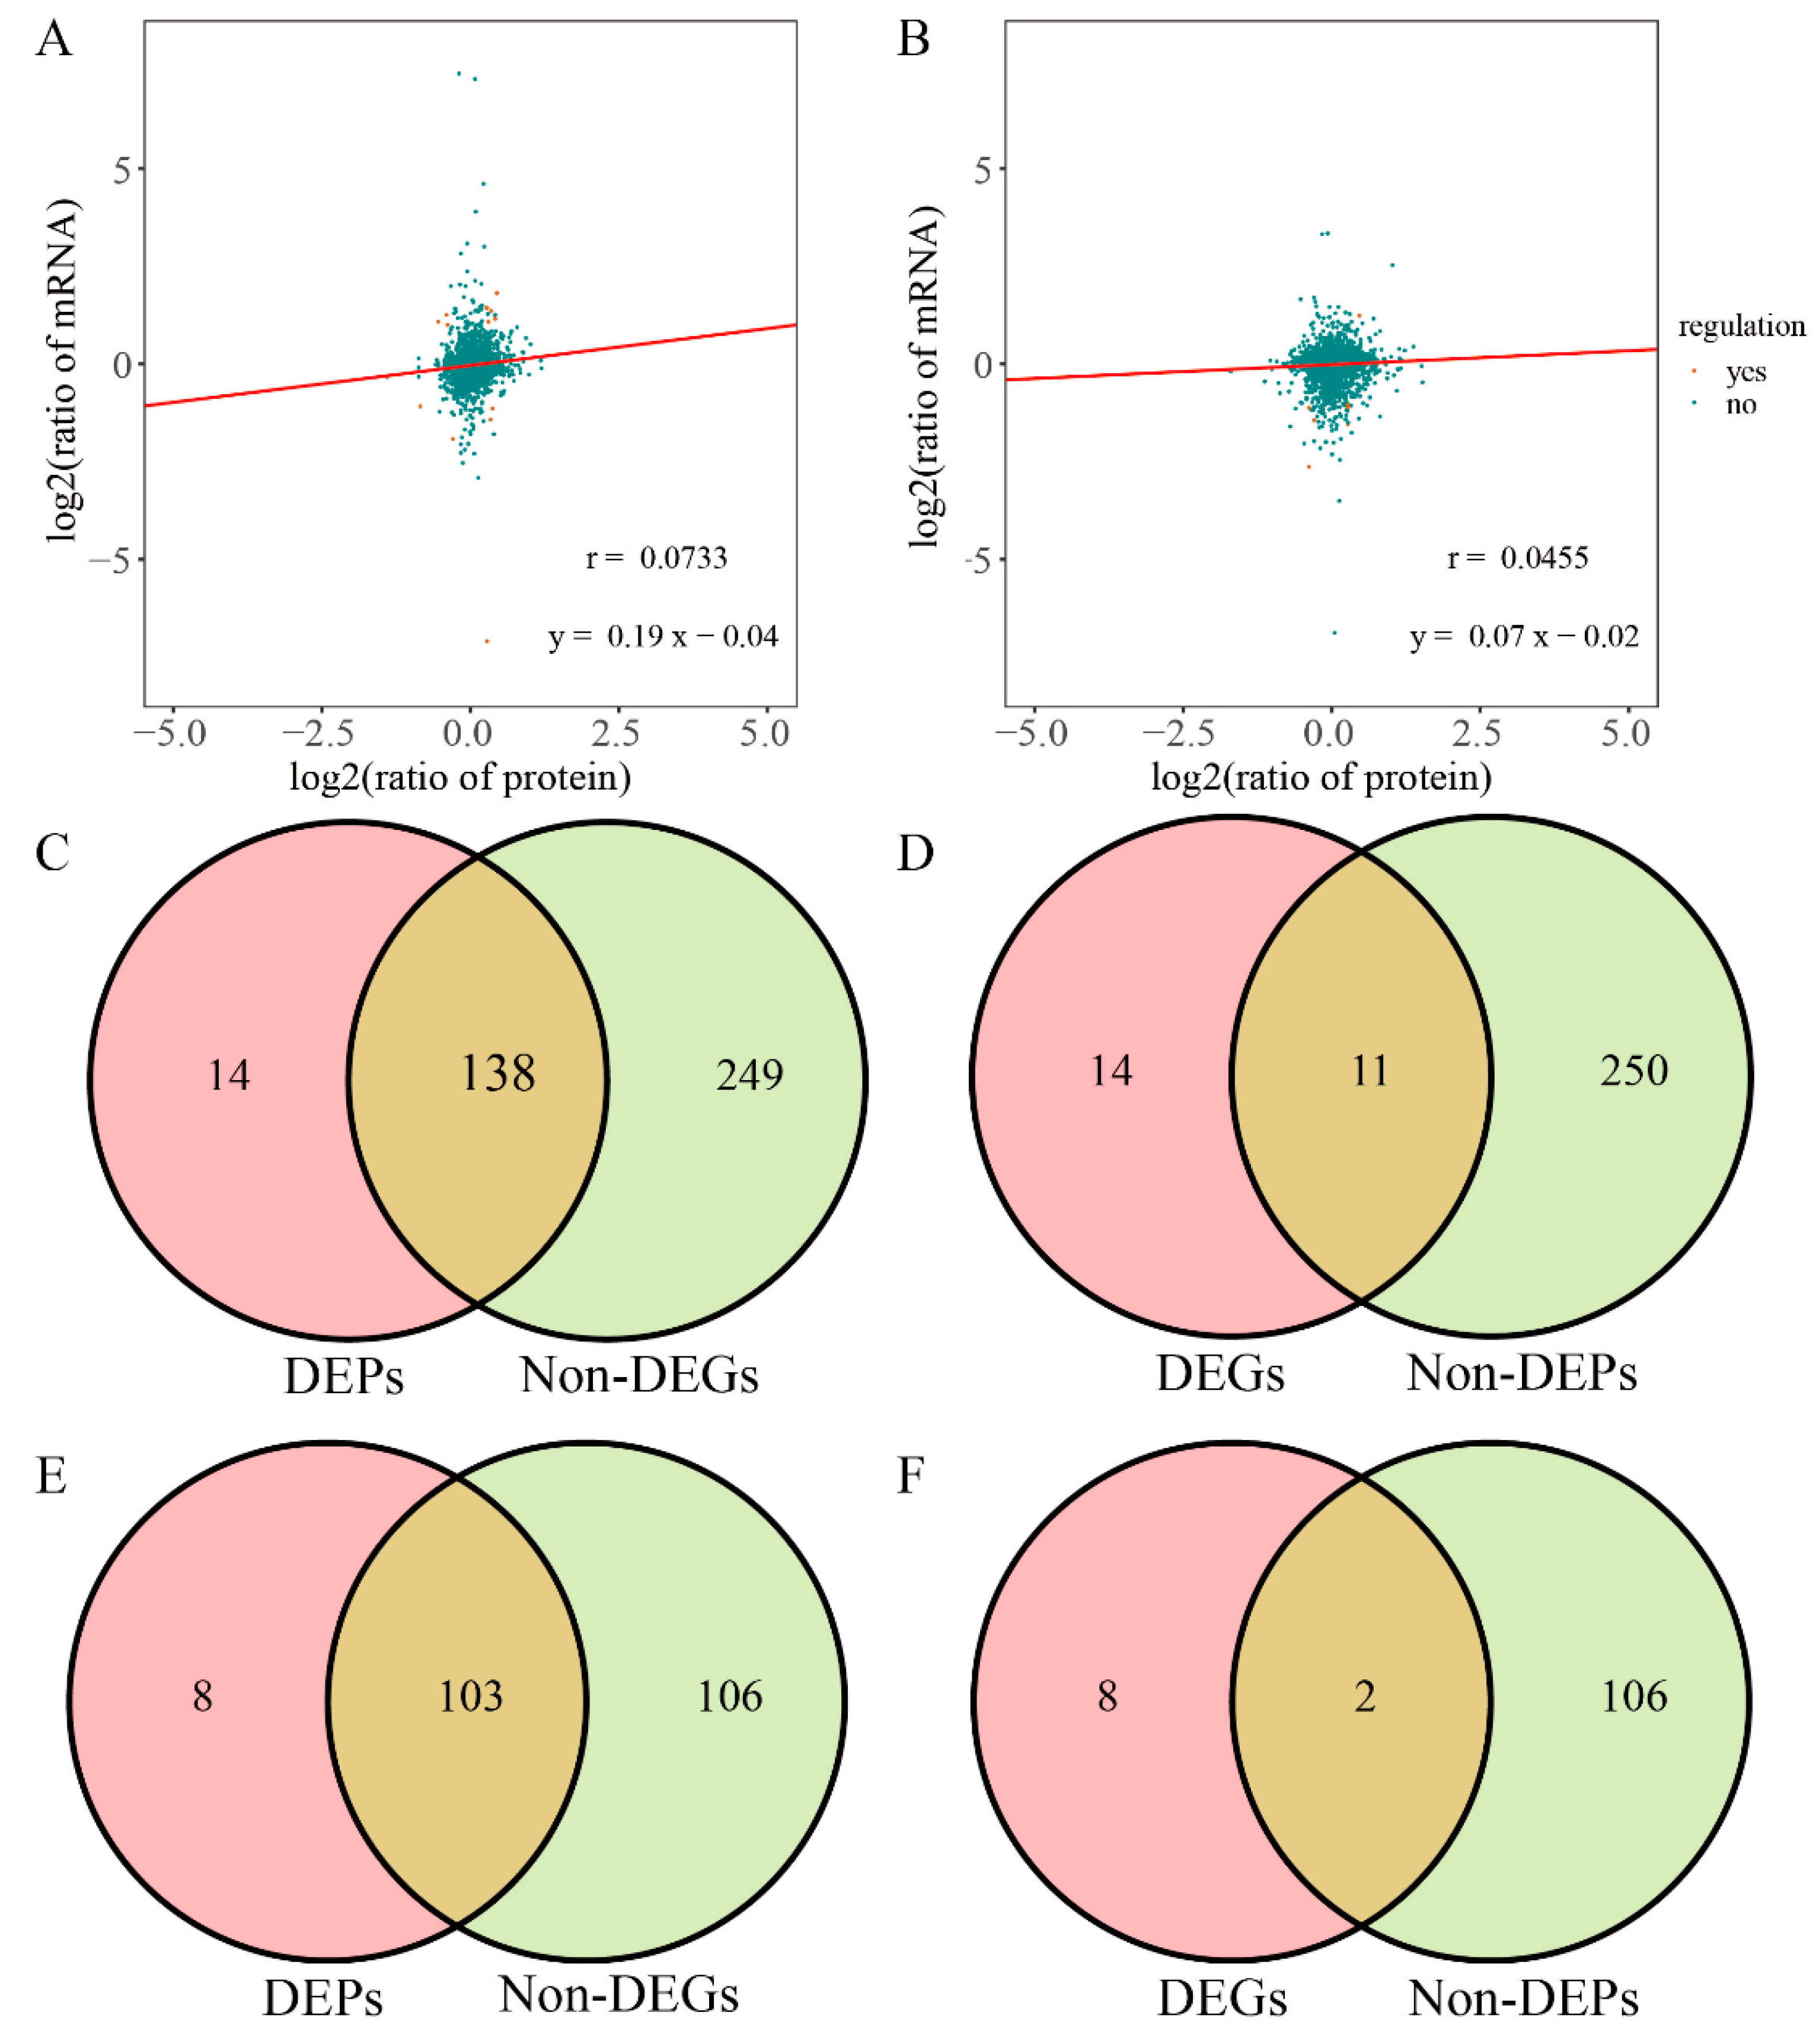
When both a protein and the corresponding mRNA were identified in the proteome and the transcriptome, they were considered to be positively associated. We analyzed the correlation between the protein levels and mRNA levels of two maize inbred lines under salt stress, and found that the expression of 3152 genes were confirmed with the accumulation of both protein and mRNA in line 8723 under salt stress (Table S2), while only 14 DEGs were positively associated with DEPs, with a correlation coefficient of 0.0733 (Figure 2A). Similarly, the expression of 3159 genes were identified by the detection of both their protein and mRNA in line P138 under salt stress (Table S3), while only 8 DEGs were associated with DEPs, with a correlation coefficient of 0.0455 (Figure 2B). The relationship between the expression changes of a protein and its corresponding mRNA can be classified as having either consistent or opposite expression. There were eight and four genes showing consistent expression changes in response to salt stress in lines 8723 and P138, respectively, indicating that, in these cases, the protein and mRNA responded to changes in the same manner. However, there were six and four genes showing the opposite expression trends in lines 8723 and P138 in response to salt stress, respectively (Table 1). Thus, in these cases, the protein accumulation was not positively associated with mRNA level, which indicates that factors other than transcript levels are involved in the regulation of the levels of these proteins. In addition, 138 and 103 DEPs showed no differences in expression to the corresponding mRNAs in lines 8723 and P138 in response to salt stress, respectively, further indicating that there may be differences in the protein translation and modification among these samples (Figure 2C,E). There were 11 and 2 DEGs for which no differences in the expressions of the corresponding proteins were observed in lines 8723 and P138, respectively (Figure 2D,F).

3.3. Bioinformatics Analysis of Related DEPs/DEGs

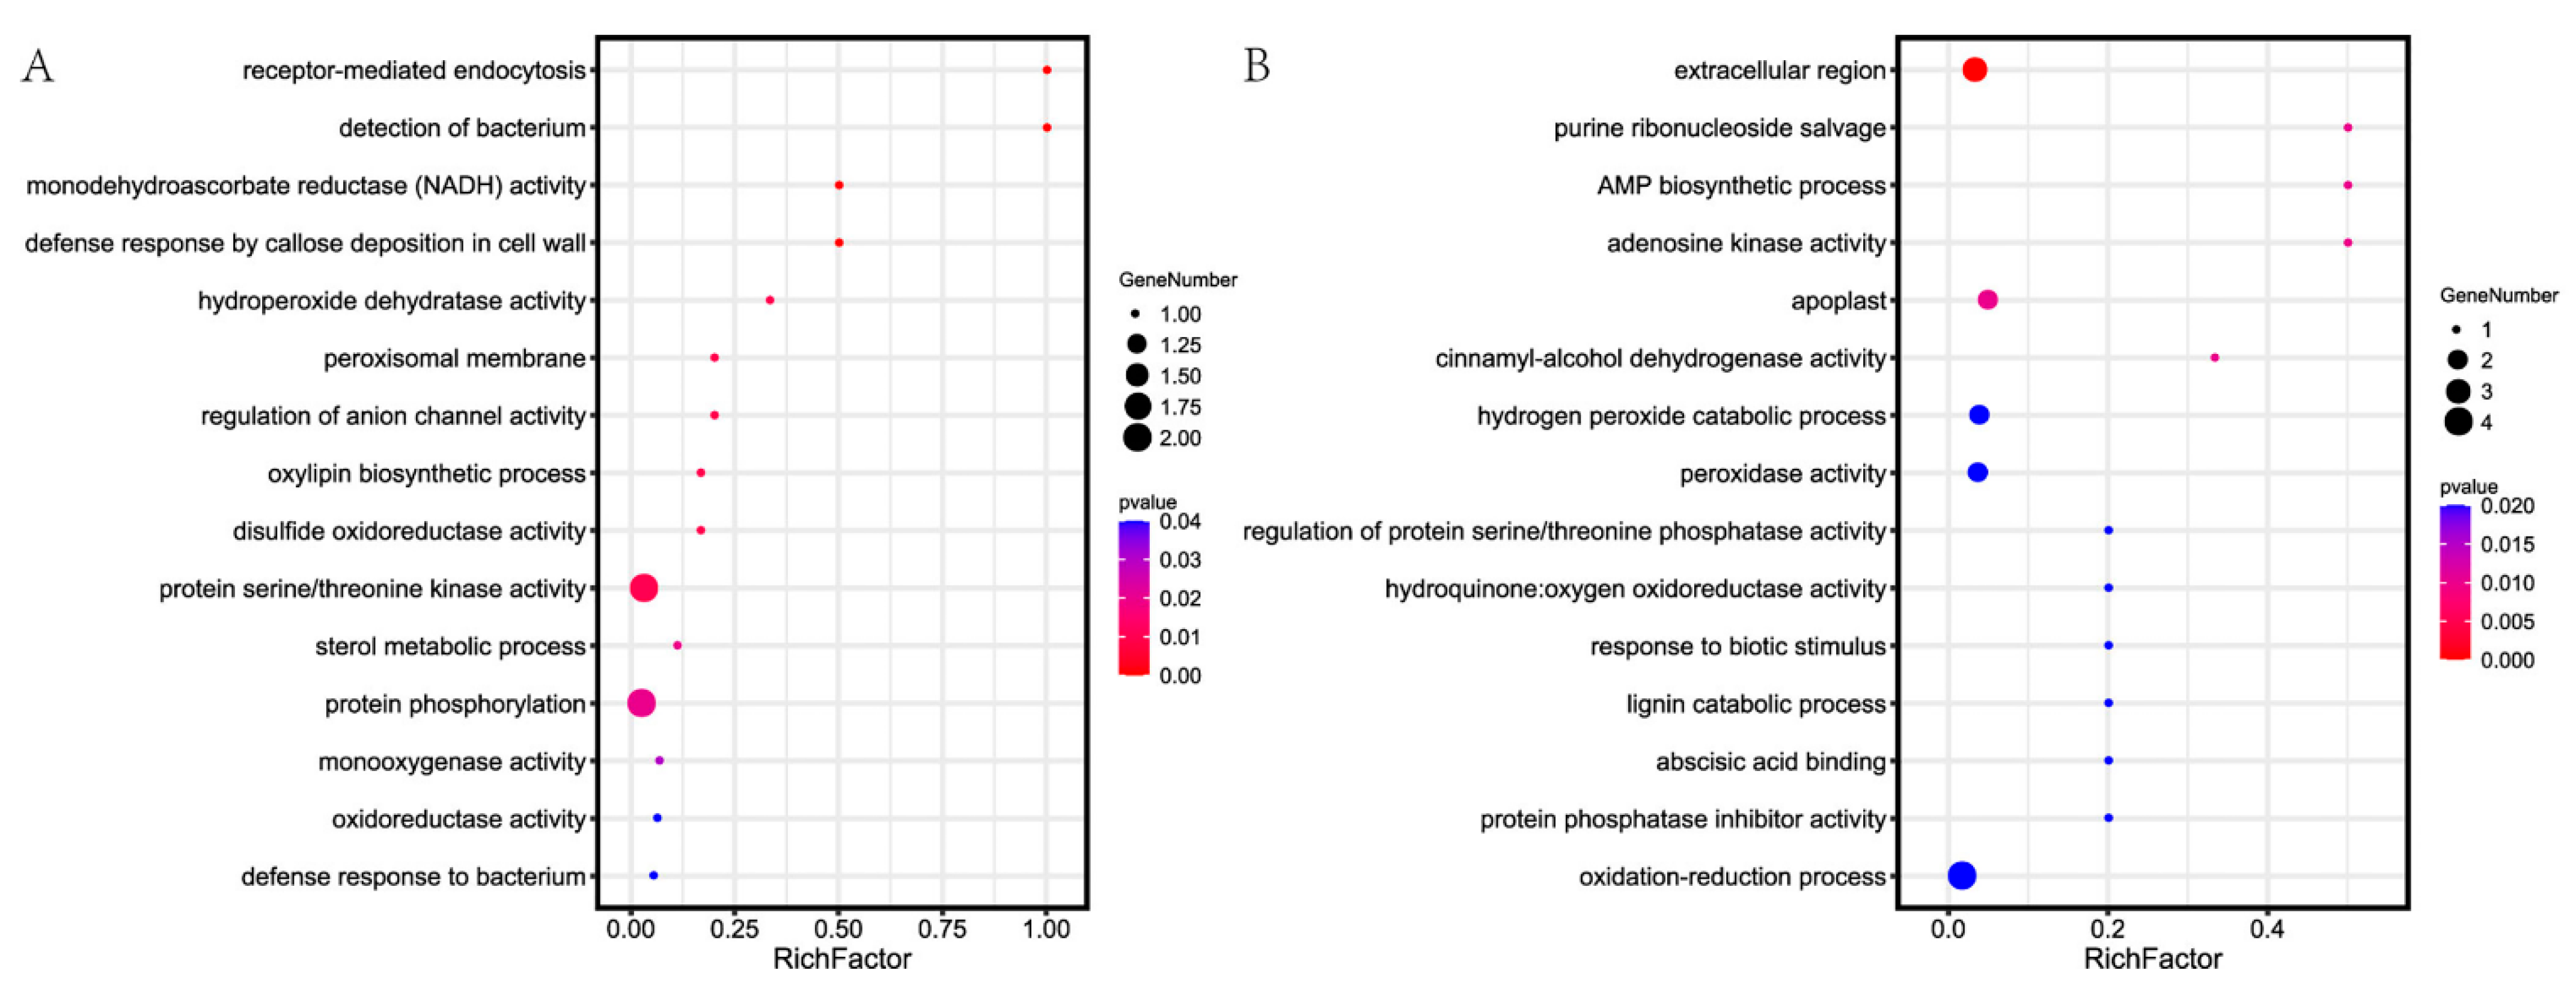
GO term enrichment analysis was performed on the associated DEPs/DEGs to determine the main functions of the associated genes. The results showed that the main biological processes of these genes for line 8723 in response to salt stress were oxidation-reduction, extracellular region, peroxidase activity, and the hydrogen peroxide catabolic process (Figure 3A), while the biological processes of these genes for P138 in response to salt stress were protein phosphorylation, protein serine/threonine kinase activity, and so on (Figure 3B).

3.4. qRT-PCR Verification

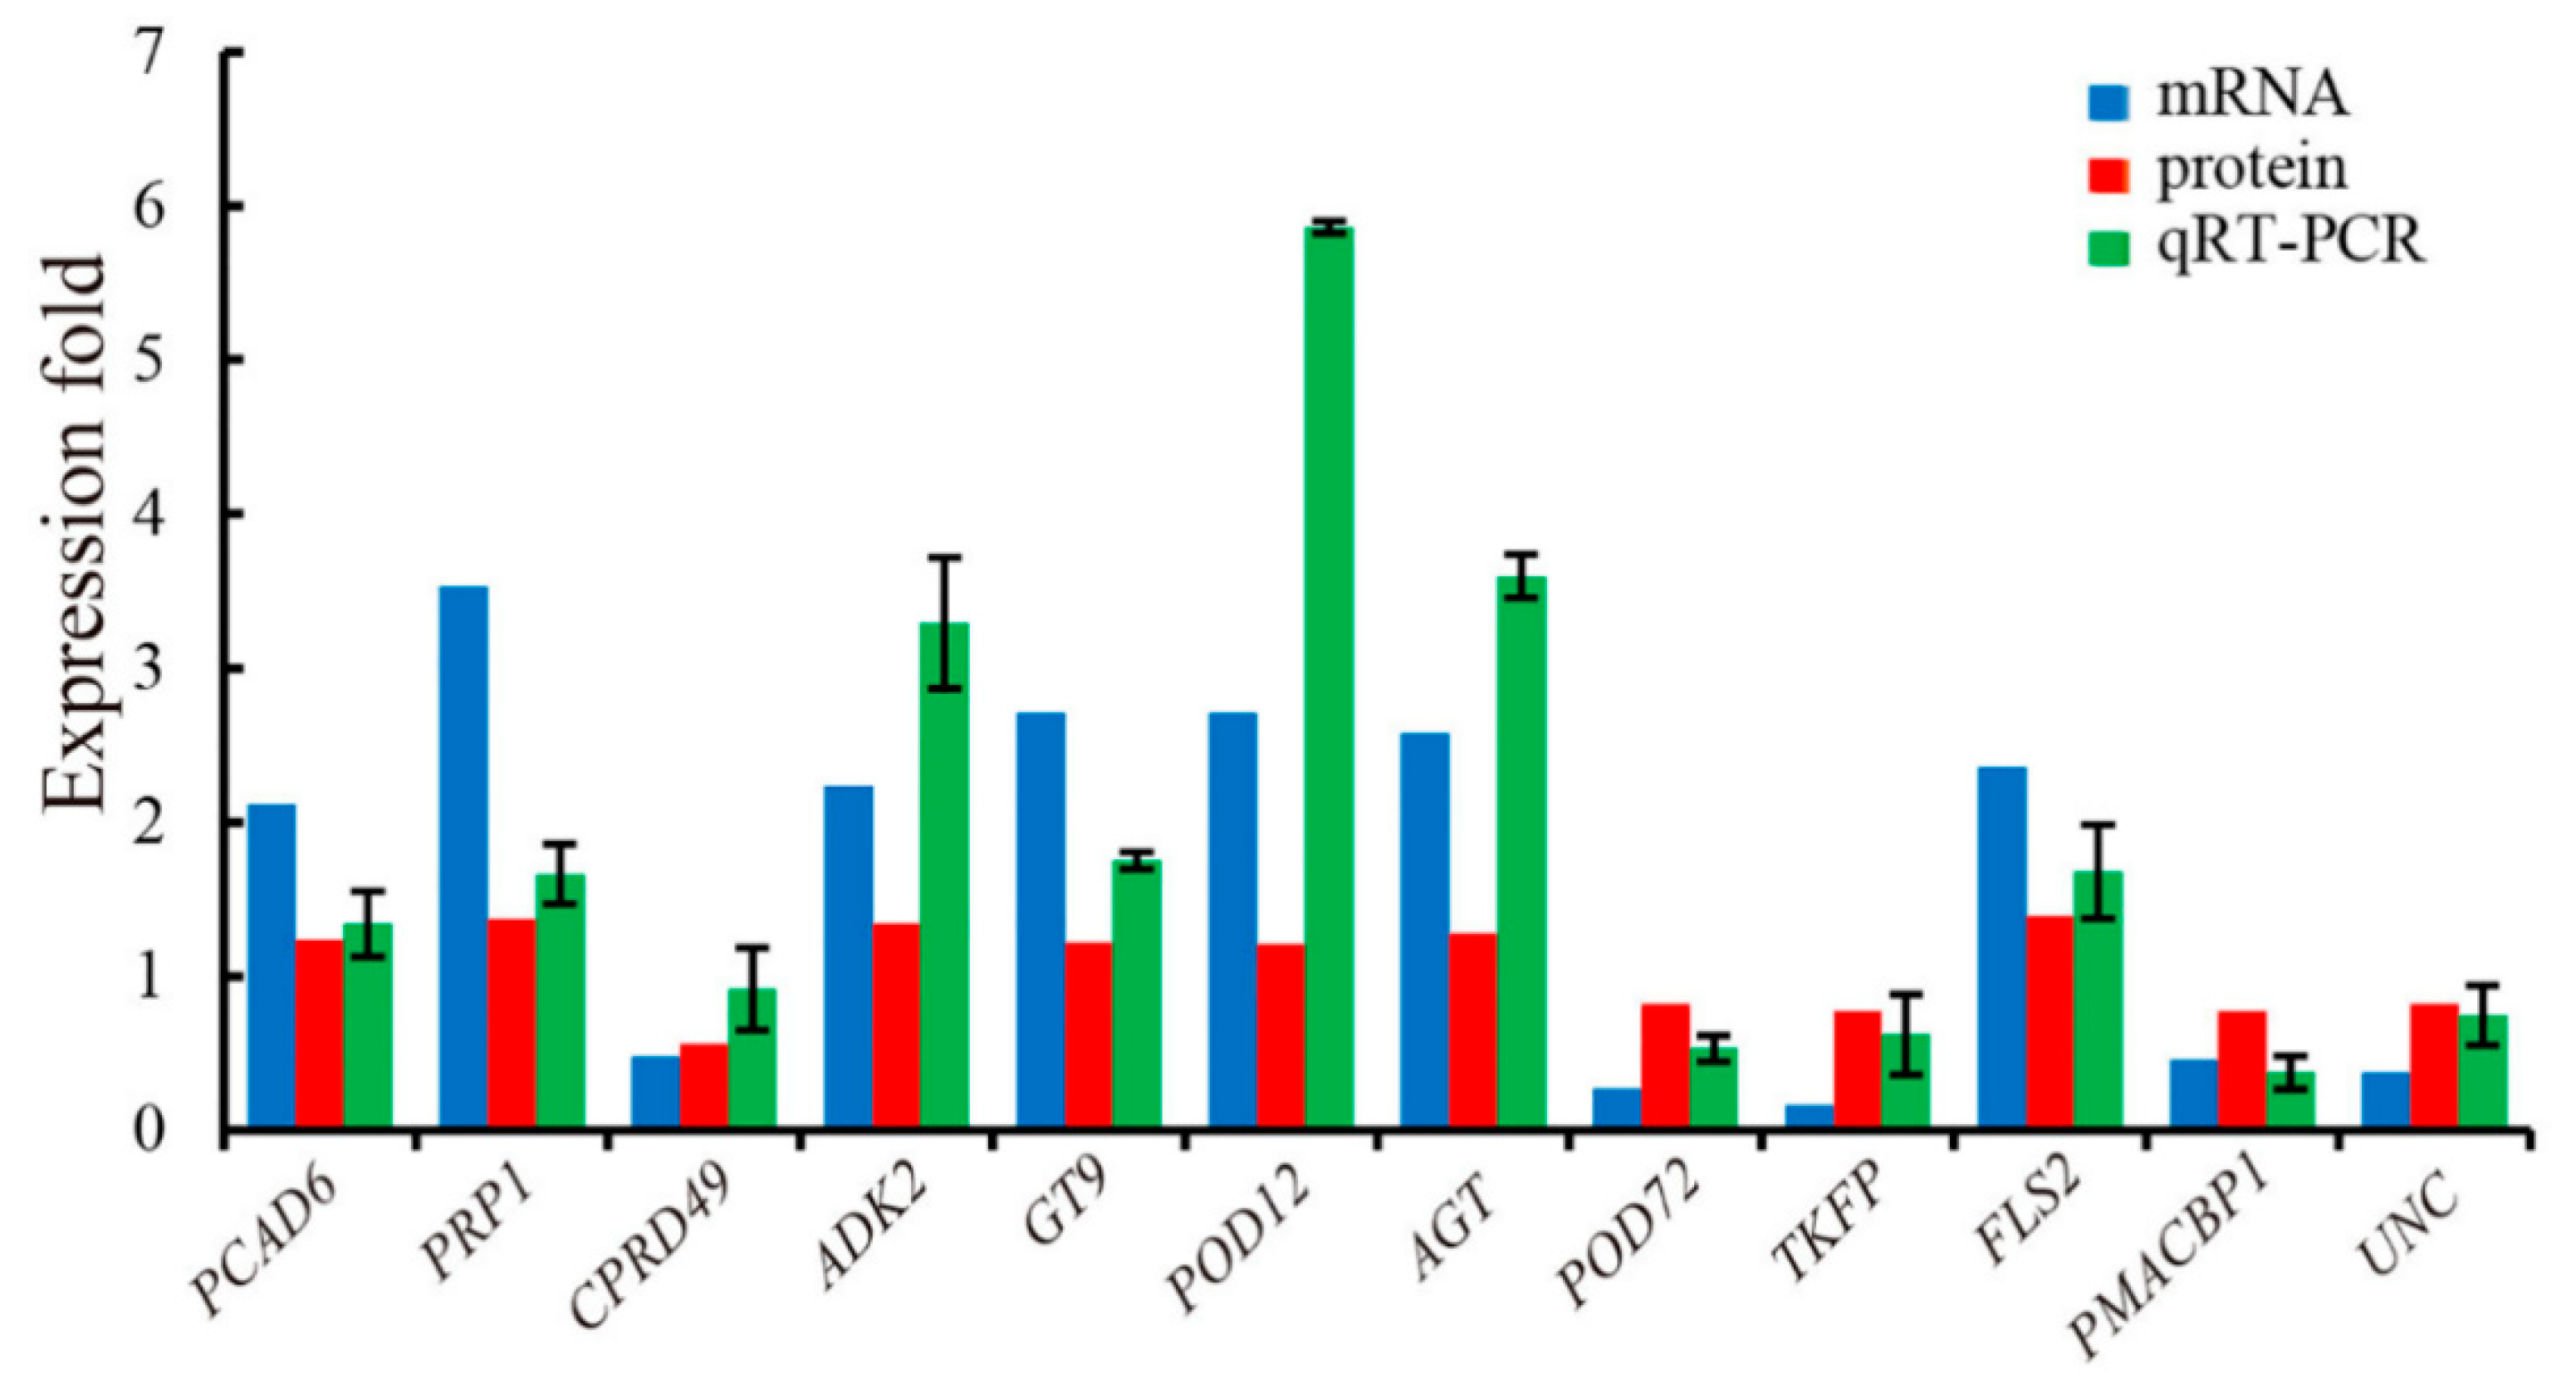
To verify the reliability of transcriptome and proteome data, we analyzed the relative expression of 12 genes with the same expression pattern in lines 8723 and P138 under salt stress by qRT-PCR. It was found that the relative expression trend of the 12 genes was consistent with their RNA-Seq and iTRAQ results (Figure 4), which indicates that our results are reliable.

4. Discussion

The use of high-throughput omics analysis techniques to investigate biological systems has become a highly anticipated topic, but it is usually limited to a single approach, using either proteomics or transcriptomics, to assess the complex regulatory networks underlying biological phenomena, and reports of multi-omics studies are still rare. Studies combining proteome and transcriptome data can be used to understand the internal relationship between proteins and genes, helping to break through the bottleneck of single omics research to reveal the complex regulation of gene expression and lay the foundation for exploring the complex life activities of organisms [31]. For example, Wu et al. [32] performed an association analysis on the transcriptome and proteome of the fruit of a citrus (Citrus sinensis L.) late-ripening sweet orange mutant, and found that a large number of DEGs belonged to plant hormone pathways and cell wall-related metabolisms, and revealed links between the ripening process and multiple maturity-related events. Lan et al. [29] investigated the transcriptome and proteome analysis of A. thaliana roots in response to phosphate deficiency and found that, among the highly up-regulated genes, the consistency between mRNA abundance and their encoded proteins was generally high, but there were a large number of inconsistent changes between the mRNA–protein pairs. Liu et al. [17] analyzed the development process of hazelnut ovaries by combining proteomics and transcriptomics, and found that there was a low positive correlation between DEGs and DEPs (r = 0.1846). Ma et al. [33] used southern alfalfa (Medicago sativa L.) millennium as material to analyze the transcriptome and proteome correlation of two sample leaves under normal culture and salt stress. The results showed that the correlation coefficient between the quantitative protein and the gene was 0.2485. In our study, we also found that the correlation between proteome and transcriptome was not high. The correlation coefficients between the DEGs and DEPs of maize inbred lines 8723 and P138 in response to salt stress were 0.07 and 0.05, respectively. This may be due to the transcription of DNA into mRNA and the translation of mRNA into proteins by various factors, such as the regulation of the transcription and translation process, and post translational regulation [34]. This may result in changes to the number of mRNA transcripts, as well as to protein location, quantity and function, leading to a loss of correlation between mRNA and their corresponding proteins [35]. It may also be caused by the non-differential expression of most genes and proteins in plants.
Lignin is mainly distributed in the secondary cell wall of the plant cell, and provides the necessary strength, hydrophobicity and resistance required by the plant cell wall to survive in harsh environments [36,37,38]. Under salt stress, the average number of lignified cells in plant vascular bundles increases significantly, and development of the root vascular system is enhanced [39]. Cinnamyl alcohol dehydrogenase (CAD), as a key enzyme in lignin biosynthesis, is involved in plant stress response [40,41]. Previous studies have reported that AtCAD5 is mainly expressed in A. thaliana roots, and it plays an important role in the biosynthesis of mustard alcohol, the precursor of S lignin units [42]. Chen et al. [43] showed that the glycine-rich salt stress response protein AtGRP9 interacts with AtCAD5, which is mainly involved in lignin synthesis under salt stress. In this study, we found that a CAD6 homolog was up-regulated in line 8723 under salt stress. GO analysis suggests that CAD6 is involved in the biosynthesis of lignin. Therefore, we speculate that the up-regulated expression of CAD6 in maize may promote the biosynthesis of lignin and improve its tolerance to salt stress.
Lipid is an important component of the cell membrane, and is involved in a variety of metabolic pathways such as energy storage and de novo membrane synthesis [44,45]. Lipid transfer proteins (LTPs) are small, soluble, cysteine-rich proteins that play an important role in pathogen and abiotic stress responses [46,47,48]. Torres-Schumann et al. [49] found that an LTP involved in lipid metabolism was up-regulated in tomato (Solanum Lycopersicum) under salt stress, and speculated that the up-regulated expression of LTP may improve salt tolerance. Pan et al. [50] isolated a nonspecific LTP gene (SiLTP) from foxtail millet (Setaria Italica) and found that the overexpression or RNAi of SiLTP in transgenic foxtail millet enhanced tolerance to salt stress and drought stress relative to wild-type plants, indicating that LTP genes play an important role in plant responses to abiotic stress. At the protein and mRNA levels, we found that a lipid transfer-like protein VAS was up-regulated in line 8723 under salt stress, and we also identified an LTP that was up-regulated in P138 under salt stress. In addition, another LTP, which was up-regulated in line 8723 but down-regulated in P138 under salt stress, was identified at the protein level. Therefore, we hypothesize that the strong salt tolerance of line 8723 may be related to the up-regulated expression of LTPs.
Pathogenesis-related proteins (PRP) play an important role in plant responses to stress, pathogen attack, light and abiotic stimulation [51,52]. Seo et al. [53] found that high salt levels significantly induced PR-3 in an ABA-dependent manner to enhance ABA-dependent salt stress signals, thus improving the germination rate and salt tolerance of A. thaliana seeds. The study of transgenic tobacco (Nicotiana tabacum L.) plants by Jain et al. [52] showed that the overexpression of the PRP10 gene could significantly improve the tolerance of plants to salt, heavy metals and drought stress, and resulted in a higher photosynthetic CO2 assimilation rate. At the protein and mRNA level, we found that PRP1, which participates in the abscisic acid signaling pathway, was up-regulated in line 8723 under salt stress. In addition, we identified one PRP10, also part of the abscisic acid signaling pathway, that was up-regulated in line 8723 under salt stress. Therefore, we speculate that pathogenesis-related proteins may respond positively to salt stress by activating the abscisic acid signaling pathway.
Adenosine kinase (ADK) itself is not a stress reactive enzyme per se, but through its reduction of the concentration of intracellular free adenosine, it plays a key role in maintaining transmethylation under salt stress [54]. At the protein and mRNA level, we found that ADK2 was up-regulated in line 8723 under salt stress, and GO analysis showed that ADK2 was involved in purine ribonucleoside recovery. Previous studies have suggested that adenylate kinase balances adenylate by transferring phosphate groups from ATP to AMP to catalyze the formation of ADP [55]. In addition, we found that protein levels of adenylate kinase, which is mainly involved in the process of nucleotide phosphorylation and nucleotide biosynthesis, were up-regulated in line 8723 under salt stress. Therefore, we speculate that ADK2 and adenylate kinase may coordinately regulate the concentration of purine ribonucleoside and the dynamic energy balance in cells to protect the normal growth and development of maize plants under salt stress.
Members of the Germin and Germin-like protein (GLP) families have been found to be closely related to salt stress responses in higher and lower plants [56,57]. Previous studies have suggested that OsGLP1 is involved in cell wall cross-linking and the maintenance of cell anatomy [58,59]. In addition, the RNAi-mediated gene silencing of OsGLP1 in rice (Oryza sativa L.) has shown that there is a negative correlation between OsGLP1 protein expression and salt tolerance in rice [60]. At the protein and mRNA level, we found that the GLP subfamily 1 member 11 was down regulated in line 8723 under salt stress. Therefore, we speculate that the negative regulation of this protein may enhance the salt tolerance of plants.
Plants use an antioxidant enzyme system to minimize oxidative damage to adapt to stressful environments [61,62,63]. Peroxidase is a kind of antioxidant enzyme which can reduce the toxic effect of the excessive accumulation of ROS in cells [64]. At protein and mRNA levels, we found that peroxidase 12 was up-regulated in line 8723 under salt stress, but we also found that peroxidase 72 was down-regulated in line 8723 under the same conditions. In addition, at the mRNA level, peroxidase 67 was found to be up-regulated in both inbred lines under salt stress. In our previous study, we found that salt stress led to a significant increase in peroxidase activity in the roots of maize inbred lines, with a more obvious increase in the salt-tolerant material [25]. Glutathione S-transferase can protect cells from oxygen poisoning, inhibit cell apoptosis and maintain cell survival under oxidative stress [65]. At the mRNA level, we found that glutathione transferase 9 was up-regulated in line 8723 under salt stress. In addition, we found that many other genes annotated with the labels of ‘oxidation-reduction process’, ‘extracellular region’, ‘peroxidase activity’, or ‘hydrogen peroxide catabolic process’ were enriched at the protein and mRNA levels in line 8723 under salt stress (Figure 3). We also found that a putative laccase family protein, potentially involved in the oxidation-reduction process, was up-regulated in line 8723 under salt stress. Arabidopsis peroxidase 72 has been shown to participate in lignification [66]. The feedback regulation of the phenylpropanoid metabolism has already been reported for Arabidopsis mutants in which laccases 4 and 17 are suppressed [67]. However, Zhao et al. [68] showed that laccase suppression does not divert carbon flux into other routes of phenylpropanoid metabolism, and the syntheses of enzymes that oxidize monolignols are required. Therefore, they reported that laccases and peroxidases are not redundant in monolignols polymerization, and that laccases may participate in the early stages of lignification. Furthermore, combined with previous reports, Fernández-Pérez et al. [66] proposed that the suppression of Arabidopsis peroxidase 72 alters the cell wall and phenylpropanoid metabolism. Therefore, we speculate that maize may enhance its tolerance to salt stress by differentially expressing peroxidases and laccases to regulate lignin components in the cell wall and phenylpropane metabolism.
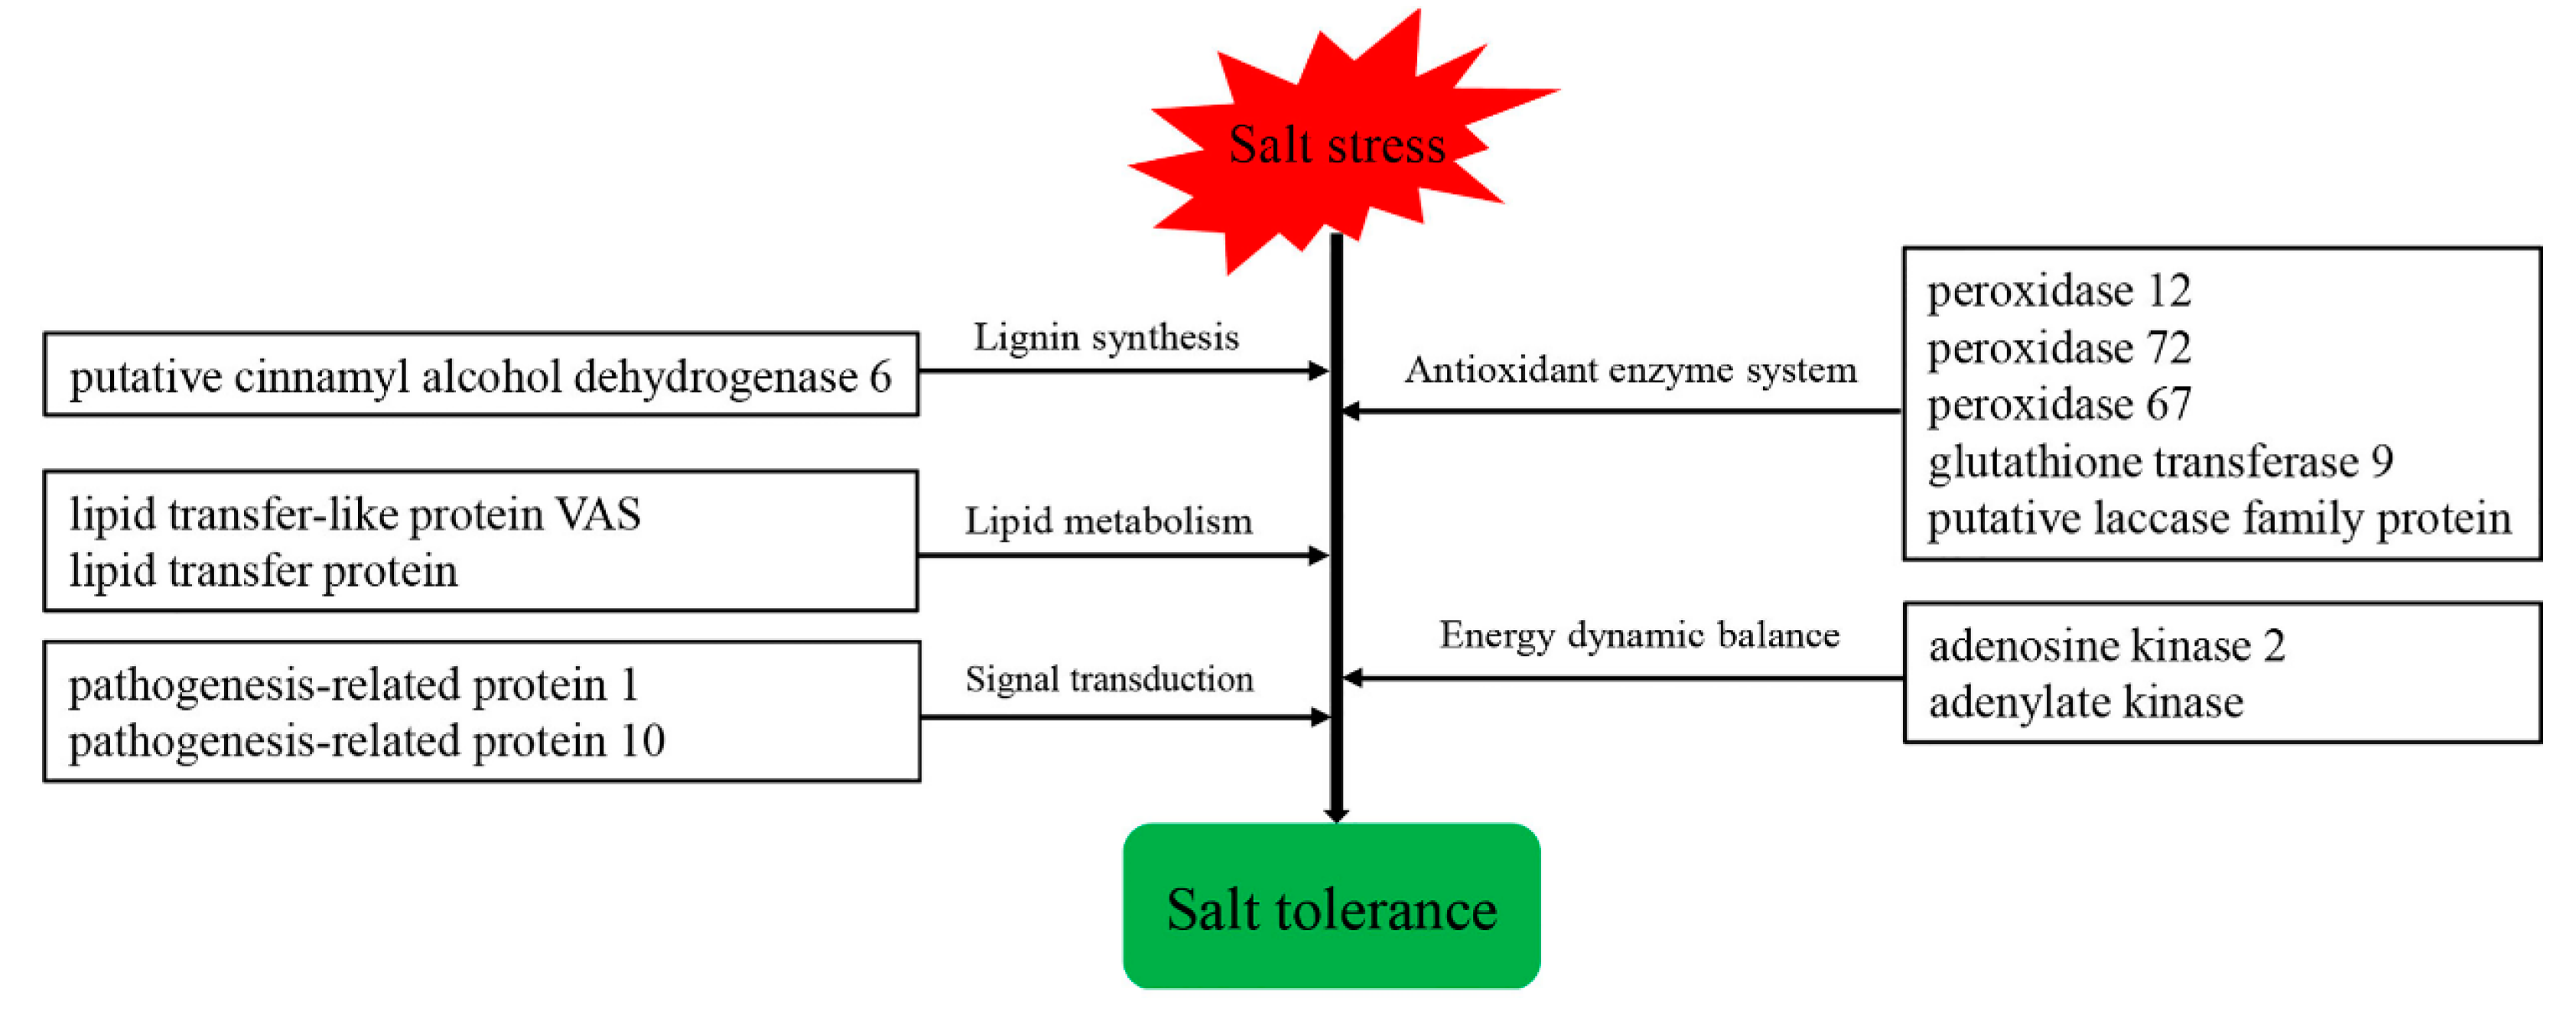
Based on the integrated analysis of the proteome and transcriptome of two maize inbred lines with different salt tolerance in the presence and absence of salt stress, we established the following model for maize salt tolerance (Figure 5). The stronger salt tolerance of line 8723 was mainly mediated by the up-regulation of lipid transporters and the lipid transfer-like protein VAS, resulting in increased lipid metabolism. The increased expression of CAD6 under salt stress promoted lignin synthesis, while the up-regulated expression of PRP1 and PRP10 activated the abscisic acid signal pathway, and thereby up-regulated the abiotic stress defenses. The up-regulation of ADK2 and adenylate kinase expression regulated the concentration of purine ribonucleoside to help maintain dynamic energy balance in the maize cells, enhancing the resistance to salt stress. In addition, to alleviate the accumulation of reactive oxygen species (ROS) in cells under salt stress, ROS scavenging and protective mechanisms were effectively enhanced by the up-regulation of peroxidase 12, peroxidase 67, glutathione transferase 9, the putative laccase family protein and the down-regulation of peroxidase 72.

5. Conclusions

To explore the molecular mechanisms of maize salt tolerance, the correlation between the transcriptome and proteome of the seedling roots of salt-tolerant maize inbred line 8723 and salt-sensitive maize inbred line P138 were analyzed under normal conditions and 180 mM NaCl stress conditions. In conclusion, our results provide a comprehensive gene expression and protein profile of maize in response to salt stress. We found that the correlation between proteome and transcriptome was not high. This may be due to the transcription of DNA into mRNA and the translation of mRNA into proteins by various factors, such as the regulation of the transcription and translation processes and post translational regulation, resulting in changes to the number of mRNA transcripts, protein location, quantity, and function, leading to a loss of correlation between mRNA and their corresponding proteins. It may also be caused by the non-differential expression of most genes and proteins in maize. In addition, we also identified 22 associated DEP/DEG candidates at the transcriptional and translation level involved in lignin biosynthesis, lipid metabolism, signal transduction and the antioxidant enzyme system. This study provides new leads to establish a deeper understanding the molecular mechanisms of salt tolerance in maize.

Supplementary Materials

The following supporting information can be downloaded at: https://www.mdpi.com/article/10.3390/agronomy12051053/s1, Table S1: Primer sequences used for qRT-PCR analysis in this article; Table S2: Correlation results at protein and transcriptional levels in line 8723 under salt stress; Table S3: Correlation results at protein and transcriptional levels in P138 under salt stress.

Author Contributions

Y.P. designed the experiments; F.C. performed the experiments; F.C., X.J. and Z.Z. analyzed the data; F.C. and wrote the manuscript. All authors have read and agreed to the published version of the manuscript.

Funding

This research was supported by the Gansu Provincial Key Laboratory of Aridland Crop Science, Gansu Agricultural University (Funder: Yunling Peng; No. GHSJ-2020-Z5), the Fuxi Talent Project of Gansu Agricultural University, China (Funder: Yunling Peng; No. GAUFX-02Y09), and the Lanzhou Science and Technology Bureau (Funder: Yunling Peng; No. 2020-RC-122).

Institutional Review Board Statement

Not applicable.

Informed Consent Statement

Not applicable.

Data Availability Statement

The mass spectrometric and original sequencing data have been submitted to ProteomeXchange (identifier PXD014409) and NCBI’s SRA (login number: PRJNA611672), respectively.

Acknowledgments

We thank the reviewers for the critical review of the manuscripts, and Peng Yunling for her guidance and revision.

Conflicts of Interest

The authors declare no conflict of interest.

References

  1. Zhang, J.; Xing, S.; Li, J.; Makeschin, F.; Song, Y. Agroforestry and its application in amelioration of saline soils in eastern China coastal region. For. Stud. China 2004, 6, 27–33. [Google Scholar] [CrossRef]
  2. Abbasi, G.; Javaid, A.; Anwar-ul-Haq, M.; Ahmad, N. Screening of maize hybrids for salt tolerance at seedling stage under hydroponic condition. Soil Environ. 2012, 31, 83–90. [Google Scholar]
  3. Munns, R.; Tester, M. Mechanisms of salinity tolerance. Annu. Rev. Plant Biol. 2008, 59, 651–681. [Google Scholar] [CrossRef] [PubMed] [Green Version]
  4. Shabala, S. Learning from halophytes: Physiological basis and strategies to improve abiotic stress tolerance in crops. Ann. Bot. 2013, 112, 1209–1221. [Google Scholar] [CrossRef] [PubMed]
  5. Li, G.K.; Gao, J.; Peng, H.; Shen, Y.O.; Ding, H.P.; Zhang, Z.M.; Pan, G.T.; Lin, H.J. Proteomic changes in maize as a response to heavy metal (lead) stress revealed by iTRAQ quantitative proteomics. Genet. Mol. Res. 2016, 15, 7254. [Google Scholar] [CrossRef]
  6. Campos, H.; Cooper, M.; Habben, J.; Edmeades, G.; Schussler, J. Improving drought tolerance in maize: A view from industry. Field Crops Res. 2004, 90, 19–34. [Google Scholar] [CrossRef]
  7. Min, H.; Chen, C.; Wei, S.; Shang, X.; Sun, M.; Xia, R.; Liu, X.; Hao, D.; Chen, H.; Xie, Q. Identification of drought tolerant mechanisms in maize seedlings based on transcriptome analysis of recombination inbred lines. Front. Plant Sci. 2016, 7, 1080. [Google Scholar] [CrossRef]
  8. Cui, D.; Wu, D.; Liu, J.; Li, D.; Xu, C.; Li, S.; Li, P.; Zhang, H.; Liu, X.; Jiang, C.; et al. Proteomic analysis of seedling roots of two maize inbred lines that differ significantly in the salt stress response. PLoS ONE 2015, 10, e0116697. [Google Scholar] [CrossRef]
  9. Nader, K.; Hoorn, J.W.; Hamdy, A.; Mastrorilli, M. Salinity effect on crop development and yield, analysis of salt tolerance according to several classification methods. Agric. Water Manag. 2003, 62, 37–66. [Google Scholar] [CrossRef]
  10. Gu, L.; Liu, Y.; Zong, X.; Liu, L.; Li, D.P.; Li, D.Q. Overexpression of maize mitogen-activated protein kinase gene, ZmSIMK1 in Arabidopsis increases tolerance to salt stress. Mol. Biol. Rep. 2010, 37, 4067–4073. [Google Scholar] [CrossRef]
  11. Wu, J.; Jiang, Y.; Liang, Y.; Chen, L.; Chen, W.; Cheng, B. Expression of the maize MYB transcription factor ZmMYB3R enhances drought and salt stress tolerance in transgenic plants. Plant Physiol. Biochem. 2019, 137, 179–188. [Google Scholar] [CrossRef] [PubMed]
  12. Zhang, X.; Cai, H.; Lu, M.; Wei, Q.; Xu, L.; Bo, C.; Ma, Q.; Zhao, Y.; Cheng, B. A maize stress-responsive Di19 transcription factor, ZmDi19-1, confers enhanced tolerance to salt in transgenic Arabidopsis. Plant Cell Rep. 2019, 38, 1563–1578. [Google Scholar] [CrossRef] [PubMed]
  13. Ritchie, M.D.; Holzinger, E.R.; Li, R.; Pendergrass, S.A.; Kim, D. Methods of integrating data to uncover genotype-phenotype interactions. Nat. Rev. Genet. 2015, 16, 85–97. [Google Scholar] [CrossRef] [PubMed]
  14. Vogel, C.; Marcotte, E.M. Insights into the regulation of protein abundance from proteomic and transcriptomic analyses. Nat. Rev. Genet. 2012, 13, 227–232. [Google Scholar] [CrossRef]
  15. Maier, T.; Güell, M.; Serrano, L. Correlation of mRNA and protein in complex biological samples. FEBS Lett. 2009, 583, 3966–3973. [Google Scholar] [CrossRef] [Green Version]
  16. Muers, M. Gene expression: Transcriptome to proteome and back to genome. Nat. Rev. Genet. 2011, 12, 518. [Google Scholar] [CrossRef]
  17. Liu, J.-F.; Xing, J.; Fang, J.; Ai, P.; Cheng, Y. New insight into ovary abortion during ovary development of hazelnut through a combined proteomic and transcriptomic analysis. Sci. Hortic. 2018, 234, 36–48. [Google Scholar] [CrossRef]
  18. Jiang, C.; Bi, Y.; Mo, J.; Zhang, R.; Qu, M.; Feng, S.; Essemine, J. Proteome and transcriptome reveal the involvement of heat shock proteins and antioxidant system in thermotolerance of Clematis florida. Sci. Rep. 2020, 10, 8883. [Google Scholar] [CrossRef]
  19. Ye, X.; Wang, H.; Chen, P.; Fu, B.; Zhang, M.; Li, J.; Zheng, X.; Tan, B.; Feng, J. Combination of iTRAQ proteomics and RNA-seq transcriptomics reveals multiple levels of regulation in phytoplasma-infected Ziziphus jujuba Mill. Hortic. Res. 2017, 4, 17080. [Google Scholar] [CrossRef] [Green Version]
  20. Zhao, Q.; Zhang, H.; Wang, T.; Chen, S.; Dai, S. Proteomics-based investigation of salt-responsive mechanisms in plant roots. J. Proteom. 2013, 82, 230–253. [Google Scholar] [CrossRef]
  21. Peng, Y.; Li, W.; Wang, K.; Wang, H. Effects of salt stress on seed germination and seedlings growth of salt-tolerant line and salt-sensitive line of maize. Acta Prataculturae Sin. 2012, 21, 62–71. [Google Scholar]
  22. Yun, S.H.; Park, G.W.; Kim, J.Y.; Kwon, S.O.; Choi, C.W.; Leem, S.H.; Kwon, K.H.; Yoo, J.S.; Lee, C.; Kim, S.; et al. Proteomic characterization of the Pseudomonas putida KT2440 global response to a monocyclic aromatic compound by iTRAQ analysis and 1DE-MudPIT. J. Proteom. 2011, 74, 620–628. [Google Scholar] [CrossRef] [PubMed]
  23. Zhu, H.G.; Cheng, W.H.; Tian, W.G.; Li, Y.J.; Liu, F.; Xue, F.; Zhu, Q.H.; Sun, Y.Q.; Sun, J. iTRAQ-based comparative proteomic analysis provides insights into somatic embryogenesis in Gossypium hirsutum L. Plant Mol. Biol. 2018, 96, 89–102. [Google Scholar] [CrossRef] [PubMed] [Green Version]
  24. Bradford, M.M. A rapid and sensitive method for the quantitation of microgram quantities of protein utilizing the principle of protein-dye binding. Anal. Biochem. 1976, 72, 248–254. [Google Scholar] [CrossRef]
  25. Chen, F.; Fang, P.; Peng, Y.; Zeng, W.; Zhao, X.; Ding, Y.; Zhuang, Z.; Gao, Q.; Ren, B. Comparative proteomics of salt-tolerant and salt-sensitive maize inbred lines to reveal the molecular mechanism of salt tolerance. Int. J. Mol. Sci. 2019, 20, 4725. [Google Scholar] [CrossRef] [PubMed] [Green Version]
  26. Chen, F.; Fang, P.; Zeng, W.; Ding, Y.; Zhuang, Z.; Peng, Y. Comparing transcriptome expression profiles to reveal the mechanisms of salt tolerance and exogenous glycine betaine mitigation in maize seedlings. PLoS ONE 2020, 15, e0233616. [Google Scholar] [CrossRef]
  27. Kim, D.; Langmead, B.; Salzberg, S.L. HISAT: A fast spliced aligner with low memory requirements. Nat. Methods 2015, 12, 357–360. [Google Scholar] [CrossRef] [Green Version]
  28. Li, B.; Dewey, C. RSEM: Accurate transcript quantification from RNA-Seq data with or without a reference genome. BMC Bioinform. 2011, 12, 323. [Google Scholar] [CrossRef] [Green Version]
  29. Lan, P.; Li, W.; Schmidt, W. Complementary proteome and transcriptome profiling in phosphate-deficient Arabidopsis roots reveals multiple levels of gene regulation. Mol. Cell. Proteom. 2012, 11, 1156–1166. [Google Scholar] [CrossRef] [Green Version]
  30. Livak, K.J.; Schmittgen, T.D. Analysis of relative gene expression data using real-time quantitative PCR and the 2−ΔΔCT Method. Methods 2001, 25, 402–408. [Google Scholar] [CrossRef]
  31. Kitano, H. Systems biology: A brief overview. Science 2002, 295, 1662–1664. [Google Scholar] [CrossRef] [PubMed] [Green Version]
  32. Wu, J.; Xu, Z.; Zhang, Y.; Chai, L.; Yi, H.; Deng, X. An integrative analysis of the transcriptome and proteome of the pulp of a spontaneous late-ripening sweet orange mutant and its wild type improves our understanding of fruit ripening in citrus. J. Exp. Bot. 2014, 65, 1651–1671. [Google Scholar] [CrossRef] [PubMed] [Green Version]
  33. Ma, J.; Zheng, G.; Pei, C.; Zhang, Z. Correlation Analysis on proteomic and transcriptomic of salt-response in leaves of southern type alfalfa. J. Nucl. Agric. Sci. 2016, 30, 1706–1715. [Google Scholar]
  34. Deribe, Y.L.; Pawson, T.; Dikic, I. Post-translational modifications in signal integration. Nat. Struct. Mol. Biol. 2010, 17, 666–672. [Google Scholar] [CrossRef] [PubMed]
  35. Karas, M.; Hillenkamp, F. Laser desorption ionization of proteins with molecular masses exceeding 10,000 daltons. Anal. Chem. 1988, 60, 2299–2301. [Google Scholar] [CrossRef]
  36. Betz, G.A.; Knappe, C.; Lapierre, C.; Olbrich, M.; Welzl, G.; Langebartels, C.; Heller, W.; Sandermann, H.; Ernst, D. Ozone affects shikimate pathway transcripts and monomeric lignin composition in European beech (Fagus sylvatica L.). Eur. J. For. Res. 2009, 128, 109–116. [Google Scholar] [CrossRef]
  37. Tronchet, M.; Balagué, C.; Kroj, T.; Jouanin, L.; Roby, D. Cinnamyl alcohol dehydrogenases-C and D, key enzymes in lignin biosynthesis, play an essential role in disease resistance in Arabidopsis. Mol. Plant Pathol. 2010, 11, 83–92. [Google Scholar] [CrossRef]
  38. Zhao, Q.; Dixon, R.A. Transcriptional networks for lignin biosynthesis: More complex than we thought? Trends Plant Sci. 2011, 16, 227–233. [Google Scholar] [CrossRef] [Green Version]
  39. Sánchez-Aguayo, I.; Rodríguez-Galán, J.M.; García, R.; Torreblanca, J.; Pardo, J.M. Salt stress enhances xylem development and expression of S-adenosyl-L-methionine synthase in lignifying tissues of tomato plants. Planta 2004, 220, 278–285. [Google Scholar] [CrossRef]
  40. Bi, C.; Chen, F.; Jackson, L.; Gill, B.; Li, W. Expression of lignin biosynthetic genes in wheat during development and upon infection by fungal pathogens. Plant Mol. Biol. Rep. 2011, 29, 149–161. [Google Scholar] [CrossRef]
  41. Kaur, H.; Shaker, K.; Heinzel, N.; Ralph, J.; Gális, I.; Baldwin, I.T. Environmental stresses of field growth allow cinnamyl alcohol dehydrogenase-deficient Nicotiana attenuata plants to compensate for their structural deficiencies. Plant Physiol. 2012, 159, 1545–1570. [Google Scholar] [CrossRef] [PubMed] [Green Version]
  42. Sibout, R.; Eudes, A.; Pollet, B.; Goujon, T.; Mila, I.; Granier, F.; Séguin, A.; Lapierre, C.; Jouanin, L. Expression pattern of two paralogs encoding cinnamyl alcohol dehydrogenases in Arabidopsis. Isolation and characterization of the corresponding mutants. Plant Physiol. 2003, 132, 848–860. [Google Scholar] [CrossRef] [PubMed]
  43. Chen, A.P.; Zhong, N.Q.; Qu, Z.L.; Wang, F.; Liu, N.; Xia, G.X. Root and vascular tissue-specific expression of glycine-rich protein AtGRP9 and its interaction with AtCAD5, a cinnamyl alcohol dehydrogenase, in Arabidopsis thaliana. J. Plant Res. 2007, 120, 337–343. [Google Scholar] [CrossRef] [PubMed]
  44. Walther, T.C.; Farese, R.V., Jr. Lipid droplets and cellular lipid metabolism. Annu. Rev. Biochem. 2012, 81, 687–714. [Google Scholar] [CrossRef] [Green Version]
  45. Kim, H.; Lee, S.B.; Kim, H.J.; Min, M.K.; Hwang, I.; Suh, M.C. Characterization of glycosylphosphatidylinositol-anchored lipid transfer protein 2 (LTPG2) and overlapping function between LTPG/LTPG1 and LTPG2 in cuticular wax export or accumulation in Arabidopsis thaliana. Plant Cell Physiol. 2012, 53, 1391–1403. [Google Scholar] [CrossRef] [Green Version]
  46. Guo, C.; Ge, X.; Ma, H. The rice OsDIL gene plays a role in drought tolerance at vegetative and reproductive stages. Plant Mol. Biol. 2013, 82, 239–253. [Google Scholar] [CrossRef]
  47. Yu, K.; Soares, J.M.; Mandal, M.K.; Wang, C.; Chanda, B.; Gifford, A.N.; Fowler, J.S.; Navarre, D.; Kachroo, A.; Kachroo, P. A feedback regulatory loop between G3P and lipid transfer proteins DIR1 and AZI1 mediates azelaic-acid-induced systemic immunity. Cell Rep. 2013, 3, 1266–1278. [Google Scholar] [CrossRef] [Green Version]
  48. Pitzschke, A.; Datta, S.; Persak, H. Salt stress in Arabidopsis: Lipid transfer protein AZI1 and its control by mitogen-activated protein kinase MPK3. Mol. Plant 2014, 7, 722–738. [Google Scholar] [CrossRef] [Green Version]
  49. Torres-Schumann, S.; Godoy, J.A.; Pintor-Toro, J.A. A probable lipid transfer protein gene is induced by NaCl in stems of tomato plants. Plant Mol. Biol. 1992, 18, 749–757. [Google Scholar] [CrossRef]
  50. Pan, Y.; Li, J.; Jiao, L.; Li, C.; Zhu, D.; Yu, J. A non-specific setaria italica lipid transfer protein gene plays a critical role under abiotic stress. Front. Plant Sci. 2016, 7, 1752. [Google Scholar] [CrossRef] [Green Version]
  51. Han, X.; He, X.; Wenmin, Q.; Lu, Z.; Zhang, Y.; Chen, S.; Liu, M.; Qiao, G.; Renying, Z. Pathogenesis-related protein PR10 from Salix matsudana Koidz exhibits resistance to salt stress in transgenic Arabidopsis thaliana. Environ. Exp. Bot. 2017, 141, 74–82. [Google Scholar] [CrossRef]
  52. Jain, S.; Kumar, D.; Jain, M.; Chaudhary, P.; Deswal, R.; Sarin, N.B. Ectopic overexpression of a salt stress-induced pathogenesis-related class 10protein (PR10) gene from peanut (Arachis hypogaea L.) affords broad spectrum abiotic stress tolerance in transgenic tobacco. Plant Cell Tissue Organ Cult. 2012, 109, 19–31. [Google Scholar] [CrossRef]
  53. Seo, P.J.; Lee, A.K.; Xiang, F.; Park, C.M. Molecular and functional profiling of Arabidopsis pathogenesis-related genes: Insights into their roles in salt response of seed germination. Plant Cell Physiol. 2008, 49, 334–344. [Google Scholar] [CrossRef] [PubMed] [Green Version]
  54. Weretilnyk, E.A.; Alexander, K.J.; Drebenstedt, M.; Snider, J.D.; Summers, P.S.; Moffatt, B.A. Maintaining methylation activities during salt stress. The involvement of adenosine kinase. Plant Physiol. 2001, 125, 856–865. [Google Scholar] [CrossRef] [Green Version]
  55. Lange, P.R.; Geserick, C.; Tischendorf, G.; Zrenner, R. Functions of chloroplastic adenylate kinases in Arabidopsis. Plant Physiol. 2008, 146, 492–504. [Google Scholar] [CrossRef] [Green Version]
  56. Dunwell, J.; Gibbings, G.; Mahmood, T.; Naqvi, S.M.S. Germin and germin-like proteins: Evolution, structure, and function. Crit. Rev. Plant Sci. 2008, 27, 342–375. [Google Scholar] [CrossRef]
  57. Barman, A.R.; Banerjee, J. Versatility of germin-like proteins in their sequences, expressions, and functions. Funct. Integr. Genom. 2015, 15, 533–548. [Google Scholar] [CrossRef]
  58. Banerjee, J.; Maiti, M.K. Functional role of rice germin-like protein1 in regulation of plant height and disease resistance. Biochem. Biophys. Res. Commun. 2010, 394, 178–183. [Google Scholar] [CrossRef]
  59. Banerjee, J.; Das, N.; Dey, P.; Maiti, M.K. Transgenically expressed rice germin-like protein1 in tobacco causes hyper-accumulation of H2O2 and reinforcement of the cell wall components. Biochem. Biophys. Res. Commun. 2010, 402, 637–643. [Google Scholar] [CrossRef]
  60. Banerjee, J.; Gantait, S.; Maiti, M.K. Physiological role of rice germin-like protein 1 (OsGLP1) at early stages of growth and development in indica rice cultivar under salt stress condition. Plant Cell Tissue Organ Cult. 2017, 131, 127–137. [Google Scholar] [CrossRef]
  61. Sandalio, L.M.; Rodríguez-Serrano, M.; Romero-Puertas, M.C.; del Río, L.A. Role of peroxisomes as a source of reactive oxygen species (ROS) signaling molecules. Sub-Cell. Biochem. 2013, 69, 231–255. [Google Scholar] [CrossRef]
  62. Ma, L.; Zhang, H.; Sun, L.; Jiao, Y.; Zhang, G.; Miao, C.; Hao, F. NADPH oxidase AtrbohD and AtrbohF function in ROS-dependent regulation of Na⁺/K⁺ homeostasis in Arabidopsis under salt stress. J. Exp. Bot. 2012, 63, 305–317. [Google Scholar] [CrossRef] [PubMed]
  63. Zenda, T.; Liu, S.; Wang, X.; Jin, H.; Liu, G.; Duan, H. Comparative proteomic and physiological analyses of two divergent maize inbred lines provide more insights into drought-stress tolerance mechanisms. Int. J. Mol. Sci. 2018, 19, 3225. [Google Scholar] [CrossRef] [Green Version]
  64. Azevedo Neto, A.; Prisco, J.T.; Enéas-Filho, J.; Abreu, C.; Gomes-Filho, E. Effect of salt stress on antioxidative enzymes and lipid peroxidation in leaves and roots of salt-tolerant and salt-sensitive maize genotypes. Environ. Exp. Bot. 2006, 56, 87–94. [Google Scholar] [CrossRef]
  65. Qi, Y.C.; Liu, W.Q.; Qiu, L.Y.; Zhang, S.M.; Ma, L.; Zhang, H. Overexpression of glutathione S-transferase gene increases salt tolerance of Arabidopsis. Russ. J. Plant Physiol. 2010, 57, 233–240. [Google Scholar] [CrossRef]
  66. Fernández-Pérez, F.; Pomar, F.; Pedreño, M.A.; Novo-Uzal, E. Suppression of Arabidopsis peroxidase 72 alters cell wall and phenylpropanoid metabolism. Plant Sci. Int. J. Exp. Plant Biol. 2015, 239, 192–199. [Google Scholar] [CrossRef]
  67. Berthet, S.; Demont-Caulet, N.; Pollet, B.; Bidzinski, P.; Cézard, L.; Le Bris, P.; Borrega, N.; Hervé, J.; Blondet, E.; Balzergue, S.; et al. Disruption of LACCASE4 and 17 results in tissue-specific alterations to lignification of Arabidopsis thaliana stems. Plant Cell 2011, 23, 1124–1137. [Google Scholar] [CrossRef] [Green Version]
  68. Zhao, Q.; Nakashima, J.; Chen, F.; Yin, Y.; Fu, C.; Yun, J.; Shao, H.; Wang, X.; Wang, Z.Y.; Dixon, R.A. Laccase is necessary and nonredundant with peroxidase for lignin polymerization during vascular development in Arabidopsis. Plant Cell 2013, 25, 3976–3987. [Google Scholar] [CrossRef] [Green Version]
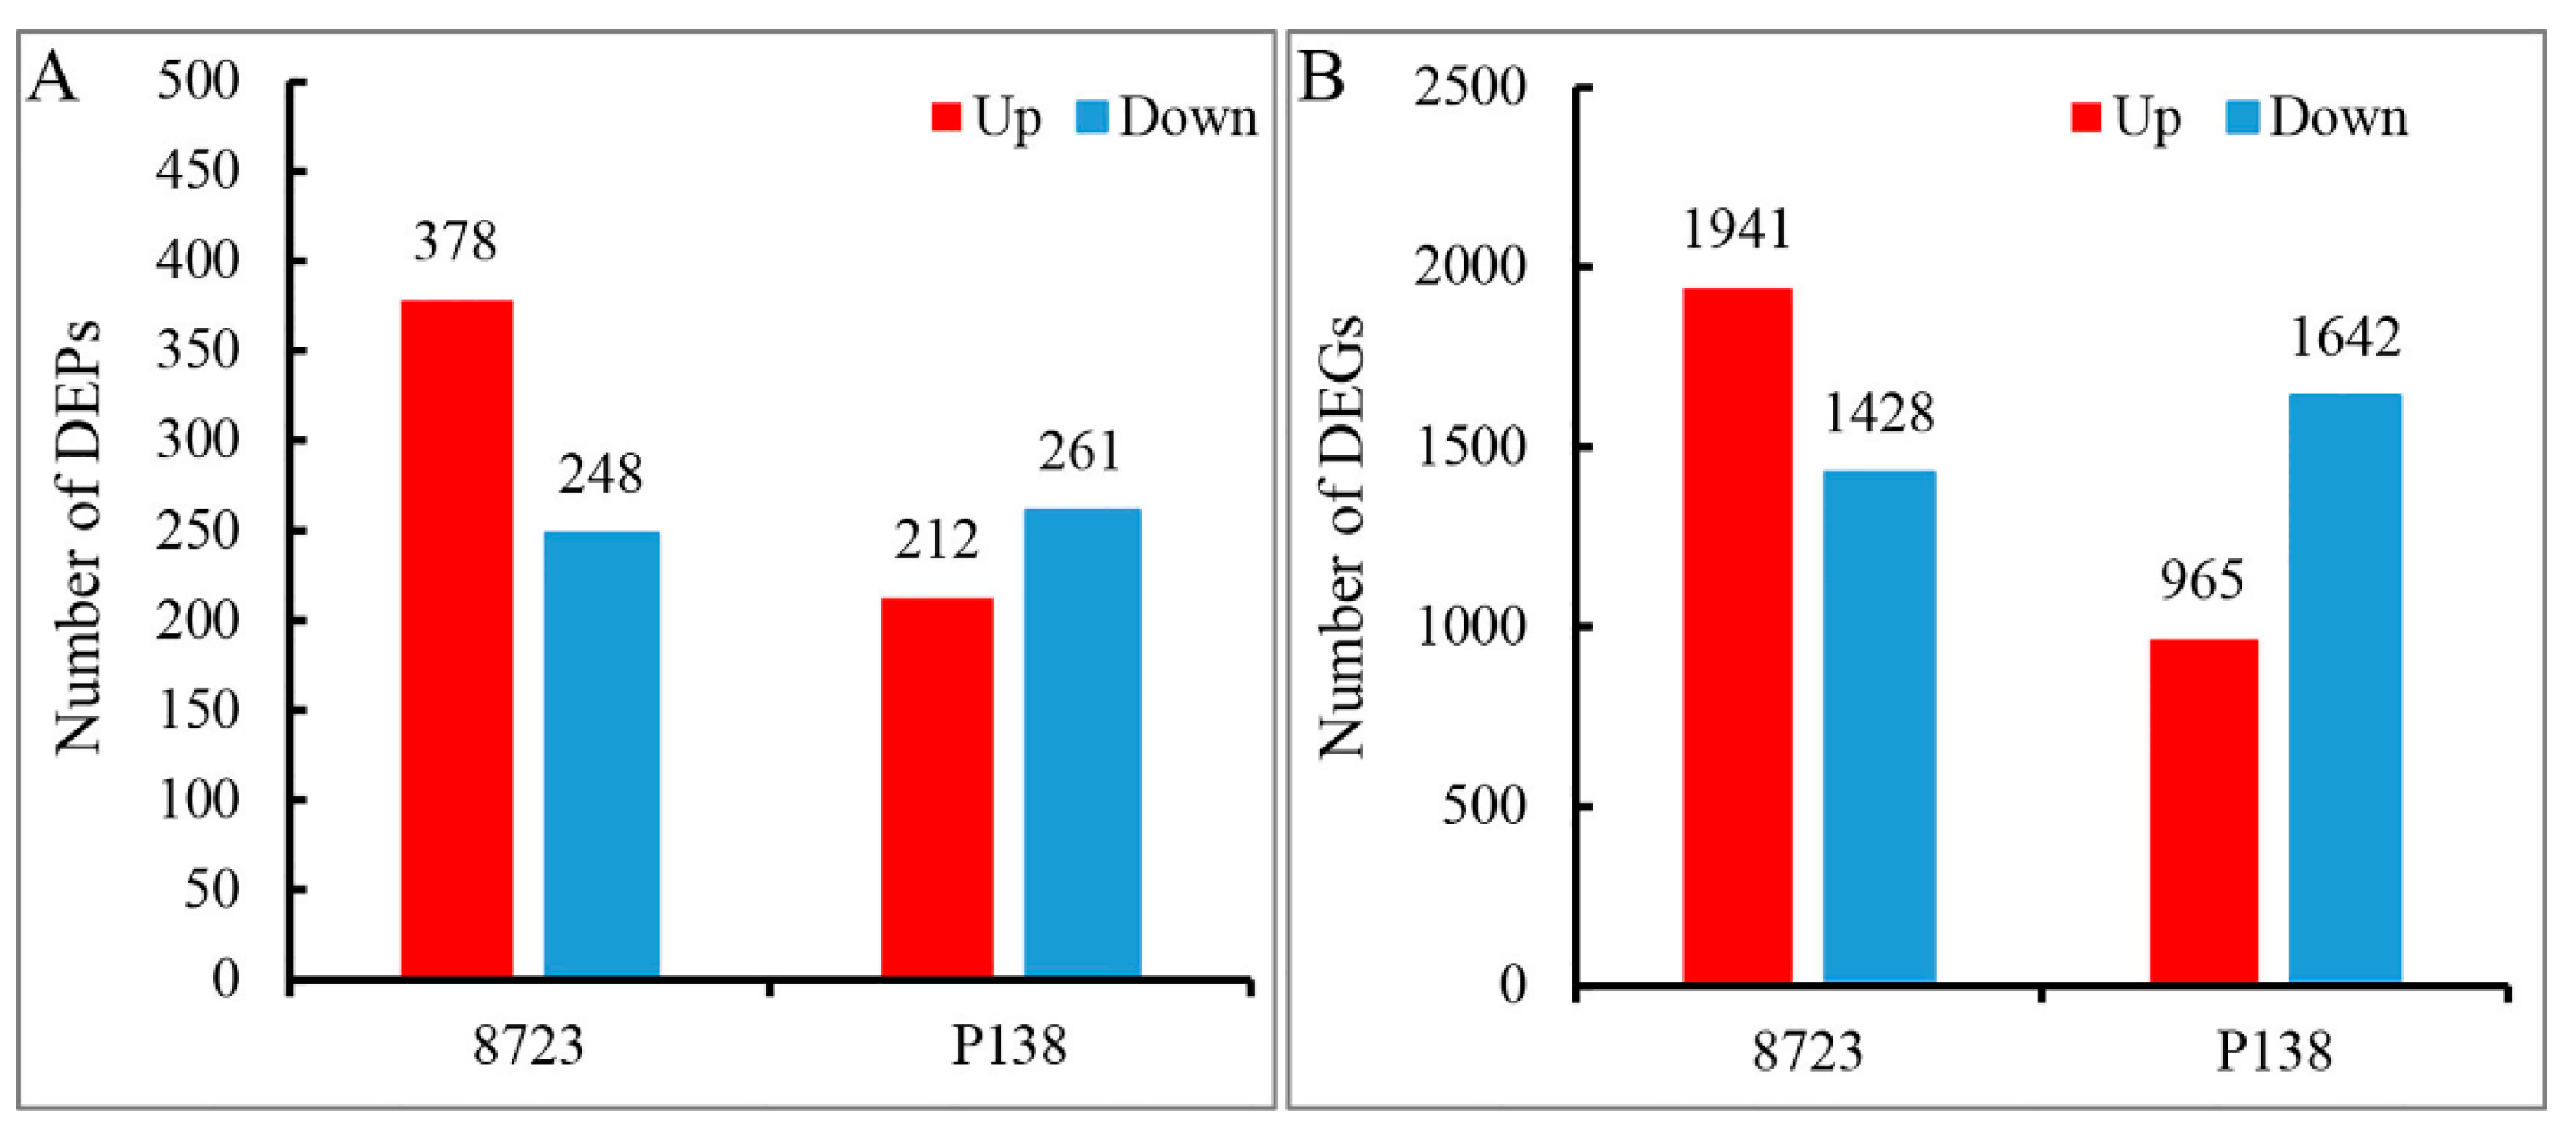
Figure 1. Comparison of DEPs and DEGs in lines 8723 and P138 in response to salt stress. (A) The numbers of DEPs in each line; (B) the numbers of DEGs in each line.
Agronomy 12 01053 g001
Figure 2. Correlation between DEPS and their corresponding genes and Venn diagram analysis of the associated proteins and genes. (A) Association graphs of the DEPs under salt stress related to the corresponding genes in line 8723; (B) association graphs of the DEPs under salt stress related to the corresponding genes in P138; (C,D) Venn diagram of the associated genes and proteins of line 8723 under salt stress; (E,F) Venn diagram of P138-associated genes and proteins in response to salt stress. Abbreviations: DEPs—differentially expressed proteins; DEGs—differentially expressed genes; Non-DEPs—non-differentially expressed proteins; Non-DEGs—non-differentially expressed genes.
Agronomy 12 01053 g002
Figure 3. GO enrichment analysis of associated DEPs and DEGs. (A) GO enrichment analysis of line 8723 in response to salt stress; (B) GO enrichment analysis of P138 in response to salt stress.
Agronomy 12 01053 g003
Figure 4. The relative expression of selected genes was verified by qRT-PCR. Abbreviations: PCAD6—putative cinnamyl alcohol dehydrogenase 6; PRP1—pathogenesis-related protein 1; CPRD49—GDSL esterase/lipase CPRD49; ADK2—adenosine kinase 2; GT9—glutathione transferase 9; POD12—peroxidase 12; AGT—anthocyanidin 3-O-glucosyltransferase; POD72—peroxidase 72; TKFP—tyrosine kinase family protein; FLS2—LRR receptor-like serine/threonine-protein kinase FLS2; PMACBP1—plasma membrane-associated cation-binding protein 1; UNC—uncharacterized LOC100283518.
Agronomy 12 01053 g004
Figure 5. Molecular model of the salt tolerance mechanisms of maize seedling roots.
Agronomy 12 01053 g005
Table 1. Results of the correlation analysis between the DEPs and DEGs of two inbred lines under salt stress.
Comparable GroupGene IDProtein ID DEGs-FCDEPs-FCGene Description
Line 8723S vs. line 8723CK 100272868B4FR972.111.24Putative cinnamyl alcohol dehydrogenase 6
103653695A0A1D6Q3Y30.011.22BAF250_C domain-containing protein
103626441A0A1D6GW540.371.27Lipid transfer-like protein VAS
103634525A0A1D6JZU33.531.37Pathogenesis-related protein 1
100502492A0A1D6G9012.020.77Putative laccase family protein
103642203A0A1D6JI740.480.56GDSL esterase/lipase CPRD49
103653801K7UH132.241.34Adenosine kinase 2
542629Q9FQD02.711.22Glutathione transferase 9
100194034B4FH682.711.21Peroxidase 12
100286113B6UEL12.110.69Germin-like protein subfamily 1 member 11
103629444A0A1D6LKL10.451.30Zinc finger family protein
100281608B6SWX32.581.28Anthocyanidin 3-O-glucosyltransferase
100216875B4FK560.270.82Peroxidase 72
103627158A0A1D6H8782.400.76DUF679 domain membrane protein 7
P138S vs. P138CK 103648046A0A1D6F6D80.451.21UPF0481 protein At3g47200
100193724A0A1D6E1G80.160.77Tyrosine kinase family protein
103645931A0A1D6DZ882.361.39LRR receptor-like serine/threonine-protein kinase FLS2
103654805K7U6R90.341.21Allene oxide synthase 3
100193942B4FGU50.471.22Putidaredoxin reductase homolog1
100273295B4FUC40.460.77Plasma membrane-associated cation-binding protein 1
100283521B6TJ400.491.21Lipid transfer protein
100283518B6TJ320.370.82Uncharacterized LOC100283518
Publisher’s Note: MDPI stays neutral with regard to jurisdictional claims in published maps and institutional affiliations.