Abstract
Tillage management is a direct factor in affecting soil quality, which is a key factor in sustainable agriculture. However soil quality evaluation needs significant manpower, material resources and time. To explore the sensitive indicators of soil quality affected by tillage management, eight soil physical and chemical properties under three tillage managements, including plow tillage, subsoiling tillage and rotary tillage, were determined under a long-term experiment in North China Plain. The results showed that subsoiling tillage management had the highest soil organic carbon and total nitrogen in the 0–20 cm layer and the lowest soil bulk density in the 30–40 cm layer. Rotary tillage management had the highest soil water content in the 0–40 cm layer. Meanwhile, compared to 2002, the soil organic carbon, total nitrogen and soil bulk density had varied greatly in 2012, but there was no significant difference between 2012 and 2018. However, other property concentrations tended to increase in 2002, 2012 and 2018. In addition, there was a significant linear relationship between soil quality index and grain yield. Subsoiling tillage management had the highest soil quality index and gain yield both in 2012 and 2018. The soil quality can be evaluated through the sensitive indicator of soil organic carbon, total nitrogen, soil bulk density, total phosphorus and soil water content, which provides a scientific basis for selecting reasonable tillage management and evaluating soil quality in this agricultural production area or other similar areas.
1. Introduction
Worldwide cropland degradation has been increasing and worsening as a result of the excessive utilization of land resources [1]. Currently, about 1.5 billion human beings are negatively impacted by land degradation [2]. Numerous studies have shown that soil quality is closely related to cropland management [3,4,5]. Intensive cropland management can easily lead to increases in soil compactness, soil structure deterioration, etc., and is thus responsible for soil degradation [6]. On the contrary, conservation tillage management plays a vital role in agricultural sustainable production, which improves soil resilience and nutrient recovery through modifying soil attributes such as the physical and chemical properties [3,7]. However, change in soil quality may not be evident until years after initiation of tillage management [3]. Therefore, information on the long-term changes of tillage management need to be collected to develop an assessment and monitoring system.
Conservation tillage can improve the ability of the soil environment to retain its key functions under internal and climatic tensions, including achieving a soil organic carbon (SOC) sequestration rate of 0.4–0.8 Pg C yr−1 across all cropping systems globally by the residue biochar [8,9], reducing soil bulk density by 5.19% and increasing porosity by 5.69% at a 0–60 cm soil depth as compared to plow tillage [10]. Meanwhile, conservation tillage can improve labor productivity and achieve economic benefits; it has been widely used around the world in the past few decades [11]. Due to the fact that specific implementation methods of conservation tillage are closely related to agricultural environmental conditions, the conservation tillage model should be developed according to local conditions. Thus, evaluating the soil quality under tillage management can promote the development of conservation tillage.
There are many soil indicators affecting soil quality, including physical characteristics, chemical properties and biological processes [12]. Although all soil indicators can directly and comprehensively provide evidence of soil quality, this method is expensive, time-consuming and labor-intensive [13]. To solve this problem, sensitive indicators are selected from all soil properties that can not only reduce the burden of a large volume of data but also indicate soil quality [14]. Therefore, many soil quality assessment methods have been released, such as soil quality index methods, soil management assessment frameworks and association rules of fuzzy modeling [15]. Previous studies have shown that the soil quality index (SQI) method is quantitatively flexible, easy to use and is closely related to soil management practices [16].
The SQI method, carried out by selecting a wide range of soil properties, can not only influence the functions of soil nutrient cycles but also can respond sensitively to changes in soil quality, using principal component analysis (PCA) to categorically group the soil properties into principal components (PCs) [14]. Then, the sensitive indicators are judged by the load vector direction of PCs [15]. However, the sensitive indicators for soil quality show large differences in different regions [17]. Therefore, it is very important to explore the soil sensitive indicators that affect soil quality for assessing tillage management.
The North China Plain provides one-fifth of China’s grain production and is an agricultural area with a long history of intensive cultivation [18]. Winter wheat (Triticum aestivum L.)–summer maize (Zea mays L.) double cropping is the main cropping system in this region and accounts for about three-quarters of national wheat production and one-third of national maize production [19]. However, the soil has been affected by high-density tillage management in this region [20]. Thus, promotion and assessment of agricultural productivity in this region is urgent, as it affects farmers’ adoption of conservation tillage technology.
This study is based on a long-term field experiment from 2002, including three tillage management methods in the North China Plain. The determination of the soil physical and chemical properties in 2002, 2012 and 2018 was used to analyze the spatio-temporal variation of soil physical and chemical properties and obtain the soil quality index and sensitive indicators under different tillage management methods.
2. Materials and Methods
2.1. Study Site
The continuous field experiment was conducted from 2002 at Tai’an Experimental Station of Shandong Agricultural University (36°09′ N, 117°09′ E; 135 m a.s.l.), Shandong Province, in the North China Plain. A double-cropping system using winter wheat and summer maize is the main cropping system. The site has a temperate monsoon climate, with an average annual precipitation, temperature, sunlight time and frost-free period of 667 mm, 12.6 °C, 2462.3 h and 195 days, respectively, from 1951 to 2018.
2.2. Experimental Design
The long-term experiment was arranged using a randomized complete block design with three replicates. Each plot was 15 × 4 m2. The crop was continuous winter wheat and summer maize. Three treatments were applied: PT (by moldboard plow), ST (by vibrating subsoiling shovel) and RT (by rototiller plow); details of the operations are shown in Table 1 and a previous study [5]. Popular cultivars of winter wheat, Jimai22, and summer maize, Zhengdan958, were used in the trial at rates of 120 kg ha−1 and 74,077 seeds ha−1, respectively. The row spacing of wheat and maize are 20 cm and 60 cm, respectively. During the winter wheat growth period, each plot received 120 kg of N ha−1, 67 kg of P2O5 ha−1 and 75 of kg K2O ha−1 before sowing, and 120 kg of N ha−1 was applied as topdressing at the jointing stage, with 75 mm of irrigation at the seedling stage, jointing stage and flowering period. For the summer maize, 120 kg of N ha−1, 40 kg of P2O5 ha−1 and 75 kg of K2O ha−1 were applied as basal fertilizer, and an additional 120 kg of N ha−1 was applied as topdressing at the silking stage with 75 mm of irrigation. Urea (N ≥ 46%), diammonium phosphate (N-P2O5-K2O 18-46-0) and potassium chloride (KCl ≥ 60%) were used as fertilizer throughout the year.

Table 1.
The detailed operation of three tillage management methods.
2.3. Soil Sampling and Analysis
Soil samples were collected in 2002, 2012 and 2018. Soil samples were collected randomly from each plot at 10 cm increments, down to a depth of 40 cm, and divided into two parts. One part was used to measure soil water content, which was measured using the oven-drying method. The other part was air-dried, finely ground, and passed through a 2 mm sieve after being thoroughly mixed, and then it was used to measure soil properties. SOC used the potassium dichromate-sulfuric acid external heating method, total nitrogen (TN) was determined by the Kjeldahl method, total potassium (TK) was determined by the H2SO4-H2O2 boiling and flame photometer method, available potassium (AK) was measured by the ammonium acetate oscillation extraction and flame photometry method, total phosphorus (TP) was determined by the H2SO4-H2O2 boiling and ascorbic acid molybdenum blue method, and available phosphorus (AP) was measured by the sodium bicarbonate extraction and ascorbic acid molybdenum blue method, as described by Bao [21].
Undisturbed soil samples were collected randomly with five replicates from each plot, which used a 100 cm3 standard sharpened steel cutting ring (5.1 cm height and 5 cm diameter) at 10 cm increments down to a depth of 40 cm. The soil was weighed after it was dried in an oven at 105 °C. The soil bulk density (BD) was calculated using the following formula:
Soil bulk density (g cm−3) = dry soil weight (g)/volume of cutting ring (cm3)
For the long-term experiment, the grain yield of wheat and maize were determined at the experiment site from 2012 to 2018. The grain yield was measured as follows: (i) In each plot, ears of maize were harvested from 2 rows that were 10 m long; the spikes of wheat were measured randomly from a 1 m2 area in each plot. (ii) The maize and wheat were air-dried and threshed, and then the grain moisture content was determined after oven-drying at 60 °C for 96 h. The grain yields were computed by adjusting the respective weights to 14% moisture for maize and 13% for wheat.
2.4. Soil Quality Assessment
The first step was to select soil indicators, to establish a minimum data set (MDA), that can influence the capacity of the soil to perform and are sensitive to the gain yield [22]. We employed PCA as a tool to reduce redundant information of the original data set and to establish group-related soil properties into several small sets of independent factors that are PCs [16]. Only PCs with eigenvalues ≥1 were selected. The indicators within the same principal component load ≥ 0.5 were divided into same group. If the load of an indicator of each principal component was lower than 0.5, it was divided into the group with the highest load value. If the load of an indicator was higher than 0.5 in two PCs at the same time, the indicator was merged into the group with low correlation with other indicators. When more than one variable was retained in a PC, correlation analysis was applied. Both indicators were considered if they were uncorrelated; otherwise, the indicator with the strongest correlation was selected for the MDA.
Second, soil indicators from MDA were transformed into normalized values between 0.1 and 1.0 (the score of soil indicators). The actual shape of indicators was either a sigmoid curve or a parabolic curve [23]. The equations of the score curves were used to calculate the scores of soil indicators. The critical values of the scoring curves were as specified by Shi and Song [24] (Table 2) and the 25th and 75th percentiles, in accordance with following formula [25].
where, f (x) is the score of soil quality indicators, x is the measured value of the soil indicators, and a, b, a1, a2, b1, and b2 are critical values shown in Table 3.
Table 2.
The classification standards for some soil properties based on the second national soil census of China and other previous studies.
Table 3.
The critical values in Formulas (2) and (3).
The weights of indicators can be determined by the communality of PCA divided by the total eigenvalues.
The norm values were calculated as in the following formula [26].
where Nik is the comprehensive loading of soil variable i in the first k PCs, ik is the eigenvalue of the PC, and Uik is the loading of soil variable i in PCk. Indicators receiving Nik within 10% of the highest norm values were selected for the MDA.
Finally, the SQI was calculated after the selected indicators were scored and weighted using the Integrated Quality Index equation as in the following formula:
where Wi is the weighing value of indicators, Si is the indicator score, and n is the number of variables integrated in the index. Higher SQI values indicate better soil quality [27].
2.5. Statistical Analysis
Experimental data were analyzed under three tillage managements, four stages and four depths. Differences among treatments, depths, and periods for AK, AP, BD, SOC, SWC, TK, TP and TN were checked using the homogeneity of variances and analyzed using the LSD analysis of variance (ANOVA) in SPSS software program (ver. 17.0; SPSS Inc., Chicago, IL, USA). Factor analysis was used to select the soil quality indicators using SPSS software. Linear regression analysis was used to evaluate the correlation of grain yield and SQI. Pearson’s correlation analysis was conducted to identify the relationships among the soil properties, and the analyses were performed in R (ver. 3.5.3; RStudio, Inc., Boston, MA, USA).
3. Results
3.1. Multivariate Analysis of Variance (MANOVA)
These results indicate that period, tillage, depth or their interactions significantly affected at least one of the eight variables evaluated within this analysis (Table 4). The significant difference of the Period × Tillage interaction indicates that the effect of period on the soil properties differs based on the tillage management. The significant difference of the Tillage × Depth interaction is indicative of the stratification that occurs under different tillage management. Thus, we analyzed the date of all periods and divided soil layers into four parts to study the effects of tillage on soil properties.
Table 4.
Multivariate analysis of variance (MANOVA) results to assess the effect of period, tillage, depth and their interactions over eight measured soil properties.
3.2. Soil Properties
Table S1 shows that in the 0–10 cm layer, the levels of TN and SOC under ST were significantly higher than those under RT and PT, and the levels of TK and SWC under RT were significantly higher than those under ST and PT. In the 10–20 cm layer, Values of BD and SWC were significantly highest under RT as compared to under PT and ST. In the 20–30 cm layer, the contents of TN and SOC under ST were significantly higher than those under PT and RT, and the value of BD under RT was significantly higher than that under PT and ST. In the 30–40 cm layer, the BD under ST was significantly lower than that under PT and RT. Thus, we noted different effects on soil properties of different tillage management in the 0–40 cm layer.
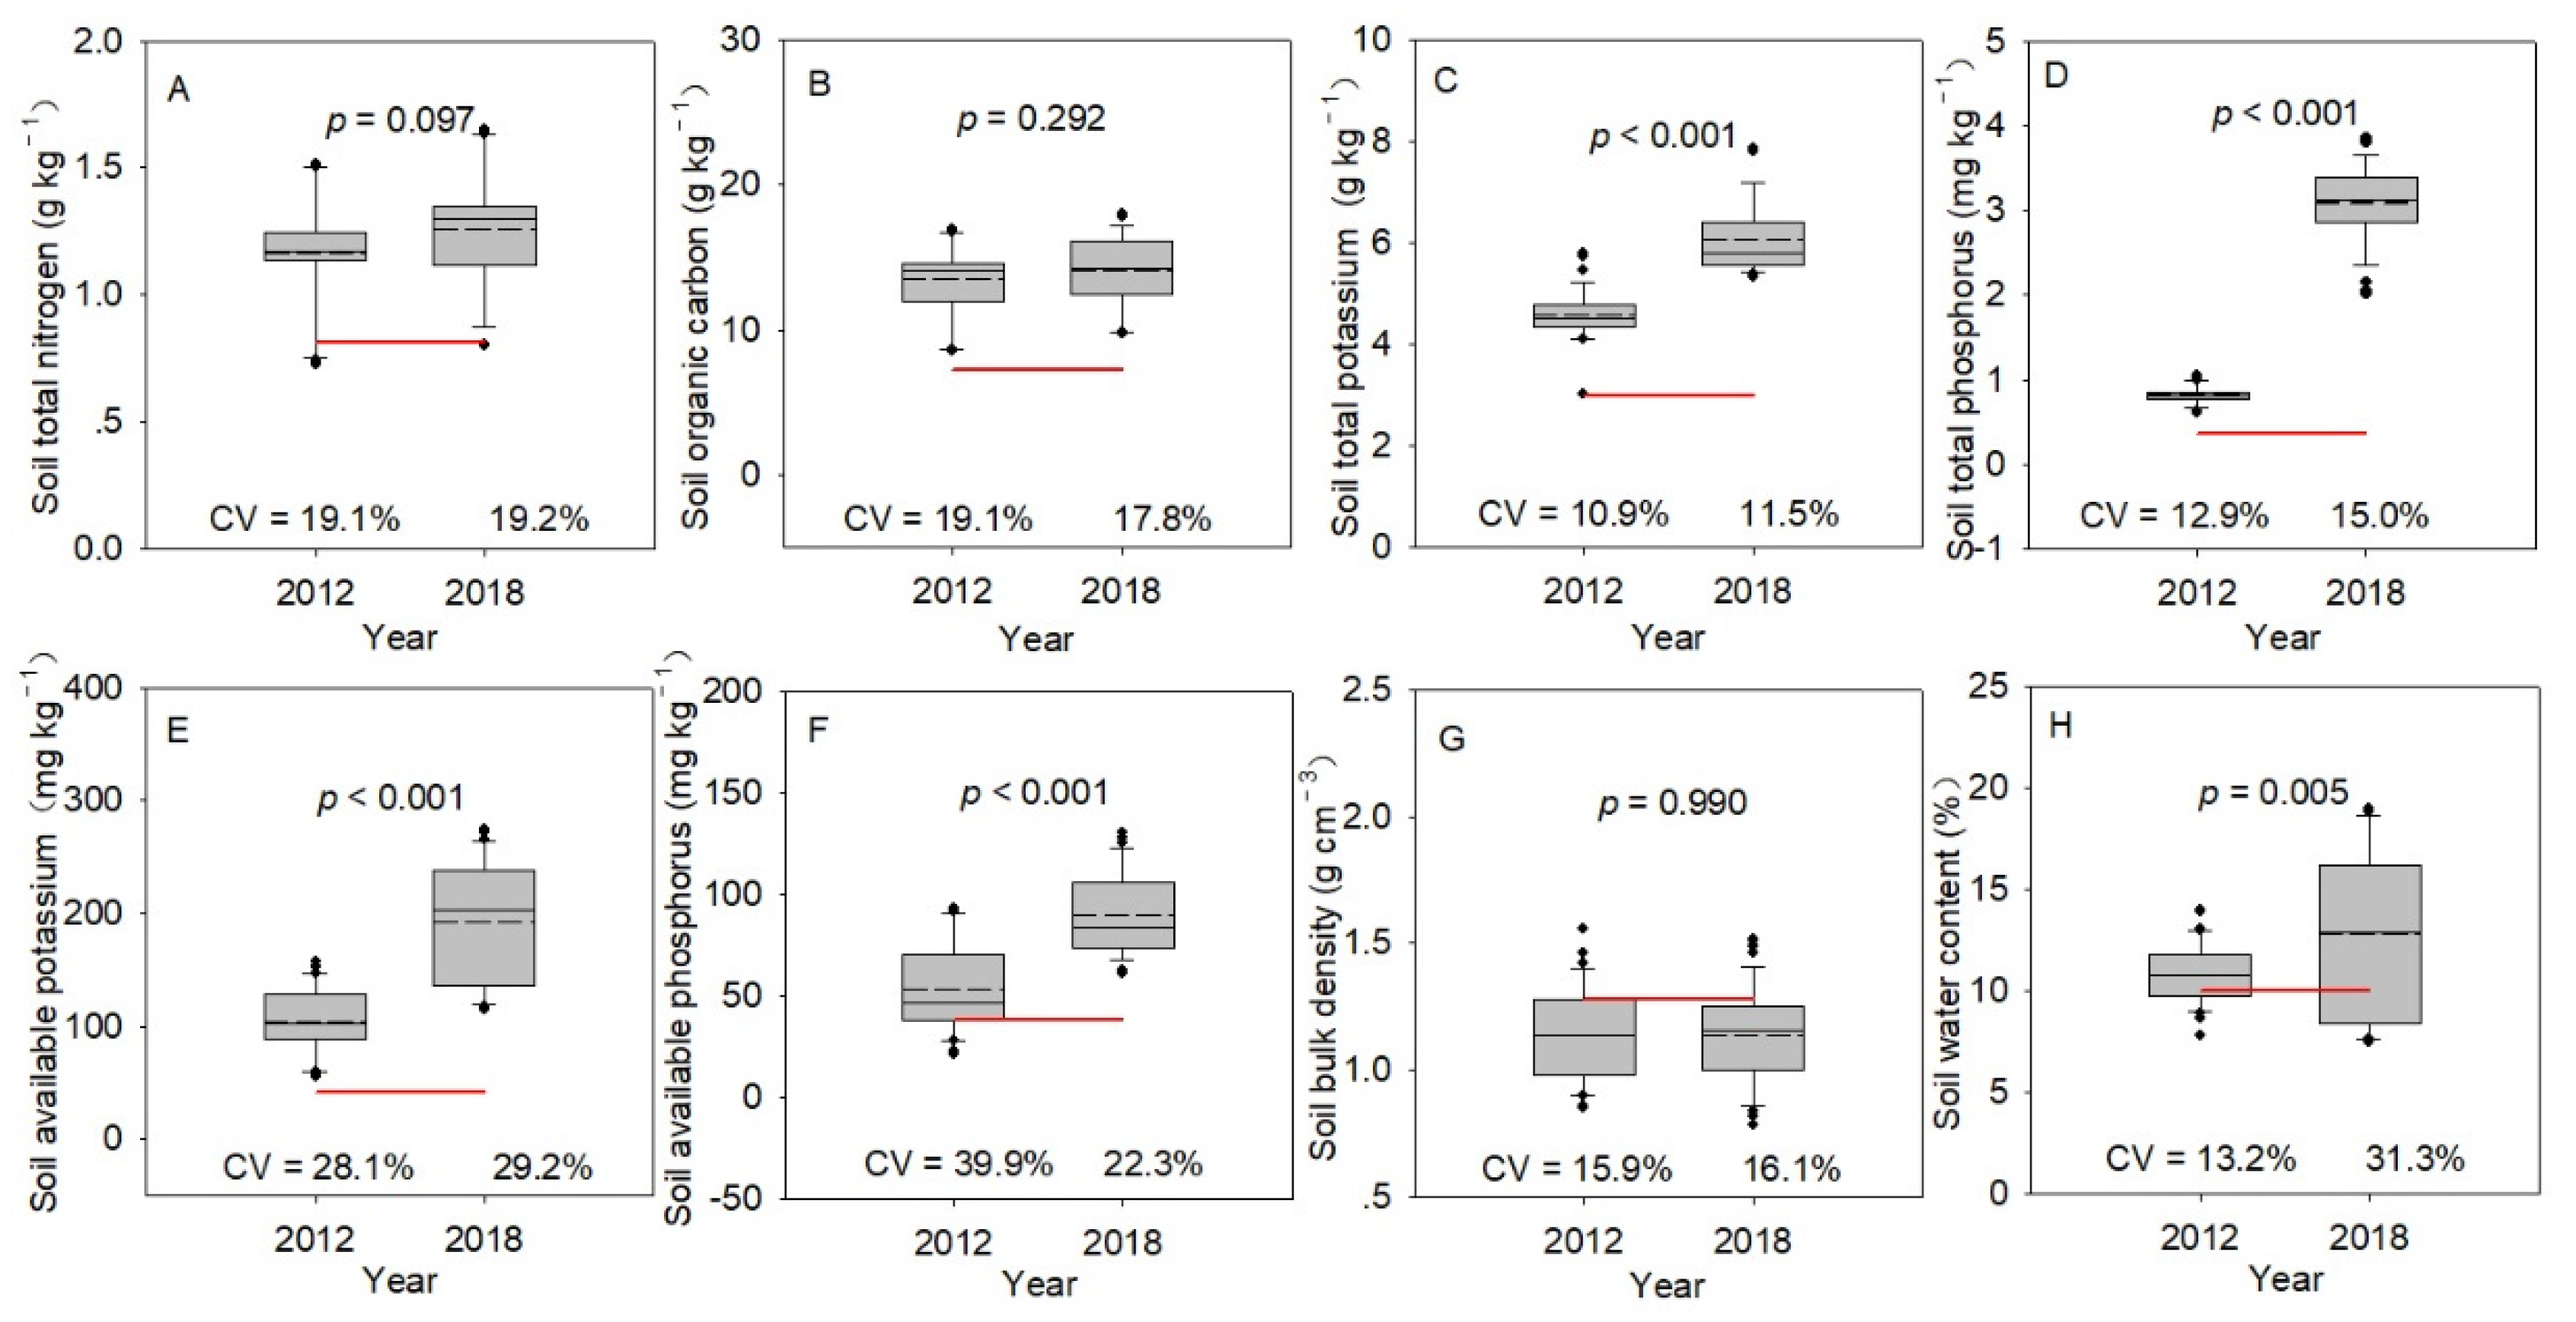
No significant differences were found in TN, SOC and BD for the two years (Figure 1A,B,G). Compared with the basic soil fertility in 2002, the SOC and TN under ST increased by 41.7% and 29.0%, respectively; those under PT increased by 28.1% and 16.7%, respectively. However, there is no significant difference under RT. The BD under PT and ST decreased by 14.1%, while RT only decreased 5.5%. There were significant differences for TP, TK, AK, AP and SWC between the two years (Figure 1C–F,H). The TP, TK and AK performed surface enrichment. Compared with the basic soil fertility in 2002, the TK was increased by more than 100%. Thus, we noted different effects on soil properties of different tillage in the long-term experiment.
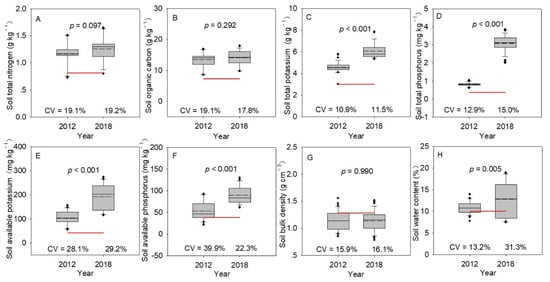
Figure 1.
Boxplot and coefficient of variation of eight soil properties of the 0–20 cm layer in 2002, 2012 and 2018. CV is variable coefficient of each soil property in 2012 and 2018. p is significance level of soil properties between 2012 and 2018. The red line represents the basic soil indicators in 2002. (A), soil total nitrogen. (B), soil organic carbon. (C), soil total potassium. (D), soil total phosphorus. (E), soil available potassium. (F), soil available phosphorus. (G), soil bulk density. (H), soil water content.
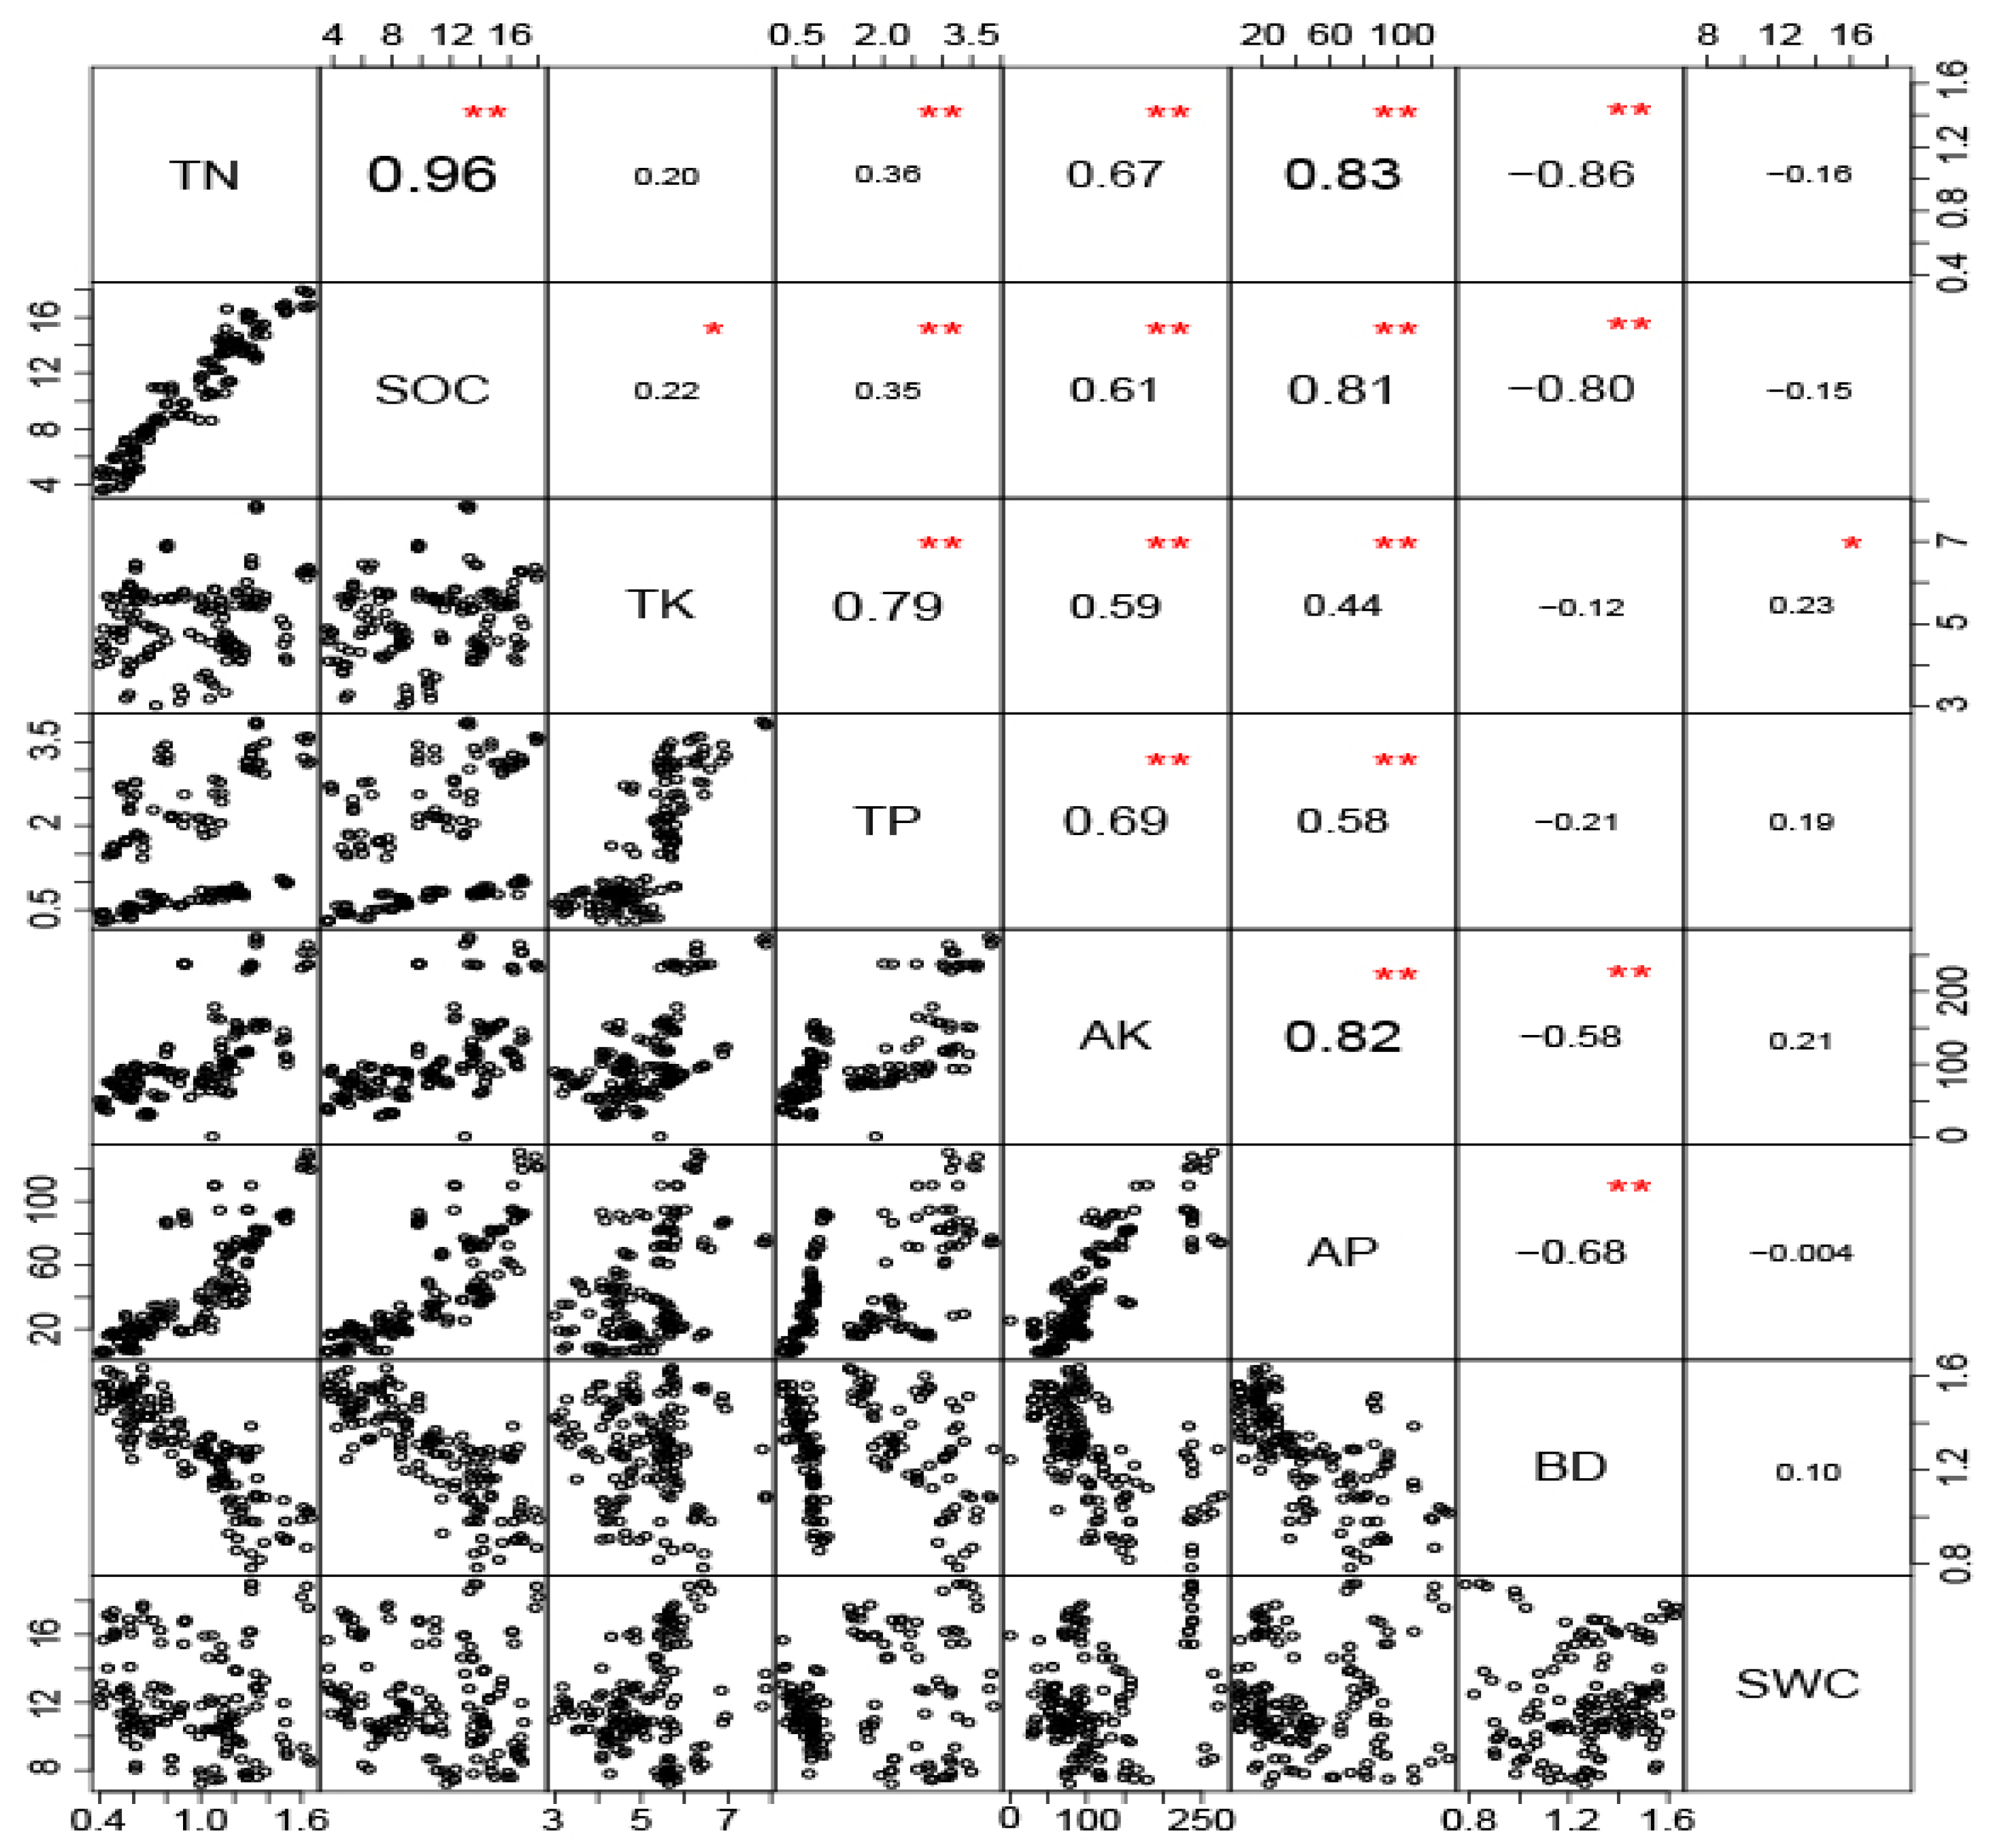
The TN was significantly positively correlated with SOC, AK and AP, with correlation coefficients of 0.96, 0.67 and 0.83, respectively; it was significantly negatively correlated with BD, with a correlation coefficient of −0.86 (Figure 2). The correlation coefficients of SOC with AK, AP and BD were, 0.61, 0.81 and −0.82, respectively, which were highly positively and negatively correlated. The correlation coefficient between TP and AP was 0.58, and the correlation coefficient between AK and BD was −0.58. The correlation coefficient between AP and BD was −0.68.
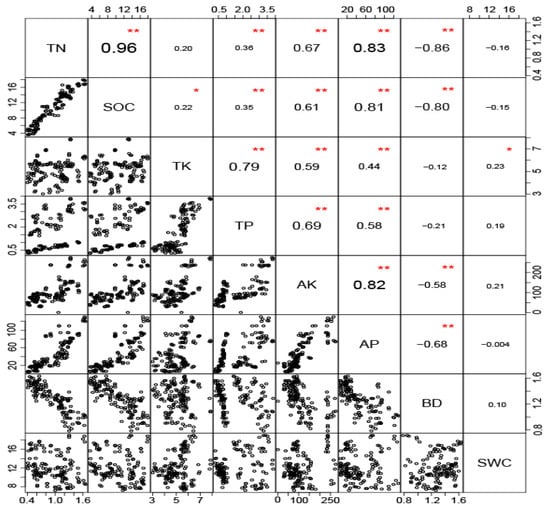
Figure 2.
Correlation coefficients among soil properties in the 0–40 cm layer. The bottom left part of the matrix shows scatter plots of soil properties; the upper right section shows correlation coefficients; number size indicates levels of correlation; * p < 0.05; ** p < 0.01. TN, total nitrogen; SOC, soil organic carbon; TK, total potassium; TP, total phosphorus; AK, available potassium; AP, available phosphorus; BD, soil bulk density; SWC, soil water content.
3.3. Soil Quality
The communalities of eight soil properties were all larger than 0.5 (Table 5). The first two PCs were selected as they each had eigenvalues greater than 1. These two PCs together explain 82.87% of the total variability within the dataset. The eigenvalue of PC1 was 4.91, which explained 61.41% of the variation. This PC consisted of positive loading of TN, SOC, TK, TP, AK, AP, BD and SWC. The PC2 had an eigenvalue of 1.72, which explained 21.46% of the variation. The loading of this PC consisted of positive loadings of TK, AK, AP and SOC and negative loadings of TN, SOC, TP and BD. All these soil properties were grouped into two PCs according to the factor loadings (≥0.5) in each PC. Group 1 contained TN, SOC, TP, AK, AP and BD. The rest were assigned to group 2. Andrews and Carroll [23] suggested that indicators with weighted absolute values within 10% of the highest indicator value for each PC were selected for the MDS, but the single value in each PC cannot reflect the information of multi-dimensional space [28]. Therefore, the norm value was introduced to solve this problem (Table 5). Meanwhile, Pearson’s correlation analysis was used to examine the relationships among these indicators to reduce redundancy (Figure 2). In group 1, the TN had the highest norm value (2.078); because TN and SOC were significantly correlated with each other, TN was maintained in the MDA. AK and AP were significantly correlated with TN, so that AK and AP were not maintained in the MDA. In addition, the correlation coefficient between TN and TP was 0.25, so TP was not maintained in the MDA. BD was maintained in the MDA, because only it was negatively correlated with other soil indexes. In group 2, the TK and SWC were not significantly correlated with each other, so TK and SWC were maintained in the MDA.
Table 5.
Soil properties of factor pattern, common factor variance and weighting.
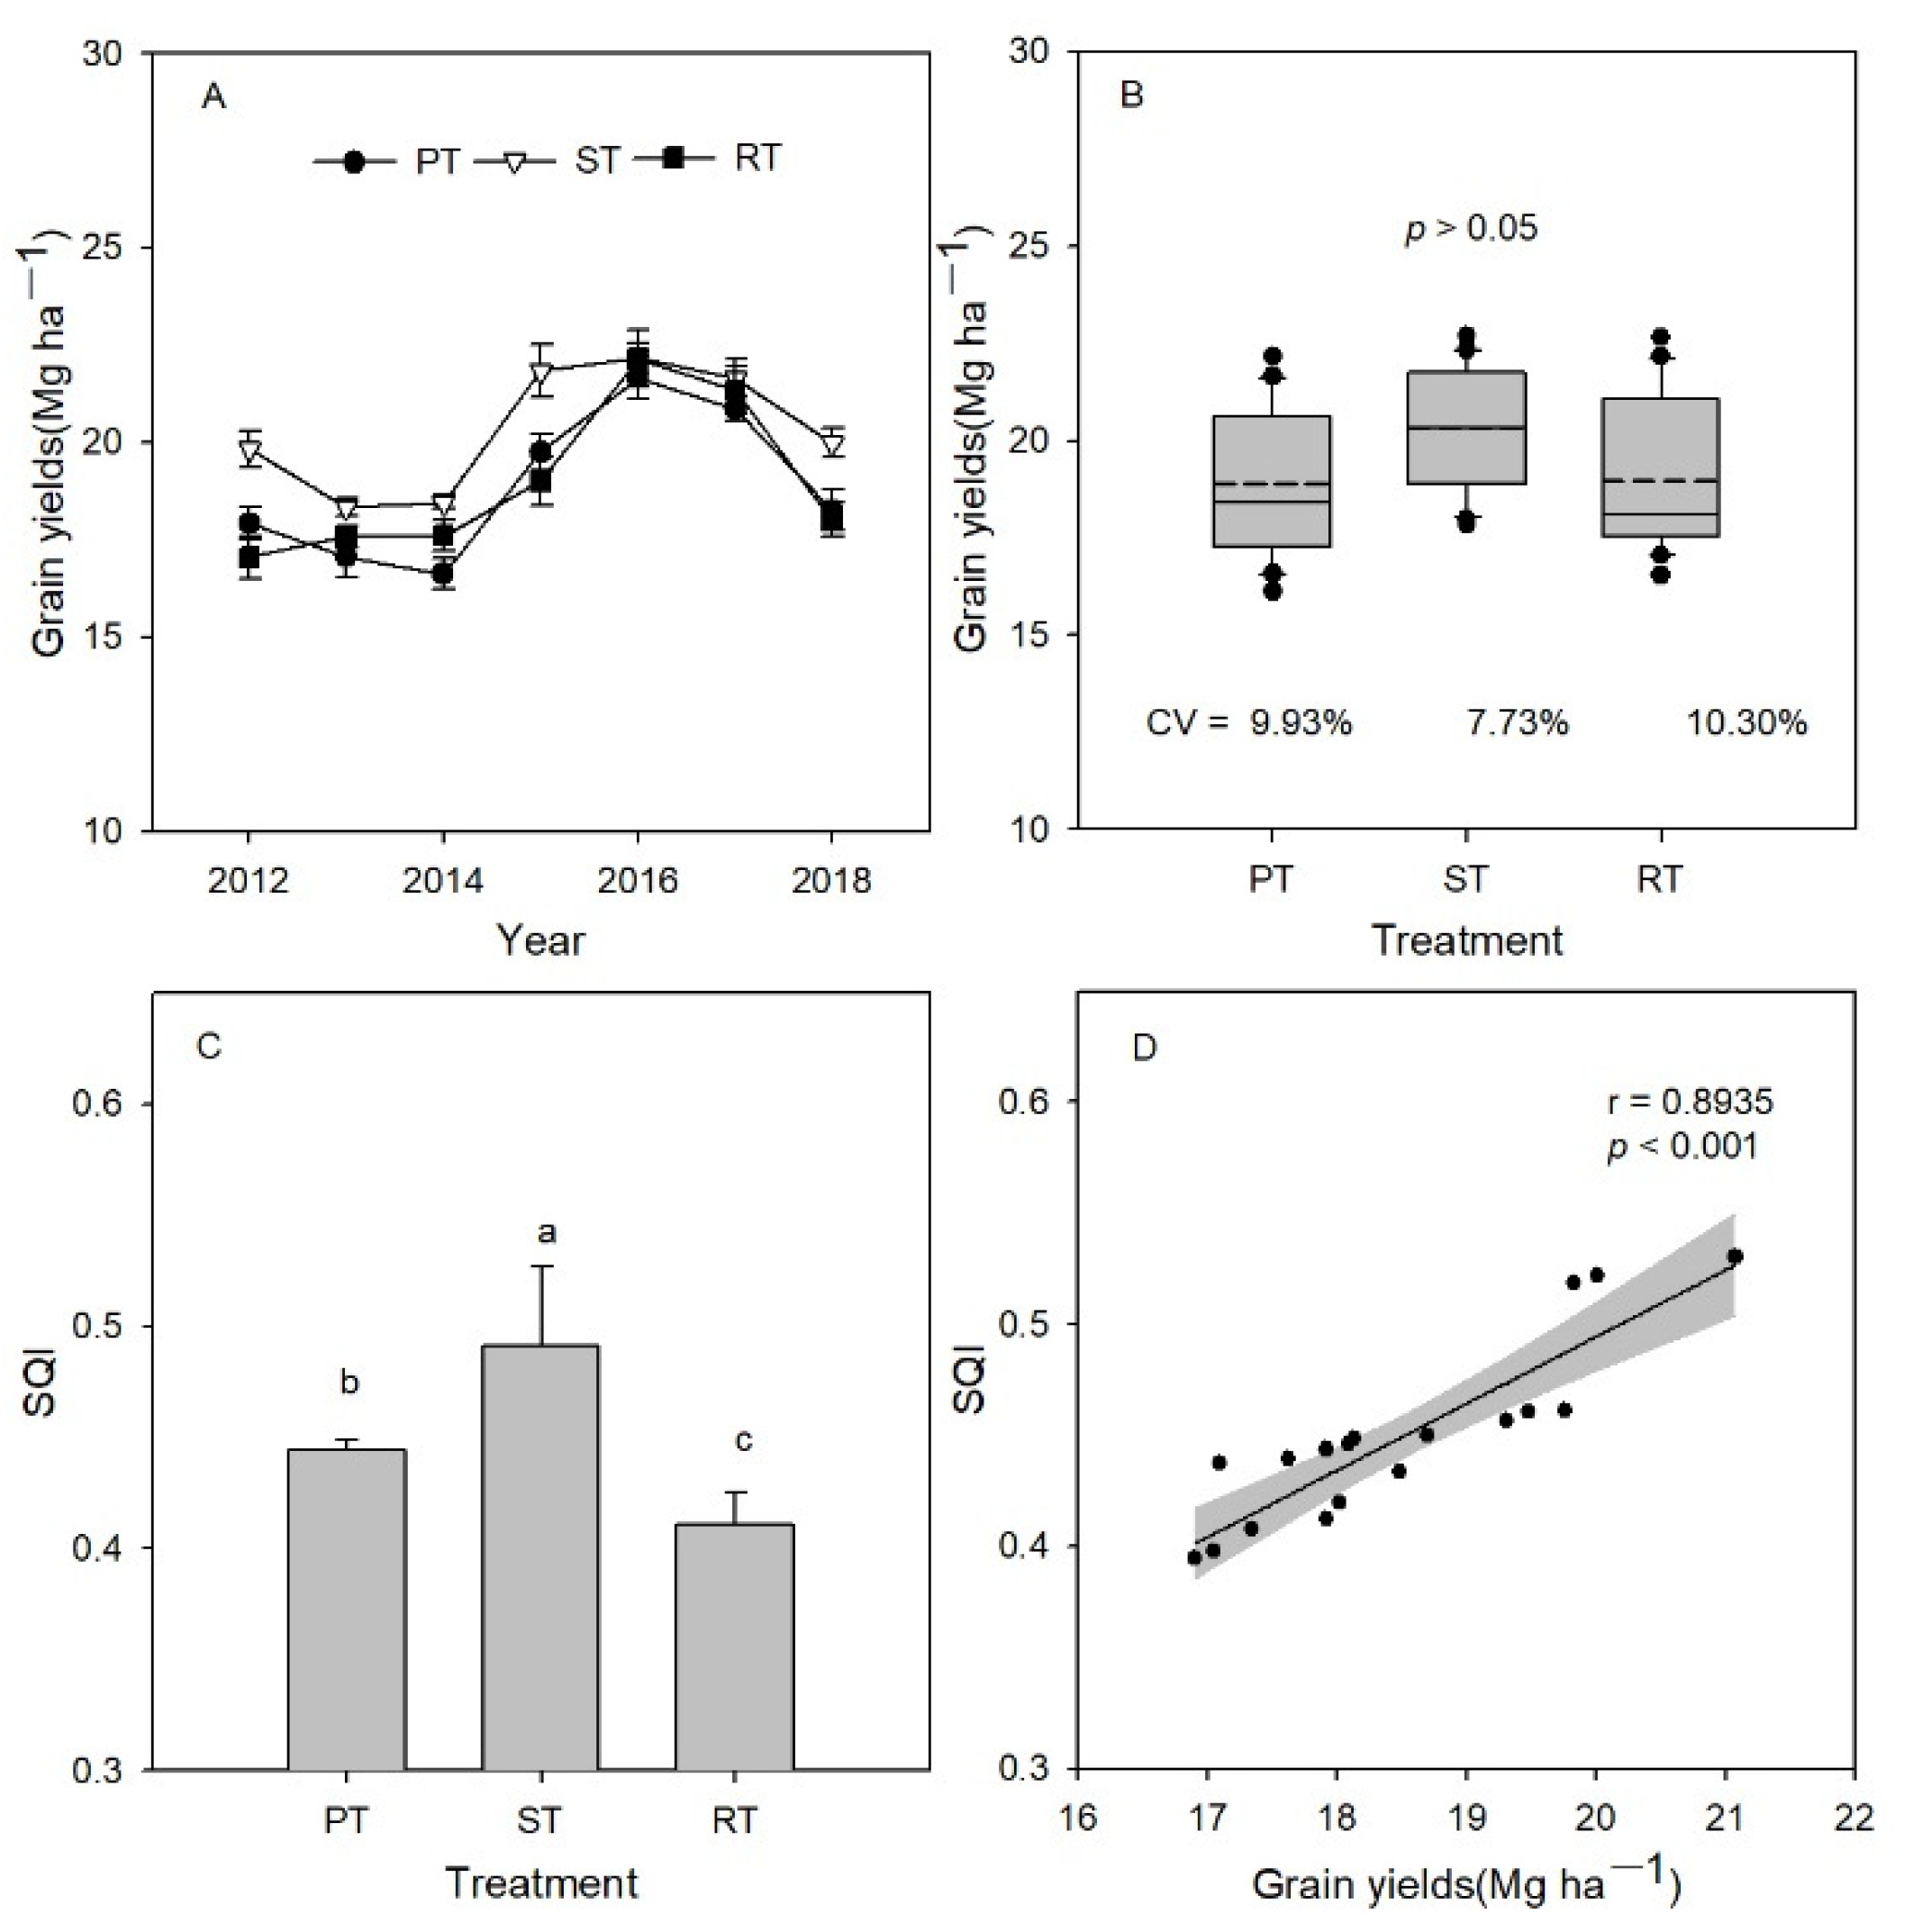
Grain yields for different tillage managements from 2012 to 2018 were highly variable; grain yields of ST were significantly higher than those of PT and RT in five out of seven years (Figure 3A). The variable coefficient of grain yields under ST was 7.73%, which lower than that under RT and PT; the IQR of PT, ST and RT was 3.36, 2.86 and 3.56, respectively; the mean value was close to the median value in ST (Figure 3B). Thus, ST was high and stable in the three tillage managements. This is consistent with the variation trend of SQI; the SQI of ST was higher than PT, followed by RT (Figure 3C). Meanwhile the r value of the linear relationship between SQI and grain yield was 0.8935, and the p < 0.001 (Figure 3D), so it is meaningful to choose the above evaluation method.
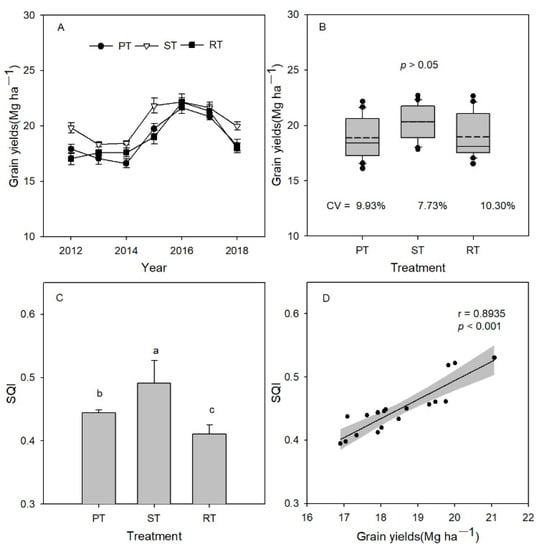
Figure 3.
Grain yield and SQI for three tillage managements. (A) variation grain yields under three tillage management methods from 2012 to 2018. (B) Boxplots of gain yield under three tillage management methods. In each boxplot, the uppermost and lowermost line segments represent the maximum and minimum values of data, respectively. The central rectangle extends from the first to third quartile (percentiles 25 and 75). In the middle of the boxplot, the line segments represent the median of data, and the imaginary line represents the mean value. In addition, the top and bottom solid points in the boxplot represent the extreme values in the sample data. CV is variable coefficient of each treatment. p is intergroup significance. (C) Soil quality index (SQI) results for three tillage management methods. Different small letters in the same color mean significant difference at the 0.05 level. (D) The correlation between grain yields and SQI. The line segments represent correlation, and the gray area represents 95% confidence level. r is coefficient of association, and p is significance level of correlation coefficient. PT, plow tillage; ST, subsoiling tillage; RT, rotary tillage.
3.4. Sensitive Indicators
The sensitive indicators of different tillage managements differed different (Figure S1). Vectors of SOC, TN, TP, AK, AP and BD went in the same direction as the vector of ST; the vector of SWC was in opposite direction, while the vector of TK was nearly perpendicular. Thus, the SOC, TN, TP, AK, AP and BD were ST positive sensitive indicators, and the SWC was a restrictive sensitive indicator. Vectors of SWC, TN, TP and BD were in the same direction as the vector of PT, and the vector of SWC and TK were in opposite directions, while the vector of AK and AP were nearly perpendicular. Thus, the SWC and TK were restrictive sensitive indicators for PT, and the SOC, TN, TP and BD were PT positive sensitive indicators. Vectors of SWC and TK were in the same direction as the vector of RT, and the vectors of SOC, TN, TP and BD were in opposite directions, while the vector of AK and AP were nearly perpendicular. Thus, the SOC, TN, TP and BD were RT restrictive sensitive indicators, and the SWC and TK were positive sensitive indicators.
4. Discussion
The spatio-temporal variation of soil properties was related to cropland management [3,4,5]. Meanwhile, the long-term tillage management experiment provides valuable insights into the processes contributing to changes in soil quality [29]. In the present study, the soil properties of TN, SOC and BD varied greatly at first and then stabilized under long-term tillage management. However, the content of TP, AP, TK, AK and SWC tended to increase in 2002, 2012 and 2018. Similar observations in SOC, TN and BD were also reported in previous studies [4]; however, there were different variation rules for soil nutrients [30]. The different changes in soil characteristics caused by the tillage management influence may be related to environmental conditions, soil conditions and the time of the experiment [31,32].
Tillage management can interact with crop residue to drive changes in the SOC [7,33]. In the present study, SOC varied greatly with the deepening of the soil layer under different tillage management. ST was beneficial for increasing SOC, particularly in topsoil; however, there may be little influence on the microbial community structure and diversity [34,35]. By contrast, under PT, the SOC storage was evenly distributed in the soil layer rather than increasing, mainly due to the disturbance of the soil microbial population structure [36]. The SOC under RT was the lowest for the larger contact surface between the upper layer of soil and residue after tillage, which accelerated the release of soil carbon as CO2 [37]. In the present study, the variation trend of SOC and TN was consistent, which is similar to the results of previous studies [5,38]. Meanwhile, the SOC and TN were important indicators to determine soil sensitivity to different management practices [39].
In the present study, from the long-term experiment analyzed, the BD under RT was significantly higher than that under ST and PT because of the deep and intensity of the tillage operation [16]. Meanwhile, RT had significantly higher SWC than that under PT and ST, which was mainly due to the tillage operation resulting in the different distribution of soil aggregates and soil texture [40]. Previous studies showed that different tillage management methods caused soil properties to vary greatly [32]. In the present study, the AK, AP and TP varied greatly with the deepening of the soil layer under different tillage management, while the TK had no significant difference in the four depths. In addition, the grain yield under ST was high and stable in the three tillage management methods. This study results are consistent with Wang [41], who found that subsoiling tillage could effectively improve grain yields.
Selection of suitable soil properties and the integration into SQI could provide information about soil quality evaluation and consider both the accuracy of the evaluation and the economic cost of obtaining the soil data [13,14,42]. The present field experiment was based on a winter wheat–summer maize double cropping system from 2002. Significant differences in SOC, TN, TP, TK, AK, AP, BD and SWC were found among the different tillage management methods after long-term tillage practice [5,33]. Thus, it is feasible to assess the soil quality through selecting the sensitive index of soil physical and chemical properties for farmland. There are many studies on soil quality assessment of long-term implementation of tillage management in the field. Alaoui’s [43] analysis showed that the most positive effects on soil quality are reducing cropland tillage in local areas. Jokela [44] also obtained the SQI and sensitive indicators from many soil indicators based on a long-term field experiment using PCA. In addition, the grain yield was significantly linear to the SQI, which makes the soil quality assessment meaningful [45]. In the present study, the TN, TK, BD and SWC were maintained in the MDA, and the two PCs together explain 82.87% of the total variability within the dataset. Meanwhile, ST had the highest value in the soil quality assessment in 2012 and 2018. Thus, ST was the most suitable tillage practice in this region.
Zuber [17] showed that many of the sensitive indicators were as expected. In the present study, different sensitive soil indicators were found in three tillage management methods. Under PT and ST, the SOC, TN, TP and BD were positive sensitive indicators, while SWC was a restrictive sensitive indicator. Under PT, the SWC and TK were the positive sensitive indicators, while the SOC, TN, TP and BD were restrictive sensitive indicators. The TN, SOC and BD achieved dynamic equilibrium under different tillage management in the long-term experiment. Thus, the soil quality can be evaluated through the changes of the SOC, TN, TP, BD and SWC sensitive indicators.
The next step of this project is to explore the influence of microorganisms on residue degradation under different tillage management and the composition of soil organic carbon, which will help to better understand and interpret changes in soil nutrients. In addition, the economic benefits of different tillage management systems will be analyzed in further study.
5. Conclusions
It is urgent to evaluate soil quality quickly by analyzing the easily available soil indexes. Through this study, it is clear that the TN, SOC, SWC, TP and BD are sensitive indicators that can be used to evaluate soil quality in future studies and agricultural production.
Supplementary Materials
The following supporting information can be downloaded at: https://www.mdpi.com/article/10.3390/agronomy12051153/s1, Figure S1: Biplot of PCs 1 and 2 of eight soil properties for the three tillage managements. PT, Plow tillage; ST, Subsoiling tillage; RT, Rotary tillage; AK, available potassium; AP, available phosphorus; BD, soil bulk density; SOC, soil organic carbon; SWC, soil water content; TK, total potassium; TP, total phosphorus; TN, total nitrogen; Table S1: Soil properties measured as potential indicators of soil quality in 0–40 cm layer in 2012 and 2018. Results are shown as the mean. Values with the same lowercase letters within columns (same soil layers) are not significantly different at p < 0.05.
Author Contributions
Conceptualization, J.F. and T.N.; methodology, H.Z. and L.W.; software, H.Z.; validation, L.W., S.Z., H.S. and C.X.; formal analysis, H.Z., L.W., J.F. and T.N.; investigation, H.Z., S.Z. and H.S.; resources, C.X., J.F. and T.N.; data curation, H.Z. and L.W.; writing—original draft preparation, H.Z.; writing—review and editing, H.Z.; visualization, H.Z. and L.W.; supervision, J.F. and T.N.; project administration, J.F. and T.N.; funding acquisition, T.N. All authors have read and agreed to the published version of the manuscript.
Funding
This work was supported by the Special Research Funding for Public Benefit Industries (Agriculture) of China (201503121-05) and the Shandong Major Science and Technology Innovation Projects (2019YQ014).
Institutional Review Board Statement
Not applicable.
Informed Consent Statement
Not applicable.
Data Availability Statement
The data presented in this study are available on request from the corresponding author.
Conflicts of Interest
The authors declare no conflict of interest.
Abbreviations
AK, available potassium; AP, available phosphorus; BD, soil bulk density; PCA, principal component analysis; PCs, principal components; PT, plow tillage; RT, rotary tillage; SOC, soil organic carbon; ST, subsoiling tillage; SWC, soil water content; TK, total potassium; TP, total phosphorus; TN, total nitrogen.
References
- Hammad, A.A.; Tumeizi, A. Land degradation: Socioeconomic and environmental causes and consequences in the eastern Mediterranean. Land Degrad. Dev. 2010, 23, 216–226. [Google Scholar] [CrossRef]
- Stavi, I.; Lal, R. Achieving zero net land degradation: Challenges and opportunities. J. Arid Environ. 2015, 112, 44–51. [Google Scholar] [CrossRef]
- Nouria, A.; Leea, J.; Yinb, X.; Tylerc, D.D.; Saxtond, A.M. Thirty-four years of no-tillage and cover crops improve soil quality and increase cotton yield in Alsols, southeastern USA. Geoderma 2018, 337, 998–1008. [Google Scholar] [CrossRef]
- Liu, Z.; Sun, K.; Liu, W.; Gao, T.; Li, G.; Han, H.; Li, Z.; Ning, T. Responses of soil carbon, nitrogen, and wheat and maize productivity to 10 years of decreased nitrogen fertilizer under contrasting tillage systems. Soil Tillage Res. 2020, 196, 104444. [Google Scholar] [CrossRef]
- Zhao, H.; Qin, J.; Gao, T.; Zhang, M.; Sun, H.; Zhu, S.; Xu, C.; Ning, T. Immediate and long-term effects of tillage practices with crop residue on soil water and organic carbon storage changes under a wheat-maize cropping system. Soil Tillage Res. 2022, 218, 105309. [Google Scholar] [CrossRef]
- Warkentin, B.P. The tillage effect in sustaining soil functions. J. Plant Nutr. Soil Sci. 2001, 164, 345–350. [Google Scholar] [CrossRef]
- Marousek, J.; Gavurova, B. Recovering phosphorous from biogas fermentation residues indicates promising economic results. Chemosphere 2022, 291, 133008. [Google Scholar] [CrossRef]
- Li, Y.; Li, Z.; Chang, S.X.; Cui, S.; Jagadamma, S.; Zhang, Q.; Cai, Y. Residue retention promotes soil carbon accumulation in minimum tillage systems: Implications for conservation agriculture. Sci. Total Environ. 2020, 740, 140147. [Google Scholar] [CrossRef]
- Marousek, J.; Trakald, L. Techno-economic analysis reveals the untapped potential of wood biochar. Chemosphere 2022, 291, 133000. [Google Scholar] [CrossRef]
- Yu, Q.; Wang, H.; Wen, P.; Wang, S.; Wang, X. A suitable rotational conservation tillage system ameliorates soil physical properties and wheat yield: An 11-year in-situ study in a semi-arid agroecosystem. Soil Tillage Res. 2020, 199, 104600. [Google Scholar] [CrossRef]
- Zhang, K.; Li, Y.; Wei, H.; Zhang, L.; Li, F.; Zhang, F. Conservation tillage or plastic film mulching? A comprehensive global meta-analysis based on maize yield and nitrogen use efficiency. Sci. Total Environ. 2022, 831, 154869. [Google Scholar] [CrossRef] [PubMed]
- Sione, S.M.J.; Wilson, M.G.; Lado, M.; Gonzalez, A.P. Evaluation of soil degradation produced by rice crop systems in a vertisol using a soil quality index. Catena 2017, 150, 79–86. [Google Scholar] [CrossRef]
- Molaeinasab, A.; Bashari, H.; Esfahani, M.T.; Mosaddeghi, M.R. Soil surface quality assessment in rangeland ecosystems with different protection levels. Central Iran. Catena 2018, 171, 72–82. [Google Scholar] [CrossRef]
- Liu, J.; Wu, L.; Chen, D.; Li, M.; Wei, C. Soil quality assessment of different Camellia oleifera stands in mid-subtropical China. Appl. Soil Ecol. 2017, 113, 29–35. [Google Scholar] [CrossRef]
- Zhang, G.; Bai, J.; Xi, M.; Zhao, Q.; Lu, Q.; Jia, J. Soil quality assessment of coastal wetlands in the Yellow River Delta of China based on the minimum data set. Ecol. Indic. 2016, 66, 458–466. [Google Scholar] [CrossRef] [Green Version]
- Yu, P.; Han, D.; Liu, S.; Wen, X. Soil quality assessment under different land uses in an alpine grassland. Catena 2018, 171, 280–287. [Google Scholar] [CrossRef]
- Zuber, S.M.; Behnke, G.D.; Nafziger, E.D.; Villamil, M.B. Multivariate assessment of soil quality indicators for crop rotation and tillage in Illinois. Soil Tillage Res. 2017, 174, 147–155. [Google Scholar] [CrossRef]
- Li, Z.; Zhang, Q.; Qiao, Y.; Du, K.; Li, Z.; Tian, C.; Zhu, N.; Leng, P.; Yue, Z.; Cheng, H.; et al. Evaluation of no-tillage impacts on soil respiration by 13C-isotopic signature in North China Plain. Sci. Total Environ. 2022, 824, 153852. [Google Scholar] [CrossRef]
- Xu, C.; Huang, S.; Tian, B.; Ren, J.; Meng, Q.; Wang, P. Manipulating planting density and nitrogen fertilizer application to improve yield and reduce environmental impact in Chinese maize production. Front. Plant Sci. 2017, 8, 1234–1244. [Google Scholar] [CrossRef]
- Wu, Y.; Xi, X.; Tang, X.; Luo, D.; Gu, B.; Kee, L.S.; Vitousek, P.M.; Chen, D. Policy distortions, farm size, and the overuse of agricultural chemicals in China. Proc. Natl. Acad. Sci. USA 2018, 115, 7010–7015. [Google Scholar] [CrossRef] [Green Version]
- Bao, S.D. Soil and Agricultural Chemistry Analysis; China Agriculture Press: Beijing, China, 2000. [Google Scholar]
- Nakajima, T.; Lal, R.; Jiang, S.G. Soil quality index of a Crosby silt loam in central Ohio. Soil Tillage Res. 2015, 146, 323–328. [Google Scholar] [CrossRef]
- Andrews, S.S.; Carroll, C.R. Designing a soil quality assessment tool for sustainable agroecosystem management. Ecol. Appl. 2001, 11, 1573–1585. [Google Scholar] [CrossRef]
- Shi, J.; Song, G. Native database in China—Based on the second national soil survey data sets. Sci. Data Bank. 2016, 2, 1–12. [Google Scholar]
- Idowu, O.J.; Van Es, H.M.; Abawi, G.S.; Wolfe, D.W.; Ball, J.I.; Gugino, B.K.; Moebius, B.N.; Schindelbeck, R.R.; Bilgili, A.V. Farmer-oriented assessment of soil quality using field, laboratory, and VNIR spectroscopy methods. Plant Soil. 2008, 307, 243–253. [Google Scholar] [CrossRef]
- Chen, Y.; Wang, H.; Zhou, J.; Xing, L.; Zhu, B.; Zhao, Y.; Chen, X. Minimum data set for assessing soil quality in farmland of northeast China. Pedosphere 2013, 23, 564–576. [Google Scholar] [CrossRef]
- Ngo-Mbogba, M.; Yemefack, M.; Nyeck, B. Assessing soil quality under different land cover types within shifting agriculture in South Cameroon. Soil Tillage Res. 2015, 150, 124–131. [Google Scholar] [CrossRef]
- Yemefack, M.; Jetten, V.G.; Rossiter, D.G. Developing a minimum data set for characterizing soil dynamics in shifting cultivation systems. Soil Tillage Res. 2006, 86, 84–98. [Google Scholar] [CrossRef]
- Dossou-Yovo, E.R.; Brüggemann, N.; Ampofo, E.; Igued, A.M.; Jessee, N.; Huatf, J.; Agbossoub, E.K. Combining no-tillage, rice straw mulch and nitrogen fertilizer application to increase the soil carbon balance of upland rice field in northern Benin. Soil Tillage Res. 2016, 163, 152–159. [Google Scholar] [CrossRef]
- Zhang, Y.; Tan, C.; Wang, R.; Li, J.; Wang, X. Conservation tillage rotation enhanced soil structure and soil nutrients in long-term dryland agriculture—ScienceDirect. Eur. J. Agron. 2021, 131, 126379. [Google Scholar] [CrossRef]
- Guo, L.; Sun, Z.; Zhu, O.; Han, D.; Li, F. A comparison of soil quality evaluation methods for fluvisol along the lower Yellow River. Catena 2017, 152, 135–143. [Google Scholar] [CrossRef]
- Mikha, M.M.; Hergert, G.W.; Qiao, X.; Maharjan, B. Soil chemical properties after 12 years of tillage and crop rotation. Agron. J. 2020, 112, 20281. [Google Scholar] [CrossRef]
- Tian, S.; Ning, T.; Wang, Y.; Liu, Z.; Li, G.; Li, Z.; Lal, R. Crop yield and soil carbon responses to tillage method changes in North China. Soil Tillage Res. 2016, 163, 207–213. [Google Scholar] [CrossRef]
- Tyler, H.L. Bacterial community composition under long-term reduced tillage and no till management. J. Appl. Microbiol. 2019, 126, 1797–1807. [Google Scholar] [CrossRef] [PubMed]
- Wang, H.; Wang, S.; Wang, R.; Zhang, Y.; Wang, X.; Li, J. Direct and indirect linkages between soil aggregates and soil bacterial communities under tillage methods. Geoderma 2019, 354, 113879. [Google Scholar] [CrossRef]
- Jia, L.; Zhao, W.; Zhai, R.; Liu, Y.; Kang, M.; Zhang, X. Regional differences in the soil and water conservation effciency of conservation tillage in China. Catena 2019, 175, 18–26. [Google Scholar] [CrossRef]
- Zhang, Q.; Zhang, H. Dynamics of soil thermal analysis and organic nutrients during straw decomposition. Acta Agric. Boreali-Occident. Sin. 2019, 28, 1158–1168. [Google Scholar]
- Lou, Y.; Xu, M.; Chen, X.; He, X.; Zhao, K. Stratification of soil organic C, N and C:N ratio as affected by conservation tillage in two maize fields of China-ScienceDirect. Catena 2012, 95, 124–130. [Google Scholar] [CrossRef]
- Wang, D.; Abdullah, K.M.; Xu, Z.; Wang, W. Water extractable organic C and total N: The most sensitive indicator of soil labile C and N pools in response to the prescribed burning in a suburban natural forest of subtropical Australia. Geoderma 2020, 377, 114586. [Google Scholar] [CrossRef]
- Hebb, C.; Schoderbek, D.; Hernandez-Ramirez, G.; Hewins, D.; Carlyle, C.N.; Bork, E. Soil physical quality varied among contrasting land uses in Northern Prairie regions. Agric. Ecosyst. Environ. 2017, 240, 14–23. [Google Scholar] [CrossRef]
- Wang, S.; Wang, H.; Hafeez, M.B.; Zhang, Q.; Li, J. No-tillage and subsoiling increased maize yields and soil water storage under varied rainfall distribution: A 9-year site-specific study in a semi-arid environment. Field Crops Res. 2020, 255, 107867. [Google Scholar] [CrossRef]
- Shao, G.; Ai, J.; Sun, Q.; Hou, L.; Dong, Y. Soil quality assessment under different forest types in the Mount Tai, central Eastern China. Ecol. Indic. 2020, 115, 106439. [Google Scholar] [CrossRef]
- Alaoui, A.; Barão, L.; Ferreira, C.S.S.; Schwilch, G.; Basch, G.; Garcia-Orenes, F.; Morugan, A.; Mataix-Solera, J.; Kosmas, C.; Glavan, M.; et al. Visual assessment of the impact of agricultural management practices on soil quality. Agron. J. 2020, 112, 2608–2623. [Google Scholar] [CrossRef]
- Jokela, W.; Posner, J.; Hedtcke, J.; Balser, T.; Read, H. Midwest cropping system effects on soil properties and on a soil quality index. Agron. J. 2011, 103, 1552–1562. [Google Scholar] [CrossRef]
- Yang, S.; Wang, C.; Huo, L.; Jiang, W.; Wen, M. Effects of different tillage practices on soil organic carbon of cultivated land in Gansu Yellow River irrigation district. Trans. Chin. Soc. Agric. Eng. 2019, 35, 114–121. [Google Scholar]
Publisher’s Note: MDPI stays neutral with regard to jurisdictional claims in published maps and institutional affiliations. |
© 2022 by the authors. Licensee MDPI, Basel, Switzerland. This article is an open access article distributed under the terms and conditions of the Creative Commons Attribution (CC BY) license (https://creativecommons.org/licenses/by/4.0/).