Abstract
Soil nutrients in deep soils are important for nutrient cycling and plant growth. Organic amendments have been widely used for enhancing soil health and crop yield. However, little is known about the effects of organic amendments on the vertical distributions of soil nutrients. Based on a 32-year long-term organic amendment experiment, the objective of this study was to evaluate changes in the vertical distribution of nutrients in a soybean–wheat system Vertisol. The results showed that NPK with manure or straw application significantly increased soil organic carbon (SOC), total N, total P, alkali-hydrolyzable N, available P and available K above the 40 cm soil layer. Variations in soil micronutrients primarily occurred above the 20 cm soil layer, and the highest contents were observed for NPKWS and NPKPM, respectively. Nevertheless, large amounts of NO3−−N contents accumulated in the 120–200 cm depth with manure but not straw application, indicating a high potential risk of nitrate leaching in manure treatments. These findings suggested that the application of organic amendment (manure or straw) could be recommendable for improving soil nutrients along the soil profile. Straw incorporation could be used as an alternative option for sustainable agriculture in regions with inadequate manure resources or severe nitrate leaching.
1. Introduction
Vertisols are important natural agricultural soils and are mostly distributed throughout semi-arid tropical and subtropical regions, including Australia, China, India, South Africa and the United States [1,2]. According to soil taxonomy [3], Vertisols are described as clay-textured soils that contain at least 30% clay, wedge-shaped aggregates or slickensides, and deep wide cracks. These characteristics lead to poor soil structure and high shrink–swell properties [4], which exert strong influences on soil nutritional status [5]. Limited soil C, N and P availability [6] and relatively low soil water holding capacity [7] in Vertisols have caused serious problems which threaten crop productivity and agriculture sustainability [8]. Hence, it is essential to develop optimal management practices to improve soil fertility in Vertisols.
Organic amendments (i.e., straw, farmyard manure) have been widely used to improve soil quality and crop productivity [9,10]. Many studies have indicated that long-term manure or straw application resulted in a marked increase in the topsoil (0–20 cm) soil organic carbon (SOC), total N, total P, available N, available P and available K [11,12,13]. Furthermore, some other long-term studies reported that soil microbial activity [14,15,16] in the 0–15 cm depth, as well as soil micronutrients (DTPA-extractable Fe, Mn, Cu and Zn) [17,18] in the 0–20 cm depth, increased with manure application. Previous studies regarding the impacts of organic amendments on soil nutrients mainly focused on the surface soil (0–20 cm). However, the accumulation of 40–60% of crop growing roots with high nutrient uptake efficiency was found in the 20–60 cm soil layers [19,20]. Moreover, crop roots can grow deep to 200 cm (winter wheat) or to 180 cm (soybean) in order to absorb nutrients in deeper soils [21,22], making access to deep soil water and nutrients more important [23]. Therefore, it is necessary to understand the effects of organic amendments on soil vertical nutrient distributions in the 0–200 cm soil profile, as this can provide insight into plant–nutrient interaction and nutrient cycling [24,25].
To date, many studies have investigated the effects of manure or straw application on soil NO3−−N leaching at different depths of the 0–100 cm soil profile. In a silt loam in Pakistan, NO3−−N contents increased above 50 cm soil depth and decreased in the 50–100 cm depth under short-term application of farmyard manure combined with urea [26]. In an anthropogenic alluvial soil of China, Yang et al. [27] showed that straw incorporation reduced NO3−−N leaching losses mainly in the plowing layer (30 cm), but it did not affect NO3−−N leaching losses in the topsoil (10 and 20 cm) and deeper soil (60 and 90 cm) layers. Maeda et al. [28] compared four N fertilizers in an Andisol and found that swine compost could decrease NO3−−N contents during four years compared with chemical fertilizers. However, in a longer period, it would cause the same level of NO3−−N leaching as chemical fertilizer plots. Nevertheless, little information is available on the impacts of long-term manure and straw application on soil NO3−−N leaching in the 0–200 cm soil profile.
Vertisols are widely used for crop production; they occupy an area of approximately 4 million hectares in northern China [6]. The soybean–wheat cropping system is popular in the North China Plain and produces a food crop and an oil-bearing crop. Long-term field experiments may offer a unique avenue for the precise monitoring of changes in soil properties, therefore serving as an efficient way to evaluate the sustainability of agricultural management practices [29]. Here, we investigated the effects of long-term manure and straw application on the vertical distribution of nutrients in a soybean–wheat system Vertisol. The objectives of this study were: (1) to evaluate changes in the vertical distribution of total nutrient content at wheat maturity under long-term organic amendments; (2) to evaluate changes in vertical distribution of available nutrients and micronutrient content at wheat maturity under long-term organic amendments; and (3) to evaluate changes in soil nitrate and ammonia content at wheat maturity under long-term organic amendments. We aim to provide a basis for implementing environmentally sustainable fertilization practices in the soybean–wheat system.
2. Materials and Methods
2.1. Experimental Site
The long-term field experiment was started in 1982 at the Madian Agro-Ecological Station in Mengcheng County, Anhui Province, China (33°13′N, 116°37′E). The site has a sub-humid climate, with mean annual air temperature and effective accumulation temperature of 16.5 and 5479.1 °C. Long-term mean annual precipitation is 872 mm, with nearly 70% falling between May and September. The predominant soils are Vertisols which are classified as uderts (suborder) according to soil taxonomy [3]. The initial topsoil (0–20 cm) properties in 1982 were as follows: soil bulk density, 1.45 g cm−3; soil pH, 7.40; soil texture with sand 280 g kg−1, silt 306 g kg−1 and clay 414 g kg−1; soil organic matter, 10.01 g kg−1; total N, 0.96 g kg−1; total P, 0.28 g kg−1; total K, 13.86 g kg−1; alkali-hydrolyzable N, 84.50 mg kg−1; available P, 9.80 mg kg−1; available K, 125.00 mg kg−1.
2.2. Experimental Design and Management
The field experiment was set up in 1982 and cultivated under a soybean–wheat rotation system (of note, maize instead of soybean was grown from 1993 to 1998). A randomized block design with five fertilizer treatments and three replicated blocks (field plot size: 14.9 m × 4.7 m) was used. Each plot was isolated by 50 cm deep cement baffle plates. The treatments were: control (no fertilization) (CK), NPK fertilizers (NPK), NPK plus wheat straw (NPKWS), NPK plus pig manure (NPKPM) and NPK plus cattle manure (NPKCM). All NPK fertilizers and organic amendments were applied as base fertilizer before wheat sowing and evenly applied into the soil (0–20 cm) in combination with rotary tillage. The contents of N, P and K in pig manure, cattle manure and wheat straw were 17.0, 18.5 and 20.7 g kg−1; 7.9, 3.5 and 15.2 g kg−1; and 5.5, 0.7 and 8.9 g kg−1, respectively, in a dry base. The detailed descriptions of experimental design and crop yields over this long-term fertilization experiment were reported by Hua et al. [30]. The fertilizer application rates in each treatment are listed in Table 1.

Table 1.
Fertilizer application rates in each treatment.
2.3. Soil Sampling and Analyses
Soil samples were randomly collected at wheat maturity in 2014 using a 10 cm diameter soil auger to a depth of 200 cm in 20 cm increments from 3 soil core mixtures per plot. Three replicate soil core samples were collected from each treatment plot and then divided into two subsamples. One subsample was air-dried and ground for the determination of soil chemical and physical properties. Another was stored at 4 °C prior to the soil NH4+−N and NO3−−N analyses. Soil organic carbon (SOC) and total N were determined by the K2Cr2O7−H2SO4 oxidation method [31] and the semi-micro-Kjeldahl methods [32] using air-dried soil samples. The C/N ratio was equal to SOC divided by total N [31,32]. Total P and total K were detected using the molybdenum antimony colorimetry method and flame photometer method, respectively [33]. Alkali-hydrolyzable N, available P and available K were determined through NaOH hydrolysis [34]. DTPA-extractable Fe, Mn, Cu and Zn were obtained by extracting 10 g soil (<2 mm) with 20 mL 0.005 M DTPA + 0.01 M CaCl2 + 0.1 M TEA (triethanolamine) solution [35]. Soil NH4+−N and NO3−−N were extracted by vigorously shaking the sample with 50 mL of 2.0 mol L−1 KCl for 30 min, and then the extract was filtered and NH4+−N and NO3−−N contents were measured using an AA3-AA001-02E continuous flow analyzer (SEAL Analytical GmbH, Norderstedt, Germany). Soil pH was measured by using a basic pH Meter (PB-10) in a soil–water extract (1:2.5, w/v water). Soil water content was detected using the oven-drying method.
2.4. Statistical Analysis
One-way ANOVA was performed to test long-term fertilization effects on soil physicochemical properties. Least significant differences (LSDs) were used to separate treatment means at the 5% level. Graphs were prepared using SigmaPlot 12.5 (Systat Software, Inc., San Jose, CA, USA). All the statistical analyses were conducted using SPSS 17.0 (SPSS Inc., Chicago, IL, USA).
3. Results
3.1. Soil pH and Soil Water Content in the 0–200 cm Depth
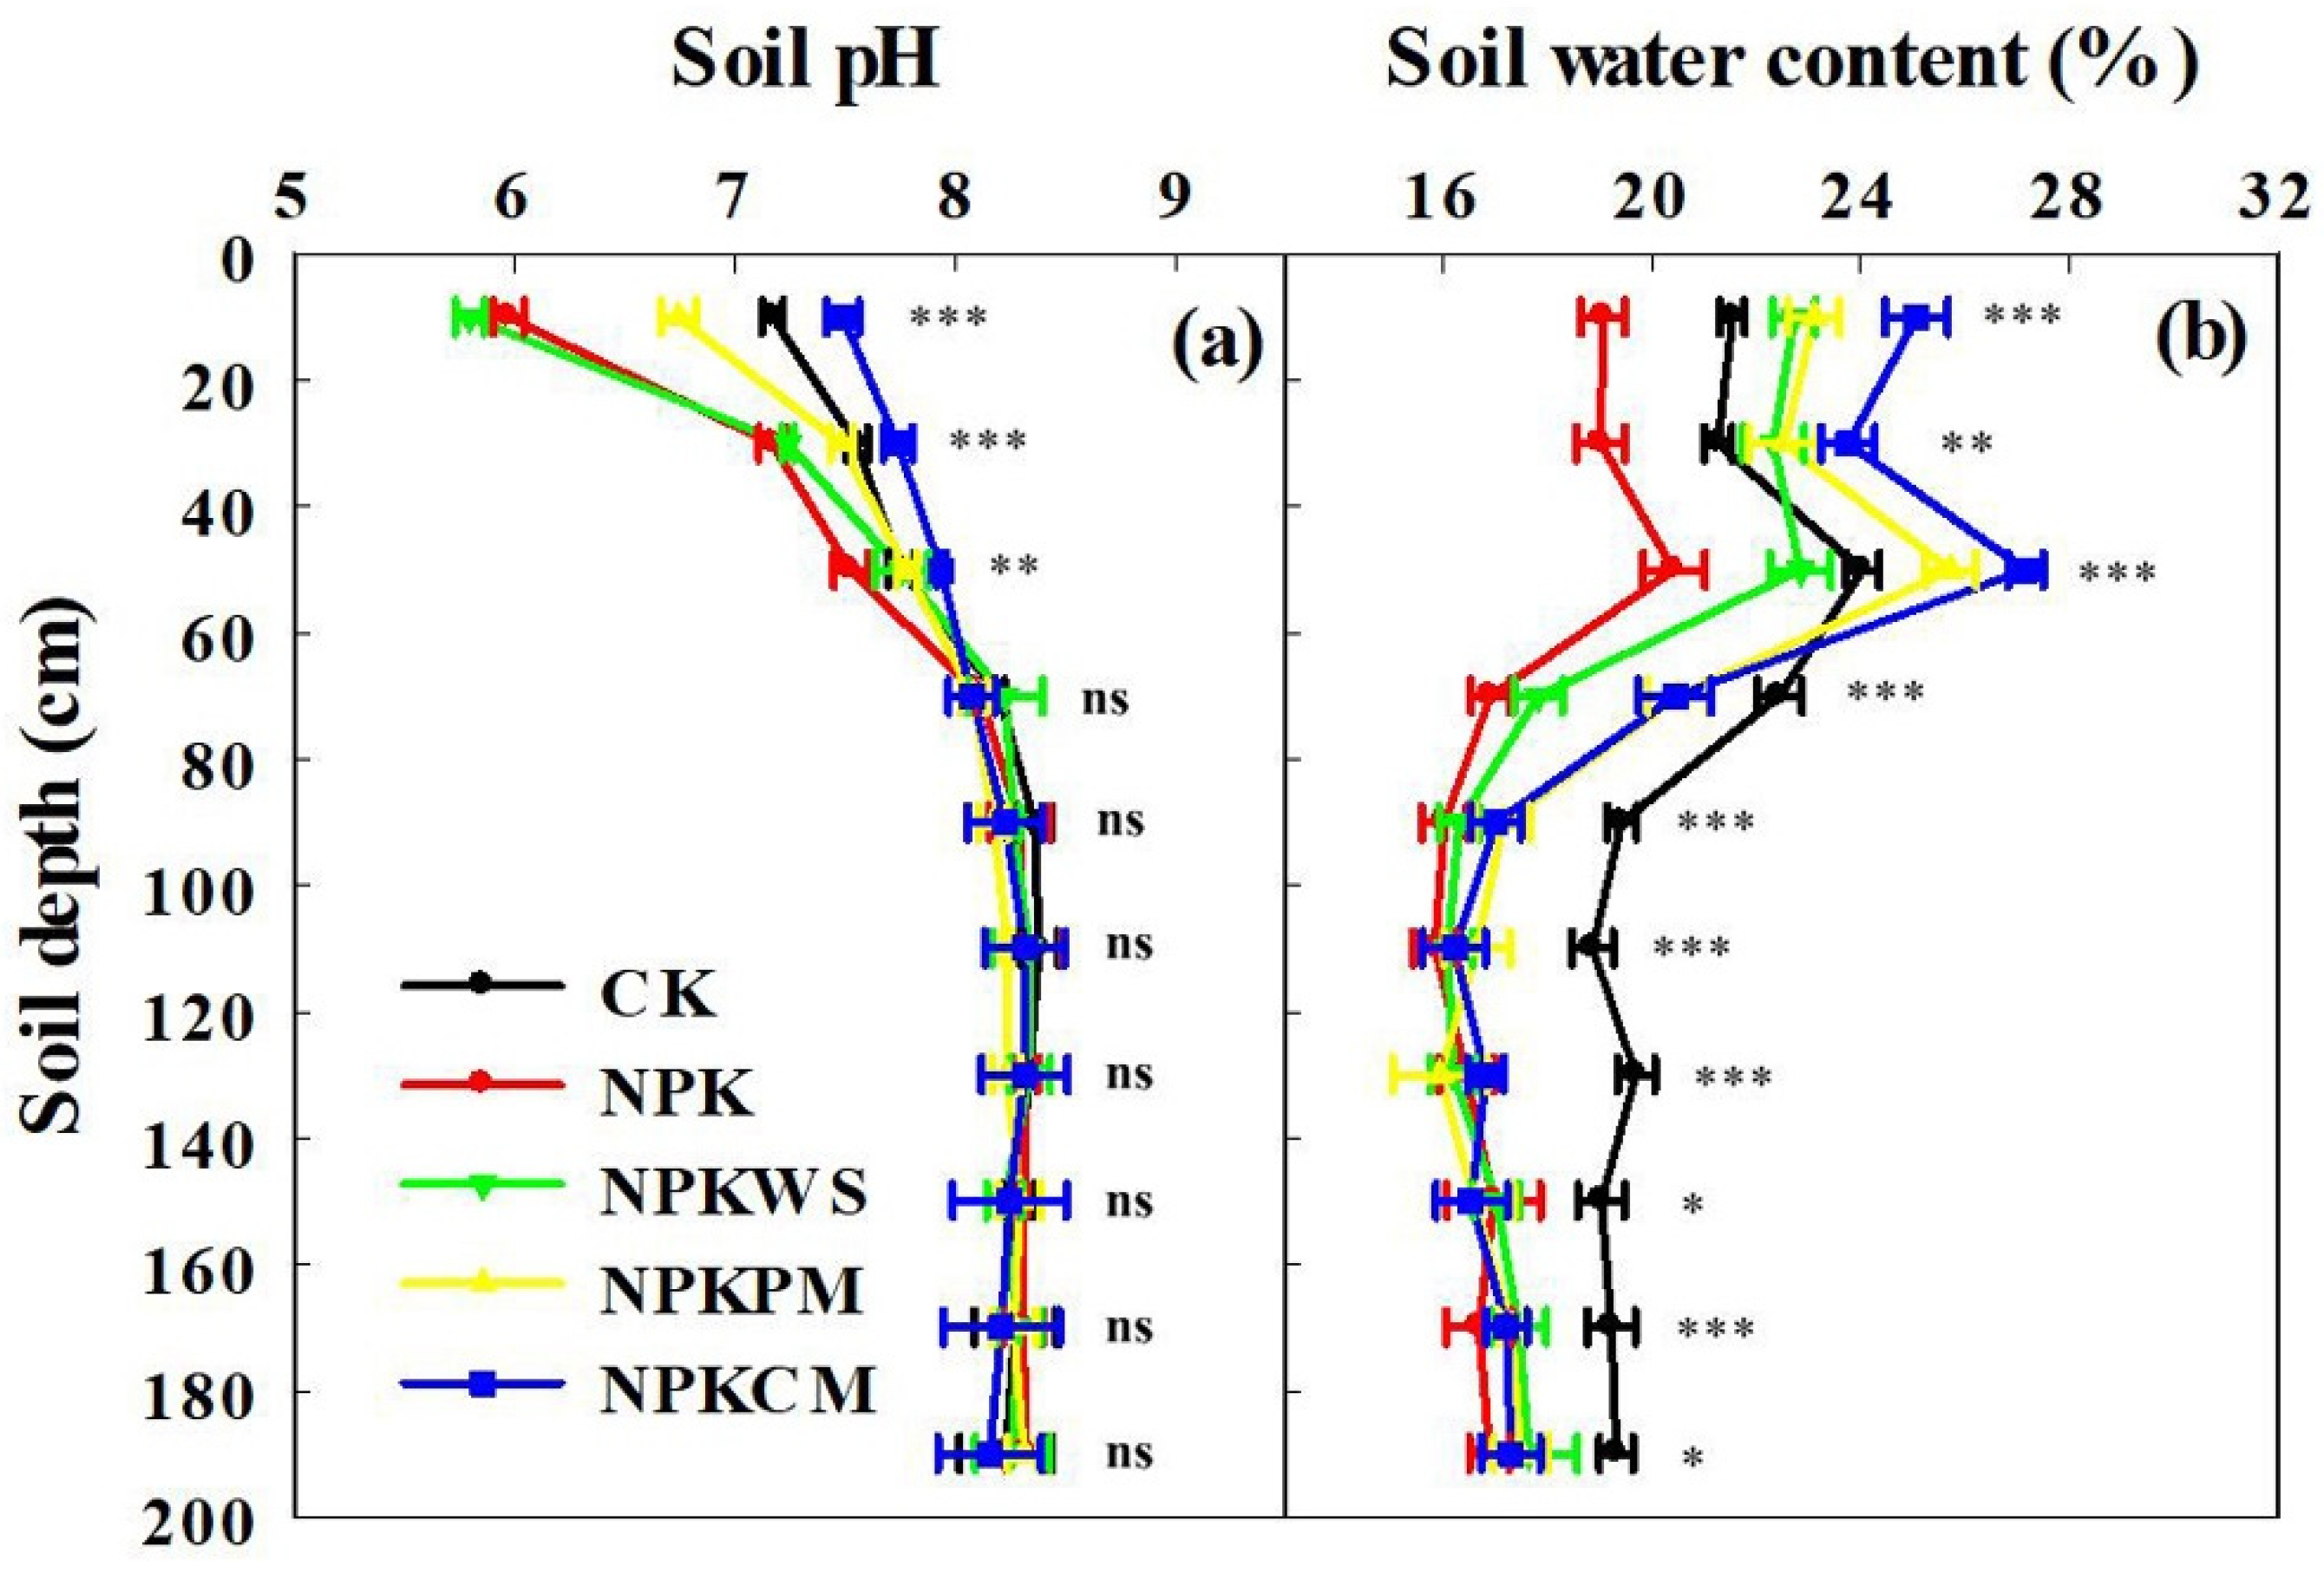
In the 0–20 cm soil, after long-term fertilization, the pH value of the treated soil was lower than the initial soil pH value (7.4), and it ranged from 5.79 (NPKWS) to 7.48 (NPKPM) (Figure 1a). Above the 60 cm soil layer, soil pH increased with increasing soil depth. In the 0–20 and 20–40 cm depths, soil pH in NPK and NPKWS significantly (p < 0.001) decreased as compared to CK. In each layer above 60 cm, NPKPM and NPKCM led to a significant (p < 0.01) increment in soil pH, compared with NPK and NPKWS. However, only NPKCM increased soil pH more than CK in the 20–40 and 40–60 cm soil layers. Below 60 cm soil depth, no significant difference was observed among the treatments.
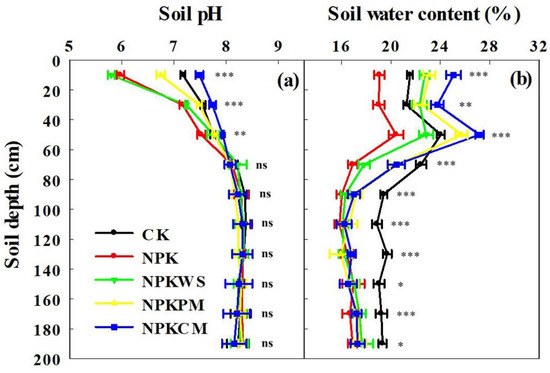
Figure 1.
Soil pH and soil water content in the 0–200 cm depth after 32 years of fertilization in Vertisols. (a) Soil pH and (b) soil water content. CK: no fertilization; NPK: chemical fertilizers; NPKWS: NPK plus wheat straw; NPKPM: NPK plus pig manure; NPKCM: NPK plus cattle manure. The asterisks indicate significant differences among planting systems within the same soil layer, * p < 0.05, ** p < 0.01, *** p < 0.001; ns: not significant.
Throughout the soil profile, the soil water content in all treatments was relatively high above the 60 cm soil level and ranged from 19.03 to 27.17%, and it decreased below 60 cm and ranged from 15.37 to 22.46% (Figure 1b). Soil water contents in NPKWS, NPKPM and NPKCM increased significantly (p < 0.01) as compared to CK and NPK in the 0–20 and 20–40 cm depths, with the highest soil water content of 25.14 and 23.78%, respectively, in NPKCM. Soil water contents decreased remarkably in the below 60 cm depth. Soil water contents reached a stable level below 100 cm soil depth. However, soil water content was higher in the control than in the amended soils below 100 cm depth.
3.2. Soil Organic Carbon (SOC), Total N Contents and the C/N Ratio in the 0–200 cm Depth
Throughout the soil profile, SOC and total N contents in each treatment decreased with increasing soil depth and reached a relatively stable level at 80 cm (Figure 2a,b). At the same layer above 60 cm, the SOC and total N contents of NPKCM and NPKPM were higher than those of NPKWS and NPK (p < 0.01). In the 0–20 cm soil, SOC contents in NPK, NPKWS, NPKPM and NPKCM increased by 48.18, 120.92, 131.11 and 231.06%, respectively, and total N contents increased by 46.05, 111.16, 146.51 and 259.53%, respectively, as compared to CK. In the 20–40 and 40–60 cm soil layers, SOC and total N contents increased significantly (p < 0.05) in NPKPM and NPKCM but not in NPKWS, as compared to NPK.
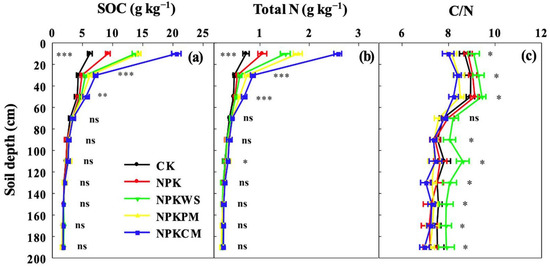
Figure 2.
Soil organic carbon (SOC), total N contents and the C/N ratio in the 0–200 cm depth after 32 years of fertilization in Vertisols. (a) Soil organic carbon (SOC), (b) total N and (c) the C/N ratio. CK: no fertilization; NPK: chemical fertilizers; NPKWS: NPK plus wheat straw; NPKPM: NPK plus pig manure; NPKCM: NPK plus cattle manure. The asterisks indicate significant differences among planting systems within the same soil layer, * p < 0.05, ** p < 0.01, *** p < 0.001; ns: not significant.
No significant difference in the C/N ratio was recorded between CK and NPK along the soil profiles (Figure 2c). Compared with CK and NPK, the C/N ratio in NPKPM and NPKCM decreased significantly (p < 0.05) above 60 cm depth, while the C/N ratio in NPKWS increased significantly (p < 0.05) in the 80–140 cm soil layer. The C/N ratio in NPKWS was significantly (p < 0.05) higher than that in NPKPM and NPKCM above 60 cm and below 80 cm soil layers.
3.3. Total P and Total K Contents in the 0–200 cm Depth
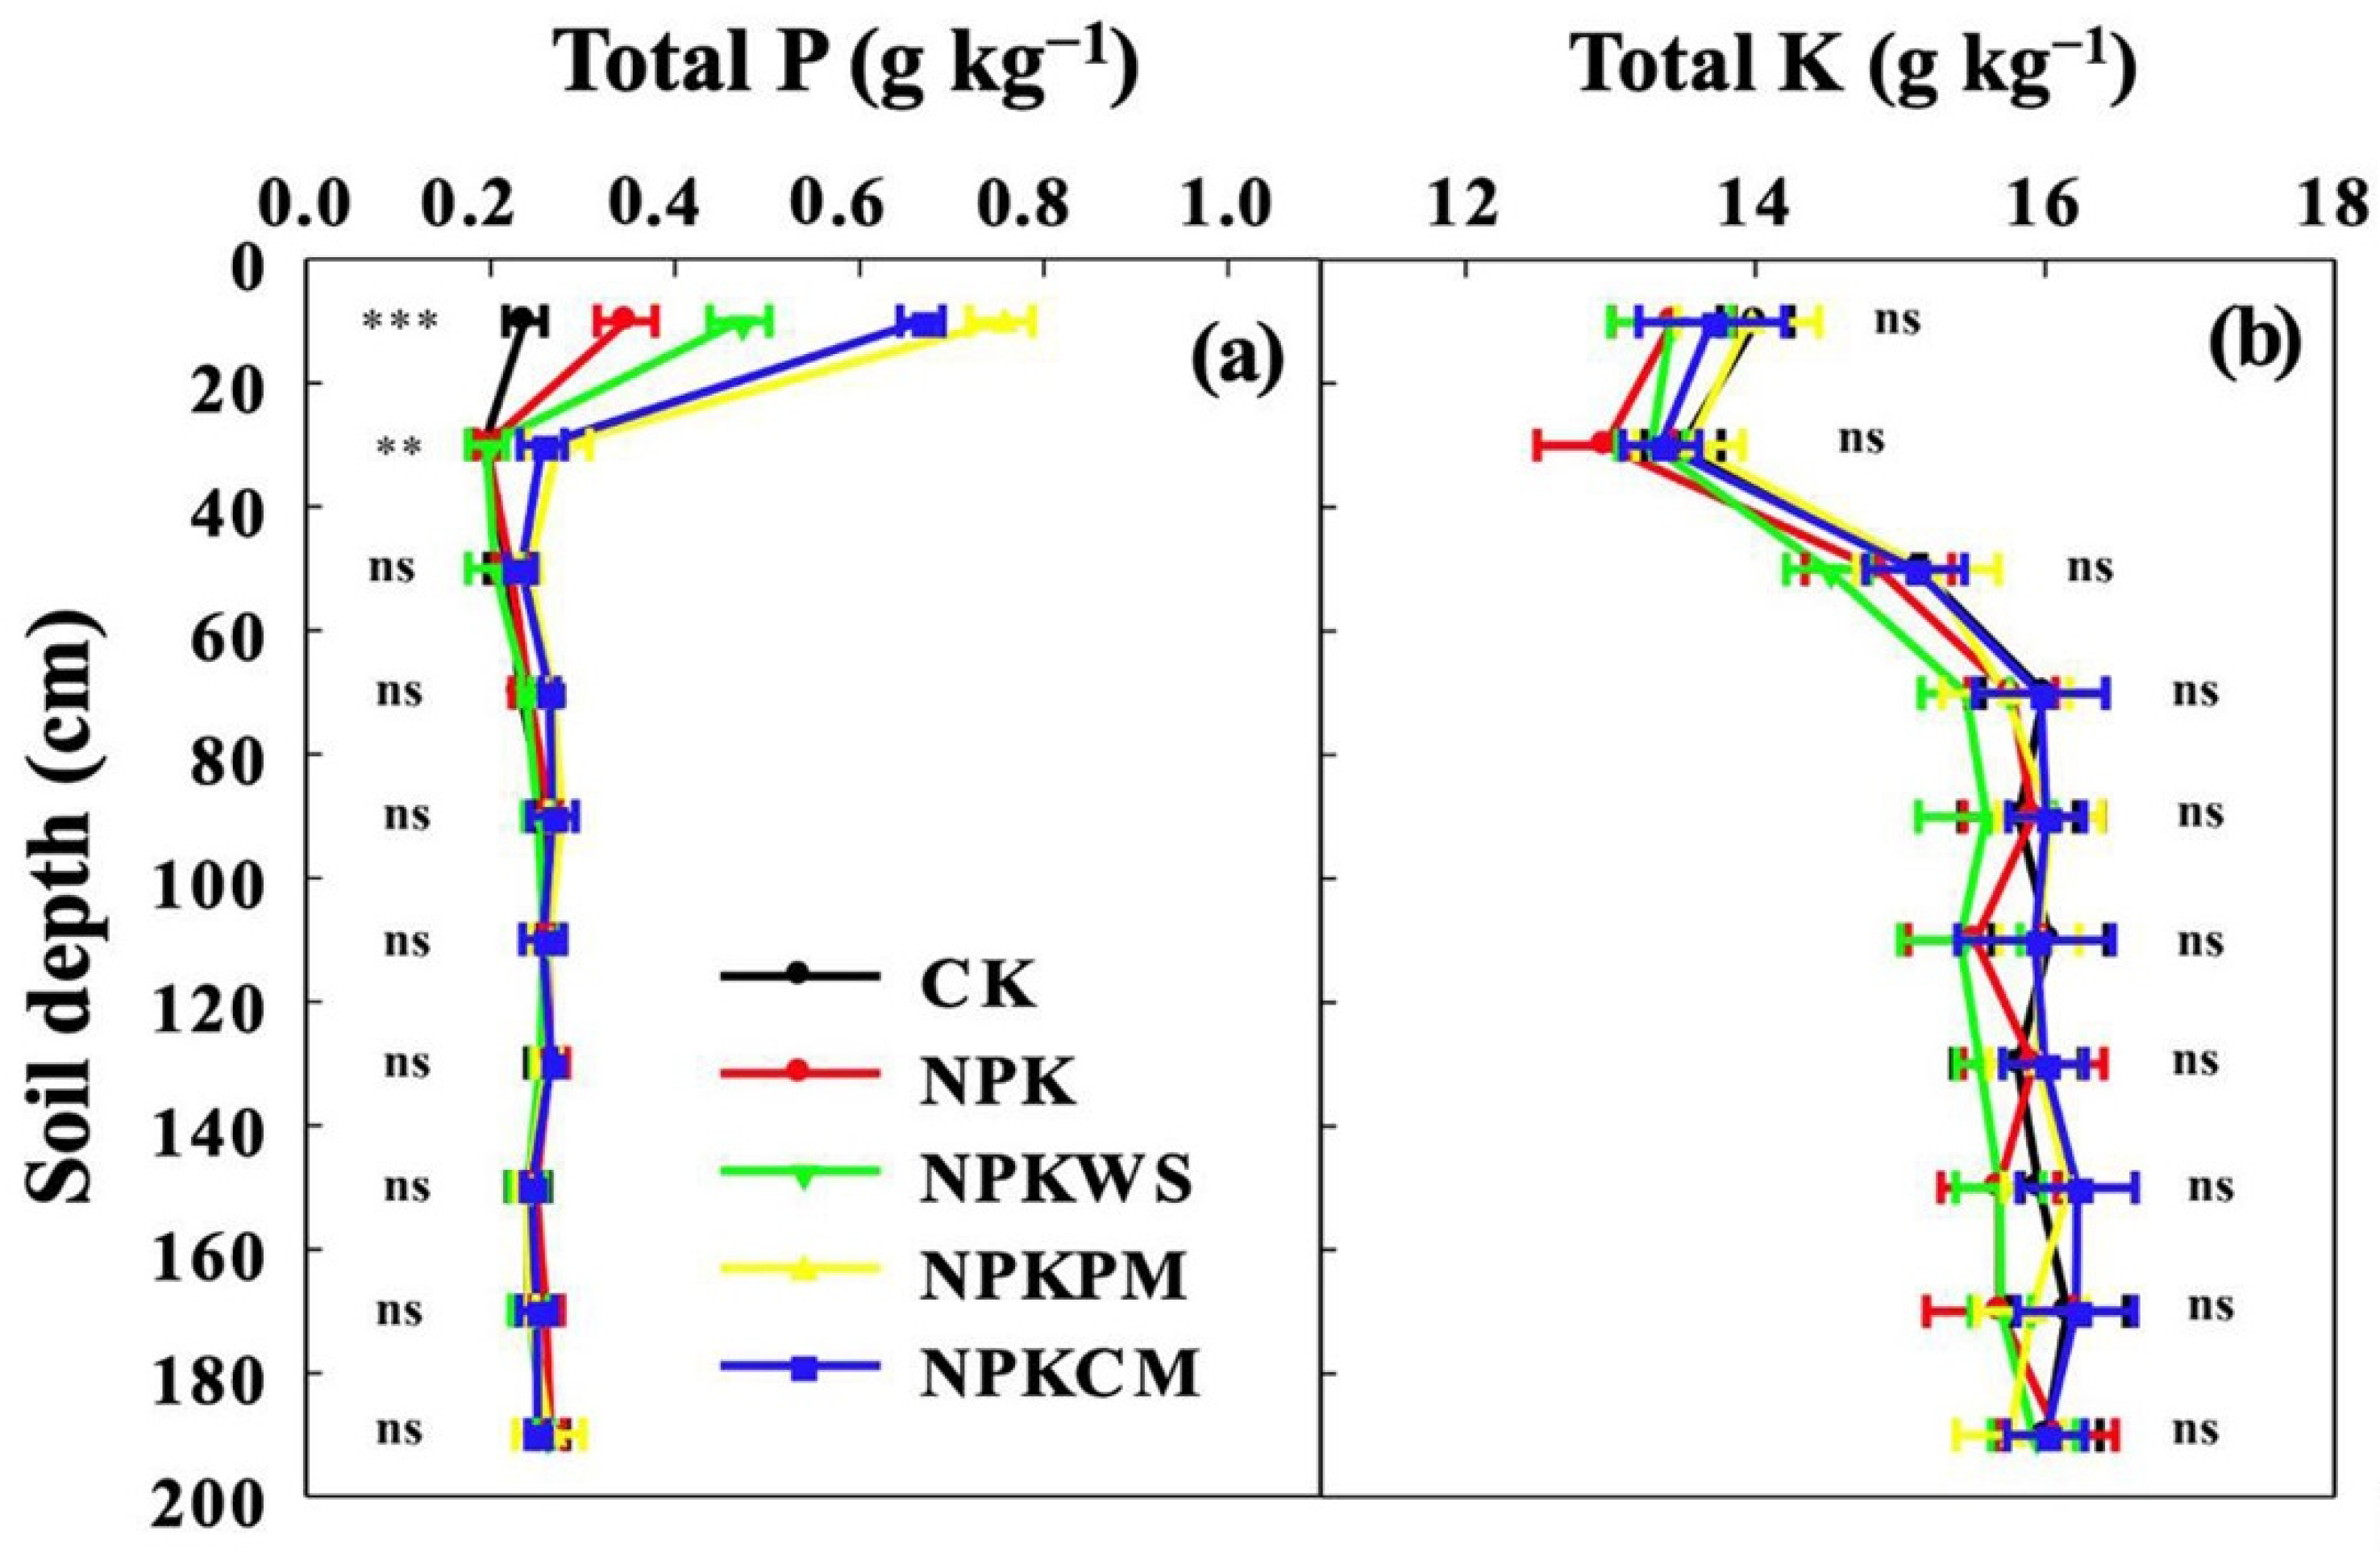
Throughout the soil profile, total P content in each treatment was highest at 0–20 cm depth, then decreased significantly (p < 0.05) in 20–40 cm soil. Both total P and total K contents remained stable below the 60 cm soil depth (Figure 3a). In the 0–20 cm soil, total P contents in NPK, NPKWS, NPKCM, and NPKPM significantly (p < 0.001) increased by 46.48, 98.59, 181.69, and 218.31%, respectively, as compared to CK. In the 20–40 cm soil layer, total P contents in NPKCM and NPKPM increased significantly (p < 0.01), compared with CK and NPK. However, total P content in NPKWS did not increase as compared to CK and NPK. Total K content in each treatment was lower (p < 0.05) above 40 cm soil than in other soil depths (Figure 3b).
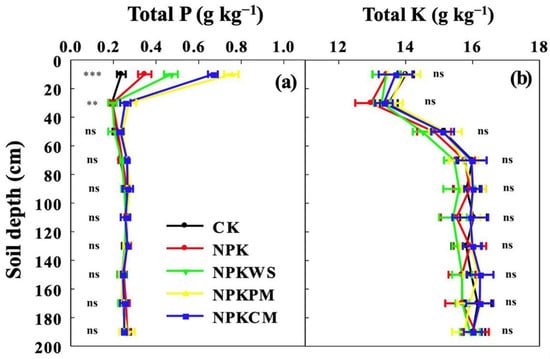
Figure 3.
Total P and total K contents in the 0–200 cm depth after 32 years of fertilization in Vertisols. (a) Total P and (b) total K. CK: no fertilization; NPK: chemical fertilizers; NPKWS: NPK plus wheat straw; NPKPM: NPK plus pig manure; NPKCM: NPK plus cattle manure. The asterisks indicate significant differences among planting systems within the same soil layer, ** p < 0.01, *** p < 0.001; ns: not significant.
3.4. Alkali-Hydrolyzable N, Available P and Available K Contents in the 0–60 cm Depth
Alkali-hydrolyzable N, available P and available K contents in NPK, NPKWS, NPKPM and NPKCM increased significantly (p < 0.05) in the 0–20 cm soil, compared with CK (Table 2). In the 20–40 cm soil layer, alkali-hydrolyzable N, available P and available K contents in NPKWS, NPKPM and NPKCM were higher than those in CK. In the 40–60 cm soil layer, there were no significant differences in alkali-hydrolyzable N and available P contents among NPK, NPKWS, NPKPM and NPKCM, but the alkali-hydrolyzable N was higher than that in the control, while the amendments had no effects on available P. The highest available K content was observed in NPKCM.
Table 2.
Alkali-hydrolyzable N, available P and available K contents in the 0–20 cm, 20–40 cm and 40–60 cm depths after 32 years of fertilization in each treatment. CK: no fertilization; NPK: chemical fertilizers; NPKWS: NPK plus wheat straw; NPKPM: NPK plus pig manure; NPKCM: NPK plus cattle manure.
3.5. Soil Micronutrients (DTPA-Extractable Fe, Mn, Cu and Zn) in the 0–60 cm Depth
Throughout the soil profile, available soil micronutrients (DTPA-extractable Fe, Mn, Cu and Zn) decreased with increasing soil depth in each treatment (Table 3). In the 0–20 cm depth, soil micronutrients (DTPA-extractable Fe, Mn, Cu and Zn) varied significantly among the treatments, in the ranges of 25.15~98.30, 35.10~102.20, 2.68~8.58 and 0.20~15.37 mg kg−1, respectively. Among all the treatments, higher (p < 0.05) DTPA-extractable Fe and DTPA-extractable Mn were observed in NPKWS with 98.20 mg kg−1 and 102.20 mg kg−1, respectively, while higher (p < 0.05) DTPA-extractable Cu and DTPA-extractable Zn were observed in NPKPM with 8.58 mg kg−1 and 15.37 mg kg−1, respectively. No significant differences in soil micronutrients (DTPA-extractable Fe, Mn, Cu and Zn) among the treatments were observed in the 20–40 cm and 40–60 cm soil layers.
Table 3.
Soil micronutrients (DTPA-extractable Fe, Mn, Cu and Zn) in the 0–20 cm, 20–40 cm and 40–60 cm depths after 32 years of fertilization in each treatment. CK: no fertilization; NPK: chemical fertilizers; NPKWS: NPK plus wheat straw; NPKPM: NPK plus pig manure; NPKCM: NPK plus cattle manure.
3.6. Soil NH4+−N and NO3−−N Contents in the 0–200 cm Depth
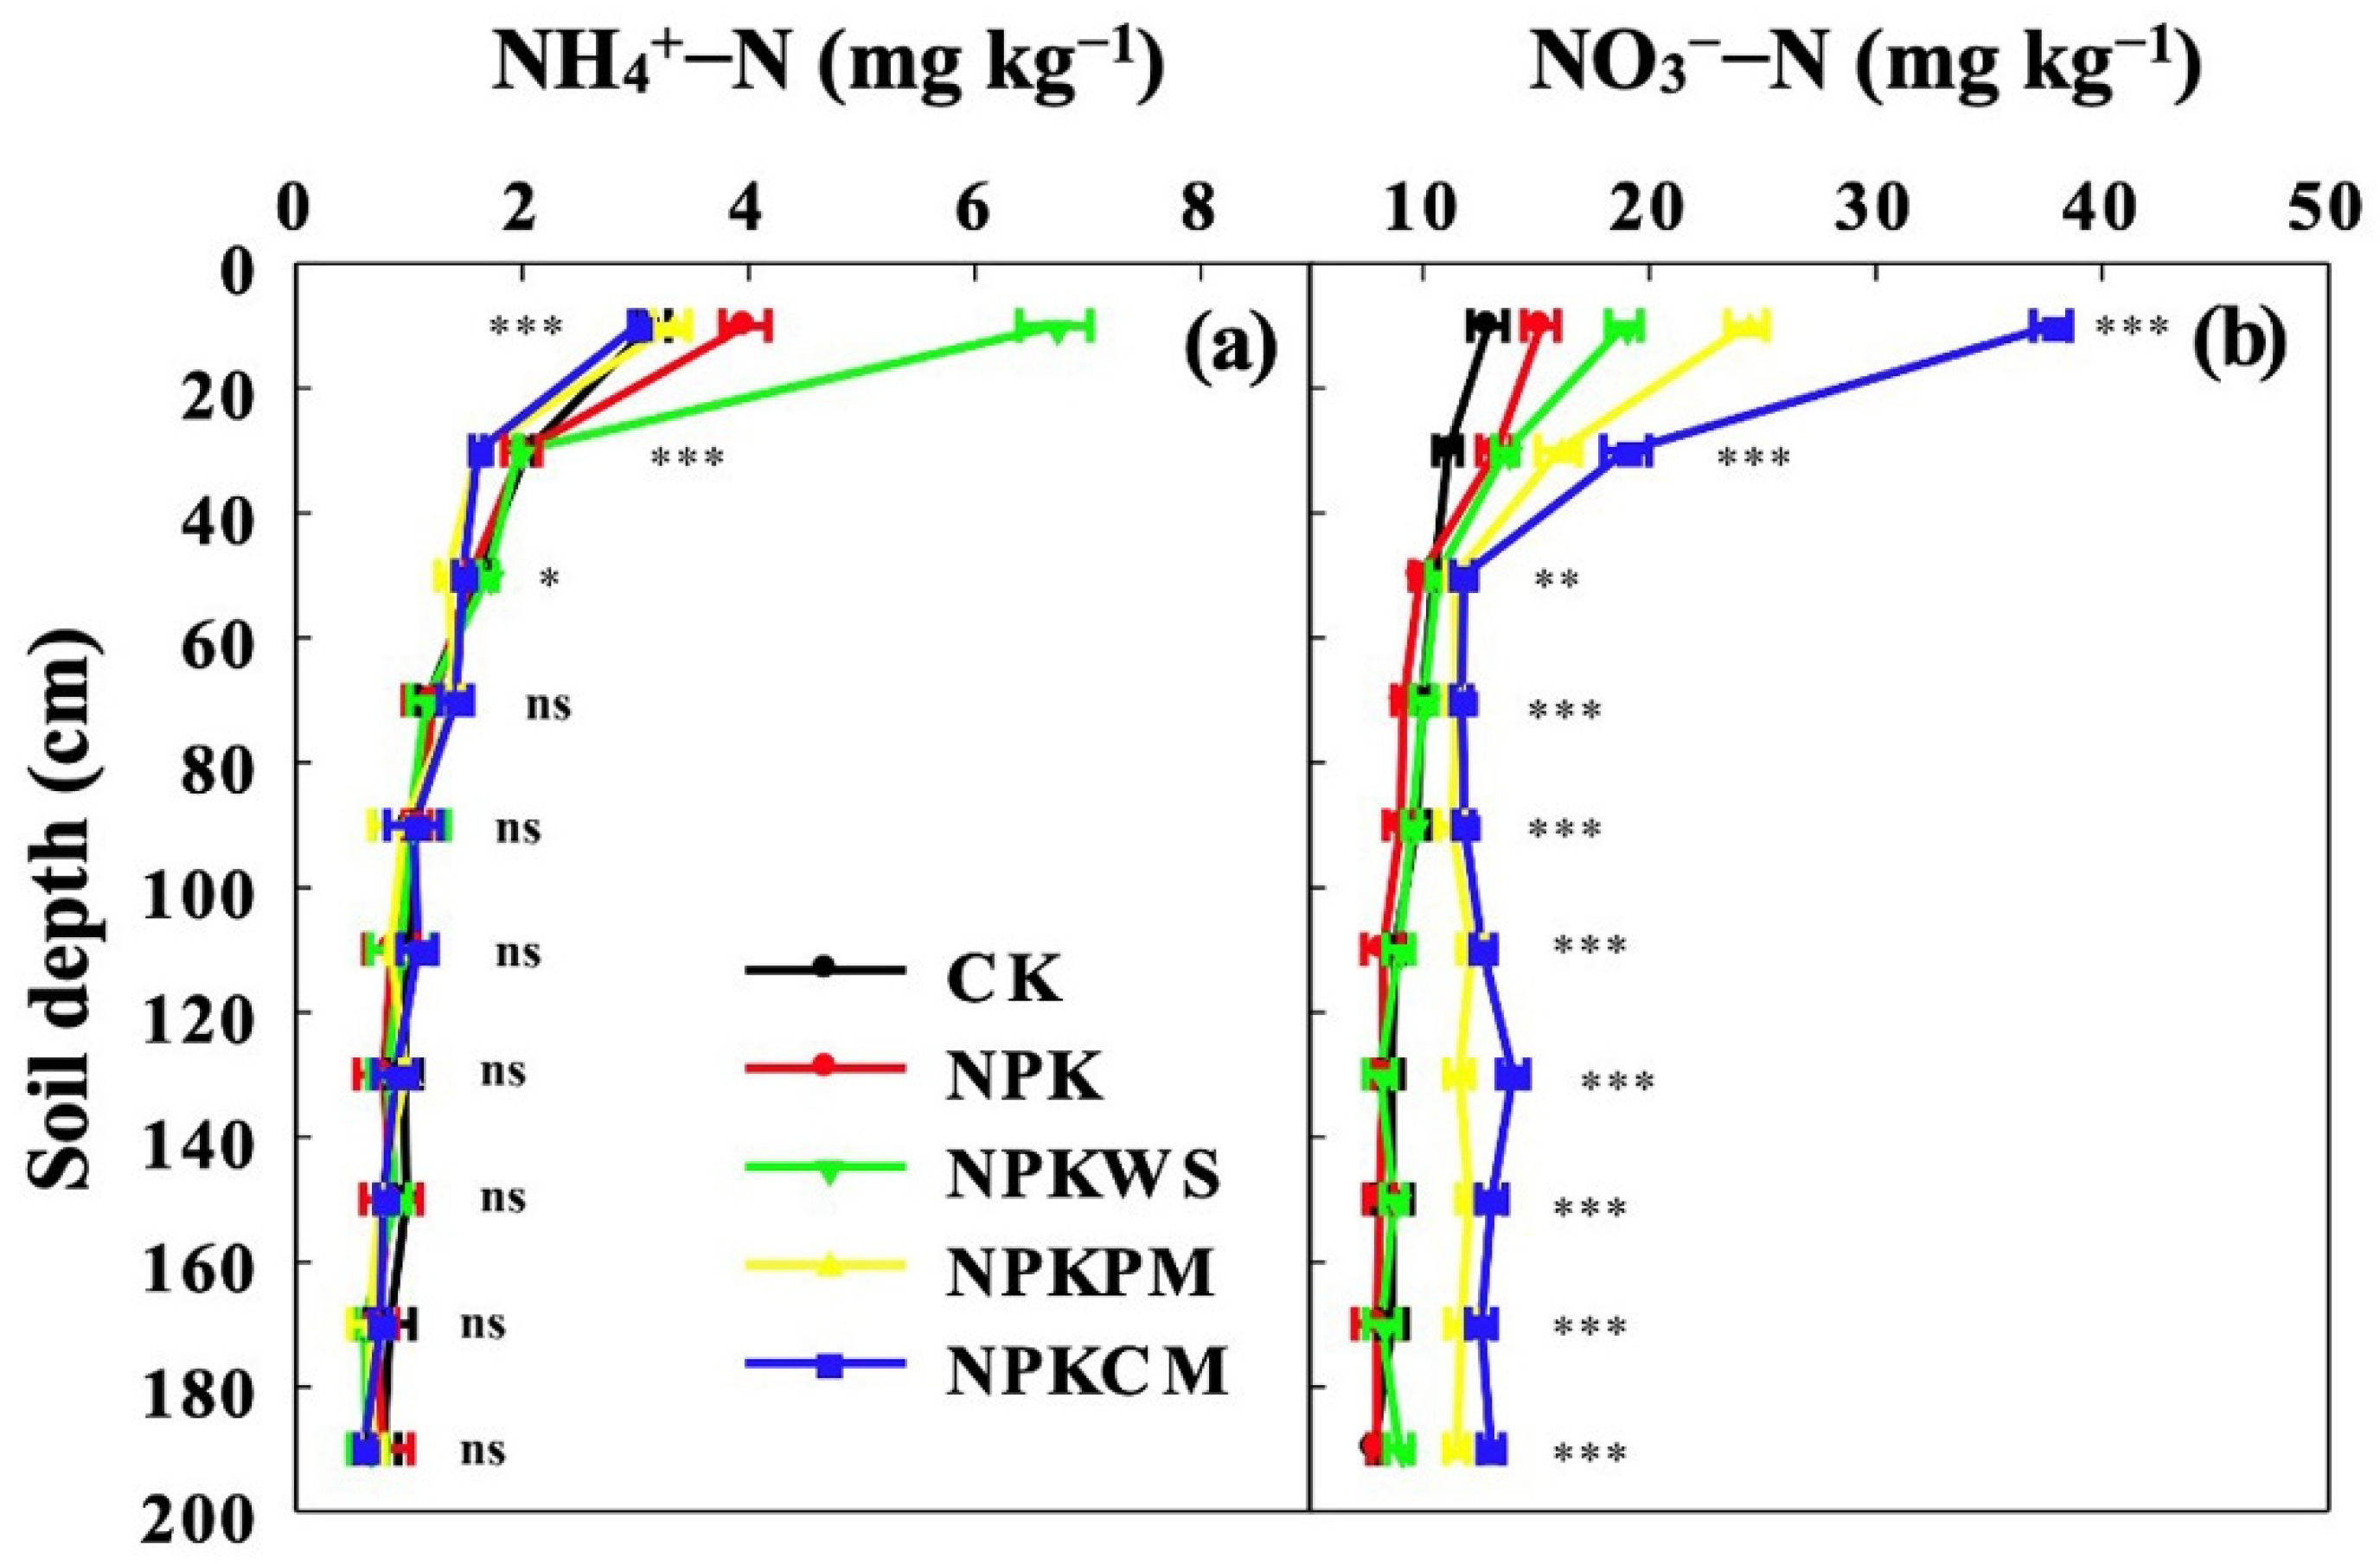
Soil NH4+−N content in each treatment was highest in the 0–20 cm depth, decreased from 20 to 40 cm soil depth and exhibited slight changes below 40 cm soil depth (Figure 4a). In the 0–20 cm depth, soil NH4+−N contents in NPK and NPKWS were 26.43 and 113.71% higher than those in CK. Soil NH4+−N contents in NPKPM and NPKCM were about the same as those in CK. Below 40 cm soil depth, however, soil NH4+−N contents did not change among the treatments.
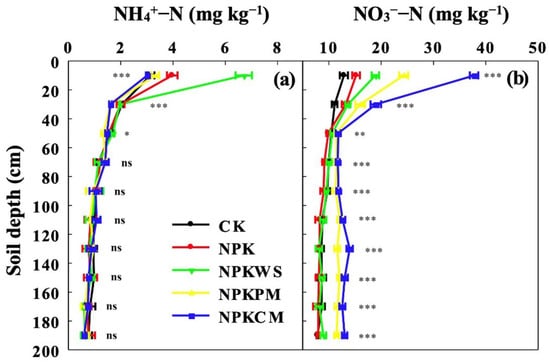
Figure 4.
Soil NH4+−N and NO3−−N contents in the 0–200 cm depth after 32 years of fertilization in Vertisols. (a) Soil NH4+−N and (b) soil NO3−−N. CK: no fertilization; NPK: chemical fertilizers; NPKWS: NPK plus wheat straw; NPKPM: NPK plus pig manure; NPKCM: NPK plus cattle manure. The asterisks indicate significant differences among planting systems within the same soil layer, * p < 0.05, ** p < 0.01, *** p < 0.001; ns: not significant.
Different from soil NH4+−N contents, soil NO3−−N contents in NPK, NPKWS, NPKPM and NPKCM increased significantly (p < 0.001) in the 0–20 and 20–40 cm depths, as compared to CK (Figure 4b). NPK and NPKWS did not further increase NO3−−N contents below 40 cm depth, compared with CK. However, NPKPM and NPKCM significantly (p < 0.001) increased NO3−−N contents as compared to CK, NPK and NPKWS below 60 cm soil depth, especially below 120 cm depth.
4. Discussion
4.1. Long-Term Fertilization Effects on Soil pH and Soil Water Content along the Soil Profile
Soil pH controls many chemical and biological processes mediated by soil microorganisms [36], and its spatial variability directly influences soil fertility [37]. In this experiment, NPK fertilizers led to soil acidity (Figure 1a), as reported by Guo et al. [38]. However, long-term manure application alleviated the acidification above 40 cm depth (Figure 1a), which could foster soil microbial activity [14] and further exert positive effects on soil nutrients [15] and crop yield [39].
Soil water contents are closely related to soil variables such as carbon content [40] and clay content [41], and soil water dynamics can modify the vertical distributions of soil nutrients [42]. Our results showed that long-term manure and straw application significantly (p < 0.01) increased soil water contents below 40 cm depth (Figure 1b). These findings could be attributed to the increased SOC in this depth (Figure 2a), which could interact with large amounts of clay minerals in Vertisols [1,2] to form organo-mineral complexes [43], ultimately increasing the soil water retention [7]. Furthermore, soil water contents decreased more rapidly with manure than other treatments from 60 to 100 cm soil depth (Figure 1b), which might be associated with crop water uptake by much larger amounts of developing crop roots in manure treatments [44].
4.2. Long-Term Fertilization Effects on Soil Nutrients along the Soil Profile
Long-term manure and straw application significantly (p < 0.001) increase SOC (Figure 2a), total N (Figure 2b) and total P (Figure 3a) contents in the topsoil (0–20 cm) layer, which agreed with previous studies [13,14]. No significant difference among the treatments was observed below 60 cm soil depth, which might be related to the relatively low disturbance below the root zone [45]. Some studies also found that the SOC content in the 0–50 cm soil layer decreased rapidly with the increase in depth; however, the SOC content in 50–200 cm soil layer did not change [46]. Similarly, a significant change in total N and total P content also occurred in the soil layer above 60 cm [47]. In general, the accumulation of about 80% of crop growing roots with high nutrient uptake efficiency was found in the 0–60 cm soil layers [19,20], indicating that the presence of these roots in surface soil layers may contribute to significant differences in nutrient content [48]; however, there was no significant difference in nutrient content below 60 cm due to fewer crop roots and lower nutrient content in deep soil.
Similar to the results reported by Li et al. [17], we also found that long-term manure and straw application significantly (p < 0.05) increased alkali-hydrolyzable N, available P and available K in the 0–20 cm depth (Table 2). In addition, the gradual infiltration of soil nutrients from surface soil layers [49] or the accelerated mineralization and release of soil nutrients in subsoils occurred [12,50], resulting in accumulated alkali-hydrolyzable N, available P and available K in the 20–40 cm depth after long-term manure and straw application (Table 2).
Micronutrient status in soils is essential for soil health [51] and crop growth [52]. In this study, long-term organic amendments significantly (p < 0.05) influenced soil micronutrients (DTPA-extractable Fe, Mn, Cu and Zn) in the 0–20 cm depth (Table 3), similar to results reported by Lupwayi et al. [53], who demonstrated that differences in feed availability and quality could change the availability of micronutrients in manure applied, and eventually in soils. Meanwhile, our results further suggested that soil micronutrients (DTPA-extractable Fe, Mn, Cu and Zn) in the 20–40 cm and 40–60 cm depths were not affected by manure and straw application (Table 3); these findings address an area that has received little research attention.
4.3. Long-Term Fertilization Effects on Soil Nitrate Leaching along the Soil Profile
In this study, long-term organic amendments significantly (p < 0.05) increased NO3−−N contents above 40 cm depth (Figure 4b), which was closely correlated with more fertilizer N applied [12], compared with CK and NPK. After long-term fertilization, NO3−−N transport to deeper soils led to large amounts of NO3−−N contents with manure application in the 120–200 cm depth (Figure 4b). However, previous studies conducted in silt loam soil found that manure application significantly decreased NO3−−N contents in the surface soil (0–20 cm) [54] or subsoil (50–100 cm) [26]. These conflicting findings might be explained by the two soils having contrasting clay mineralogy [55] and the changes in soil N mineralization–immobilization dynamics [51]. Furthermore, our results showed that long-term straw application minimized the NO3−−N contents in deeper soils (80–200 cm depth) to levels that are comparable to those of CK and NPK (Figure 4b). This result indicated that straw application probably promoted soil NO3−−N retention, which was consistent with the C/N ratio in the 80–200 cm depth being apparently higher with straw than manure (Figure 2c). Moreover, straw incorporation improved soil aggregate stability in comparison to manure [11], which might further mitigate NO3−−N leaching.
More work is needed to understand the underlying mechanisms governing the effects of organic amendments on soil vertical nutrient distributions. The difference in mineral nitrogen content between years should also be considered. Besides, heavy metal pollution risk with continuous manure and straw application is still unclear and requires further investigation.
5. Conclusions
This study indicated that the application of organic amendments had a great potential to increase soil nutrients above 40 cm depth, with greater values observed with manure than straw. However, long-term manure application significantly increased NO3−−N contents in the 120–200 cm depth, indicating a high risk of NO3−−N leaching as compared to straw incorporation. Overall, we recommend the application of chemical fertilization in combination with crop straw for improving soil nutrients along the soil profile and reducing nitrate nitrogen leaching.
Author Contributions
Conceptualization, C.Z.; data curation, Y.Z., L.W., X.Z. and D.W.; formal analysis, Y.Z., L.W. and A.D.; funding acquisition, C.Z.; investigation, X.Z. and D.W.; supervision, C.Z.; writing—original draft, Y.Z. and L.W.; writing—review and editing, R.A., C.Z. and W.Z. All authors have read and agreed to the published version of the manuscript.
Funding
This study was supported by the National Natural Science Foundation of China (32101835), the earmarked fund for Modern Agro-Industry Technology Research System-Green manure (CARS−22), the Anhui Natural Science Foundation of China (2108085QC111) and the Innovation Program of Chinese Academy of Agricultural Sciences (CAAS−S2021ZL06).
Institutional Review Board Statement
Not applicable.
Informed Consent Statement
Not applicable.
Conflicts of Interest
The authors declare no conflict of interest.
References
- Coulombe, C.E.; Wilding, L.P.; Dixon, J.B. Overview of Vertisols: Characteristics and impacts on society. In Advances in Agronomy; Sparks, D.L., Ed.; Academic Press: London, UK, 1996; Volume 57, pp. 289–375. [Google Scholar]
- Kovda, I. Vertisols: Extreme features and extreme environment. Geoderma Reg. 2020, 22, e00312. [Google Scholar] [CrossRef]
- Soil Survey Staff. Soil Survey Staff Keys to Soil Taxonomy, 12th ed.; USDA-Natural Resources Conservation Service: Washington, DC, USA, 2014. [Google Scholar]
- Dinka, T.M.; Morgan, C.L.S.; McInnes, K.J.; Kishné, A.S.; Daren Harmel, R. Shrink–swell behavior of soil across a Vertisol catena. J. Hydrol. 2013, 476, 352–359. [Google Scholar] [CrossRef]
- Peng, X.H.; Horn, R.; Hallett, P.D. Soil structure and its functions in ecosystems: Phase matter & scale matter. Soil Tillage Res. 2015, 146, 1–3. [Google Scholar] [CrossRef]
- Li, D.C.; Zhang, G.L.; Gong, Z.T. On taxonomy of Shajiang black soils in China. Soils 2011, 43, 623–629. (In Chinese) [Google Scholar]
- Zhou, H.; Chen, C.; Wang, D.Z.; Arthur, E.; Zhang, Z.B.; Guo, Z.C.; Peng, X.H.; Mooney, S.J. Effect of long-term organic amendments on the full-range soil water retention characteristics of a Vertisol. Soil Tillage Res. 2020, 202, 104663. [Google Scholar] [CrossRef]
- Millán, H.; Tarquís, A.M.; Pérez, L.D.; Mato, J.; González-Posada, M. Spatial variability patterns of some Vertisol properties at a field scale using standardized data. Soil Tillage Res. 2012, 120, 76–84. [Google Scholar] [CrossRef]
- Bhattacharyya, R.; Kundu, S.; Prakash, V.; Gupta, H.S. Sustainability under combined application of mineral and organic fertilizers in a rainfed soybean–wheat system of the Indian Himalayas. Eur. J. Agron. 2008, 28, 33–46. [Google Scholar] [CrossRef]
- Peng, X.; Zhu, Q.H.; Xie, Z.B.; Darboux, F.; Holden, N.M. The impact of manure, straw and biochar amendments on aggregation and erosion in a hillslope Ultisol. Catena 2016, 138, 30–37. [Google Scholar] [CrossRef]
- Guo, Z.C.; Zhang, Z.B.; Zhou, H.; Rahman, M.T.; Wang, D.Z.; Guo, X.S.; Li, L.J.; Peng, X.H. Long-term animal manure application promoted biological binding agents but not soil aggregation in a Vertisol. Soil Tillage Res. 2018, 180, 232–237. [Google Scholar] [CrossRef]
- Li, X.; Han, S.; Wan, W.J.; Zheng, L.X.; Chen, W.L.; Huang, Q.Y. Manure fertilizes alter the nitrite oxidizer and comammox community composition and increase nitrification rates. Soil Tillage Res. 2020, 204, 104701. [Google Scholar] [CrossRef]
- Ye, G.P.; Lin, Y.X.; Kuzyakov, Y.; Liu, D.Y.; Luo, J.F.; Lindsey, S.; Wang, W.J.; Fan, J.B.; Ding, W.X. Manure over crop residues increases soil organic matter but decreases microbial necromass relative contribution in upland Ultisols: Results of a 27-year field experiment. Soil Biol. Biochem. 2019, 134, 15–24. [Google Scholar] [CrossRef]
- Laik, R.; Kumara, B.H.; Pramanick, B.; Singh, S.K.; Nidhi; Alhomrani, M.; Gaber, A.; Hossain, A. Labile soil organic matter pools are influenced by 45 years of applied farmyard manure and mineral nitrogen in the wheat-pearl millet cropping system in the sub-tropical condition. Agronomy 2021, 11, 2190. [Google Scholar] [CrossRef]
- Pan, H.; Chen, M.M.; Feng, H.J.; Wei, M.; Song, F.P.; Lou, Y.H.; Cui, X.M.; Wang, H.; Zhuge, Y.P. Organic and inorganic fertilizers respectively drive bacterial and fungal community compositions in a fluvo-aquic soil in northern China. Soil Tillage Res. 2020, 198, 104540. [Google Scholar] [CrossRef]
- Wu, H.L.; Cai, A.D.; Xing, T.T.; Huai, S.C.; Zhu, P.; Xu, M.G.; Lu, C.G. Fertilization enhances mineralization of soil carbon and nitrogen pools by regulating the bacterial community and biomass. J. Soils Sediments 2021, 21, 1633–1643. [Google Scholar] [CrossRef]
- Li, B.Y.; Huang, S.M.; Wei, M.B.; Zhang, H.L.; Shen, A.L.; Xu, J.M.; Ruan, X.L. Dynamics of soil and grain micronutrients as affected by long-term fertilization in an aquic Inceptisol. Pedosphere 2010, 20, 725–735. [Google Scholar] [CrossRef]
- Thomai, N.; Theodora, M. Influence of liquid cattle manure on micronutrients content and uptake by corn and their availability in a calcareous soil. Agron. J. 2011, 103, 113–118. [Google Scholar] [CrossRef]
- King, J.; Gay, A.; Sylvester-Bradley, R.; Bingham, I.; Foulkes, J.; Gregory, P.; Robinson, D. Modelling cereal root systems for water and nitrogen capture: Towards an economic optimum. Ann. Bot. 2003, 91, 383–390. [Google Scholar] [CrossRef] [Green Version]
- Peng, Y.F.; Niu, J.F.; Peng, Z.P.; Zhang, F.S.; Li, C.J. Shoot growth potential drives N uptake in maize plants and correlates with root growth in the soil. Field Crops Res. 2010, 115, 85–93. [Google Scholar] [CrossRef]
- Bland, W.L. Cotton and soybean root system growth in three soil temperature regimes. Agron. J. 1993, 85, 906–911. [Google Scholar] [CrossRef]
- Zhou, S.L.; Wu, Y.C.; Wang, Z.M.; Lu, L.Q.; Wang, R.Z. The nitrate leached below maize root zone is available for deep-rooted wheat in winter wheat-summer maize rotation in the North China Plain. Environ. Pollut. 2008, 152, 723–730. [Google Scholar] [CrossRef]
- Sandén, T.; Zavattaro, L.; Spiegel, H.; Grignani, C.; Sandén, H.; Baumgarten, A.; Tiirola, M.; Mikkonen, A. Out of sight: Profiling soil characteristics, nutrients and microbial communities affected by organic amendments down to one meter in a long-term maize cultivation experiment. Appl. Soil Ecol. 2019, 134, 54–63. [Google Scholar] [CrossRef]
- Jobbágy, E.G.; Jackson, R.B. The distribution of soil nutrients with depth: Global patterns and the imprint of plants. Biogeochemistry 2001, 53, 51–77. [Google Scholar] [CrossRef]
- Hirte, J.; Walder, F.; Hess, J.; Büchi, L.; Colombi, T.; van der Heijden, M.G.; Mayer, J. Enhanced root carbon allocation through organic farming is restricted to topsoils. Sci. Total Environ. 2021, 755, 143551. [Google Scholar] [CrossRef] [PubMed]
- Mazhar, S.A.; Nawaz, M.; Khan, S.; Irshad, S. Impact of urea and farm yard manure on nitrate concentration in soil profile and productivity of wheat crop. J. Plant Nutr. 2018, 41, 2683–2691. [Google Scholar] [CrossRef]
- Yang, S.Q.; Wang, Y.S.; Liu, R.L.; Li, Q.X.; Yang, Z.L. Effects of straw application on nitrate leaching in fields in the Yellow River irrigation zone of Ningxia, China. Sci. Rep. 2018, 8, 954. [Google Scholar] [CrossRef] [Green Version]
- Maeda, M.; Zhao, B.; Ozaki, Y.; Yoneyama, T. Nitrate leaching in an Andisol treated with different types of fertilizers. Environ. Pollut. 2003, 121, 477–487. [Google Scholar] [CrossRef]
- Kaur, S.; Dheri, G.S.; Benbi, D.K. Effect of long-term fertilization in maize-wheat cropping system on carbon mineralization in soil. Carbon Manag. 2019, 10, 523–532. [Google Scholar] [CrossRef]
- Hua, K.K.; Wang, D.Z.; Guo, Z.B. Soil organic carbon contents as a result of various organic amendments to a vertisol. Nutr. Cycl. Agroecosyst. 2017, 108, 1–14. [Google Scholar] [CrossRef]
- Nelson, E.W.; Sommers, L.E. Total carbon, organic carbon, and organic matter. In Methods of Soil Analysis, Part 3—Chemical Methods; Sparks, D.L., Ed.; Soil Science Society of America: Madison, WI, USA, 1996. [Google Scholar]
- Bremner, J.M. Nitrogen total. In Methods of Soil Analysis, Part 3—Chemical Methods; Sparks, D.L., Ed.; Soil Science Society of America: Madison, WI, USA, 1996; pp. 1085–1122. [Google Scholar]
- Lu, R.K. Analytical Methods of Soil Agro-Chemistry; Chinese Agricultural Science and Technology Press: Beijing, China, 2000; p. 638. (In Chinese) [Google Scholar]
- Cornfield, A.H. Ammonia released on treating soils with N sodium hydroxide as a possible means of predicting the nitrogen-supplying power of soils. Nature 1960, 87, 260–261. [Google Scholar] [CrossRef]
- Lindsay, W.L.; Norvell, W.A. Development of a DTPA soil test for zinc, iron, manganese, and copper. Soil Sci. Soc. Am. J. 1978, 42, 421–428. [Google Scholar] [CrossRef]
- Aciego Pietri, J.C.; Brookes, P.C. Relationships between soil pH and microbial properties in a UK arable soil. Soil Biol. Biochem. 2008, 40, 1856–1861. [Google Scholar] [CrossRef]
- Neilsen, D.; Neilsen, G.H.; Sinclair, A.H.; Linehan, D.J. Soil phosphorus status, pH and the manganese nutrition of wheat. Plant Soil 1992, 145, 45–50. [Google Scholar] [CrossRef]
- Guo, J.H.; Liu, X.J.; Zhang, Y.; Shen, J.L.; Han, W.X.; Zhang, W.F.; Christie, P.; Goulding, K.W.T.; Vitousek, P.M.; Zhang, F.S. Significant acidification in major Chinese croplands. Science 2010, 327, 1008–1010. [Google Scholar] [CrossRef] [Green Version]
- Chen, D.M.; Yuan, L.; Liu, Y.R.; Ji, J.H.; Hou, H.Q. Long-term application of manures plus chemical fertilizers sustained high rice yield and improved soil chemical and bacterial properties. Eur. J. Agron. 2017, 90, 34–42. [Google Scholar] [CrossRef]
- Simbahan, G.C.; Dobermann, A. Sampling optimization based on secondary information and its utilization in soil carbon mapping. Geoderma 2006, 133, 345–362. [Google Scholar] [CrossRef]
- Kerry, R.; Oliver, M.A. Comparing sampling needs for variograms of soil properties computed by the method of moments and residual maximum likelihood. Geoderma 2007, 140, 383–396. [Google Scholar] [CrossRef]
- Wu, J.N.; Zeng, H.H.; Zhao, F.; Chen, C.F.; Liu, W.J.; Yang, B.; Zhang, W.J. Recognizing the role of plant species composition in the modification of soil nutrients and water in rubber agroforestry systems. Sci. Total Environ. 2020, 723, 138042. [Google Scholar] [CrossRef]
- Wissing, L.; Kölbl, A.; Schad, P.; Bräuer, T.; Cao, Z.H.; Kögel-Knabner, I. Organic carbon accumulation on soil mineral surfaces in paddy soils derived from tidal wetlands. Geoderma 2014, 228–229, 90–103. [Google Scholar] [CrossRef]
- Passioura, J.B. Roots and drought resistance. Agric. Water Manag. 1983, 7, 265–280. [Google Scholar] [CrossRef]
- Zhang, Y.K.; Biswas, A.; Adamchuk, V.I. Implementation of a sigmoid depth function to describe change of soil pH with depth. Geoderma 2017, 289, 1–10. [Google Scholar] [CrossRef]
- Wang, Y.; Huang, L.; Jia, X.; Zhu, Y.; Shao, M. Distribution characteristics and controls of soil organic carbon at different spatial scales in China′s Loess Plateau. J. Environ. Manag. 2021, 293, 112943. [Google Scholar] [CrossRef] [PubMed]
- Yan, X.; Yang, W.; Muneer, M.A.; Zhang, S.; Wang, M.; Wu, L. Land-use change affects stoichiometric patterns of soil organic carbon, nitrogen, and phosphorus in the red soil of Southeast China. J. Soils Sediments 2021, 21, 2639–2649. [Google Scholar] [CrossRef]
- Fageria, N.K.; Moreira, A. Chapter Four—The Role of Mineral Nutrition on Root Growth of Crop Plants. In Advances in Agronomy; Sparks, D.L., Ed.; Academic Press: London, UK, 2011; Volume 110, pp. 251–331. [Google Scholar]
- Qiu, S.J.; Gao, H.J.; Zhu, P.; Hou, Y.P.; Zhao, S.C.; Rong, X.M.; Zhang, Y.P.; He, P.; Christie, P.; Zhou, W. Changes in soil carbon and nitrogen pools in a Mollisol after long-term fallow or application of chemical fertilizers, straw or manures. Soil Tillage Res. 2016, 163, 255–265. [Google Scholar] [CrossRef]
- Rutkowska, B.; Szulc, W.; Sosulski, T.; Stepien, W. Soil micronutrient availability to crops affected by long-term inorganic and organic fertilizer applications. Plant Soil Environ. 2014, 60, 198–203. [Google Scholar] [CrossRef]
- Dhaliwal, S.S.; Naresh, R.K.; Mandal, A.; Singh, R.; Dhaliwal, M.K. Dynamics and transformations of micronutrients in agricultural soils as influenced by organic matter build-up: A review. Environ. Sustain. Indic. 2019, 1–2, 100007. [Google Scholar] [CrossRef]
- Masunaga, T.; Marques Fong, J.D. Strategies for increasing micronutrient availability in soil for plant uptake. In Plant Micronutrient Use Efficiency; Hossain, M.A., Kamiya, T., Burritt, D.J., Phan Tran, L.-S., Fujiwara, T., Eds.; Academic Press: London, UK, 2018; pp. 195–208. [Google Scholar]
- Lupwayi, N.Z.; Girma, M.; Haque, I. Plant nutrient contents of cattle manures from small-scale farms and experimental stations in the Ethiopian highlands. Agr. Ecosyst. Environ. 2000, 78, 57–63. [Google Scholar] [CrossRef]
- Wang, J.; Zhu, B.; Zhang, J.B.; Muller, C.; Cai, Z.C. Mechanisms of soil N dynamics following long-term application of organic fertilizers to subtropical rain-fed purple soil. Soil Biol. Biochem. 2015, 91, 222–231. [Google Scholar] [CrossRef]
- Novelli, L.E.; Hass, W.L.; Benintende, S.M.; Caviglia, O.P. Microbial activity effect on aggregate stability after residue addition in a Mollisol and a Vertisol in the Pampas, Argentina. Geoderma Reg. 2020, 23, e00346. [Google Scholar] [CrossRef]

Publisher’s Note: MDPI stays neutral with regard to jurisdictional claims in published maps and institutional affiliations. |
© 2022 by the authors. Licensee MDPI, Basel, Switzerland. This article is an open access article distributed under the terms and conditions of the Creative Commons Attribution (CC BY) license (https://creativecommons.org/licenses/by/4.0/).