Article

Genetic Association between Blast Resistance and Yield Traits in Rice Detected Using a High-Density Bin Map

1
State Key Laboratory of Rice Biology, China National Rice Research Institute, Hangzhou 310006, China
2
Rice Research Institute, Fujian Academy of Agricultural Sciences, Fuzhou 350018, China
*
Author to whom correspondence should be addressed.
These authors contributed equally to this work.
Agronomy 2022, 12(5), 1173; https://doi.org/10.3390/agronomy12051173
Submission received: 12 April 2022 / Revised: 6 May 2022 / Accepted: 11 May 2022 / Published: 12 May 2022
(This article belongs to the Special Issue In Memory of Professor Longping Yuan, the Father of Hybrid Rice)

Abstract

:
Avoiding linkage drag of the resistance genes will facilitate the use of gene resources for rice breeding. This study was conducted to confirm the avoidance of linkage drag due to Pi26 and Pi25 blast resistance genes, and to analyze the association of Pi26, Pi25, Pib and Pita with quantitative trait loci (QTL) for yield traits. A recombinant inbred line population was derived from an indica rice cross Dan 71/Zhonghui 161. A linkage map consisting of 1219 bin markers, 22 simple sequence repeats and five gene markers was constructed. A total of 75 QTL were identified, including 2 for leaf blast resistance and 73 for eight yield traits. The two QTL for blast resistance were closely linked and located in the Pi26 and Pi25 regions, explaining 69.06 and 12.73% of the phenotypic variance, respectively. In a region covering Pi26 and Pi25, QTL were detected for grain yield and its key components. The alleles for enhancing blast resistance and grain yield were all from Dan 71. Not only was the linkage drag due to Pi26 and Pi25 avoided, but the results also indicate that these resistance genes may be used for simultaneously enhancing blast resistance and grain yield in rice. In the Pib and Pita regions, QTL was not detected for blast resistance, but was for yield traits. In each region, the allele for improving trait performance was derived from the parent carrying the resistance allele. In addition, four QTL clusters for grain weight and size, qGL4/qGW4.1, qGL11.2/qRLW11, qTGW11/qGW11 and qGL12/qGW12/qRLW12, were shown to be promising candidates for map-based cloning.

1. Introduction

In crop production, preventing major losses due to disease infection is always an important task. Rice blast caused by the fungus pathogen Magnaporthe oryzae is one of the most serious threats destroying rice yield [1]. This fungus infects a plant at almost all growth stages and reduces rice yield by 10–35% [2]. It is generally considered that introducing a rice blast resistance gene into elite varieties is the most economical and effective approach.
To date, approximately 100 blast resistance genes/alleles have been identified, of which 25 genes have been cloned [3]. Many of them are distributed in clusters. Three genes, Pi37 [4], Pi64 [5] and Pish/Pi35 [6], were localized in a 16.3 kb region on chromosome 1. Six genes, Pigm [7], Pi9 [8], Pi50 [9], Piz-t/Piz/Pi2 [10], Pid4 [11] and Pid3/Pi25 [12,13], were localized in a 2.6 Mb region on chromosome 6. Three genes, Pita [14], Pi57 [15] and Ptr [16], were localized in a 0.2 Mb region on chromosome 12. Pyramiding multiple resistance genes through marker-assisted selection have increased the blast resistance of many rice varieties. For example, introducing Pi9 or Piz-t and Pi54 into the genetic background of a japonica rice variety has resulted in enhanced resistance against leaf and panicle blasts [17]. With the rapid development of biotechnology, especially the application of genome editing in rice, recessive blast resistance genes have also begun to be applied in rice breeding. The knockout of the susceptible allele Pi21 using CRISPR/Cas9 technology can improve the resistance against M. oryzae [18].
However, the introgression of resistance genes is often associated with negative effects on other agronomically important traits. This phenomenon, usually termed as linkage drag or genetic drag, has been frequently observed for blast resistance genes. Wu et al. [19] found that the introgression of the Pi2 resistance gene into the indica rice variety Yangdao 6 may have negative effects on the total spikelets per plant and yield per plant. Xiao et al. reported that a higher chalkiness rate was associated with the introduction of the Piz-t resistance gene into the japonica rice variety 07GY31 [17]. Fukuoka et al. [20] found that the introgression of the pi21 resistance gene into rice cultivar Mineasahi had negative effects on grain quality. Avoiding linkage drag would facilitate the utilization of blast resistance genes.
In previous studies, a gene cluster containing two blast resistance genes, Pi26 and Pi25, and quantitative trait loci for grain number and spikelet fertility in rice, were mapped on the short arm of chromosome 6, in which the resistance alleles and alleles for reducing grain number and spikelet fertility were all derived from an indica semidwarf cultivar, Gumei 2 (GM2) [21,22]. A subsequent study showed that the linkage drag may be avoided when the genotype of qHD7, a major QTL for heading date on the short arm of chromosome 7, was fixed to the GM2 allele [23]. The GM2 allele of qHD7 delayed heading and increased the number of spikelets per panicle (NSP), number of grains per panicle (NGP) and grain yield (GY) [24]. We later found that this allele corresponds to a functional allele of Ghd7 reported by Xue et al. [25]. The primary objective of this study is to confirm the avoidance of linkage drag in the Pi26Pi25 region with the presence of a functional allele at Ghd7. Two rice cultivars carrying functional Ghd7 alleles and showing differences for Pi26, Pi25, Pib and Pita were crossed to construct a recombinant inbred line (RIL) population. QTL mapping for leaf blast resistance and eight yield traits were performed using a high-density bin map. The Pi26 and Pi25 resistance genes showed not only no linkage drag on yield traits, but also a favorable association with QTL for yield traits detected in this region. In addition, a favorable association between resistance alleles and QTL effects on yield traits was found for the other two blast resistance genes.

2. Materials and Methods

2.1. Rice Material

An RIL population consisting of 256 lines was derived from an indica rice cross between two restorer lines of three-line hybrid rice, Dan 71 (D71) and Zhonghui 161 (ZH161). It was developed by the single seed descent method from 256 randomly selected F2 plants until the F7 generation. Both parents carried a Ghd7 allele for strong function, but they had contrasting genotypes for four blast resistance genes, including Pib on chromosome 2, Pi26 and Pi25 on chromosome 6, and Pita on chromosome 12. The maternal line D71 carried a susceptible allele at Pib, but resistance alleles at the other three loci. The paternal line ZH161 carried a resistance allele at Pib, but susceptible alleles at the other three loci. The resistance alleles Pi26 and Pi25 were derived from GM2, of which Pi25 was cloned [13] and Pi26 was located in the Pi2Pi9 region [21].

2.2. Map Construction

The total DNAs of the two parents and RILs were extracted from a single plant of each line following the method of Lu and Zheng [26]. The DNA library construction, sequencing, variant detection and annotation, bin marker development and bin-map construction were conducted by Guangzhou Genedenovo Biotechnology Co., Ltd. (Guangzhou, China). In addition, 22 SSR markers randomly located on 12 chromosomes, three markers for heading date genes Hd1, Hd2 and DTH8 [27], and two markers for rice blast resistance genes Pi9 and Pi25 [28,29] were used for verification. The information of the primers is showed in Table S1.

2.3. Phenotype Evaluation

Nine traits were measured, including leaf blast resistance (LBR), GY, number of panicles per plant (NP), NSP, NGP, 1000-grain weight (TGW), grain length (GL), grain width (GW), and ratio of grain length to grain width (RLW). The LBR was measured in the greenhouse for one year, and the other eight traits were measured in the paddy field for two years.
For LBR, evaluation was performed by the Zhejiang Academy of Agricultural Sciences in 2020 using a system applied in the provincial and national trials for testing the adaptability of new rice varieties. The two parents and the RIL population were inoculated with a mixture of blast spore suspension from 14 isolates of the fungus M. oryzae. The isolates and their proportions were determined based on blast disease collected from the rice field, which was modified according to the change of the blast epidemic from year to year. The two parents were also tested using each of the 14 isolates. The RILs were grown in a greenhouse with 60 cm × 24 cm × 5 cm plastic trays following a randomized complete block design with three replications. In each replication, about 15 seeds per line were sown in trays. Three-week-old seedlings with 3–4 leaves were placed in an inoculation chamber and inoculated by spraying with a mixture of blast spore suspension (~2 × 10⁵ spores per milliliter). The inoculated seedlings were incubated in the dark at 27 °C with 95% relative humidity for 24 h, and then transferred to a greenhouse where they were grown under a 12 h light/12 h dark cycle and 95% relative humidity to allow disease development. At seven days after inoculation, leaf blast resistance was scored based on the 0–9 scale (Table S2) following the national standard NY/T2646-2014. Ten seedlings per line were scored, and the three highest score values were averaged for data analysis. The lower the score, the higher the resistance.
For the eight yield traits, the two parents and the RIL population were grown in the paddy field at the China National Rice Research Institute, Hangzhou, China. They were tested in 2019 and 2020 with sowing on 17 May and 19 May and transplanting on 10 June and 11 June, respectively. The experiment followed a randomized complete block design with two replications. In each replication, 10 plants per line were grown in one row, with 16.7 cm between the plants and 26.7 cm between the rows. The field management followed local agricultural practice. The climatic data for the growing season are presented in Table S3. At maturity, five of the middle eight plants of each row were harvested in bulk and sun-dried. The eight yield traits were measured as described below and the mean values over two replications were used for data analysis. For each line, the number of panicles were counted manually. The panicles were hand-threshed and measured for the number of filled grains and unfilled grains. All of the filled grains were weighed.
  • NP = number of panicles/5;
  • NSP = (total number of filled grains + total number of unfilled grains)/number of panicles;
  • NGP = total number of filled grains/number of panicles;
  • GY = total weight of filled grains/5.
Two samples of 300 fully filled grains were randomly selected for the measurement of TGW, GL and GW using an automatic seed counting and analyzing instrument (Model SC-G, Wanshen Ltd., Hangzhou, China).
  • RLW = grain length/grain width.

2.4. Data Analysis

Basic descriptive statistics, including the minimum and maximum trait values, mean value, standard deviation, coefficient of variation, skewness and kurtosis were calculated using Microsoft Office Excel. The distributions of the nine traits were tested for normality using the Anderson–Darling test (p < 0.05). The differences of the eight yield traits over the two years were tested using two-way ANOVA analysis (p < 0.05).
Linkage map construction and QTL detection were performed using the QTL IciMapping 4.1 [30]. The linkage map was generated using the functionality of MAP (linkage map construction in biparental populations). For LBR, QTL analysis was performed with the inclusive composite interval mapping using the functionality of BIP (QTL mapping in the biparental populations). For the eight yield traits, the QTL and genotype-by-environment (GE) interactions were determined using the functionality of MET (QTL by environment interaction for multi-environment traits), taking different years as different environments. LOD thresholds were calculated with 1000 permutation tests (p < 0.05) and used to declare a putative QTL. The QTL were designated following the rule proposed by McCouch and CGSNL [31].

3. Results

3.1. Phenotypic Performance of Leaf Blast Resistance and Yield Traits

The descriptive statistics of the nine traits tested are presented in Table 1. For LBR, the female parent D71 is highly resistant, while the male parent ZH161 is susceptible. The scales evaluated using the mixture were 1.0 for D71 and 7.3 for ZH161, which are comparable to the results of single-isolate inoculation (Table S4). Among the eight yield traits, NP showed a non-significant difference between the two parents, whereas the other seven traits were significantly higher (p < 0.05) in D71 than in ZH161 (Table 2). In most cases, mean value of the RIL population was located between the parental values. Exceptions were observed for GY, NP and NGP in 2020, in which the population means were always higher than the high-parental values. The frequency distributions of the eight yield traits (data averaged over two years) and LBR are presented in Figure 1. The Anderson–Darling normality test indicated that NP (p = 0.163), NSP (p = 0.591), NGP (p = 0.105) and GW (p = 0.166) were normally distributed, and the other five traits did not fit a normal distribution (p < 0.05). The LBR had a bimodal distribution, which suggested the presence of a major-QTL segregation (Figure 1).
Pearson’s correlation analysis was performed between the two years for the eight yield traits. The highest correlation coefficient was observed for GL (0.973), followed from highest to lowest by RLW (0.965), TGW (0.925), GW (0.867), NSP (0.608), NGP (0.515), GY (0.282) and NP (0.278). The results of the two-way ANOVA analysis of the eight traits are presented in Table 2. For the parents, all eight yield traits showed significant differences in the different years except NSP, NGP and RLW. Significant line × year interactions were tested in NSP, GW and RLW. For the RIL, all eight traits showed significant differences in the different years and lines (p < 0.0001). In addition, except for GL, all of these traits showed significant line × year interaction. These results showed that the variation of these traits was influenced by different environments.
Pearson’s correlation analysis was also performed between the different traits using the data of LBR in 2020 and two-year means of the yield traits. The results are presented in Table 3. LBR showed significant correlations with four yield traits, among which the correlations with GY, TGW and GW were negative, while that with RLW was positive. For GY, as expected, it showed highly significant (p < 0.001) positive correlations with all yield component traits except RLW.

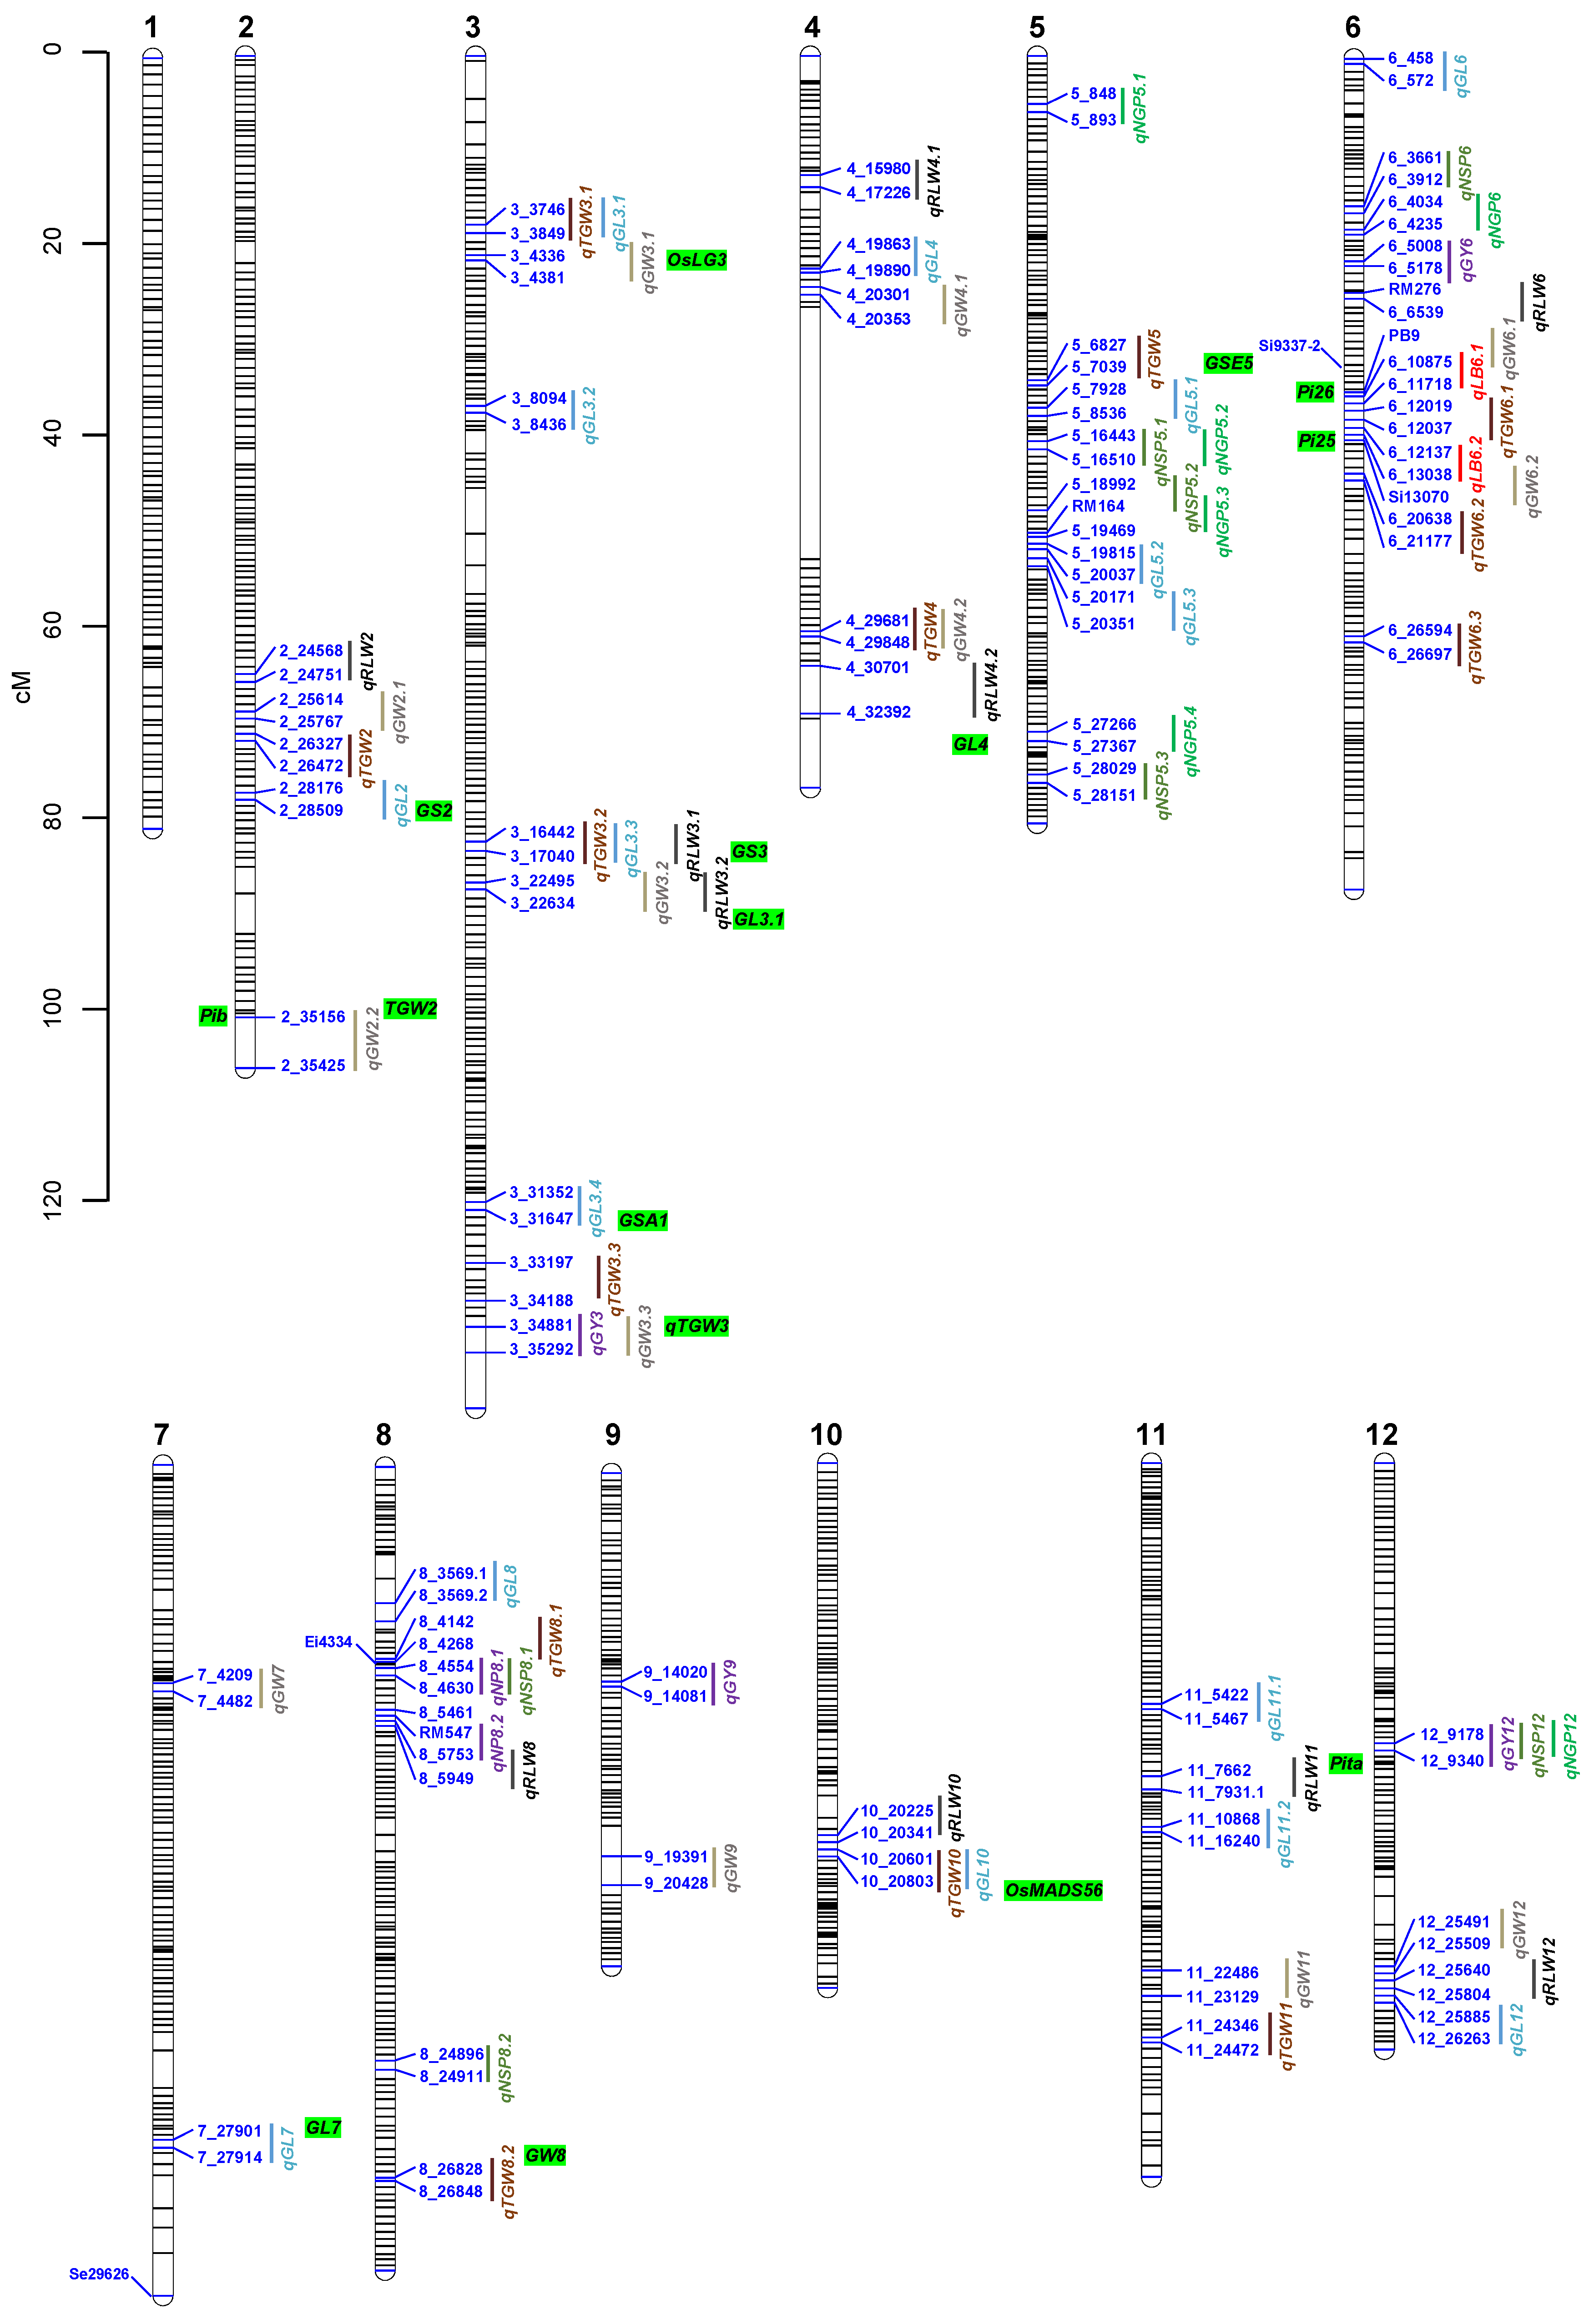
3.2. QTL Detected in D71/ZH161 RIL Population

A high-density linkage map consisting of 1246 genetic markers was generated. It spanned 1798.1 cM with an average interval of 1.5 cM between adjacent markers. The information of the linkage map is shown in Table S5. Following this, QTL analysis was performed using this high-density map. The LOD thresholds of the QTL for the nine traits are shown in Figure S1.
For LBR, two closely linked QTL were detected on the short arm of chromosome 6, of which qLBR6.1 was located in the Pi26/Pi2–Pi9 region and qLBR6.2 in the Pi25/Pid3 region. At both regions, the alleles for decreasing infection score, i.e., for increasing blast resistance, were from the maternal parent D71. The qLBR6.1 had a major effect with an additive effect of 2.13 and R2 of 69.06%. The qLBR6.2 had a smaller additive effect of 0.91 and R2 of 12.73% (Table 4). No QTL for LBR was detected in other regions, including the two regions in which contrasting Pib and Pita alleles were carried by the two parents.
For the other eight yield traits, a total of 73 QTL distributed on 11 chromosomes were identified, including 4 for GY, 2 for NP, 7 for NSP, 8 for NGP, 13 for TGW, 16 for GL, 13 for GW and 10 for RLW (Table 5, Figure 2). The proportions of phenotypic variance explained (R2) by individual QTL were in the range of 4.31–6.63% for GY, 7.47–7.78% for NP, 2.28–27.96% for NSP, 2.79–18.61% for NGP, 0.90–43.64% for TGW, 0.47–60.43% for GL, 1.32–21.36% for GW, and 1.06–61.83% for RLW.
Four QTL were detected for GY, of which none showed significant GE interaction. The D71 allele increased GY by 1.18, 1.34 and 1.08 g at qGY6, qGY9 and qGY12, respectively, and decreased GY by 1.22 g at qGY3.
Two QTL, qNP8.1 and qNP8.2, were detected for NP, of which qNP8.2 showed significant GE interaction. The ZH161 allele increased NP by 0.27 and 0.26 at qNP8.1 and qNP8.2, respectively.
Seven QTL were detected for NSP, of which two (qNSP5.2 and qNSP8.1) showed significant GE interaction. The enhancing alleles of the seven QTL were all derived from D71. The qNSP8.1 had R2 of 27.96% that was much higher than the values of other QTL detected for NSP. The D71 allele increased NSP by 16.30. Two other QTL had relatively large effects, of which the R2 values were 9.03 and 8.81% for qNSP5.3 and qNSP8.2, respectively. In addition, the R2 values of the remaining four QTL were all lower than 3.5%.
Eight QTL were detected for NGP, of which one (qNGP8.1) showed significant GE interaction. The enhancing alleles of the eight QTL were all derived from D71 except qNGP5.1. Seven QTL, including qNGP5.2, qNGP5.3 and qNGP5.4 on chromosome 5, qNGP6 on chromosome 6, qNGP8.1 and qNGP8.2 on chromosome 8, and qNGP12 on chromosome 12, had similar genomic location with the QTL detected for NSP. The qNGP8.1 had the largest R2 of 18.61% with the D71 allele increasing NGP by 12.09.
Thirteen QTL were detected for TGW, of which four (qTGW3.2, qTGW6.2, qTGW8.1 and qTGW10) showed significant GE interaction. The qTGW3.2 had an R2 of 43.64%, which was much higher than the values of other QTL detected for TGW. The D71 allele increased TGW by 1.26 g. Two other QTL had relatively large effects, of which the R2 values were 6.91 and 13.50% for qTGW2 and qTGW3.1, respectively. In addition, the R2 values of the remaining eleven QTL were all lower than 3.0%.
Sixteen QTL were detected for GL, of which three (qGL3.3, qGL5.2 and qGL5.3) showed significant GE interaction. The regions of qGL3.1, qGL3.3 and qGL3.4 were almost the same as that of qTGW3.1, qTGW3.2 and qTGW3.3. qGL3.3 showed a major effect with an R2 of 60.43%, which was higher than the values of other QTL for GL. The D71 allele increased GL by 0.435 mm. Another QTL, qGL5.3, had a relatively large effect with the R2 of 6.28%. The ZH161 allele increased GL by 0.139 mm. In addition, the R2 values of the remaining 14 QTL were all lower than 4.0%.
Thirteen QTL were detected for GW, of which six showed significant GE interaction. qGW2.1 had an R2 of 21.36%, which was much higher than the values of the other QTL detected for GW. The ZH161 allele increased GW by 0.033 mm. Three other QTL had relatively large effects, of which the R2 values were 6.29, 5.59 and 6.07% for qGW3.2, qGW4.2 and qGW12, respectively. The ZH161 allele increased GW by 0.018 mm at qGW3.2 and qGW12, and decreased GW by 0.017 mm at qGW4.2. In addition, the R2 values of the remaining 10 QTL were all lower than 4.0%.
Ten QTL were detected for RLW, of which two (qRLW3.1 and qRLW3.2) showed significant GE interaction. qRLW3.1 showed a major effect with the R2 of 61.83%, which was higher than the other QTL for the yield traits. The D71 allele increased RLW by 0.194. In addition, the R2 values of the remaining nine QTL for RLW were all lower than 4.5%.

3.3. Phenotypic Performance of LBR and GY in Different Combinations of Four Rice Blast Resistance Genes

According to the genotypes of the regions containing the Pi26Pi25 gene cluster, Pib and Pita, the RIL population was divided into eight groups (Table 6). Group 1 contained only the Pi26Pi25 gene cluster. Group 2 to 4 contained not only the Pi26Pi25 gene cluster, but also contained Pib and/or Pita. Group 5 contained none of these four resistance genes. Group 6 to 8 contained Pib and/or Pita. In addition, all eight groups contained the functional Ghd7 allele.
For GY, the parents (p = 0.0412) and the RIL population (p < 0.0001) both showed significant differences between the two years (Table 2). The GY of high-value parent D71 in 2019 was significantly higher than that in 2020. For this reason, only seven lines showed higher GY than D71 in 2019, including one in Group 3 and two each in Group 1, 4 and 7. In 2020, 155 lines showed higher GY than D71, including 20, 16, 26, 22, 12, 15, 29 and 15 in Group 1 to Group 8.
The results of the phenotypic differences among the eight groups, tested using Duncan’s multiple range test, are shown in Table 6. For LBR, compared with groups 5 to 8, groups 1 to 4 containing the Pi26Pi25 gene cluster showed significantly stronger resistance. In addition, no significant difference was found among groups 1 to 4 or among groups 5 to 8. These results further indicated that the Pi26Pi25 gene cluster played a major role in the resistance to leaf blast in this study. For GY, no significant difference was found among the eight groups in 2019 and 2020, except between Group 3 and Group 5. Compared with Group 5, Group 3 containing the Pi26Pi25 gene cluster and Pita showed stronger resistance to leaf blast and a higher grain yield. These results suggested that the linkage drag in the Pi26Pi25 region may be avoided with the presence of the functional Ghd7 allele.

4. Discussion

High yield and high resistance are two crucial goals of crop breeding, but immunization is often accompanied by yield reduction. This problem has been reported in many crops, such as rice, maize, and wheat [32,33,34]. Therefore, how to balance the resistance and yield has been of deep concern, although the molecular mechanisms are largely unknown. In rice, several studies have recently described new approaches. The Pigm locus encodes a pair of nucleotide-binding leucine-rich repeat receptors (NBS-LRR). The PigmR improves rice blast resistance, and the PigmS suppresses resistance, but increases seed production to counter the yield cost induced by PigmR [7]. Two other genes, bsr-d1 and bsr-k1, possess enhanced blast resistance with no observable penalty in yield through the inhibition of H2O2 degradation [35,36]. The miRNAs are also involved in fine-tuning the balance of yield and blast disease resistance via different modules, including miR1432 and miR1873 [37,38]. In this study, we confirmed that the linkage drag in the Pi26Pi25 region may be avoided with the presence of the functional Ghd7 allele, providing a new approach to balance yield and resistance in rice.
The genetic drag on chromosome 6 was also found by Xiao et al. [39]. They re-sequenced 200 japonica rice varieties grown in central China and discovered that Piz was the most significant resistance locus. However, in most cases, when Piz-t/Pigm was present as a superior allele, the main alleles in the yield-related genes OsSPX1 and TGW6 were typically inferior. In the present study, a mixture of 14 isolates of the fungus M. oryzae was used to test the leaf blast resistance of the RIL population. These isolates were selected from the local fungus M. oryzae, and were dominant isolates with strong pathogenicity in the rice field. It was reported that the mixed isolates will have some competition, and this might affect the foliar blast response of the host [40]. Our results showed the consistency in diseased scales evaluated using the mixture of 14 isolates and single isolate (Table 1 and Table S4). Although a single trial for resistance with mixed isolates has some limitations compared to multiple trials with single-spore isolates, the QTL analysis still provided strong proof for the leading role of major blast resistance genes. The cluster of qLBR6.1 and qLBR6.2 corresponding to the Pi26 and Pi25 regions explained the high contribution of 81.8% (Table 4). Among the four resistance genes segregated in the D71/ZH161 RIL population, it is evident that Pi26 and Pi25 play a major role in preventing the damage caused by the predominant blast isolate. In the same population, QTL were detected for the other yield traits in a larger region on the short arm of chromosome 6 that covered Pi26 and Pi25 (Figure 2). It is worth noting that the resistance alleles from D71 increased grain yield and all of its key components, grain weight, grain number and panicle number (Table 5). Not only was the linkage drag avoided, but these results also indicate that the Pi26Pi25 resistance genes derived from GM2 may be used for simultaneously enhancing the blast resistance and grain productivity of rice varieties. When the population was classified into eight groups based on the genotype of Pi26Pi25, Pib and Pita, none of the four groups carrying the susceptible Pi26Pi25 alleles had yield advantage over any of the four groups carrying the resistant Pi26Pi25 alleles; meanwhile, a group carrying the resistant allele (Group 3) had significantly higher yield than the group carrying the susceptible allele (Group 5) (Table 6). Avoidance of the linkage drag of Pi26Pi25 was shown as no unfavorable effect in all cases and favorable effects in some cases.
The D71/ZH161 RIL population was also segregated for other two blast resistance genes, Pib on chromosome 2 and Pita on chromosome 12, but no QTL for blast resistance was detected in these regions. There may be two reasons for this result. (1) The genetic effects of Pi26 and Pi25 were so strong that the genetic effects of Pib and Pita were masked. (2) The Pib and Pita had no resistance to the mixed isolates of M. oryzae used in this study. Nevertheless, analysis of their association with the genetic control of the yield traits does not necessary rely on the detection of QTL for blast resistance. This can be done by comparing the allelic directions of a blast resistance gene with QTL for yield traits detected in the same region. In the Pib region, a QTL for grain width, qGW2.2, was detected (Figure 2). The enhancing allele was derived from ZH161 carrying the resistance Pib allele (Table 5). In a region close to Pita, three QTL, qGY12, qNSP12 and qNGP12, were detected. The enhancing alleles were all derived from D71 carrying the resistance Pita allele (Table 5). Thus, a favorable association was found in both regions, showing the potential of utilizing Pib and Pita for simultaneously enhancing the blast resistance and grain yield in rice.
Identifying and using genes conferring resistance against blast has now become an effective approach for breeding rice varieties with broad-spectrum and durable resistance. In this study, Pi26, Pi25, Pib and Pita all encode NBS-LRR proteins, which were encoded by most of the known rice blast resistance genes [3]. In addition to the NBS-LRR protein, there are five other proteins, including a proline-rich metal binding protein encoded by pi21 [20], a B lectin receptor kinase encoded by Pid2 [41], a four Armadillo repeats protein encoded by Ptr [16], a TPR-domain RNA-binding protein encoded by bsr-k1 [35] and a C2H2-type transcription factor encoded by bsr-d1 [36]. Generally, resistance often follows the gene-for-gene model, i.e., the plant resistance gene products recognize avirulence (Avr) proteins. Among these four genes, two corresponding Avr genes, AVR-Pita and AVR-Pib [42], have been cloned. The molecular interaction for Pita and AVR-Pita is clear [43], but for Pib and AVR-Pib needs further study. In this study, the genetic association between these four genes and yield traits was analyzed, which provided a theoretical basis for the application of these genes in rice breeding.
The efficiency of QTL mapping depends largely on population size and marker density. The bin map is a high-density genetic map based on sequencing [44,45]. It has been used for the QTL mapping of yield traits in many crops, such as rice and soybean [46,47]. Here, 73 QTL for eight yield traits were detected. Many of these QTL were close to or contained cloned genes for the same trait. Taking TGW, GL and GW as an example, there were 12 QTL regions of this kind. Two regions were on chromosome 2. The qTGW2/qGL2/qGW2.1 region flanked by markers 2_25614 and 2_28509 was close to GS2/GL2 [48,49]. The qGW2.2 region flanked by 2_35156 and 2_35425 was close to TGW2 [50]. Five regions were on chromosome 3. The qTGW3.1/qGL3.1/qGW3.1 region flanked by 3_3746 and 3_4381 contained OsLG3 [51]. The qTGW3.2/qGL3.3 region flanked by 3_16442 and 3_17040 contained GS3 [52]. The qGW3.2 region flanked by 3_22495 and 3_22634 was close to GL3.1/qGL3 [53,54]. The qGL3.4 region flanked by 3_31352 and 3_31647 was close to GSA1 [55]. The qTGW3.3/qGW3.3 region flanked by 3_33197 and 3_35292 was close to qTGW3 [56]. The remaining five regions, qTGW4/qGW4.2 flanked by 4_29681 to 4_29848, qTGW5/qGL5.1 flanked by 5_6827 to 5_8536, qGL7 flanked by 7_27901 to 7_27914, qTGW8.2 flanked by 8_26828 to 8_26848 and qTGW10/qGL10 flanked by 10_20601 to 20803, coincided with GL4 [57], GSE5 [58], GL7 [59], GW8 [60] and OsMADS56 [61], respectively. These results indicated that the bin map showed more accurate physical positions compared with the traditional genetic linkage map, which could make the genetic analysis more precise.
NP, NGP and TGW are the three most important determining factors of rice grain yield, which is easily affected by the environment. In this study, the two parents and the RIL population both showed significant differences on GY and its components between 2019 and 2020 (Table 2). The number of lines whose grain yield was higher than that of the high-value parent varies greatly in different years. In addition, heading date variation also plays an important role in the grain yield and yield components. For example, the functional Ghd7 and DTH8 alleles delayed heading and significantly increased NSP under long-day conditions [25,62]. Here, the qNSP8.1/qNP8.1/qTGW8.1 region flanked by 8_4142 and 8_4630 contained DTH8. The D71 allele of DTH8 significantly increased NSP and TGW, but decreased NP under long-day conditions.
TGW is closely related with GL, GW and RLW, which are key traits for grain appearance quality. In this study, four QTL clusters for grain weight and size were away from the cloned genes. They could be used as candidates for map-based cloning. Two of them were located on chromosome 11, including qGL11.2 and qRLW11 flanked by 11_7662 to 11_16240 and qTGW11 and qGW11 flanked by 11_22486 to 11_24472. The remaining two were located on chromosomes 4 and 12, respectively, with one containing two QTL, qGL4 and qGW4.1, flanked by 4_19863 to 4_20353, and the other containing three QTL, qGL12, qGW12 and qRLW12, which were flanked by markers 12_25491 and 12_26263.

5. Conclusions

QTL analysis for blast resistance and yield traits in rice using a high-density bin map indicates that the linkage drag of Pi26 and Pi25 resistance genes can be effectively avoided in the presence of the functional Ghd7 allele. Moreover, a favorable association of blast resistance genes with the performance of yield traits may be achieved by the careful selection of the background genotype. In addition, this study provided four candidate regions controlling grain weight and size for map-based cloning.

Supplementary Materials

The following supporting information can be downloaded at: https://www.mdpi.com/article/10.3390/agronomy12051173/s1. Table S1: The primers used in this study. Table S2: The 0–9 scale for determining leaf blast resistance in rice. Table S3: Climate data collected from May 1 to September 30 in Hangzhou for 2019 and 2020. Table S4. Diseased scales of the two parents evaluated using each of the 14 isolates. Table S5: The information of the high-density linkage map. Figure S1: The LOD thresholds of the QTL for the LBR and the eight yield traits calculated with 1000 permutation tests (p < 0.05).

Author Contributions

Conceptualization, J.-Y.Z., Y.-J.Z. and T.-X.H.; methodology, J.-Y.Z., T.-X.H. and Y.-Y.F.; investigation, Y.-Y.F., L.K., Z.-H.Z. and D.-R.H.; data curation, J.-Y.Z. and Y.-J.Z.; writing—original draft preparation, L.K. and Y.-J.Z.; writing—review and editing, J.-Y.Z. and Y.-J.Z. All authors have read and agreed to the published version of the manuscript.

Funding

This research was funded by the Key R&D Program of Zhejiang Province (2021C02063-6), Science and Technology Plan Project of Fujian Province (2021R1023009), Central Public-Interest Scientific Institution Basal Research Fund (CPSIBRF-CNRRI-202112) and the Chinese Scholarship Council (CSC No. 2019GBJ010836).

Institutional Review Board Statement

Not applicable.

Informed Consent Statement

Not applicable.

Data Availability Statement

Not applicable.

Conflicts of Interest

The authors declare no conflict of interest.

References

  1. Asibi, A.E.; Chai, Q.; Coulter, J.A. Rice blast: A disease with implications for global food security. Agronomy 2019, 9, 451. [Google Scholar] [CrossRef] [Green Version]
  2. Skamnioti, P.; Gurr, S.J. Against the grain: Safeguarding rice from rice blast disease. Trends Biotechnol. 2009, 27, 141–150. [Google Scholar] [CrossRef] [PubMed] [Green Version]
  3. Li, W.; Chern, M.; Yin, J.; Wang, J.; Chen, X. Recent advances in broad-spectrum resistance to the rice blast disease. Curr. Opin. Plant Biol. 2019, 50, 114–120. [Google Scholar] [CrossRef] [PubMed]
  4. Lin, F.; Chen, S.; Que, Z.; Wang, L.; Liu, X.; Pan, Q. The blast resistance gene Pi37 encodes a nucleotide binding site-leucine-rich repeat protein and is a member of a resistance gene cluster on rice chromosome 1. Genetics 2007, 177, 1871–1880. [Google Scholar] [CrossRef] [PubMed] [Green Version]
  5. Ma, J.; Lei, C.; Xu, X.; Hao, K.; Wang, J.; Cheng, Z.; Ma, X.; Ma, J.; Zhou, K.; Zhang, X.; et al. Pi64, encoding a novel CC-NBS-LRR protein, confers resistance to leaf and neck blast in rice. Mol. Plant Microbe Interact. 2015, 28, 558–568. [Google Scholar] [CrossRef] [Green Version]
  6. Fukuoka, S.; Yamamoto, S.-L.; Mizobuchi, R.; Yamanouchi, U.; Ono, K.; Kiatazawa, N.; Yasuda, N.; Fujita, Y.; Nguyen, T.T.T.; Koizumi, S.; et al. Multiple functional polymorphisms in a single disease resistance gene in rice enhance durable resistance to blast. Sci. Rep. 2015, 4, 4550. [Google Scholar] [CrossRef]
  7. Deng, Y.; Zhai, K.; Xie, Z.; Yang, D.; Zhu, X.; Liu, J.; Wang, X.; Qin, P.; Yang, Y.; Zhang, G.; et al. Epigenetic regulatiuon of antagonistic receptors confers rice blast resistance with yield balance. Science 2017, 355, 962–965. [Google Scholar] [CrossRef]
  8. Qu, S.; Liu, G.; Zhou, B.; Bellizzi, M.; Zeng, L.; Dai, L.; Han, B.; Wang, G.-L. The broad-spectrum blast resistance gene Pi9 encodes a nucleotide-binding site-leucine-rich repeat protein and is a member of a multigene family in rice. Genetics 2006, 172, 1901–1914. [Google Scholar] [CrossRef] [Green Version]
  9. Su, J.; Wang, W.; Han, J.; Chen, S.; Wang, C.; Zeng, L.; Feng, A.; Yang, J.; Zhou, B.; Zhu, X. Functional divergence of duplicated genes results in a novel blast resistance gene Pi50 at the Pi2/9 locus. Theor. Appl. Genet. 2015, 128, 2213–2225. [Google Scholar] [CrossRef]
  10. Zhou, B.; Qu, S.; Liu, G.; Dolan, M.; Sakai, H.; Lu, G.; Bellizzi, M.; Wang, G. The eight amino-acid differences within three leucine-rich repeats between Pi2 and Piz-t resistance proteins determine the resistance specificity to Magnaporthe grisea. Mol. Plant Microbe Interact. 2006, 19, 1216–1228. [Google Scholar] [CrossRef] [Green Version]
  11. Chen, Z.; Zhao, W.; Zhu, X.; Zou, C.; Yin, J.; Chern, M.; Zhou, X.; Ying, H.; Jiang, X.; Li, Y.; et al. Identification and characterization of rice blast resistance gene Pid4 by a combination of transcriptomic profiling and genome analysis. J. Genet. Genom. 2018, 45, 663–672. [Google Scholar] [CrossRef] [PubMed]
  12. Shang, J.; Tao, Y.; Chen, X.; Zou, Y.; Lei, C.; Wang, J.; Li, X.; Zhao, X.; Zhang, M.; Lu, Z.; et al. Identification of a new rice blast resistance gene, Pid3, by genomewide comparison of paired nucleotide-binding site-leucine-rice repeat genes and their pseudogene alleles between the two sequenced rice genomes. Genetics 2009, 182, 1303–1311. [Google Scholar] [CrossRef] [PubMed] [Green Version]
  13. Chen, J.; Shi, Y.; Liu, W.; Chai, R.; Fu, Y.; Zhuang, J.; Wu, J. A Pid3 allele from rice cultivar Gumei2 confers resistance to Magnaporthe oryzae. J. Genet. Genom. 2011, 38, 209–216. [Google Scholar] [CrossRef] [PubMed]
  14. Bryan, G.T.; Wu, K.-S.; Farrall, L.; Jia, Y.; Hershey, H.P.; McAdams, S.A.; Faulk, K.N.; Donaldson, G.K.; Tarchini, R.; Valent, B. A single amino acid difference distinguishes resistant and susceptible alleles of the rice blast resistance gene Pi-ta. Plant Cell 2000, 12, 2033–2045. [Google Scholar] [CrossRef]
  15. Dong, L.; Liu, S.; Xu, P.; Deng, W.; Li, X.; Tharreau, D.; Li, J.; Zhou, J.; Wang, Q.; Tao, D.; et al. Fine mapping of Pi57(t) conferring broad spectrum resistance against Magnaporthe oryzae in introgression line IL-E1454 derived from Oryza longistaminata. PLoS ONE 2017, 12, e0186201. [Google Scholar] [CrossRef] [Green Version]
  16. Zhao, H.; Wang, X.; Jia, Y.; Minkenberg, B.; Wheatley, M.; Fan, J.; Jia, M.H.; Famoso, A.; Edwards, J.D.; Wamishe, Y.; et al. The rice blast resistance gene Ptr encodes an atypical protein required for broad-spectrum disease resistance. Nat. Commun. 2018, 9, 2039. [Google Scholar] [CrossRef]
  17. Xiao, N.; Wu, Y.; Pan, C.; Yu, L.; Chen, Y.; Liu, G.; Li, Y.; Zhang, X.; Wang, Z.; Dai, Z.; et al. Improving of rice blast resistances in Japonica by pyramiding major R genes. Front. Plant Sci. 2017, 7, 1918. [Google Scholar] [CrossRef] [Green Version]
  18. Tao, H.; Shi, X.; He, F.; Wang, D.; Xiao, N.; Fang, H.; Wang, R.; Zhang, F.; Wang, M.; Li, A.; et al. Engineering broad-spectrum disease-resistant rice by editing multiple susceptibility genes. J. Integr. Plant Biol. 2021, 63, 1639–1648. [Google Scholar] [CrossRef]
  19. Wu, Y.; Xiao, N.; Chen, Y.; Yu, L.; Pan, C.; Li, Y.; Zhang, X.; Huang, N.; Ji, H.; Dai, Z.; et al. Comprehensive evaluation of resistance effects of pyramiding lines with different broad-spectrum resistance genes against Magnaporthe oryzae in rice (Oryza sativa L.). Rice 2019, 12, 11. [Google Scholar] [CrossRef]
  20. Fukuoka, S.; Saka, N.; Koga, H.; Ono, K.; Shimizu, T.; Ebana, K.; Hayashi, N.; Takahashi, A.; Hirochika, H.; Okuno, K.; et al. Loss of function of a proline-containing protein confers durable disease resistance in rice. Science 2009, 325, 998–1001. [Google Scholar] [CrossRef]
  21. Wu, J.L.; Fan, Y.Y.; Li, D.B.; Zheng, K.L.; Leung, H.; Zhuang, J.Y. Genetic control of rice blast resistance in the durably resistant cultivar Gumei 2 against multiple isolates. Theor. Appl. Genet. 2005, 111, 50–56. [Google Scholar] [CrossRef] [PubMed]
  22. Zheng, K.-L.; Zhuang, J.-Y.; Wu, J.-L.; Chai, R.-Y.; Cao, L.-Y.; Leung, H.; Fan, Y.-Y.; Jin, M.-Z.; Rao, Z.-M. Marker-based analysis of genetic drag between blast-resistance and yield-trait genes in rice. In Proceedings of the International Rice Research Conference, Beijing, China, 16–19 September 2002. [Google Scholar]
  23. Liu, W.Q.; Fan, Y.Y.; Chen, J.; Shi, Y.; Wu, J.L. Breakdown or avoidance of genetic drag between blast resistance and spikelet fertility based on genotype selection against heading date in rice. Chin. J. Rice Sci. 2008, 22, 359–364, (In Chinese with English Abstract). [Google Scholar]
  24. Cao, L.Y.; Wu, J.-L.; Fan, Y.-Y.; Cheng, S.-H.; Zhuang, J.-Y. QTL analysis for heading date and yield traits using recombinant inbred lines of indica rice grown in different cropping seasons. Plant Breed. 2010, 6, 676–682. [Google Scholar] [CrossRef]
  25. Xue, W.; Xing, Y.; Weng, X.; Zhao, Y.; Tang, W.; Wang, L.; Zhou, H.; Yu, S.; Xu, C.; Li, X.; et al. Natural variation in Ghd7 is an important regulator of heading date and yield potential in rice. Nat. Genet. 2008, 40, 761–767. [Google Scholar] [CrossRef] [PubMed]
  26. Lu, Y.; Zheng, K.L. A simple method for isolation of rice DNA. Chin. J. Rice Sci. 1992, 6, 47–48. (In Chinese) [Google Scholar]
  27. Zhang, Z.; Zhu, Y.; Wang, S.; Fan, Y.; Zhuang, J. Genetic interaction of Hd1 with Ghd7, DTH8 and Hd2 largely determines eco-geographical adaption of rice varieties in southern China. Rice Sci. 2021, 28, 114–118. [Google Scholar]
  28. Yin, D.-S.; Xia, M.-Y.; Li, J.-B.; Wan, B.-L.; Zha, Z.-P.; Du, X.-S.; Qi, H.-X. Development of STS marker linked to rice blast resistance gene Pi9 in marker-assisted selection breeding. Chin. J. Rice Sci. 2011, 25, 25–30, (In Chinese with English Abstract). [Google Scholar]
  29. Zhu, Y.; Huang, D.; Fan, Y.; Zhuang, J.; Shen, B. Marker-assisted selection for hybrid rice restorer line R153 conferring resistance to blast. China Rice 2021, 27, 95–97, (In Chinese with English Abstract). [Google Scholar]
  30. Meng, L.; Li, H.; Zhang, L.; Wang, J. QTL IciMapping: Integrated software for genetic linkage map construction and quantitative trait locus mapping in biparental populations. Crop. J. 2015, 3, 269–283. [Google Scholar] [CrossRef] [Green Version]
  31. McCouch, S.R. CGSNL (Committee on Gene Symbolization, Nomenclature and Linkage, Rice Genetics Cooperative). Gene nomenclature system for rice. Rice 2008, 1, 72–84. [Google Scholar] [CrossRef] [Green Version]
  32. Peng, M.; Lin, X.; Xiang, X.; Ren, H.; Fan, X.; Chen, K. Characterization and evaluation of transgenic rice pyramided with the Pi genes Pib, Pi25 and Pi54. Rice 2021, 14, 78. [Google Scholar] [CrossRef] [PubMed]
  33. Jimenez-Galindo, J.C.; Ordas, B.; Butron, A.; Samayoa, L.F.; Malvar, R.A. QTL mapping for yield and resistance against Mediterranean corn borer in Maize. Front. Plant Sci. 2017, 8, 698. [Google Scholar] [CrossRef] [PubMed] [Green Version]
  34. Zetzsche, H.; Friedt, W.; Ordon, F. Breeding progress for pathogen resistance is a second major driver for yield increase in German winter wheat at contrasting N levels. Sci. Rep. 2020, 10, 20374. [Google Scholar] [CrossRef] [PubMed]
  35. Zhou, X.; Liao, H.; Chern, M.; Yin, J.; Chen, Y.; Wang, J.; Zhu, X.; Chen, Z.; Yuan, C.; Zhao, W.; et al. Loss of function of a rice TPR-domain RNA-binding protein confers broad-spectrum disease resistance. Proc. Natl. Acad. Sci. USA 2018, 115, 3174–3179. [Google Scholar] [CrossRef] [Green Version]
  36. Li, W.; Zhu, Z.; Chern, M.; Yin, J.; Yang, C.; Ran, L.; Cheng, M.; He, M.; Wang, K.; Wang, J.; et al. A natural allele of a transcription factor in rice confers broad-spectrum blast resistance. Cell 2017, 170, 114–126. [Google Scholar] [CrossRef] [Green Version]
  37. Li, Y.; Zheng, Y.-P.; Zhou, X.-H.; Yang, X.-M.; He, X.-R.; Feng, Q.; Zhu, Y.; Li, G.-B.; Wang, H.; Zhao, J.-H.; et al. Rice miR1432 fine-tune the balance of yield and blast disease resistance via different modules. Rice 2021, 14, 87. [Google Scholar] [CrossRef]
  38. Zhou, S.-X.; Zhu, Y.; Wang, L.-F.; Zheng, Y.-P.; Chen, J.-F.; Li, T.-T.; Yang, X.-M.; He, W.; Li, X.-P.; Ma, X.-C.; et al. Osa-miR1873 fine-tunes rice immunity against Magnaporthe oryzae and yield traits. J. Integr. Plant Biol. 2020, 62, 1213–1226. [Google Scholar] [CrossRef] [Green Version]
  39. Xiao, N.; Pan, C.; Li, Y.; Wu, Y.; Cai, Y.; Lu, Y.; Wang, R.; Yu, R.; Yu, L.; Shi, W.; et al. Genomic insight into balancing high yield, good quality, and blast resistance of japonica rice. Genome Biol. 2021, 22, 283. [Google Scholar] [CrossRef]
  40. Nicol, H.; Thornton, H.G. Competition between related strains of nodule bacteria and its influence on infection of the legume host. Proc. R. Soc. Lond. Ser. B-Biol. Sci. 1941, 130, 32–59. [Google Scholar]
  41. Chen, X.; Shang, J.; Chen, D.; Lei, C.; Zou, Y.; Zhai, W.; Liu, G.; Xu, J.; Ling, Z.; Cao, G.; et al. A B-lectin receptor kinase gene conferring rice blast resistance. Plant J. 2006, 46, 794–804. [Google Scholar] [CrossRef]
  42. Zhang, S.; Wang, L.; Wu, W.; He, L.; Yang, X.; Pan, Q. Function and evolution of Magnaporthe oryzae avirulence gene AvrPib responding to the rice blast resistance gene Pib. Sci. Rep. 2015, 5, 11642. [Google Scholar] [CrossRef] [PubMed] [Green Version]
  43. Jia, Y.; McAdams, S.A.; Bryan, G.T.; Hershey, H.P.; Valent, B. Direct interaction of resistance gene and avirulence gene products confers rice blast resistance. EMBO J. 2000, 19, 4004–4014. [Google Scholar] [CrossRef] [PubMed]
  44. Huang, X.; Feng, Q.; Qian, Q.; Zhao, Q.; Wang, L.; Wang, A.; Guan, J.; Fan, D.; Weng, Q.; Huang, T.; et al. High-throughput genotyping by whole-genome resequencing. Genome Res. 2009, 19, 1068–1076. [Google Scholar] [CrossRef] [PubMed] [Green Version]
  45. Yu, H.; Xie, W.; Wang, J.; Xing, Y.; Xu, C.; Li, X.; Xiao, J.; Zhang, Q. Gains in QTL detection using an ultra-high density SNP map based on population sequencing relative to traditional RFLP/SSR markers. PLoS ONE 2011, 6, e17595. [Google Scholar]
  46. Jiang, S.; Wang, L.; Yang, X.; Zhang, X.; Meng, Y.; Li, M.; Chi, L.; Li, Z.; Zhao, Q.; Liu, Y.; et al. Detection of quantitative trait loci for heading date and temperature responsiveness in a re-sequenced, recombinant inbred line of Japonica rice from Heilongjiang province, China. Plant Breed. 2021, 140, 1011–1022. [Google Scholar] [CrossRef]
  47. Wang, L.; Cheng, Y.; Ma, Q.; Mu, Y.; Huang, Z.; Xia, Q.; Zhang, G.; Nian, H. QTL fine-mapping of soybean (Glycine max L.) leaf type associated traits in two RILs populations. BMC Genom. 2019, 20, 260. [Google Scholar] [CrossRef]
  48. Hu, J.; Wang, Y.; Fang, Y.; Zeng, L.; Xu, J.; Yu, H.; Shi, Z.; Pan, J.; Zhang, D.; Kang, S.; et al. A rare allele of GS2 enhances grain size and grain yield in Rice. Mol. Plant 2015, 8, 1455–1465. [Google Scholar] [CrossRef] [Green Version]
  49. Che, R.; Tong, H.; Shi, B.; Liu, Y.; Fang, S.; Liu, D.; Xiao, Y.; Hu, B.; Liu, L.; Wang, H.; et al. Control of grain size and rice yield by GL2-mediated brassinosteroid responses. Nat. Plants 2016, 2, 15195. [Google Scholar] [CrossRef]
  50. Ruan, B.; Shang, L.; Zhang, B.; Hu, J.; Wang, Y.; Lin, H.; Zhang, A.; Liu, C.; Peng, Y.; Zhu, L.; et al. Natural variation in the promoter of TGW2 determines grain width and weight in rice. New Phytol. 2020, 227, 629–640. [Google Scholar] [CrossRef]
  51. Yu, J.; Xiong, H.; Zhu, X.; Zhang, H.; Li, H.; Miao, J.; Wang, W.; Tang, Z.; Zhang, Z.; Yao, G.; et al. OsLG3 contributing to rice grain length and yield was mined by Ho-LAMap. BMC Biol. 2017, 15, 28. [Google Scholar] [CrossRef] [Green Version]
  52. Fan, C.; Xing, Y.; Mao, H.; Lu, T.; Han, B.; Xu, C.; Li, X.; Zhang, Q. GS3, a major QTL for grain length and weight and minor QTL for grain width and thickness in rice, encodes a putative transmembrane protein. Theor. Appl. Genet. 2006, 112, 1164–1171. [Google Scholar] [CrossRef] [PubMed]
  53. Qi, P.; Lin, Y.S.; Song, X.J.; Shen, J.B.; Huang, W.; Shan, J.X.; Zhu, M.Z.; Jiang, L.; Gao, J.P.; Lin, H.X. The novel quantitative trait locus GL3.1 controls rice grain size and yield by regulating Cyclin-T1;3. Cell Res. 2012, 22, 1666–1680. [Google Scholar] [CrossRef] [PubMed] [Green Version]
  54. Zhang, X.; Wang, J.; Huang, J.; Lan, H.; Wang, C.; Yin, C.; Wu, Y.; Tang, H.; Qian, Q.; Li, J.; et al. Rare allele of OsPPKL1 associated with grain length causes extra-large grain and a significant yield increase in rice. Proc. Natl. Acad. Sci. USA 2012, 109, 21534–21539. [Google Scholar] [CrossRef] [PubMed] [Green Version]
  55. Dong, N.Q.; Sun, Y.; Guo, T.; Shi, C.L.; Zhang, Y.M.; Kan, Y.; Xiang, Y.H.; Zhang, H.; Yang, Y.B.; Li, Y.C.; et al. UDP-glucosyltransferase regulates grain size and abiotic stress tolerance associated with metabolic flux redirection in rice. Nat. Commun. 2020, 11, 2629. [Google Scholar] [CrossRef]
  56. Hu, Z.; Lu, S.J.; Wang, M.J.; He, H.; Sun, L.; Wang, H.; Liu, X.H.; Jiang, L.; Sun, J.L.; Xin, X.; et al. A novel QTL qTGW3 encodes the GSK3/SHAGGY-Like kinase OsGSK5/OsSK41 that interacts with OsARF4 to negatively regulate grain size and weight in rice. Mol. Plant 2018, 11, 736–749. [Google Scholar] [CrossRef] [Green Version]
  57. Wu, W.; Liu, X.; Wang, M.; Meyer, R.S.; Luo, X.; Ndjiondjop, M.-N.; Tan, L.; Zhang, J.; Wu, J.; Cai, H.; et al. A single-nucleotide polymorphism causes smaller grain size and loss of seed shattering during African rice domestication. Nat. Plants 2017, 3, 17064. [Google Scholar] [CrossRef]
  58. Duan, P.; Xu, J.; Zeng, D.; Zhang, B.; Geng, M.; Zhang, G.; Huang, K.; Huang, L.; Xu, R.; Ge, S.; et al. Natural variation in the promoter of GSE5 contributes to grain size diversity in rice. Mol. Plant 2017, 10, 685–694. [Google Scholar] [CrossRef] [Green Version]
  59. Wang, Y.; Xiong, G.; Hu, J.; Jiang, L.; Yu, H.; Xu, J.; Fang, Y.; Zeng, L.; Xu, E.; Xu, J.; et al. Copy number variation at the GL7 locus contributes to grain size diversity in rice. Nat. Genet. 2015, 47, 944–948. [Google Scholar] [CrossRef]
  60. Wang, S.; Wu, K.; Yuan, Q.; Liu, X.; Liu, Z.; Lin, X.; Zeng, R.; Zhu, H.; Dong, G.; Qian, Q.; et al. Control of grain size, shape and quality by OsSPL16 in rice. Nat. Genet. 2012, 44, 950–954. [Google Scholar] [CrossRef]
  61. Zuo, Z.-W.; Zhang, Z.-H.; Huang, D.-R.; Fan, Y.-Y.; Yu, S.-B.; Zhuang, J.-Y.; Zhu, Y.-J. Control of thousand-grain weight by OsMADS56 in rice. Int. J. Mol. Sci. 2022, 23, 125. [Google Scholar] [CrossRef]
  62. Wei, X.; Xu, J.; Guo, H.; Jiang, L.; Chen, S.; Yu, C.; Zhou, Z.; Hu, P.; Zhai, H.; Wan, J. DTH8 suppresses flowering in rice, influencing plant height and yield potential simultaneously. Plant Physiol. 2010, 153, 1747–1758. [Google Scholar] [CrossRef] [PubMed] [Green Version]
Figure 1. Distribution of leaf blast resistance and eight yield traits in the D71/ZH161 RIL population.
Agronomy 12 01173 g001
Figure 2. Chromosomal (numbered on the top) locations of QTL for leaf blast resistance and yield traits detected in the D71/ZH161 RIL population. LBR, leaf blast resistance; GY, grain yield per plant (g); NP, number of panicles per plant; NSP, number of spikelets per panicle; NGP, number of grains per panicle; TGW, 1000-grain weight (g); GL, grain length (mm); GW, grain width (mm); RLW, ratio of grain length to grain width.
Agronomy 12 01173 g002
Table 1. Performance of leaf blast resistance and yield traits in the D71/ZH161 RIL population.
Traits aYearRangeMeanSDCVSkewnessKurtosisD71 bZH161
LBR20200.0–9.03.03.1105.00.27−1.661.0 ± 1.7 7.3 ± 0.6
GY201916.83–47.4732.175.5517.30.160.2443.16 ± 7.7027.86 ± 0.16
202019.71–59.4935.967.5220.90.45−0.1630.20 ± 3.7622.57 ± 1.50
NP20195.5–14.78.91.315.00.500.969.8 ± 0.29.1 ± 0.1
20204.9–11.68.21.315.70.09−0.416.7 ± 0.48.0 ± 1.4
NSP2019156.1–303.2217.928.513.1−0.02−0.47254.8 ± 3.1178.3 ± 10.9
2020137.3–356.9266.150.118.80.37−0.35308.5 ± 19.0170.2 ± 16.9
NGP2019122.0–260.5183.326.214.30.17−0.19194.3 ± 22.9163.4 ± 6.4
2020169.6–432.2230.443.518.90.34−0.37207.4 ± 7.8161.9 ± 15.6
TGW201916.71–28.5722.012.3010.50.22−0.1924.41 ± 0.0419.80 ± 0.14
202016.30–26.3620.681.979.50.29−0.3223.29 ± 0.3417.86 ± 0.56
GL20197.299–9.5558.3860.5356.40.19−1.008.961 ± 0.0057.869 ± 0.005
20207.273–9.5178.3010.5266.30.23−1.008.786 ± 0.0047.640 ± 0.164
GW20192.315–2.8312.5510.0993.90.13−0.242.589 ± 0.0062.538 ± 0.005
20202.270–2.7342.5030.0903.60.190.012.587 ± 0.0112.400 ± 0.047
RLW20192.769–3.8263.3060.2517.60.14−0.923.468 ± 0.0073.115 ± 0.004
20202.842–3.9693.3380.2627.80.27−1.113.406 ± 0.0163.205 ± 0.008
a LBR, score for leaf blast resistance; GY, grain yield per plant (g); NP, number of panicles per plant; NSP, number of spikelets per panicle; NGP, number of grains per panicle; TGW, 1000-grain weight (g); GL, grain length (mm); GW, grain width (mm); RLW, ratio of grain length to grain width. b Trait values for parents D71 and ZH161 are presented as Mean ± SD.
Table 2. Two-way ANOVA of phenotypic performance of the parents and RIL population.
Rice MaterialSource of VariationGYNPNSPNGPTGWGLGWRLW
ParentsBetween years0.04120.01600.08080.60740.00290.02540.01500.1211
Between parents0.02020.63110.00040.0214<0.0001<0.00010.0023<0.0001
Line × year0.28060.12510.03490.51940.15660.66050.01610.0004
RILBetween years<0.0001<0.0001<0.0001<0.0001<0.0001<0.0001<0.0001<0.0001
Among lines<0.0001<0.0001<0.0001<0.0001<0.0001<0.0001<0.0001<0.0001
Line × year<0.00010.0016<0.0001<0.0001<0.00010.4993<0.00010.0238
Table 3. Pearson correlation coefficients between the nine traits tested in the D71/ZH161 RIL population.
TraitsLBRGYNPNSPNGPTGWGLGW
GY−0.121 *
NP0.0800.395 ***
NSP−0.0500.474 ***−0.409 ***
NGP−0.0840.491 ***−0.416 ***0.967 ***
TGW−0.183 **0.321 ***−0.078−0.138 *−0.067
GL0.0180.216 ***0.111−0.268 ***−0.222 ***0.814 ***
GW−0.337 ***0.235 ***−0.210 ***0.1220.165 **0.410 ***−0.113
RLW0.179 **0.0650.193 **−0.283 ***−0.266 ***0.477 ***0.881 ***−0.569 ***
* p < 0.05, ** p < 0.01, *** p < 0.001.
Table 4. QTL detected for LBR in the D71/ZH161 RIL population.
QTLaIntervalLODAbR2 (%) c
qLBR6.16_10875–6_1171869.912.1369.06
qLBR6.26_12137–6_1303821.280.9112.73
a LBR, score for leaf blast resistance. b A, additive effect was estimated by (ZH161–D71)/2. Positive values indicate that alleles from ZH161 are in the direction of increasing the trait score, which means decreasing blast resistance. c R2, proportion of phenotypic variance explained by the QTL effect.
Table 5. QTL detected for the eight yield traits in the D71/ZH161 RIL population.
QTL aChrIntervalLOD (A)LOD (ge)AbgecR2 (A) dR2 (ae) e
qGY333_34881–3_352925.17 -1.22 -5.58 -
qGY666_5008–6_51784.82 -−1.18 -5.22 -
qGY999_14020–9_140816.21 -−1.34 -6.63 -
qGY121212_9178–12_93404.12 -−1.08 -4.31 -
qNP8.188_4554–8_46305.45 -0.27 -7.78 -
qNP8.288_5461–RM5475.24 5.44 0.26 −0.26 7.47 7.24
qNSP5.155_16443–5_165105.38 -−5.49 -3.18 -
qNSP5.255_18992–5_200375.01 7.98 −5.28 −5.46 2.94 3.14
qNSP5.355_28029–5_2815114.49 -−9.25 -9.03 -
qNSP666_3661–6_39124.59 -−5.04 -2.67 -
qNSP8.188_4554–8_463039.40 4.77 −16.30 14.23 27.96 21.29
qNSP8.288_24896–8_2491114.23 -−9.33 -8.81 -
qNSP121212_9178–12_93404.06 -−4.69 -2.28 -
qNGP5.155_848–5_8935.76 -5.43 -3.74 -
qNGP5.255_16443–5_1651013.70 -−8.36 -8.94 -
qNGP5.35RM164–5_194694.72 -−4.78 -2.92 -
qNGP5.455_27266–5_2736711.91 -−7.79 -7.73 -
qNGP666_4034–6_42354.46 -−4.68 -2.79 -
qNGP8.188_4554–8_463026.68 8.27 −12.09 11.82 18.61 17.81
qNGP8.288_24896–8_2491110.54 -−7.43 -6.77 -
qNGP121212_9178–12_93404.92 -−4.91 -3.02 -
qTGW222_26327–2_2647226.48 -0.49 -6.91 -
qTGW3.133_3746–3_384947.51 -−0.70 -13.50 -
qTGW3.233_16442–3_17040106.14 5.23 −1.26 0.03 43.64 0.03
qTGW3.333_33197–3_341886.55 -0.23 -1.55 -
qTGW444_29681–4_298484.65 -−0.19 -1.07 -
qTGW555_6827–5_70394.06 -0.18 -0.90 -
qTGW6.166_12019–6_120377.15 -−0.25 -1.71 -
qTGW6.266_20638–6_211777.97 3.94 −0.26 0.19 1.87 1.03
qTGW6.366_26594–6_266974.43 -−0.19 -1.02 -
qTGW8.188_4142–8_42684.98 4.63 −0.20 0.20 1.16 1.13
qTGW8.288_26828–8_2684811.57 -0.32 -2.78 -
qTGW101010_20601–10_208036.82 6.04 −0.24 0.24 1.59 1.58
qTGW111111_24346–11_244727.49 -−0.25 -1.76 -
qGL222_28176–2_285098.92 -0.058 -1.10 -
qGL3.133_3746–3_384923.87 -−0.100 -3.16 -
qGL3.233_8094–3_84364.44 -−0.040 -0.53 -
qGL3.333_16442–3_17040162.25 36.58 −0.435 0.0004 60.43 0.0001
qGL3.433_31352–3_316473.93 -0.038 -0.47 -
qGL444_19863–4_198904.09 -−0.039 -0.50 -
qGL5.155_7928–5_85364.82 -0.042 -0.58 -
qGL5.255_19815–5_2003723.40 10.73 −0.099 −0.103 3.17 3.46
qGL5.355_20171–5_2035144.60 7.15 0.139 0.122 6.28 4.86
qGL666_458–6_5728.04 -0.055 -0.99 -
qGL777_27901–7_279146.29 -−0.048 -0.76 -
qGL888_3569.1–8_3569.24.67 -−0.041 -0.55 -
qGL101010_20601–10_2080327.76 -−0.107 -3.73 -
qGL11.11111_5422–11_546710.07 -0.062 -1.25 -
qGL11.21111_10868–11_162404.46 -0.041 -0.53 -
qGL121212_25885–12_2626313.78 -−0.073 -1.73 -
qGW2.122_25614–2_2576752.84 -0.033 -21.36 -
qGW2.222_35156–2_354253.92 -0.008 -1.32 -
qGW3.133_4336–3_43816.92 5.45 −0.011 0.009 2.21 1.61
qGW3.233_22495–3_2263418.64 12.97 0.018 −0.017 6.29 5.33
qGW3.333_34881–3_352929.85 7.24 0.013 −0.011 3.19 2.27
qGW4.144_20301–4_203536.20 -0.010 -1.95 -
qGW4.244_29681–4_3070116.69 10.50 −0.017 0.014 5.59 3.97
qGW6.16PB9–6_108757.05 4.53 −0.011 0.008 2.27 1.26
qGW6.266_13038–Si130706.77 -−0.011 -2.16 -
qGW777_4209–7_44829.77 -0.013 -3.15 -
qGW999_19391–9_204284.50 -−0.009 -1.44 -
qGW111111_22486–11_2312911.65 5.09 −0.014 −0.012 3.78 2.87
qGW121212_25491–12_2550917.92 -0.018 -6.07 -
qRLW222_24568–2_247516.50 -−0.029 -1.38 -
qRLW3.133_16442–3_17040122.43 23.20 −0.194 −0.006 61.83 0.06
qRLW3.233_22495–3_226345.39 4.89 −0.027 0.021 1.16 0.70
qRLW4.144_15980–4_172266.09 -−0.028 -1.32 -
qRLW4.244_30701–4_323927.33 -0.032-1.67 -
qRLW66RM276–6_65399.18 -0.035 -2.01 -
qRLW888_5753–8_59494.98 -0.025 -1.06 -
qRLW101010_20225–10_2034113.72 -−0.043 -3.08 -
qRLW111111_7662–11_7931.113.36 -0.042 -2.99 -
qRLW121212_25640–12_2580418.48 -−0.050 -4.23 -
a GY, grain yield per plant (g); NP, number of panicles per plant; NSP, number of spikelets per panicle; NGP, number of grains per panicle; TGW, 1000-grain weight (g); GL, grain length (mm); GW, grain width (mm); RLW, ratio of grain length to grain width. b A, additive effect was estimated by (ZH161–D71)/2. Positive values indicate that alleles from ZH161 are in the direction of increasing the trait score, and negative values indicate that alleles from D71 are in the direction of increasing the score. c ge, effect due to genotype-by-environment interaction. d,e R2, proportion of phenotypic variance explained by the additive or GE effect.
Table 6. Phenotypic performance of LBR and GY in the different combinations of the four genes.
GroupPi26–Pi25 aPibPitanLBRGY
2019 2020
1FNN270.1 ± 0.3 a32.38 ± 6.42 ab33.85 ± 5.99 ab
2FFN230.1 ± 0.3 a31.03 ± 5.49 ab34.62 ± 6.63 ab
3FNF340.1 ± 0.3 a34.10 ± 6.63 a39.05 ± 9.74 a
4FFF280.0 ± 0.1 a33.90 ± 5.30 ab36.65 ± 8.72 ab
5NNN175.9 ± 0.6 b30.23 ± 4.80 b32.79 ± 5.92 b
6NFN196.4 ± 1.3 b31.63 ± 4.78 ab35.52 ± 7.06 ab
7NNF396.3 ± 1.2 b32.08 ± 5.84 ab35.33 ± 6.73 ab
8NFF186.4 ± 1.4 b30.84 ± 3.07 ab35.33 ± 5.64 ab
a F, functional allele; N, non-functional allele. Values are mean ± sd. Values with different letters are significantly different at p < 0.05 based on Duncan’s multiple range test.
Publisher’s Note: MDPI stays neutral with regard to jurisdictional claims in published maps and institutional affiliations.

