Abstract
The growing global water shortage is an increasing challenge for the agricultural sector, which aims to produce sufficient quantity and quality of food and animal feed. In our study, effluent water from an intensive African catfish farm was irrigated on grain sorghum plants in four consecutive years. In our study the effects of the effluent on the N, P, K, Na content of the seeds, on the phenological parameters (plant height, relative chlorophyll content), the green mass, and on the grain yield of three varieties (‘Alföldi 1’, ‘Farmsugro 180’ and ‘GK Emese’) were investigated. Five treatments (Körös River (K) water and effluent (E) water: 30 and 45 mm weekly irrigation water dose; non-irrigated control) were applied with micro-spray irrigation. Compared to non-irrigated plants, effluent water did not negatively affect the N, P, K and Na contents of the grain crop. In terms of phenological parameters, the quality of the irrigation water (150–230 cm) had no negative effect on any of the measured parameters compared to the control (133–187 cm) values. In terms of biomass in 2020, grain yields were 89–109 g/plant with variety Alföldi 1, 64–91 g/plant with variety Farmsugro 180, and 86–110 g/plant with GK Emese.
1. Introduction
The growing global demand for energy and the high use of fossil fuels are a matter of distress in both the long and short term, as these energy sources are not renewable [1,2]. There may be a shortage of these non-renewable energy sources in the future, which could result in economic and political conflicts between energy-scarce nations. Therefore, there is an increasing urgency to research for renewable energy sources that can meet humanity’s energy needs in the long term [3,4]. Hungary is poor in fossil fuels, but half of its area is under arable cultivation, and its agro-ecological characteristics also favor biomass production. For this reason, energy produced as biomass as an alternative energy source may be the main perspective in the future [5]. Areas that do not allow the successful cultivation of other crops can be used to for energy crops. At the same time, they meet the growing conditions for some woody or herbaceous energy plants. The sorghum plant may be a perfect candidate for the production of low-cost biofuels in the future, as its abiotic stress tolerance, diverse genetics, and reliable seed production all contribute to this property [6].
During changes in climatic conditions, drought periods and uneven rainfall distribution become more frequent. It has been described several studies that sorghum has excellent drought tolerance, with dry-land regions growing more than maize. In drought conditions, sorghum grain absorbs nutrients more efficiently than maize. However, the sorghum crop grown under non-irrigated conditions does not exceed the irrigated crop [7,8,9]. Declining freshwater supplies and pollution are global problems [10]. According to a study by Mekonnen and Hoekstra [11], approximately four billion people live in water scarcity worldwide, and an estimated five hundred million people live in areas with grave water crisis. For this reason, one of the most significant resources today is water. Nowadays, the biggest challenge is to provide irrigation water for agriculture in the context of the increasingly frequent drought phenomenon. As a consequence of climate change periodically and regionally, there may be a phenomenon in which the surface freshwater supply is insufficient to meet irrigation water demand [12]. The need for irrigation water can be solved by making more optimal use of the available irrigation water. However, in some situations, it may be necessary to use municipal wastewater or agricultural effluent water [13]. Municipal water sources contain lower concentrations of potential pollutants compared to industrial wastewater [14]. During the use of reused water in agriculture, environmental changes that may have a positive or negative property should be monitored [15]. Another source is the irrigation utilization of the effluent of intensive aquaculture systems. Moreover, the effluent is usually rich in organic matter; therefore, the fertilizer doses applied to the production area can also be reduced [16]. At the same time, nutrient accumulation caused by large amounts of organic and inorganic metabolites and residual fish feed should be taken into account when placing effluents in natural recipients [17].
The importance of growing sorghum is increased by the fact that it does not require as intensive plant protection and nutrient replenishment as maize [18]. It is less sensitive to the quality of the area and can be grown successfully in places where other crops make little or no profit in an average year. The uses of sorghum are diverse. Sorghum also plays a significant role in human consumption; in terms of production area, it ranks fifth after maize, rice, wheat and barley among the cereal crops [19]. Sorghum is a plant of physiological type C4 with high productivity and good drought tolerance [20,21]. Species have good drought tolerance due to their original habitat conditions; indeed, sorghum’s gene center is the steppe and savannah region of Africa [22]. It has a water demand of 500–580 mm/year and a transpiration coefficient of 150–250 l/kg dry matter [8]. It can be used as a multi-purpose energy crop in both human food and feed production, although it can also be grown for energy purposes [23,24].
The aim of our study was to determine the growth rate of the sorghum varieties that were irrigated with effluent water from an intensive fish farm with a higher Na content, and to define the biomass production. Our further objective was to determine the concentration of N, P, K and Na elements which were accumulated in plant parts and its effect on the macronutrient content in the soil.
2. Materials and Methods
2.1. Site Description and Climatic Conditions
The field experiment was set up at the Lysimeter Research Station (46°51′49″ N 20°31′39″ E, Szarvas, Hungary) of the Hungarian University of Agriculture and Life Sciences (MATE), Institute of Environmental Sciences (IES), Research Center for Irrigation and Water Management (ÖVKI).
Szarvas is located in one of the warmest and driest areas of Hungary. The climate of the Great Hungarian Plain is characterized by large annual and daily temperature fluctuations, late spring and early autumn frosts, high sunlight, relatively low air humidity, and extremely capricious rainfall conditions. In all four experimental years, the spring was characterized by drought in which the average monthly precipitation did not exceed 49.7 mm (Figure 1). We measured the lowest precipitation in 2019, during which the average annual precipitation was 516.4 mm. In terms of temperature, the warmest year was observed in 2019, where the average annual temperature was 27.1 °C.
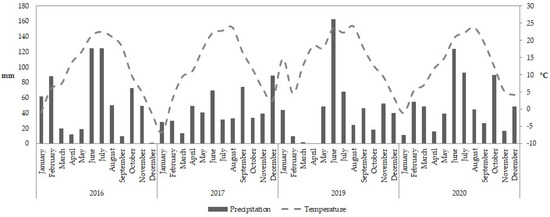
Figure 1.
Average mean temperature and precipitation data for the 2016–2020 experimental years.
The soil parameters were analyzed before the start of the study and at the end of the experiments. The soil of the small-plot experiment was Vertisol. The pH of the soil was neutral, total carbonate content and total organic carbon content were low; however, the nutrient supply was high for phosphorus and potassium and moderate for nitrogen (Table 1). Based on the recorded electrical conductivity (EC) and sodium (Na) concentration values, the soil is not saline (Table 1).

Table 1.
Soil parameters of the experimental field before the start of the experiment in the 0–30 cm and 30–60 cm soil layers (2016, Szarvas, Hungary).
2.2. The Plant Material and Experimental Design
In the present study, the growth parameters of three registered grain sorghum cultivars (‘Alföldi 1’, ‘Farmsugro 180’, ‘GK Emese’) of the Cereal Research Non-Profit Ltd. (Szeged, Hungary) were monitored using different amounts and qualities of irrigation water. The sowing time was set up when the average soil temperature (at 5 cm deep) reached 12–13 °C in each experimental year (late April or early May). The row spacing was 70 cm and a stocking density was 190–230 thousand plants/hectare (114–138 plants per plot). Each plot contained 4 rows (1 m), and the measurements were performed in the middle two rows (in 6 replicates) in each case. Accordingly, the size of one sample area was 3 m long and 2.1 m wide.
In our experiment, two different types of irrigation water were used (Table 2). One of these was a surface freshwater from the local oxbow lake of the Körös River (46°51′38.6″ N 20°31′28.0″ E, Szarvas, Hungary). The second was an untreated effluent water which was collected from the direct outflow tank of an intensive African catfish farm. The amount of water applied during the experiment is shown in Table 3.
Table 2.
Types and average quality parameters of irrigation water used in the irrigation experiment of grain sorghum varieties (Szarvas, Hungary).
Table 3.
Date of sowing and the available amount of water (irrigation and precipitation) during the growing seasons of grain sorghum in 2016–2020.
In that fish farm, the continuous water supply was provided by a flow-through system, and the water was obtained from a geothermal reservoir to ensure minimum (16 °C) water temperature and quality needs for the African catfish. The average daily effluent from the fish farm exceeds 1000 m3 per day [16]. During the irrigation experiment, two doses of irrigation water (30 and 45 mm) were set on a weekly basis and applied with a micro sprinkler irrigation system. Five treatments were set up, one non-irrigated control (C), two surface water irrigated treatments (K30 and K45), and two effluent treatments (E30 and E45). For each variety, six replicates were set. In the first four weeks after sowing, the plants were irrigated with Körös River water to supplement the precipitation in all treatments to promote germination and initial growth. It had a uniform water condition of 30 mm on a weekly basis, which was ensured by the total amount of precipitation and irrigation water in the Körös. Subsequently, differentiated irrigation was implemented.
2.3. Assay of Phenologycal Parameters and Mineral Content
The phenological measurements of the plants were recorded weekly during the growing seasons. The plant height was measured with a measuring rod at the intersections of the upper two leaves. The Soil Plant Analyses Development (SPAD) index was measured with the Chlorophyll Meter SPAD-502 (Konica Minolta Inc., Tokyo, Japan) on 3 plants per sampling point, on the most advanced leaf, at 4 points per leaf. The SPAD measurement was distributed proportionally along the length of the leaf plate at two points on the right and left sides of the leaf plate. For the determination of biomass, the whole above-ground part of the plant was sampled, when the moisture content of sorghum grains dropped below 20 m/m%. We also measured wet green weight and the weight of grains (in both cases we worked with six replicates).
We performed the studies based on our previously published study of Kolozsvári et al. [16]. The analysis of the soil samples and mineral content of different plant parts was carried out at the end of the growing season assayed by the Hungarian and International Organization for Standardization (ISO) methods. Sodium, phosphorus, and potassium were extracted with nitric acid + hydrogen peroxide and their concentrations were measured using inductively coupled plasma-optical emission spectrometry (ICP-OES) (according to Hungarian standard MSZ 08 1783 28-30:1985). The ISO 5983-2:2009 standard method was used to determine nitrogen.In the analytical studies, we worked with three repetitions.
2.4. Statictical Analyses
IBM SPSS Statistics 25.0 software was used for statistical evaluation. The significant differences between different irrigation treatments and cultivars were determined by one-way analysis of variance ANOVA, where the Tukey’s test was considered significant at p ≤ 0.05. Pearson correlation was used in correlation analysis.
3. Results
3.1. Changes in Soil Parameters during the Experiment
Soil properties were examined in two soil layers. In the sub-soil layer (30–60 cm), there was no significant difference between the different treatments, expect the sodium content (Table 4). The properties of the upper soil layer were changed for five parameters due to irrigation or irrigation water quality. The pH values were significantly higher in the effluent water treatment than in the K30, K45 and control treatments. The highest EC values were measured in the control, and there were no significant differences between the treatments. In case of two macronutrients, phosphorus and potassium, there were less available amounts in the soils in E30 and E45 treatments than in surface water or non-irrigated treatments (Table 4). The AL-Na content was lowest in the control treatment; for the irrigated soil samples, the value in E45 was significantly higher than others.
Table 4.
Soil parameters of the experimental area sampled in the final year of the irrigation experiment. Average soil parameters data are presented from five treatments. Results are means ± SD, n = 6. Different letters show significant differences among irrigation water qualities for the four cultivation years, corroborating to the Tukey’s test at p ≤ 0.05.
3.2. Results of the Main Macroelement Content of Sorghum Plant Parts
3.2.1. Changing of Nitrogen Content in Different Plant Parts
Figure 2a shows the nitrogen (N) analyses of the grains of the ‘Alföldi 1’ variety during the experimental four years. The grains show a decreasing trend every year. The highest value is shown by the control samples (2.4 m/m%), while the lowest nitrogen content was in the K45 (1.8 m/m%) treatment in 2016. In the 2017 growing year, the samples were characterized by a balanced nitrogen content. The results obtained in the next two years converge, where it can be seen that the control (C) values were the lowest and the samples irrigated with effluent irrigation water had the highest nitrogen content. There was only a significant difference in the first year, where the E45 treatment (p = 0.005) had a significantly lower N element content compared to the C and K30 treatments.
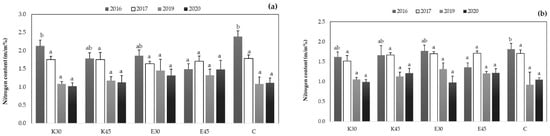
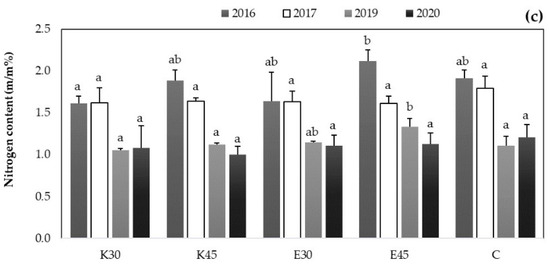
Figure 2.
Nitrogen content of sorghum grains from 2016 to 2020. (a) The nitrogen content of ‘Alföldi 1’ variety; (b) the nitrogen content of ‘Farmsugro 180’ variety; (c) the nitrogen content of ‘GK Emese’ variety. The mean nitrogen content data are presented in five treatments. The results are means ± SD, n = 3. The different letters establish significant differences between irrigation water qualities for the four vegetation periods, corroborating to the Tukey’s test at p ≤ 0.005.
The Figure 2b shows the development of nitrogen content in the grain yield of ‘Farmsugro 180’. In the first two growing years, almost the same N-element content was measured in the grains, during which the C treatment had the highest concentration (1.7–1.8 m/m%). In addition, a decrease can be observed in 2019 and 2020. No significant difference can be described; however, it can be observed that higher N content was measurable for irrigated treatments. The significant difference was characteristic of the first year of cultivation, where we measured a significantly lower N content in the E45 treatment (p = 0.035) compared to the C treatment.
In the ‘GK Emese’ variety (Figure 2c), it can be stated that the highest N content in the grains occurred in the first year of cultivation. The highest values were measured for the E45 treatment (2.1 m/m%) and the lowest for the K30 sample (1.0 m/m%). In 2017, there was some decrease in plant samples for all treatments. Almost the same course can be observed in the last two growing years. We measured a significant difference in 2016 and 2019. The K30 treatment (p = 0.047) had significantly less N content compared to the E 45 treatment with the highest value. In the latter case, we also measured a significantly higher nitrogen content in the plant sample of the 45 mm irrigated effluent treatment compared to the K30 (p = 0.005), C (p = 0.018) and K45 (p = 0.029) samples.
3.2.2. Changing of Phosphorus Content in Sorghum Plant Part
Figure 3a shows the phosphorus (P) content measured in the grains of the ‘Alföldi 1’ grain sorghum variety. The phosphorus values were between 2700 and 3700 mg/kg dry matter (d.m.) during the four years of cultivation. In 2016, treatment C had the highest concentration (3700 mg/kg d.m.), while K30 treatment had the lowest concentration (3190 mg/kg d.m.). In the second year of cultivation, the highest phosphorus concentration was measured in the C treatment plant sample, and the lowest in the E45 treatment. In the experimental years of 2019 and 2020, a small decrease was observed, especially for treatment C, where the values were around 3000 and 2700 mg/kg d.m. We measured significant differences between the treatments, except for the last year. In 2016, K30 (p = 0.028) and E45 (p = 0.046) treatments had significantly less phosphorus content compared to the C treatment with the highest value. In the second year, we also measured significantly lower values for E45 (p = 0.003), E30 (p = 0.047), and K45 (p = 0.049) samples compared to the C treatment. In 2019, the phosphorus value of the E30 treatment proved to be the highest, where we measured a significantly lower value than the C sample (p = 0.045).
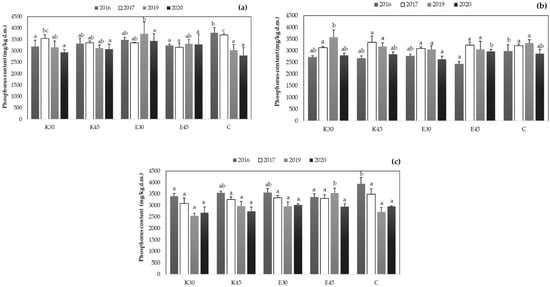
Figure 3.
Phosphorus content values of sorghum grains from 2016 to 2020. (a) The phosphorus content of ‘Alföldi 1’ variety; (b) the phosphorus content of ‘Farmsugro 180’ variety; (c) the phosphorus content of ‘GK Emese’ variety. The mean phosphorus content data are presented in five treatments. The results are means ± SD, n = 3. The different letters establish significant differences between irrigation water qualities for the four vegetation periods, corroborating to the Tukey’s test at p ≤ 0.005.
Lower phosphorus values were measured for the ‘Farmsugro 180’ variety in the first experimental year compared to the other years (Figure 3b). The highest value was recorded by C treatment (2987 mg/kg d.m.), while the lowest was recorded by E45 treatment (2430 mg/kg d.m.). In the following two experimental years, the values show an upward trend. However, a repeated decline in phosphorus levels can be observed in 2020. The significant differences were detected between the applied treatments, with the exception of the year 2017. In 2016, we measured a significantly lower concentration for the E45 (p = 0.004) sample compared to the value of treatment C. In 2019, the K30 (p = 0.043) sample had a significantly higher phosphorus concentration. Compared to the E45 sample with the highest value, the last year was characterized by significantly lower phosphorus content in E30 (p = 0.048).
In Figure 3c, the phosphorus value of the grains of the ‘GK Emese’ cultivar ranged from 2540 to 3950 mg/kg d.m. In the first year of cultivation, E45 treatment had the lowest concentration, while C treatment had the highest concentration. The difference between the measured values exceeded 600 mg/kg d.m. The year 2017 was characterized by equalized values. In the last two years, a decrease in phosphorus levels was observed, where the K30 treatment had the lowest value and the E45 treatment had the highest concentration. There was no significant difference between the treatments in 2017 and 2020. However, in 2016, treatments E45 (p = 0.015) and K30 (p = 0.023) contained significantly less phosphorus capable of C treatment with the highest P levels. Furthermore, we measured significantly more phosphorus in the E45 treatment in 2019.
3.2.3. Changing of Potassium Content in Sorghum Plant Part
In the first year of cultivation, the potassium (K) levels of the grains of the ‘Alföldi 1’ variety ranged from 4020 to 5000 mg/kg d.m. (Figure 4a). The K30 treatment had the lowest value and the E45 treatment had the highest value. In 2017, a decrease in potassium levels was observed for all treatments. Subsequently, in the last two growing years, the values showed a nearly identical trend, where we measured higher potassium levels with K30 treatment. We detected a significant difference between the treatments in the first two experimental years. In 2016, E45 (p = 0.044) treatment had significantly more potassium content than the others. Furthermore, E30 (p = 0.016) had significantly less K element content compared to the C treatment with the highest value in 2017.
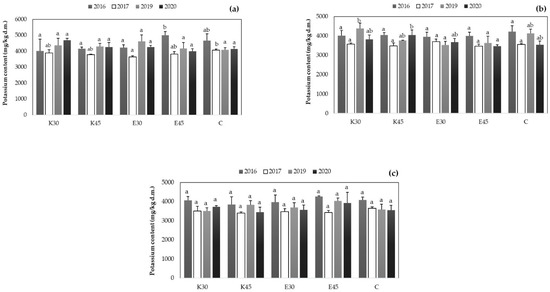
Figure 4.
Potassium content values of sorghum grains from 2016 to 2020. (a) The potassium content of ‘Alföldi 1’ variety; (b) the potassium content of ‘Farmsugro 180’ variety; (c) the potassium content of ‘GK Emese’ variety. The mean potassium content data are presented five treatments. The results are means ± SD, n = 3. The different letters establish significant differences between irrigation water qualities for the four vegetation periods, corroborating to the Tukey’s test at p ≤ 0.005.
In the case of the ‘Farmsugro 180’ cultivar, it can also be described that the samples were characterized by elevated K levels in the first year. It is also typified by balanced values (Figure 4b). In 2017, potassium levels ranged from 3490–3580 mg/kg d.m. The samples from 2019 and 2020 showed significant differences. The E30 (p = 0.010) and E45 (p = 0.021) treatments had significantly less K content compared to the highest value of K30 in 2019. In the last year, E45 (p = 0.029) had significantly less K content compared to the highest value of K45 treatment.
In case of ‘GK Emese’, we detected a higher K level in the samples, which was between 3843 and 4266 mg/kg d.m. in the first year of cultivation (Figure 4c). In 2017, the potassium content in the grains was similar to the other varieties as some decrease can be observed. The K content of the last two years was balanced, with nearly the same values, where treatment C showed a decreased potassium content (3580 and 3560 mg/kg d.m.). The highest values were measured for the E45 treatment in both years. In the evaluation of the K-level measured in the grains of the ‘GK Emese’ variety, no significant difference between the treatments was detected in any of the examined cultivation years.
3.2.4. Changing of Sodium Content in Sorghum Plant Part
In 2016, the sodium (Na) content detected in the grains of the ‘Alföldi 1’ variety proved to be the lowest, where its measured values ranged from 29 to 34 mg/kg d.m (Figure 5a). Some decreases were observed in the 2017 and 2019 cultivation years; however, even the highest Na content does not exceed 44 mg/kg d.m. In the last experimental year, a significant increase in Na levels was observed for all treatments. In this case, treatments E45 and C exceed 100 mg/kg d.m. The effects of the treatments were compared within that cultivation year, where no significant differences were detected.
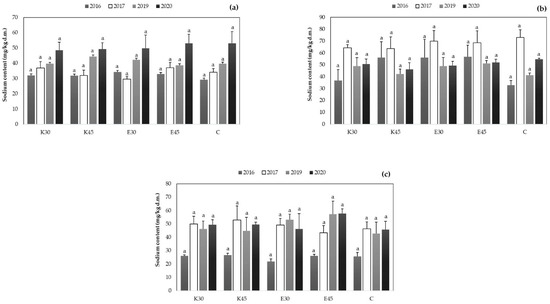
Figure 5.
Sodium content values of sorghum grains from 2016 to 2020. (a) The sodium content of ‘Alföldi 1’ variety; (b) the sodium content of ‘Farmsugro 180’ variety; (c) the sodium content of ‘GK Emese’ variety. The mean sodium content data are presented five treatments. The results are means ± SD, n = 3. The different letters establish significant differences between irrigation water qualities for the four vegetation periods, corroborating to the Tukey’s test at p ≤ 0.005.
In the case of the ‘Farmsugro 180’ cultivar, the Na content measured in the grains was higher than in the case of the ‘Alföldi 1’ cultivar. In the first year of cultivation, treatment C had the lowest value of 32 mg/kg d.m., while treatments K45, E30 and E45 had the highest values (56 mg/kg d.m.) (Figure 5b). The following year was marked by growth. The highest sodium values in the control samples were 73 mg/kg d.m. and the lowest was 63 mg/kg d.m. for K45 treatment. In 2019, a repeated decrease was observed in the samples, where they ranged from 41 to 49 mg/kg d.m. In 2020, a remarkable increase was observed between 92 and 109 mg/kg d.m. There were no significant differences for this variety when comparing the treatments in that year.
The level of Na content measured in the grains was similar for the ‘GK Emese’ cultivar (Figure 5c). In 2016, a balanced sodium level was measured for each treatment, during which it did not exceed 26 mg/kg d.m. In the second year of cultivation, samples irrigated with water from the Körös oxbow lake represented higher Na levels. In 2019, however, samples irrigated with effluent showed higher values (53 and 57 mg/kg d.m.). It is also observed in this variety that the Na content in the grains increased notably in 2020, especially in the case of the E45 sample, where it reached 115 mg/kg d.m. In this case, there was no significant difference between the treatments in the statistical evaluation.
3.3. Phenological Results
3.3.1. Development of Relative Chlorophyll Content
Table 5 shows the average chlorophyll values. In the experimental year of 2016, the highest SPAD value in the leaf parts was measured in the case of the C treatment in the ‘Alföldi 1’ variety, while the lowest was detected in the case of the E45 treatment. A decrease was observed for all treatments in the following year. The SPAD value developed similarly in 2019 and 2020, with the highest measured at E45 and the lowest at K30. There was no significant difference between treatments for the first two years. In the third and the fourth year, E30 (p = 0.000), K30 (p = 0.000), and C (p = 0.001) treatments had significantly lower SPAD values compared to the highest E45 treatment. By 2020, the chlorophyll content of the leaves was also significantly lower in the E30 (p = 0.001), K30 (p = 0.002) and C (p = 0.001) treatments compared to the E45 value.
Table 5.
Chlorophyll values over the four experimental years. Average chlorophyll data are presented from five treatments. Results are means ± SD, n = 30. Different letters recommend significant differences among irrigation water qualities for the four cultivation years, corroborating to the Tukey’s test at p ≤ 0.05.
Regarding the ‘Farmsugro 180’ variety, it can be observed that in all cases except the first year, E45 treatment had the highest SPAD value, especially in 2017, where it reached 52.5. Of the four experimental years, the lowest mean chlorophyll values were detected in 2019 (38.9–47.1), while the highest was measured in 2017 (49.8–52.5). During the one-way statistical evaluation, there was no significant difference between treatments in the first two years. In 2019 and 2020, E30 and K45 (p = 0.000) treatments had significantly lower chlorophyll values compared to E45 treatment with the highest SPAD data.
For the ‘GK Emese’ sorghum variety, the highest chlorophyll value was measured in 2017 out of the four experimental years (51.9–56.5), while the lowest was in 2020 (38.8–45.5). It was characteristic of the first two cultivation years that the treatments irrigated with the water of the Körös River had a higher SPAD value, especially the K45 treatments. However, in 2019 and 2020, plants with K30 treatment had the highest chlorophyll value. In this case, it can be described that there was no significant difference between the treatments during the first two years of the statistical analysis. In the year 2019, the K45 (p = 0.012) treatment had a significantly lower SPAD value compared to the value measured at the highest K30 treatment. In 2020, E45 (p = 0.003) and K45 (p = 0.002) treatments also had significantly lower chlorophyll values compared to the highest K30 treatment.
3.3.2. Determination of Growth Parameter during the Seasons
In the case of the ‘Alföldi 1’ variety, it can be observed that the height values measured during the first year exceeded the measurements of the following years (Figure 6a). For the E45 treatment, we measured the highest plants where they reached 199 cm. Plants with the E30 treatment grew to the lowest one (155 cm). In the following year, a decrease in height was observed for all treatments. Height values from 2019 to 2020 were detected in nearly the same range. As in previous years, the plants grew smaller with E30 treatment and the largest with E45 treatment (156–169 cm). The significant difference between the treatments was detected only in the first year of cultivation, where sorghum plants grew significantly smaller (p ≤ 0.01) than all other treatments compared to the E45 treatment with the highest value.
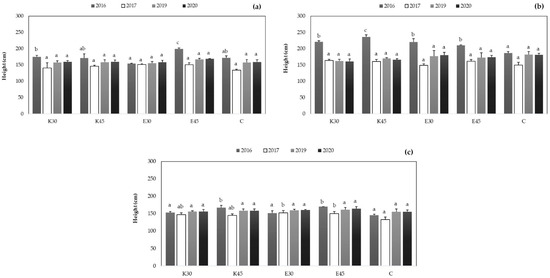
Figure 6.
Plant height data measured at the last evaluation time of sorghum grains from 2016 to 2020. (a) Height values of ‘Alföldi 1’ variety; (b) height values of ‘Farmsugro 180’ variety; (c) height values of ‘GK Emese’ variety. The mean height data are presented five treatments. The results are means ± SD, n = 3. The different letters establish significant differences between irrigation water qualities for the four vegetation periods, corroborating to the Tukey’s test at p ≤ 0.005.
For ‘Farmsugro 180’ (Figure 6b), higher plant heights were also detected in the first year of cultivation, with the lowest plants in treatment C (187 cm) and the highest in treatment K45 (236 cm). In the following years, a decrease was observed with all treatments. In 2017, the height of the ‘Farmsugro 180’ variety was between 149 and 164 cm. In 2019 and 2020, an increase of 10% was observed, during which the height ranged from 161 to 182 cm. In 2016, a significant difference was found between the treatments, where plants of other treatments grew significantly lower (p ≤ 0.05) compared to K45 treatment.
The ‘GK Emese’ variety is also characterized by the finding that the height values measured in 2016 exceeded those in other years (Figure 6c). The measured values were between 140–170 cm in the first year and 133–152 cm in the second year. In all four years of cultivation, treatment C was found to be the lowest and treatment E45 to be the highest. In the last two years, a decrease can be observed, where the measured values were between 156–162 cm. In the first two years there was a significant difference between treatments. In 2016, C (p = 0.001) E30 (p = 0.008) and K30 (p = 0.016) treatments proved to be significantly lower than E45. In the second year, significantly lower values were detected for C treatment (p = 0.018) compared to the highest E30 treatment.
3.4. Development of Biomass Product over the Four Experimental Years
3.4.1. Development of the Green Mass of the Three Sorghum Cultivars during the Experimental Years
The development of the wet green mass of grain sorghum varies from variety to variety. In the case of the ‘Alföldi 1’ variety, the 2017 growing year proved to be the most productive in terms of wet green mass, during which the E45 treatment reached 476 g/plant (Table 6). In the same year, the lowest weight was measured for treatment C, which was 349 g/plant. In addition, the green mass of the first year of cultivation proved to be the lowest, where the E45 treatment (365 g/plant) had the highest biomass and E30 treatment had the lowest (296 g/plant) value. In the one-way analysis of variance, there was no significant difference when comparing treatments over the years.
Table 6.
Development of wet green mass at harvest between 2016–2020 growing seasons. Average green mass weight data are presented from five treatments. Results are means ± SD, n = 6. Different letters recommend significant differences among irrigation water qualities for the four cultivation years, corroborating to the Tukey’s test at p ≤ 0.05.
For the ‘Farmsugro 180’ cultivar, the highest green weight was detected in the first year of cultivation, reaching 583 g/plant for the K30 treatment, while the E45 treatment with the lowest weight value 433 g/plant. The plants of 2019 had the lowest weight, where their measured values ranged from 308 to 346 g/plant. A significant difference between the treatments was detected in the first year of cultivation (p ≤ 0.05).
In the case of the ‘GK Emese’ cultivar, the year 2016 had the lowest plant weight, where the highest measured values did not exceed 256 g/plant. However, in 2019, these values increased for all treatments, with the lowest C treatment reaching 421 g/plant and the E30 treatment having the highest plant weight of 573 g/plant, although there was no significant difference between treatments during the statistical annual evaluation.
3.4.2. Improvement of the Grain Yield of the Three Sorghum Cultivars during the Experimental Years
In the course of the change in the weight of the grain yield of the ‘Alföldi 1’ variety, the smallest grains yield was detected in the year 2019, which was between 67–91 g/plant (Table 7). The highest grain yield values were measured in 2016, where the C treatment had the lowest grain yield of 82 g/plant and the E30 samples had the highest grain yield of 138 g/plant. During the one-way analysis of variance, there was a significant difference between treatments only in 2016 (p ≤ 0.001).
Table 7.
Development of wet grains yield at harvest between 2016–2020 growing seasons. Average grains yield data are presented from five treatments. Results are means ± SD, n = 6. Different letters recommend significant differences among irrigation water qualities for the four cultivation years, corroborating to the Tukey’s test at p ≤ 0.05.
For the ‘Farmsugro 180’ variety, the grain yield was the lowest in the last experimental year, during which the measured value was only 57 g/plant for the K45 treatment. However, the highest values were detected in 2017, during which the grain yield of sorghum was the lowest for the E45 (81 g/plant) treatment and the highest for the K45 (105 g/plant) treatment. There was no verifiable significant difference between the treatments in any of the years.
Compared to the other cultivars, we measured a higher amount of grain yield in the case of the ‘GK Emese’ every year (Table 7), during which the lowest values measured in 2019 exceeded it (77–110 g/plant). The year 2016 had the highest weight value, with the lowest value for treatment C (100 g/plant) and the highest for treatment K30 (140 g/plant), although there was no significant difference between treatments during statistical evaluation.
4. Discussion
The irrigation experiment applied to the grain sorghum varieties took place between 2016 and 2020. With population growth and swift urbanization, the agricultural sector is under increasing pressure as freshwater supplies for crop production declining in all parts of the world [25]. The use of wastewater and effluents of industrial or agricultural origin is an essential element in the protection of our water resources. According to Qi et al. [26], effluents from aquaculture systems have a rich organic matter content which can be advantageously used in crop production. At the same time, it increases soil fertility, improves cultivation success and reduces fertilizer costs [27]. Irrigation of the higher salinity effluent with us gave similar results as Guimarães et al. [28] described in their research that the cultivation of the sorghum forage could be solved by irrigation with saline effluent water.
The high Na+ and HCO3− concentration in irrigation water is known to be responsible for soil salinization. In sodic soils, ionic exchange between Na+ and H+ causes the dissociation of water in soil solution, leading to increasing concentrations of NaOH in the soil solution and the soil pH may increase to values above 10.5 [29,30]. The negative relationship between basic respiration and pH in salt-affected soils [31] could be another reason of the alkalization of the soil irrigated with effluent water (Table 4). In case of total carbonate, total organic carbon and N values, there were no significant differences due to the treatments (Table 4).
According to our results in the non-irrigated treatment, the highest EC value was measured (in surface soil layer). Strong correlation was found between EC and P and K content of the soil (Pearson correlation coefficients 0.824 and 0.823, respectively, sig. < 0.01) in the surface layer, but there was no correlation between them in the subsoil layer. We assume the EC differences occur because of the more available nutrients (P, K) in the soil at 0–30 cm depth.
The impact of irrigation and water quality on the available phosphorus content of the soil was proved in the surface soil layer where the lowest mean P content were calculated in E30 and E45, despite the P content of the effluent and the river water (Table 1 and Table 4). We assume the disintegration of soil aggregates was due to soil salinization was the significant role of the released colloid-sized clay particles in P fixation; however, further studies are needed to prove our assumption. According to Arienzo et al. [32], potassium availability is strongly affected by the pH of the wastewater, as well as by the pH of the receiving soil. Normally, potassium availability is sustained for most plants in neutral or slightly acidic soils. In this study, the pH was significantly lower in the soil irrigated with Körös River water, which may have caused higher K content in the control treatment.
One of the acidic extractants, the ammonium lactate (AL, pH = 3.7) solution, introduced by Egner et al. [33], is commonly used in Europe. When the soil is treated with AL extraction solution, the soluble substance enters the solution partly through dissolution and partly through ion exchange, and AL extraction solution could decompose the carbonates also. The higher sodium concentration of the soils irrigated with effluent (Table 4) indicates the start of the sodication process.
The increase in the nitrogen content of sorghum plants is directly proportional to the higher crude protein content [34], which may mean a more nutritious feed for the animals. Although, the lower nitrogen content affects the physiology of the plant processes in which the macronutrient content of the grain changes, in particular the uptake of Ca, Mg and S [34]. For all three cultivars, significantly higher nitrogen values were measured in the grain yield in the first two growing years. In certain years of the experiment, it was found for each variety that the higher N content of the effluent irrigation water could be well utilized in grain yields.
The P demand of plants is high during the development of vegetative organs, but it is also significant during crop production. The seeds are the phosphorus-containing plant organs [35]. Nitrogen and phosphorus are antagonists of each other in terms of their physiological effects, where N stimulates the growth of vegetative organs, while phosphorus stimulates the appearance of generative organs and crop ripening [36]. Regarding phosphorus, there was no significant difference between the varieties and the irrigation treatments. On the other hand, the ‘Alföldi 1’ and ‘GK Emese’ varieties were able to make slightly better use of the higher P content of effluent irrigation water, especially in the last two years.
Potassium is an essential element for growth and one of the most frequently occurring cations in plant organs. Unlike other elements such as nitrogen, phosphorus, magnesium, calcium and sulfur, potassium is not incorporated into organic matter. Over time, the K content of older organs showed a decreasing trend. [37]. In the experiment, sorghum plants had high K levels of grain yield between 3500 and 5000 mg/kg d.m. There was no significant difference between the varieties. The Na+/K+ ratio is considered to be the basis of the salt tolerance of plants, which increases in direct proportion to the increase in salinity [38]. According to Ahmad et al. [39] and Iqbal et al. [40] studies, effluent irrigation water with higher salinity did not reduce the accumulation of K+ in plant organs.
High salinity in plants cause hyperionic and hyperosmotic stress effects, as well as limited growth. Sodium is not essential even for extreme salt-tolerant plants, requiring only small amounts of C4 and CAM plants [41,42]. Due to this, in addition to salt stress, sorghum is able to maintain its photosynthetic activity and dry matter production [43]. The sodium content of the grain crop was the lowest in the first year of cultivation. There was a difference in the accumulation of the cultivars, where a higher Na level was detected in the case of ‘Farmsugro 180’, while the lowest sodium content was measured in ‘GK Emese’. The level of Na in the grain yield of sorghum also shows an upward trend between the years, but it occurred to different degrees for the three sorghum cultivars. However, this value has not yet been shown to be toxic to the dose. In a vegetation period—in proportion to the amount of annual irrigation—41–66 g/m2 Na was applied in the case of 30 mm effluent irrigation and 49–99 g/m2 Na in the case of 45 mm effluent.
Sixto et al. [44] have shown that a decrease in vegetative growth parameters can be observed in plants as a function of increasing salinity. In plants exposed to salt stress, a decrease in shoot, stem and root development, fresh and dry stem and root mass, leaf area and number of leaf, and relative chlorophyll amount and yield were observed [45,46,47,48]. For all three varieties, the average SPAD value of the leaves was lower in the last two growing years. There is a linear relationship between the nitrogen content of the crop and the chlorophyll value, where a positive correlation (r = 0.737, Pearson correlation) was observed during the study.
In the case of plant height, it can be stated that the highest plants (149–236 cm) were detected in the first year of cultivation, which can be explained mainly by the maximum amount of total water (precipitation + irrigation). Subsequently, a decrease was observed for all three cultivars (133–181 cm), depending on the total annual water volumes, as plant height is primarily affected by precipitation and temperature. In the experiment, the ‘Farmsugro 180’ fell short of its average height of 180–220 cm except for the first year. However, the measured height data of ‘Alföldi 1’ (140–16 cm), and mainly the ‘GK Emese’ (130–150 cm), corresponded to their characteristic height, which means that they were well adapted to the experimental stress conditions. This trend is also observed in the weight of grain yield. In addition, several studies have reported that higher salinity in irrigation water reduces plant mass, crop, and biomass product [49,50].
Hussein et al. [51] showed that higher Na concentrations of irrigation water had a negative effect on the growth profile of sorghum. In the 2017 growing year, the amount of irrigation water presented a positive correlation (r = 0.026, Pearson correlation) for both green mass and grain yield. In the case of both green mass and grain yield, it was observed that lower biomass values were detected in the last year of cultivation. The sorghum is a moderately salt tolerant plant [52], and no yield reduction is expected at irrigation water with EC of 4.5 dS/m and soil salinity up to 6.8 dS/m. According to our soil EC values (Table 4), it is not proven that salinity could cause the decrease; however, a detailed analyses of soil exchangeable sodium percentage would be justified to further investigate the effluent water impact on these sorghum cultivars. Nevertheless, a decrease occurred in all treatments, and hence cannot be linked to water quality with absolute certainty. For example, the sensitivity of ‘Farmsugro 180’ should be emphasized, during which the value of grain yield in the case of samples irrigated with the water of the Körös River in the last year was only between 57–67 g/plant.
5. Conclusions
Irrigation of fish farm effluent water with a higher Na content may provide an alternative solution for regions with water scarcity; however, the possibility of its long-term use should be considered as it may cause salinization of the soil.
During the chemical analysis of plant parts compared to non-irrigated plants, effluent water irrigation did not negatively affect the N, P, K, and Na contents of the grain crop. Furthermore, based on the plant height and SPAD values, it can be concluded that compared to the control values, the applied irrigation waters did not have a negative effect on the two parameters mentioned above.
In summary, in the short term, in water-scarce or unfavorable soil areas, a good alternative could be to irrigate the effluent water of the intensive African catfish farm we studied on a grain sorghum plantation.
Author Contributions
Conceptualization, I.K., Á.K., A.P., C.B., C.G. and M.J.; Data curation, I.K. and Á.K., Formal analysis, I.K.; Funding acquisition, C.B.; Supervision, C.G., Methodology, I.K., Á.K., C.B. and M.J.; Writing—original draft preparation, I.K. and Á.K.; Writing—review and editing, I.K., Á.K. and M.J. All authors contributed critically to the drafts and gave final approval for publication. All authors have read and agreed to the published version of the manuscript.
Funding
This work was supported by the Hungarian Ministry of Agriculture under Project no. OD001, and by the National Research, Development and Innovation Office (GINOP-2.3.3-15-2016-00042 project). We gratefully acknowledge the staff of ÖVKI Lysimeter Station.
Data Availability Statement
The data presented in this study are available on request from the corresponding author. The data are not public, as this study is part of a forthcoming PhD dissertation.
Conflicts of Interest
The authors declare no conflict of interest.
References
- Heaton, E.A.; Clifton-Brown, J.; Voigt, T.B.; Jones, M.B.; Long, S.P. Miscanthus for Renewable Energy Generation: European Union Experience and Projections for Illinois. Mitig. Adapt. Strateg. Glob. Chang. 2004, 9, 433–451. [Google Scholar] [CrossRef]
- Zhao, Y.L.; Dolat, A.; Steinberger, Y.; Wang, X.; Osman, A.; Xie, G.H. Biomass Yield and Changes in Chemical Composition of Sweet Sorghum Cultivars Grown for Biofuel. Field Crops Res. 2009, 111, 55–64. [Google Scholar] [CrossRef]
- Ghatak, H.R. Biorefineries from the Perspective of Sustainability: Feedstocks, Products, and Processes. Renew. Sustain. Energy Rev. 2011, 15, 4042–4052. [Google Scholar] [CrossRef]
- Owusu-Sekyere, E.; Scheepers, M.E.; Jordaan, H. Economic Water Productivities Along the Dairy Value Chain in South Africa: Implications for Sustainable and Economically Efficient Water-Use Policies in the Dairy Industry. Ecol. Econ. 2017, 134, 22–28. [Google Scholar] [CrossRef]
- Simon, S.; Wiegmann, K. Modelling Sustainable Bioenergy Potentials from Agriculture for Germany and Eastern European Countries. Biomass Bioenergy 2009, 33, 603–609. [Google Scholar] [CrossRef]
- Sadia, B.; Saeed Awan, F.; Saleem, F.; Razzaq, A.; Irshad, B. Sorghum an Important Annual Feedstock for Bioenergy. In Biomass Bioenergy-Recent Trends Future Chall; El-Fatah Abomohra, A., Ed.; IntechOpen: London, UK, 2019; ISBN 978-1-78923-987-4. Available online: https://www.researchgate.net/publication/337694786_Sorghum_an_Important_Annual_Feedstock_for_Bioenergy (accessed on 13 May 2022).
- Staggenborg, S.A.; Dhuyvetter, K.C.; Gordon, W.B. Grain Sorghum and Corn Comparisons: Yield, Economic, and Environmental Responses. Agron. J. 2008, 100, 1600–1604. [Google Scholar] [CrossRef]
- Assefa, Y.; Staggenborg, S.A.; Prasad, V.P.V. Grain Sorghum Water Requirement and Responses to Drought Stress: A Review. Crop Manag. 2010, 9, 1–11. [Google Scholar] [CrossRef]
- Plénet, D.; Cruz, P. Maize and Sorghum. In Diagnosis of the Nitrogen Status in Crops; Lemaire, G., Ed.; Springer: Berlin/Heidelberg, Germany, 1997; pp. 93–106. ISBN 978-3-642-64506-8. [Google Scholar]
- Gosling, S.N.; Arnell, N.W. A Global Assessment of the Impact of Climate Change on Water Scarcity. Clim. Chang. 2016, 134, 371–385. [Google Scholar] [CrossRef]
- Mekonnen, M.M.; Hoekstra, A.Y. Four Billion People Facing Severe Water Scarcity. Sci. Adv. 2016, 2, e1500323. [Google Scholar] [CrossRef]
- O’Connor, G.A.; Elliott, H.A.; Bastian, R.K. Degraded Water Reuse: An Overview. J. Environ. Qual. 2008, 37, S-157–S-168. [Google Scholar] [CrossRef]
- Oster, J.D. Irrigation with Poor Quality Water. Agric. Water Manag. 1994, 25, 271–297. [Google Scholar] [CrossRef]
- Kestemont, P. Different Systems of Carp Production and Their Impacts on the Environment. Aquaculture 1995, 129, 347–372. [Google Scholar] [CrossRef]
- WHO. A Regional Overview of Wastewater Management and Reuse in the Eastern Mediterranean Region; CEHA, 2005. Available online: https://apps.who.int/iris/bitstream/handle/10665/116463/dsa759.pdf (accessed on 13 May 2022).
- Kolozsvári, I.; Kun, Á.; Jancsó, M.; Bakti, B.; Bozán, C.; Gyuricza, C. Utilization of Fish Farm Effluent for Irrigation Short Rotation Willow (Salix alba L.) under Lysimeter Conditions. Forests 2021, 12, 457. [Google Scholar] [CrossRef]
- Lin, Y.-F.; Jing, S.-R.; Lee, D.-Y.; Wang, T.-W. Nutrient Removal from Aquaculture Wastewater Using a Constructed Wetlands System. Aquaculture 2002, 209, 169–184. [Google Scholar] [CrossRef]
- Tsuchihashi, N.; Goto, Y. Cultivation of Sweet Sorghum (Sorghum bicolor (L.) Moench) and Determination of Its Harvest Time to Make Use as the Raw Material for Fermentation, Practiced during Rainy Season in Dry Land of Indonesia. Plant Prod. Sci. 2004, 7, 442–448. [Google Scholar] [CrossRef]
- Paterson, A.H. Genomics of Sorghum. Int. J. Plant Genom. 2008, 2008, 1362451. [Google Scholar] [CrossRef]
- Mace, E.S.; Tai, S.; Gilding, E.K.; Li, Y.; Prentis, P.J.; Bian, L.; Campbell, B.C.; Hu, W.; Innes, D.J.; Han, X.; et al. Whole-Genome Sequencing Reveals Untapped Genetic Potential in Africa’s Indigenous Cereal Crop Sorghum. Nat. Commun. 2013, 4, 2320. [Google Scholar] [CrossRef]
- Teetor, V.H.; Duclos, D.V.; Wittenberg, E.T.; Young, K.M.; Chawhuaymak, J.; Riley, M.R.; Ray, D.T. Effects of Planting Date on Sugar and Ethanol Yield of Sweet Sorghum Grown in Arizona. Ind. Crops Prod. 2011, 34, 1293–1300. [Google Scholar] [CrossRef]
- Murray, S.C.; Rooney, W.L.; Hamblin, M.T.; Mitchell, S.E.; Kresovich, S. Sweet Sorghum Genetic Diversity and Association Mapping for Brix and Height. Plant Genome 2009, 2, 48–62. [Google Scholar] [CrossRef]
- Vasilakoglou, I.; Dhima, K.; Karagiannidis, N.; Gatsis, T. Sweet Sorghum Productivity for Biofuels under Increased Soil Salinity and Reduced Irrigation. Field Crops Res. 2011, 120, 38–46. [Google Scholar] [CrossRef]
- Al-Jaloud, A.A.; Hussain, G.; Al-Saati, A.J.; Karimulla, S. Effect of Wastewater Irrigation on Mineral Composition of Corn and Sorghum Plants in a Pot Experiment. J. Plant Nutr. 1995, 18, 1677–1692. [Google Scholar] [CrossRef]
- Flörke, M.; Schneider, C.; McDonald, R.I. Water Competition between Cities and Agriculture Driven by Climate Change and Urban Growth. Nat. Sustain. 2018, 1, 51–58. [Google Scholar] [CrossRef]
- Qi, D.; Yan, J.; Zhu, J. Effect of a Reduced Fertilizer Rate on the Water Quality of Paddy Fields and Rice Yields under Fishpond Effluent Irrigation. Agric. Water Manag. 2020, 231, 105999. [Google Scholar] [CrossRef]
- Abdelraouf, R.E.; Abou-Hussein, S.D.; Badr, M.A.; El-Tohamy, N.M. Safe and Sustainable Fertilization Technology with Using Fish Water Effluent as a New Bio-Source for Fertilizing. Acta Hortic. 2016, 1142, 41–48. [Google Scholar] [CrossRef]
- Guimarães, M.J.M.; Simões, W.L.; Tabosa, J.N.; dos Santos, J.E.; Willadino, L. Cultivation of Forage Sorghum Varieties Irrigated with Saline Effluent from Fish-Farming under Semiarid Conditions. Rev. Bras. Eng. Agrícola Ambient. 2016, 20, 461–465. [Google Scholar] [CrossRef][Green Version]
- Sou/Dakouré, M.Y.; Mermoud, A.; Yacouba, H.; Boivin, P. Impacts of Irrigation with Industrial Treated Wastewater on Soil Properties. Geoderma 2013, 200–201, 31–39. [Google Scholar] [CrossRef]
- Wang, M.; Chen, S.; Chen, L.; Wang, D.; Zhao, C. The Responses of a Soil Bacterial Community under Saline Stress Are Associated with Cd Availability in Long-Term Wastewater-Irrigated Field Soil. Chemosphere 2019, 236, 124372. [Google Scholar] [CrossRef]
- Yang, C.; Wang, X.; Miao, F.; Li, Z.; Tang, W.; Sun, J. Assessing the Effect of Soil Salinization on Soil Microbial Respiration and Diversities under Incubation Conditions. Appl. Soil Ecol. 2020, 155, 103671. [Google Scholar] [CrossRef]
- Arienzo, M.; Christen, E.W.; Quayle, W.; Kumar, A. A Review of the Fate of Potassium in the Soil–Plant System after Land Application of Wastewaters. J. Hazard. Mater. 2009, 164, 415–422. [Google Scholar] [CrossRef]
- Egner, H.; Riem, H.; Domingo, W. Untersuchungen Über Die Chemische Bodenanalyse Als Grundlage Für Die Beurteilung Des Nährstoffzustandes Der Böden. II. Chemische Extraktionsmethoden Zur Phosphor Und Kaliumbestimmung. K. Lantbr. Ann. 1960, 26, 199–215. [Google Scholar]
- Campos, F.S.; Araújo, G.G.L.; Simões, W.L.; Gois, G.C.; Machado Guimarães, M.J.; da Silva, T.G.F.; Rodrigues Magãlhaes, A.L.; Oliveira, G.F.; de Almeida Araujo, C.; Silva, T.S.; et al. Mineral and Fermentative Profile of Forage Sorghum Irrigated with Brackish Water. Commun. Soil Sci. Plant Anal. 2021, 52, 1353–1362. [Google Scholar] [CrossRef]
- Malhotra, H.; Vandana; Sharma, S.; Pandey, R. Phosphorus Nutrition: Plant Growth in Response to Deficiency and Excess. In Plant Nutrients and Abiotic Stress Tolerance; Hasanuzzaman, M., Fujita, M., Oku, H., Nahar, K., Hawrylak-Nowak, B., Eds.; Springer: Singapore, 2018; pp. 171–190. ISBN 978-981-10-9043-1. [Google Scholar]
- Gordon, W.B.; Whitney, D.A. Effects of Phosphorus Application Method and Rate on Furrow-irrigated Ridge-tilled Grain Sorghum. J. Plant Nutr. 2000, 23, 23–34. [Google Scholar] [CrossRef]
- Marschner, H.; Marschner, P. Mineral Nutrition of Higher Plants, 3rd ed.; Elsevier: London, UK; Academic Press: Waltham, MA, USA, 2012; ISBN 978-0-12-384905-2. [Google Scholar]
- Chhipa, B.; Lal, P. Na/K Ratios as the Basis of Salt Tolerance in Wheat. Aust. J. Agric. Resour. Econ. 1995, 46, 533. [Google Scholar] [CrossRef]
- Ahman, S.; Islam Khan, N.; Iqbal, M.Z.; Hussain, A.; Hassan, M. Salt Tolerance of Cotton (Gossypium hirsutum L.). Asian J. Plant Sci. 2002, 1, 715–719. [Google Scholar] [CrossRef]
- Iqbal, N.; Ashraf, M.Y.; Javed, F.; Martinez, V.; Ahmad, K. Nitrate Reduction and Nutrient Accumulation in Wheat Grown in Soil Salinized with Four Different Salts. J. Plant Nutr. 2006, 29, 409–421. [Google Scholar] [CrossRef]
- Rao, D.L.N. The Effects of Salinity and Sodicity upon Nodulation and Nitrogen Fixation in Chickpea (Cicer arietinum). Ann. Bot. 2002, 89, 563–570. [Google Scholar] [CrossRef]
- Rout, N.P.; Shaw, B.P. Salt Tolerance in Aquatic Macrophytes: Possible Involvement of the Antioxidative Enzymes. Plant Sci. 2001, 160, 415–423. [Google Scholar] [CrossRef]
- Calone, R.; Sanoubar, R.; Lambertini, C.; Speranza, M.; Vittori Antisari, L.; Vianello, G.; Barbanti, L. Salt Tolerance and Na Allocation in Sorghum bicolor under Variable Soil and Water Salinity. Plants 2020, 9, 561. [Google Scholar] [CrossRef]
- Sixto, H.; Grau, J.M.; Alba, N.; Alía, R. Response to Sodium Chloride in Different Species and Clones of Genus Populus L. Forestry 2005, 74, 93–104. [Google Scholar] [CrossRef]
- Shannon, M.C.; Grieve, C.M. Tolerance of Vegetable Crops to Salinity. Sci. Hortic. 1998, 78, 5–38. [Google Scholar] [CrossRef]
- Chookhampaeng, S. The Effect of Salt Stress on Growth, Chlorophyll Content Proline Content and Antioxidative Enzymes of Pepper (Capsicum annuum L.) Seedling. Eur. J. Sci. Res. 2011, 49, 103–109. [Google Scholar]
- Sevengor, S.; Yasar, F.; Kusvuran, S.; Ellialtioglu, S. The Effect of Salt Stress on Growth, Chlorophyll Content, Lipid Peroxidation and Antioxidative Enzymes of Pumpkin Seedling. Afr. J. Agric. Res. 2011, 6, 4920–4924. [Google Scholar] [CrossRef]
- Padilla, F.M.; de Souza, R.; Peña-Fleitas, M.T.; Gallardo, M.; Giménez, C.; Thompson, R.B. Different Responses of Various Chlorophyll Meters to Increasing Nitrogen Supply in Sweet Pepper. Front. Plant Sci. 2018, 9, 1752. [Google Scholar] [CrossRef] [PubMed]
- Almodares, A.; Sharif, M.E. Effects of Irrigation Water Qualities on Biomass and Sugar Contents of Sugar Beet and Sweet Sorghum Cultivars. J. Environ. Biol. 2007, 28, 213–218. [Google Scholar] [PubMed]
- Katerji, N.; Van Hoorn, J.W.; Hamdy, A.; Mastrorilli, M.M.; Mou, E. Osmotic Adjustment of Sugar Beets in Response to Soil Salinity and Its Influence on Stomatal Conductance, Growth and Yield. Agric. Water Manag. 1997, 34, 57–69. [Google Scholar] [CrossRef]
- Hussein, M.M.; Abdel-Kader, A.A.; Kady, K.A.; Youssef, R.A.; Alva, A.K. Sorghum Response to Foliar Application of Phosphorus and Potassium with Saline Water Irrigation. J. Crop Improv. 2010, 24, 324–336. [Google Scholar] [CrossRef]
- Ayers, R.S.; Westcot, D.W. Water Quality for Agriculture; FAO Irrigation and Drainage Paper; Food and Agriculture Organization of the United Nations: Rome, Italy, 1985; ISBN 978-92-5-102263-4. [Google Scholar]


Publisher’s Note: MDPI stays neutral with regard to jurisdictional claims in published maps and institutional affiliations. |
© 2022 by the authors. Licensee MDPI, Basel, Switzerland. This article is an open access article distributed under the terms and conditions of the Creative Commons Attribution (CC BY) license (https://creativecommons.org/licenses/by/4.0/).