Article

Soil Waterlogging Conditions Affect Growth, Water Status, and Chlorophyll “a” Fluorescence in Coffee Plants (Coffea arabica L.)

by
Andrés Felipe León-Burgos
1,2,
Carlos Andrés Unigarro
3 and
Helber Enrique Balaguera-López
2,*
1
Department of Fitotecnia, Centro Nacional de Investigaciones del café, Cenicafé, Manizales 170009, Colombia
2
Departamento de Agronomía, Facultad de Ciencias Agrarias, Universidad Nacional de Colombia, Sede Bogotá, Carrera 30 No. 45-03 Edificio 500, Bogotá 111321, Colombia
3
Department of Plant Physiology, Centro Nacional de Investigaciones del Café -Cenicafé, Manizales 170009, Colombia
*
Author to whom correspondence should be addressed.
Agronomy 2022, 12(6), 1270; https://doi.org/10.3390/agronomy12061270
Submission received: 23 April 2022 / Revised: 20 May 2022 / Accepted: 23 May 2022 / Published: 26 May 2022
(This article belongs to the Special Issue Coffee—from Plant to Cup)

Abstract

:
Soil waterlogging is an environmental limitation that is promoted by changes in rainfall patterns and negatively affects plant physiology, growth, and development, coffee production, and exports in Colombia. The objective of this research was to evaluate responses in growth, water status, and chlorophyll fluorescence parameters for plants under different waterlogging conditions. The evaluations were carried out on six-month-old “Cenicafé 1” variety seedlings that were suitable for establishment in the field. The seedlings were subjected to different waterlogging periods: 4, 8, 12, and 16 days, using a completely randomized block experiment design with 30 replicates. Total dry mass (TDM), total leaf area (TLA), and the total number of leaves (TNL) were performed, and growth indices were calculated. The leaf water potential (Ψpd and Ψmd), maximum efficiency of photosystem II-FV/Fm, and electron transport rate (ETR) were also measured. Waterlogging for 16 days caused a 57% reduction for TDM, which was significant starting at 4 days. Statistical differences in the TLA were detected after 12 days, with decreases of 29%. The Ψpd, Ψmd, Fv/Fm, and ETR were sensitive to waterlogging, which decreased noticeably after 8 days. The results indicated the physiological performance and growth of the coffee cv. “Cenicafé 1” plants were significantly affected by waterlogging conditions after eight days.

1. Introduction

The coffee species Coffea arabica L. is sensitive to climate change, and there is a great concern because it is one of the most commercialized agricultural products worldwide and provides around 70% of coffee production given its higher beverage quality [1,2,3]. Recently, climate change has resulted in alterations in precipitation patterns that have increased the frequency of extreme events with heavy rain, promoting flooding or waterlogging in soil, a climatic limitation for coffee productivity [4,5]. Greater intensity and frequency are expected for Latin American countries such as Colombia [4,6], the third-largest producer of C. arabica worldwide and one of the leaders in high-quality coffee [7,8].
Flooding conditions have been reported in the soil of cultivable areas for coffee in Colombia (approximately 840,000 hectares), particularly under “La Niña” conditions and in regions with rainfall greater than 2500 mm per year [9,10,11,12]. “La Niña” events (known as the cold phase of the El Niño Southern Oscillation phenomenon (ENSO)) are characterized by increases in both the intensity and abundance of rainfall and soil moisture, and decreases in temperature and sunlight, with reductions in coffee production and exports in Colombia [7,9]. In fact, during the climatic variations generated by “La Niña” events from 2010 to 2011 in Colombia, economic losses of approximately 7.8 million dollars were recorded [7,10]. This has generated great concern because 540,000 families depend economically on coffee production in Colombia [11], and these climatic phenomena may promote soil waterlogging conditions and reduce sustainably cultivable areas in the coming decades [13,14].
Waterlogging refers to the soil water content reaching or approaching saturation [15] and is abiotic-type stress that gradually reduces oxygen levels in the soil (hypoxia) and affects important root processes such as growth, water absorption, nutrient uptake, and transport by the xylem to the shoot, altering important physiological functions in plants such as gas exchange processes, carbon metabolism, and growth and production in plants [4,16]. In C. arabica, it has been reported that the growth of leaves, stems, and roots in plants subjected to waterlogging conditions is inhibited [17]. This result has been associated with early stomatal closure, which is caused by decreases in root hydraulic conductance or ABA concentrations, which limit photosynthetic rates, the carboxylation rate of RuBisCo (ribulose-1,5-bisphosphate carboxylase /oxygenase), and the loss of water status in plants [18,19]. Under prolonged waterlogging conditions, photosynthetic performance is impaired at the photochemical and biochemical levels, mainly because the flow of electron transfer is interrupted in the photosystems to increase lipid peroxidation processes because of the production of reactive oxygen species (ROS), which increases the degradation of photosynthetic pigments and leads to an excess accumulation of energy excitation at the photosystem level, which can trigger a more severe oxidative stress that affects carbon metabolism [4,16,18].
However, there is little information on the effect of soil waterlogging conditions on C. arabica plants [4]. The physiological alterations caused by increases in water in the soil must be known because plants can trigger various responses depending on the intensity and duration of the stress [14]. The objective of this research was to evaluate responses in growth, water status, and photochemical efficiency in coffee “Cenicafé 1” variety seedlings subjected to different waterlogging periods during the nursery stage and grown under semi-controlled conditions in the central coffee zone of Colombia. Alterations in growth parameters, such as the total number of leaves, leaf area, total dry mass, and physiological performance through leaf water potentials and chlorophyll “a” fluorescence were studied. This information is necessary to know how coffee plants behave under waterlogging conditions and to understand the detrimental effects that this stress generates on the physiological performance of C. arabica “Cenicafé 1” variety plants, which are widely sown in the coffee zone of Colombia.

2. Materials and Methods

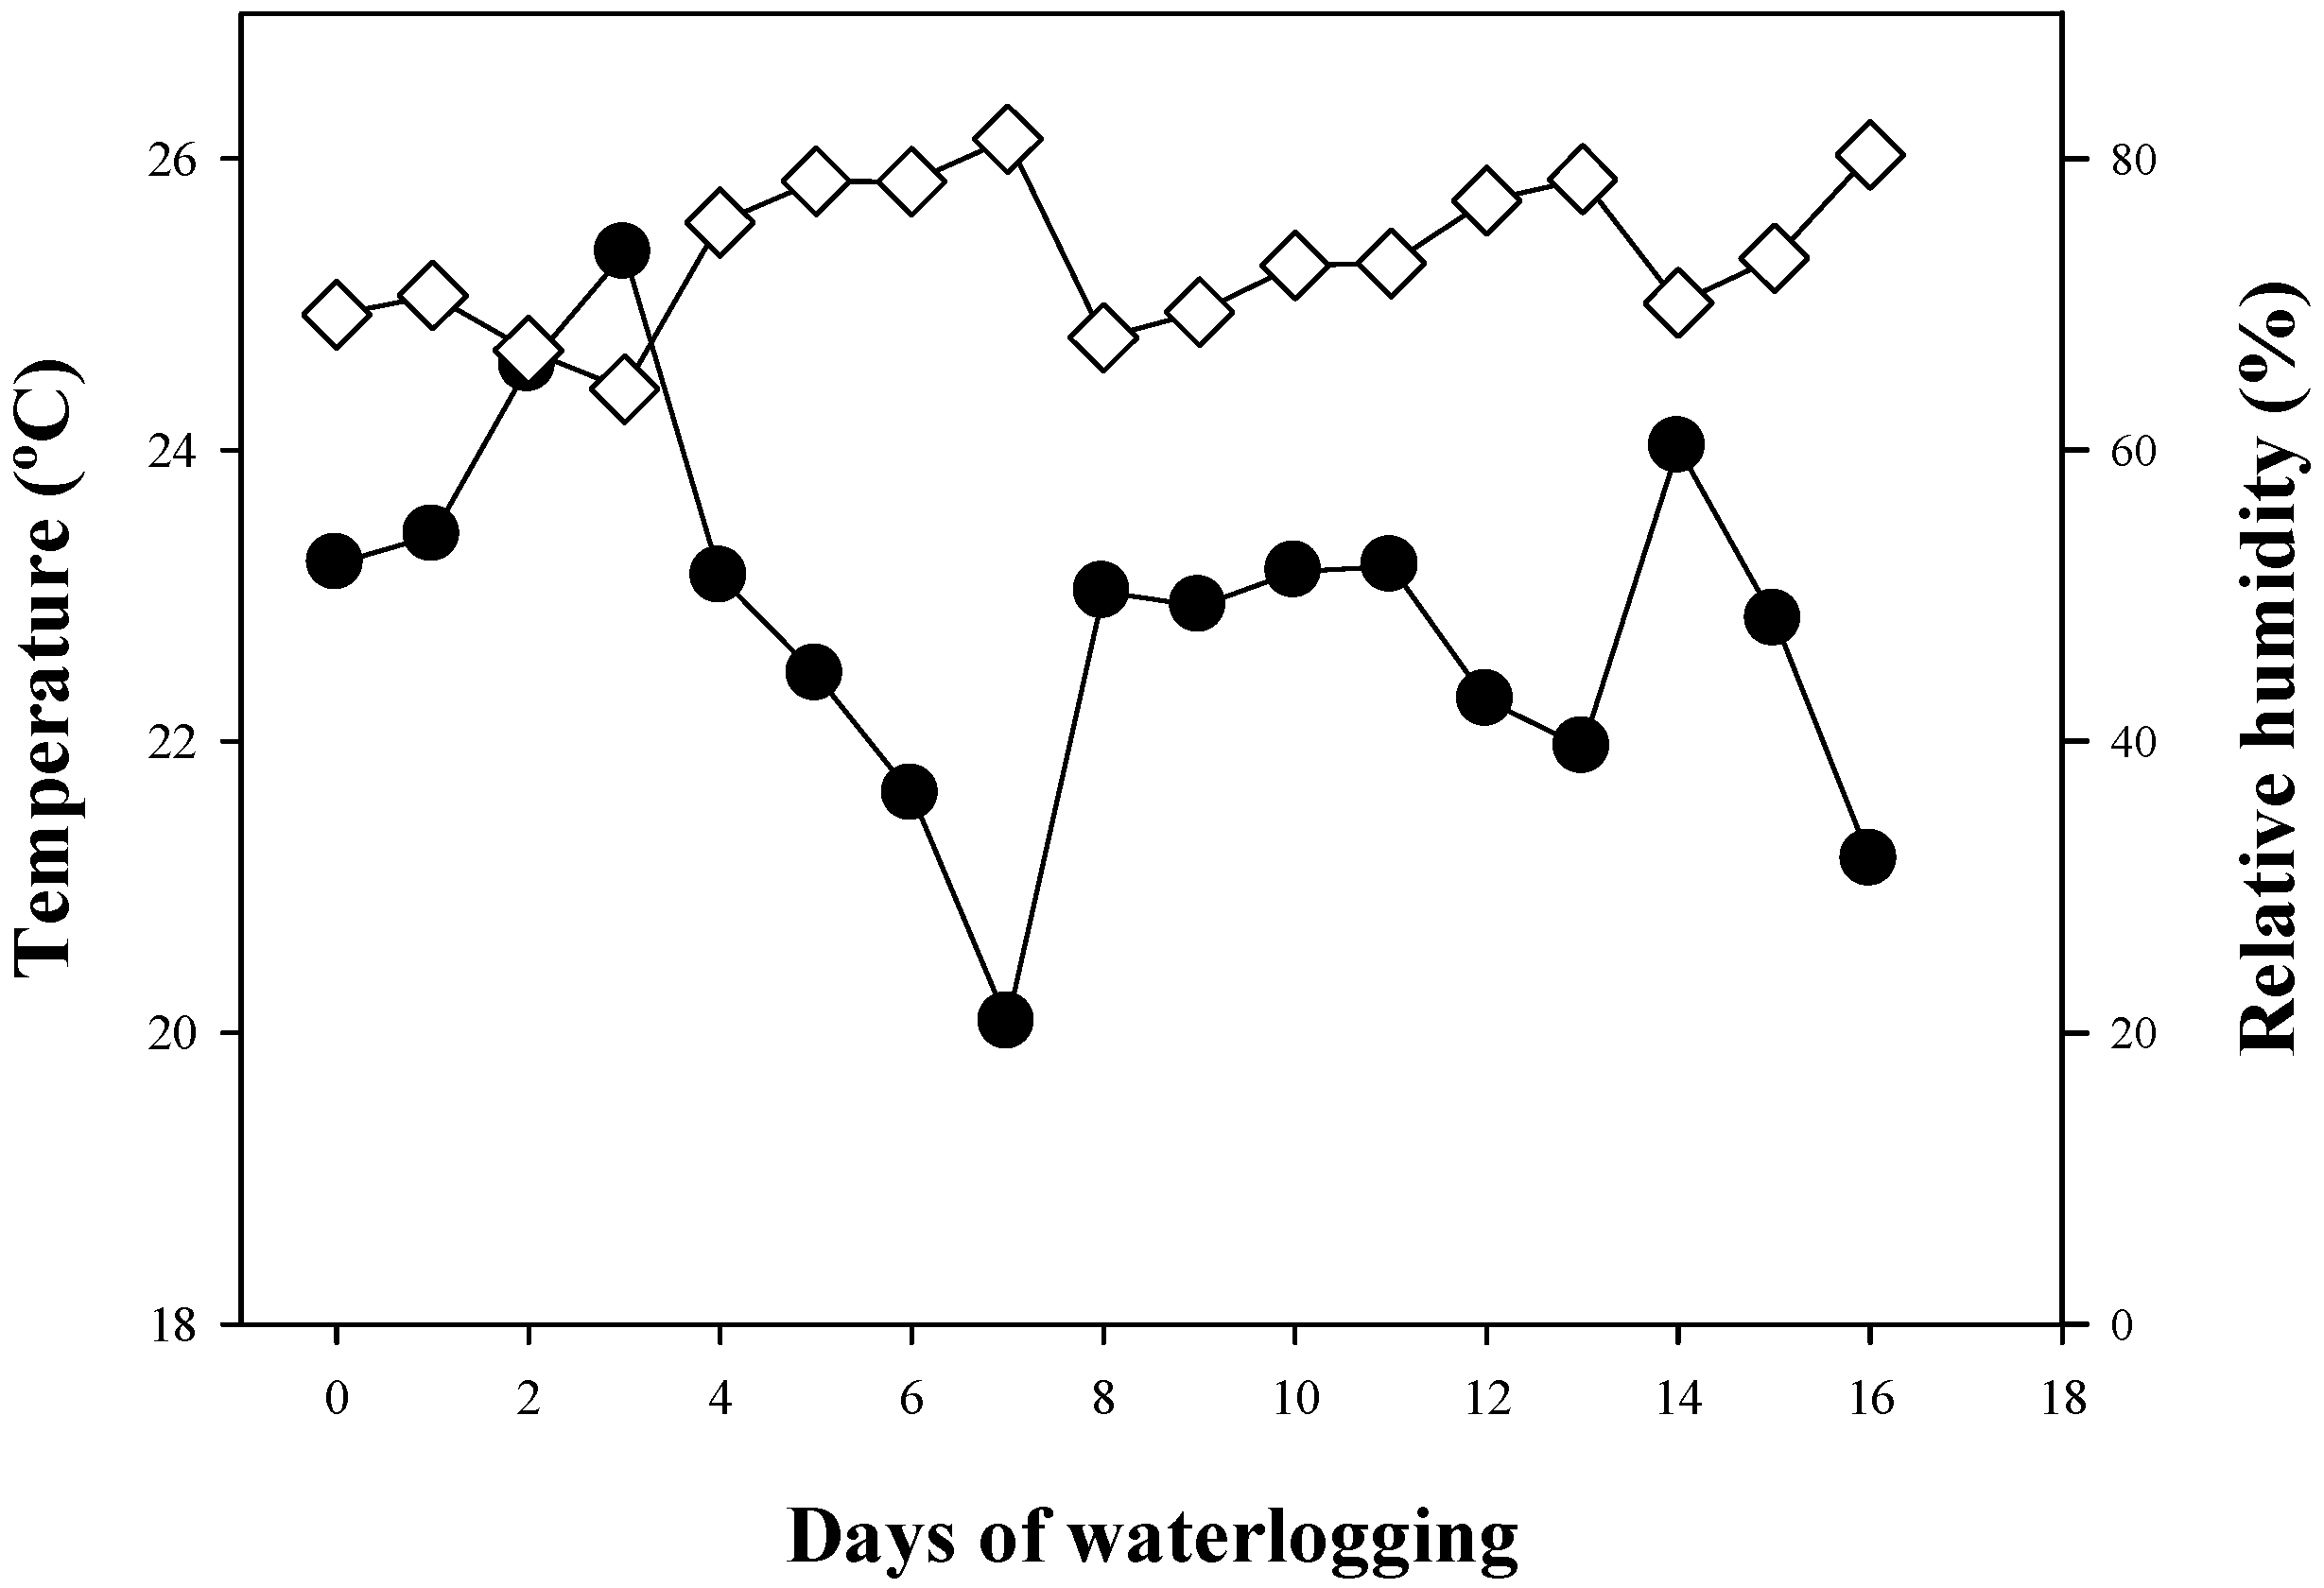
2.1. Plant Material, Growth Conditions, and Treatments

This experiment was carried out under semi-controlled conditions in a greenhouse with “Cenicafé 1” variety seedlings established at “Plan Alto” at the National Coffee Research Center-Cenicafé, located in Manizales, Department of Caldas, Colombia (4°59′26.83″ N; 75°35′27.09″ W), at 1384 m.a.s.l. This material is resistant to coffee rust (Hemileia vastatrix) and coffee cherry-CBD disease (Colletotrichum kahawae) [20] and, currently, together with other resistant varieties, makes up approximately 80% of the cultivable area for coffee in Colombia [21]. During the study, the greenhouse was under average climatic conditions: 23.04 °C and 72.93% relative humidity (Figure 1), with a maximum photosynthetically active radiation-PAR of 613.22 µmol m−2 s−1 at noon. The environmental temperature and relative humidity were measured with an HMP60 sensor, and PAR was measured with an SQ-110 sensor connected to an automatic data transmission system, every five minutes.
The seedlings were transplanted in June 2021, 75 days after sowing seeds at the BBCH10 phenological stage, when the cotyledonary leaves were fully expanded, as reported by Arcila-Pulgarín et al. [22]. The transplant was carried out in 17 cm × 23 cm polyethylene bags with a mixture of solarized soil and decomposed coffee pulp, at a 3:1 (v/v) ratio. The fertilization was performed with 2 g of DAP (18-46-0), applied at two, four, and five months after transplantation, as reported by Sadeghian [23]. All agronomic practices recommended by Gaitán et al. [24] were carried out for the management of the brown eyespot disease and the pest known as mealybug, which limits the growth of coffee seedlings. After six months, considered a suitable age for establishment in the field, the plants were transplanted into cylindrical containers, 25 cm in diameter × 20 cm in height (one plant per container), with a sandy loam soil (Table 1). The containers were fitted with plastic bags to prevent water filtration and guarantee water saturation levels in the soil for each treatment. Soil was added to the containers for a length of between 15 and 17 cm, for the maximum capacity (9.8 L). Tensiometers (Model SR, Irrometer Company, Riverside, CA, USA) were also installed to monitor soil moisture and determine when to irrigate the plants to maintain field capacity.
The waterlogging treatments were applied in December 2021 to the coffee plants, as follows: (T1) plants with good water supply conditions, where moisture was kept at field capacity between 0 and 0.033 MPa (control); (T2) plants under waterlogging conditions for 4 days; (T3) 8 days; (T4) 12 days; and (T5) 16 days. The treatments consisted of keeping a layer of water between 3 and 5 cm above the ground in containers daily. The application method was carried out according to the duration of the waterlogging, which was initially the treatment with the longest duration (16 days), and the others were successively applied until reaching 4 days of treatment (Figure 2). This procedure was carried out to ensure that the plants remained under the same time and climatic conditions. All measurements were taken 16 days after applying the waterlogging treatments.

2.2. Growth Measurements

Measurements of the total number of leaves (TNL), total leaf area (TLA), and dry mass of the plants (DM) were taken. The TNL was determined with direct counts on the plants, and the leaf area was calculated by measuring the length and width of each fully expanded leaf and applying the equation [1], as proposed by Unigarro-Muñoz et al. [25]:
EAF = 0.99927 × (Length × (−0.14757 + 0.60986 × Width))
where EAF is the estimate of leaf area, length is leaf length, and width is leaf width.
For the DM of the plants, each organ was taken separately (leaves, stem, and roots) and placed in labeled paper bags. The samples were dried in an oven at 65 °C for 72 h. Subsequently, they were weighed on a 0.01 g precision balance, where the dry mass of the leaves (LDM), stem (SDM), roots (RDM), and total dry mass of the plants (TDM) were determined. According to Ávila et al. [26], the DM partition was calculated as the leaf mass ratio (LMR or LAR: LDM/TDM), the stem mass ratio (SMR: SDM/TDM), and the root mass ratio (RMR: RDM/TDM), as well as the RDM/TLA ratio, as an approximate measurement of the hydraulic conductance of the plants. Finally, indirect growth measures were estimated, such as the specific leaf area (SLA: TLA/LDM) and the ratio of the aerial part to the root (R/SR: LDM + SDM/RDM).

2.3. Physiological Measurements

2.3.1. Plants Water Relations

To measure the water status of the plants, the water potential was recorded at predawn-Ψpd (4:00–5:00 h) and midday-Ψmd, using a Scholander pressure chamber (model 600, PMS Instruments Company, Albany, OR, USA) on fully developed leaves, selected from the second pair of leaves from the apex of the plant. A total of eight leaves were taken for each treatment, selected randomly. The leaves were cut at a bevel from the petiole, and then the cut surface was cleaned with deionized water and filter paper to remove waste. Subsequently, the leaves were stored in zip-lock bags containing moist paper towels. The leaves were then introduced into a Scholander chamber with the petiole cut exposed to atmospheric pressure. Compressed nitrogen was slowly applied in the pressure chamber until the xylem sap bubbled. This pressure was recorded.

2.3.2. Chlorophyll “a” Fluorescence Parameters

Fluorescence parameters were measured using a Fluorpen modulated fluorometer (FFP 100-MAX-LM, Photon Systems Instruments, Czechia) and 1 light saturation pulse of 3000 µmol photons m−2 s−1 and 1 actinic pulse of 350 µmol photons m−2 s−1 for 60 s−1 in fully developed leaves selected from the second pair of leaves from the apex of the plant. Eight leaves were used for each treatment. The measurements were taken from 4:00 to 5:00 h, when leaves were naturally dark-adapted. As a result, the maximum photochemical efficiency of PSII (Fv/Fm) was calculated. The relative electron transport rate of PSII-ETR was calculated with equation [2], as proposed by Genty et al. [27].
ETR = 0.5 × 0.8 × PAR × Φ PSII
where 0.5 is a factor that assumes the equal distribution of energy between the two photosystems, 0.8 is the coefficient of light absorbance, and PAR is from the fluorometer.

2.4. Experiment Design and Statistical Analysis of Data

For the data analysis, a randomized complete block design with 30 replications was used. Analysis of variance (ANOVA) was performed using the F statistic at 5% significance after fulfilling the assumptions of normality (Kolmogorov–Smirnov test) and homogeneity of variances (Levene’s test). Post hoc tests for the comparison of means using Tukey (p < 0.05). TNL, R/SR, RDM/TLA, DM partition of the leaf, LAR, Fv/Fm, and ETR were analyzed by the Games–Howell test (p < 0.05) for measurements with a heterogeneity of variances. Spearman correlation analyses were performed between the growth parameters TNL, TLA, TDM, R/SR, RDM/TLA, and SLA and physiological parameters Ψpd, Ψmd, Fv/Fm, and ETR to find the linear relationships using the Psych statistical package [28]. All statistical analyses were performed with the R software version 3.6.0 (Vienna, Austria) [29].

3. Results

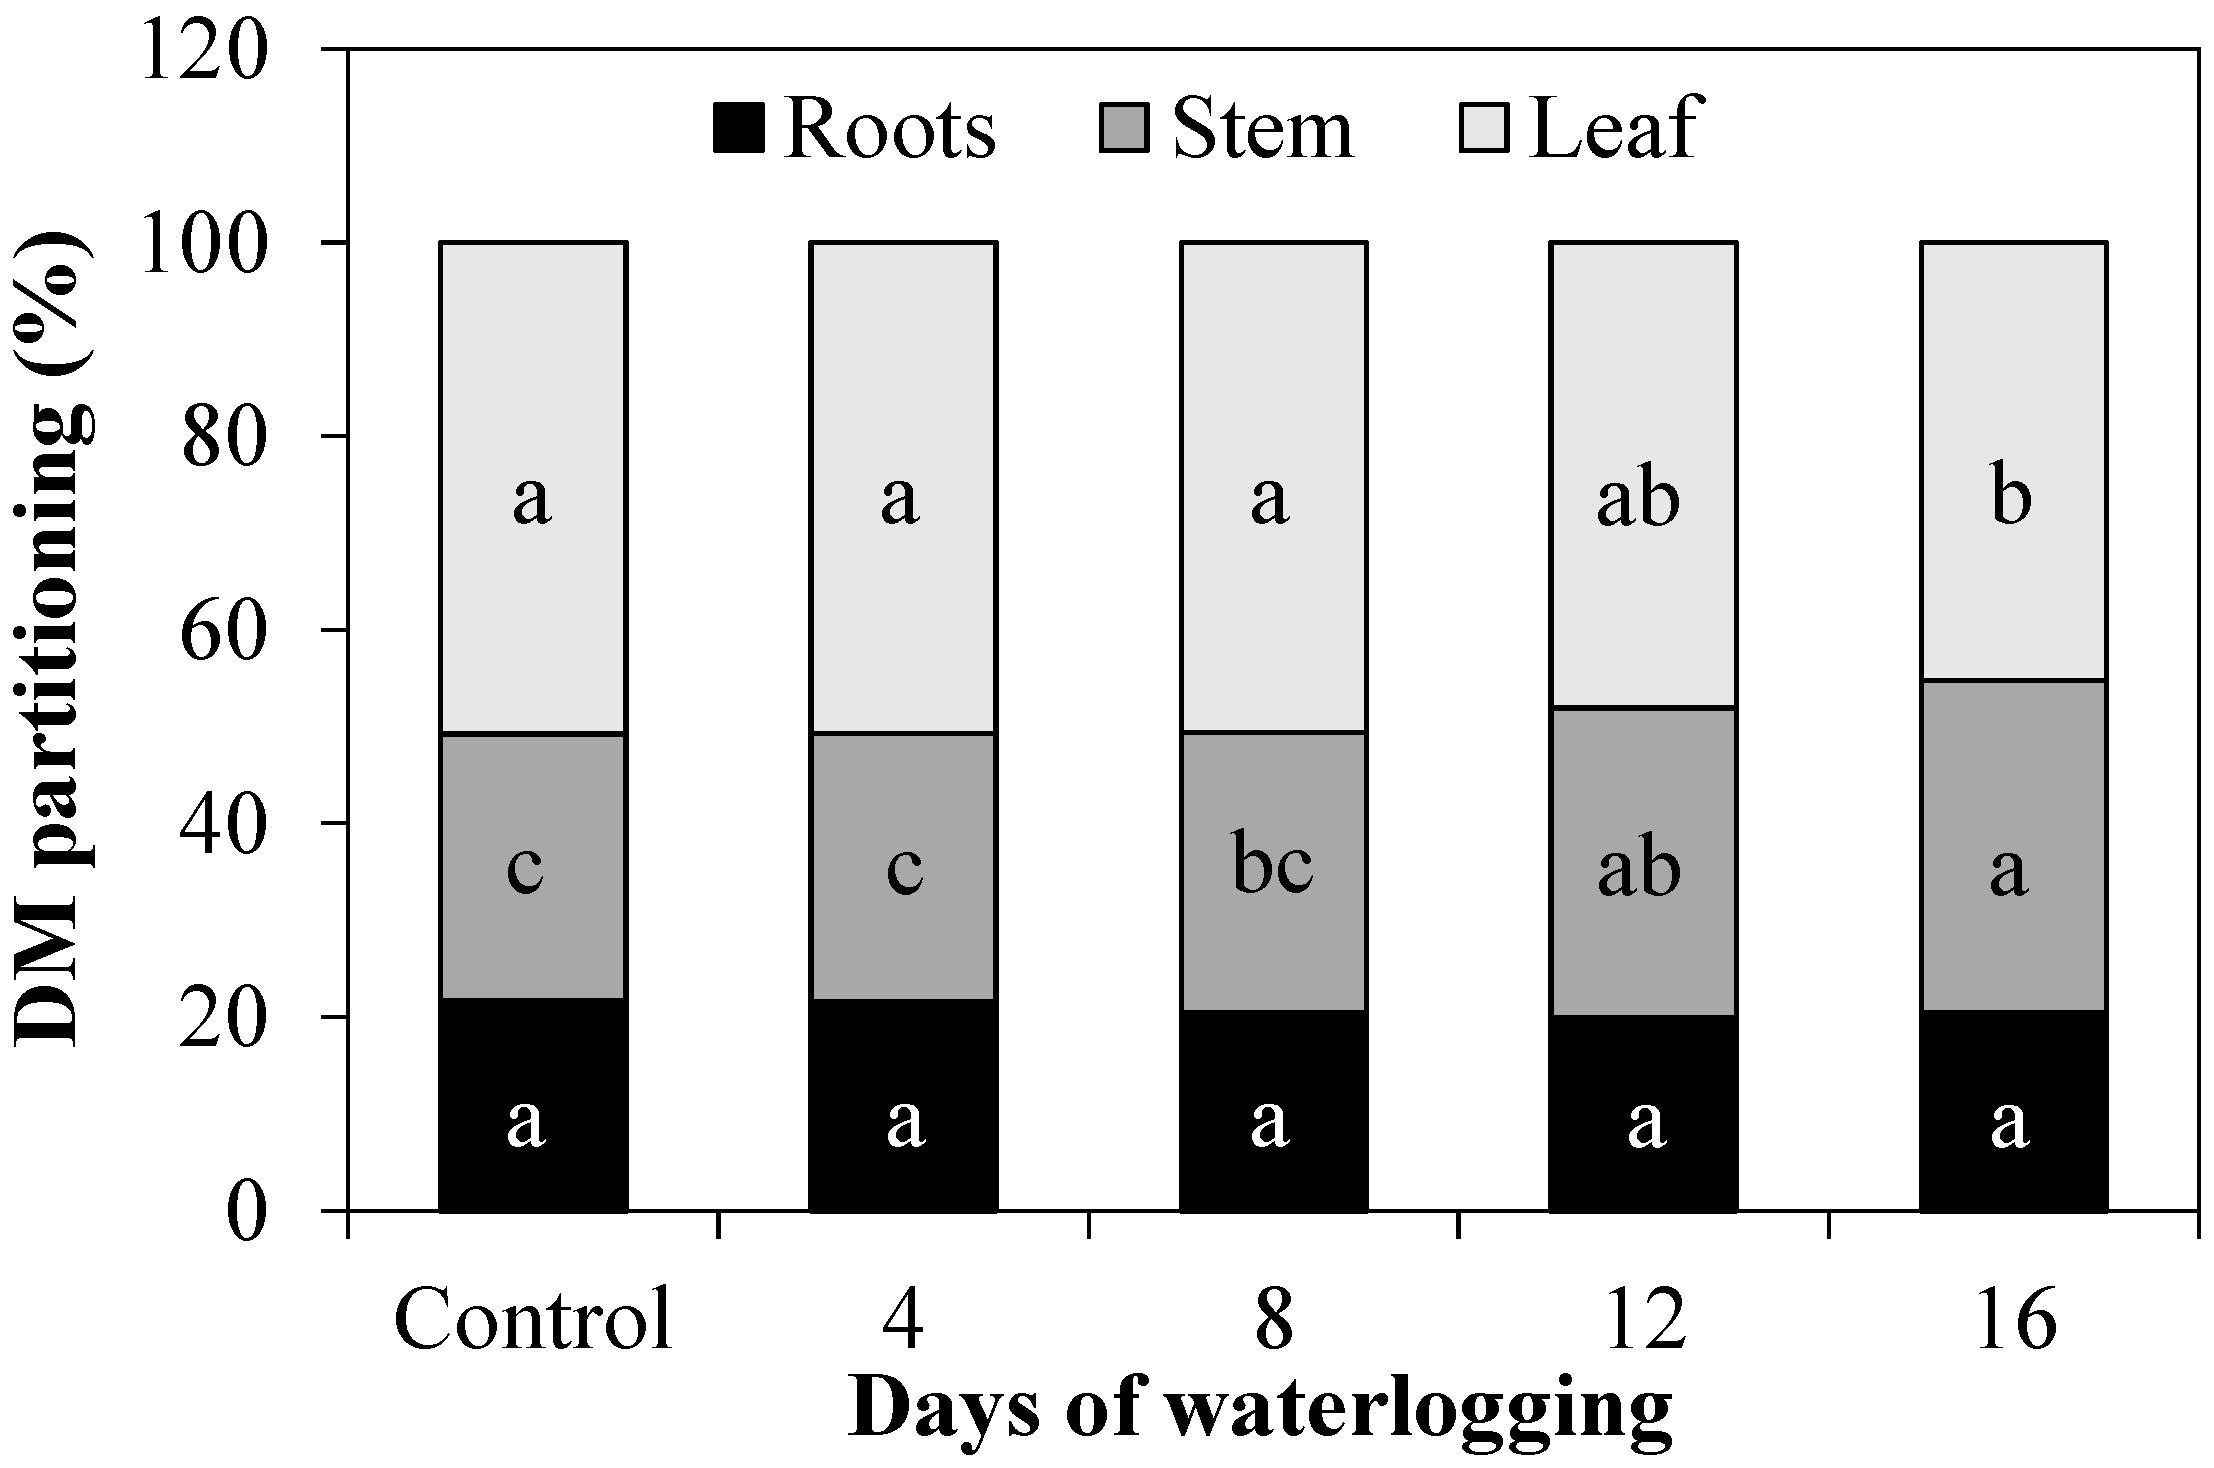
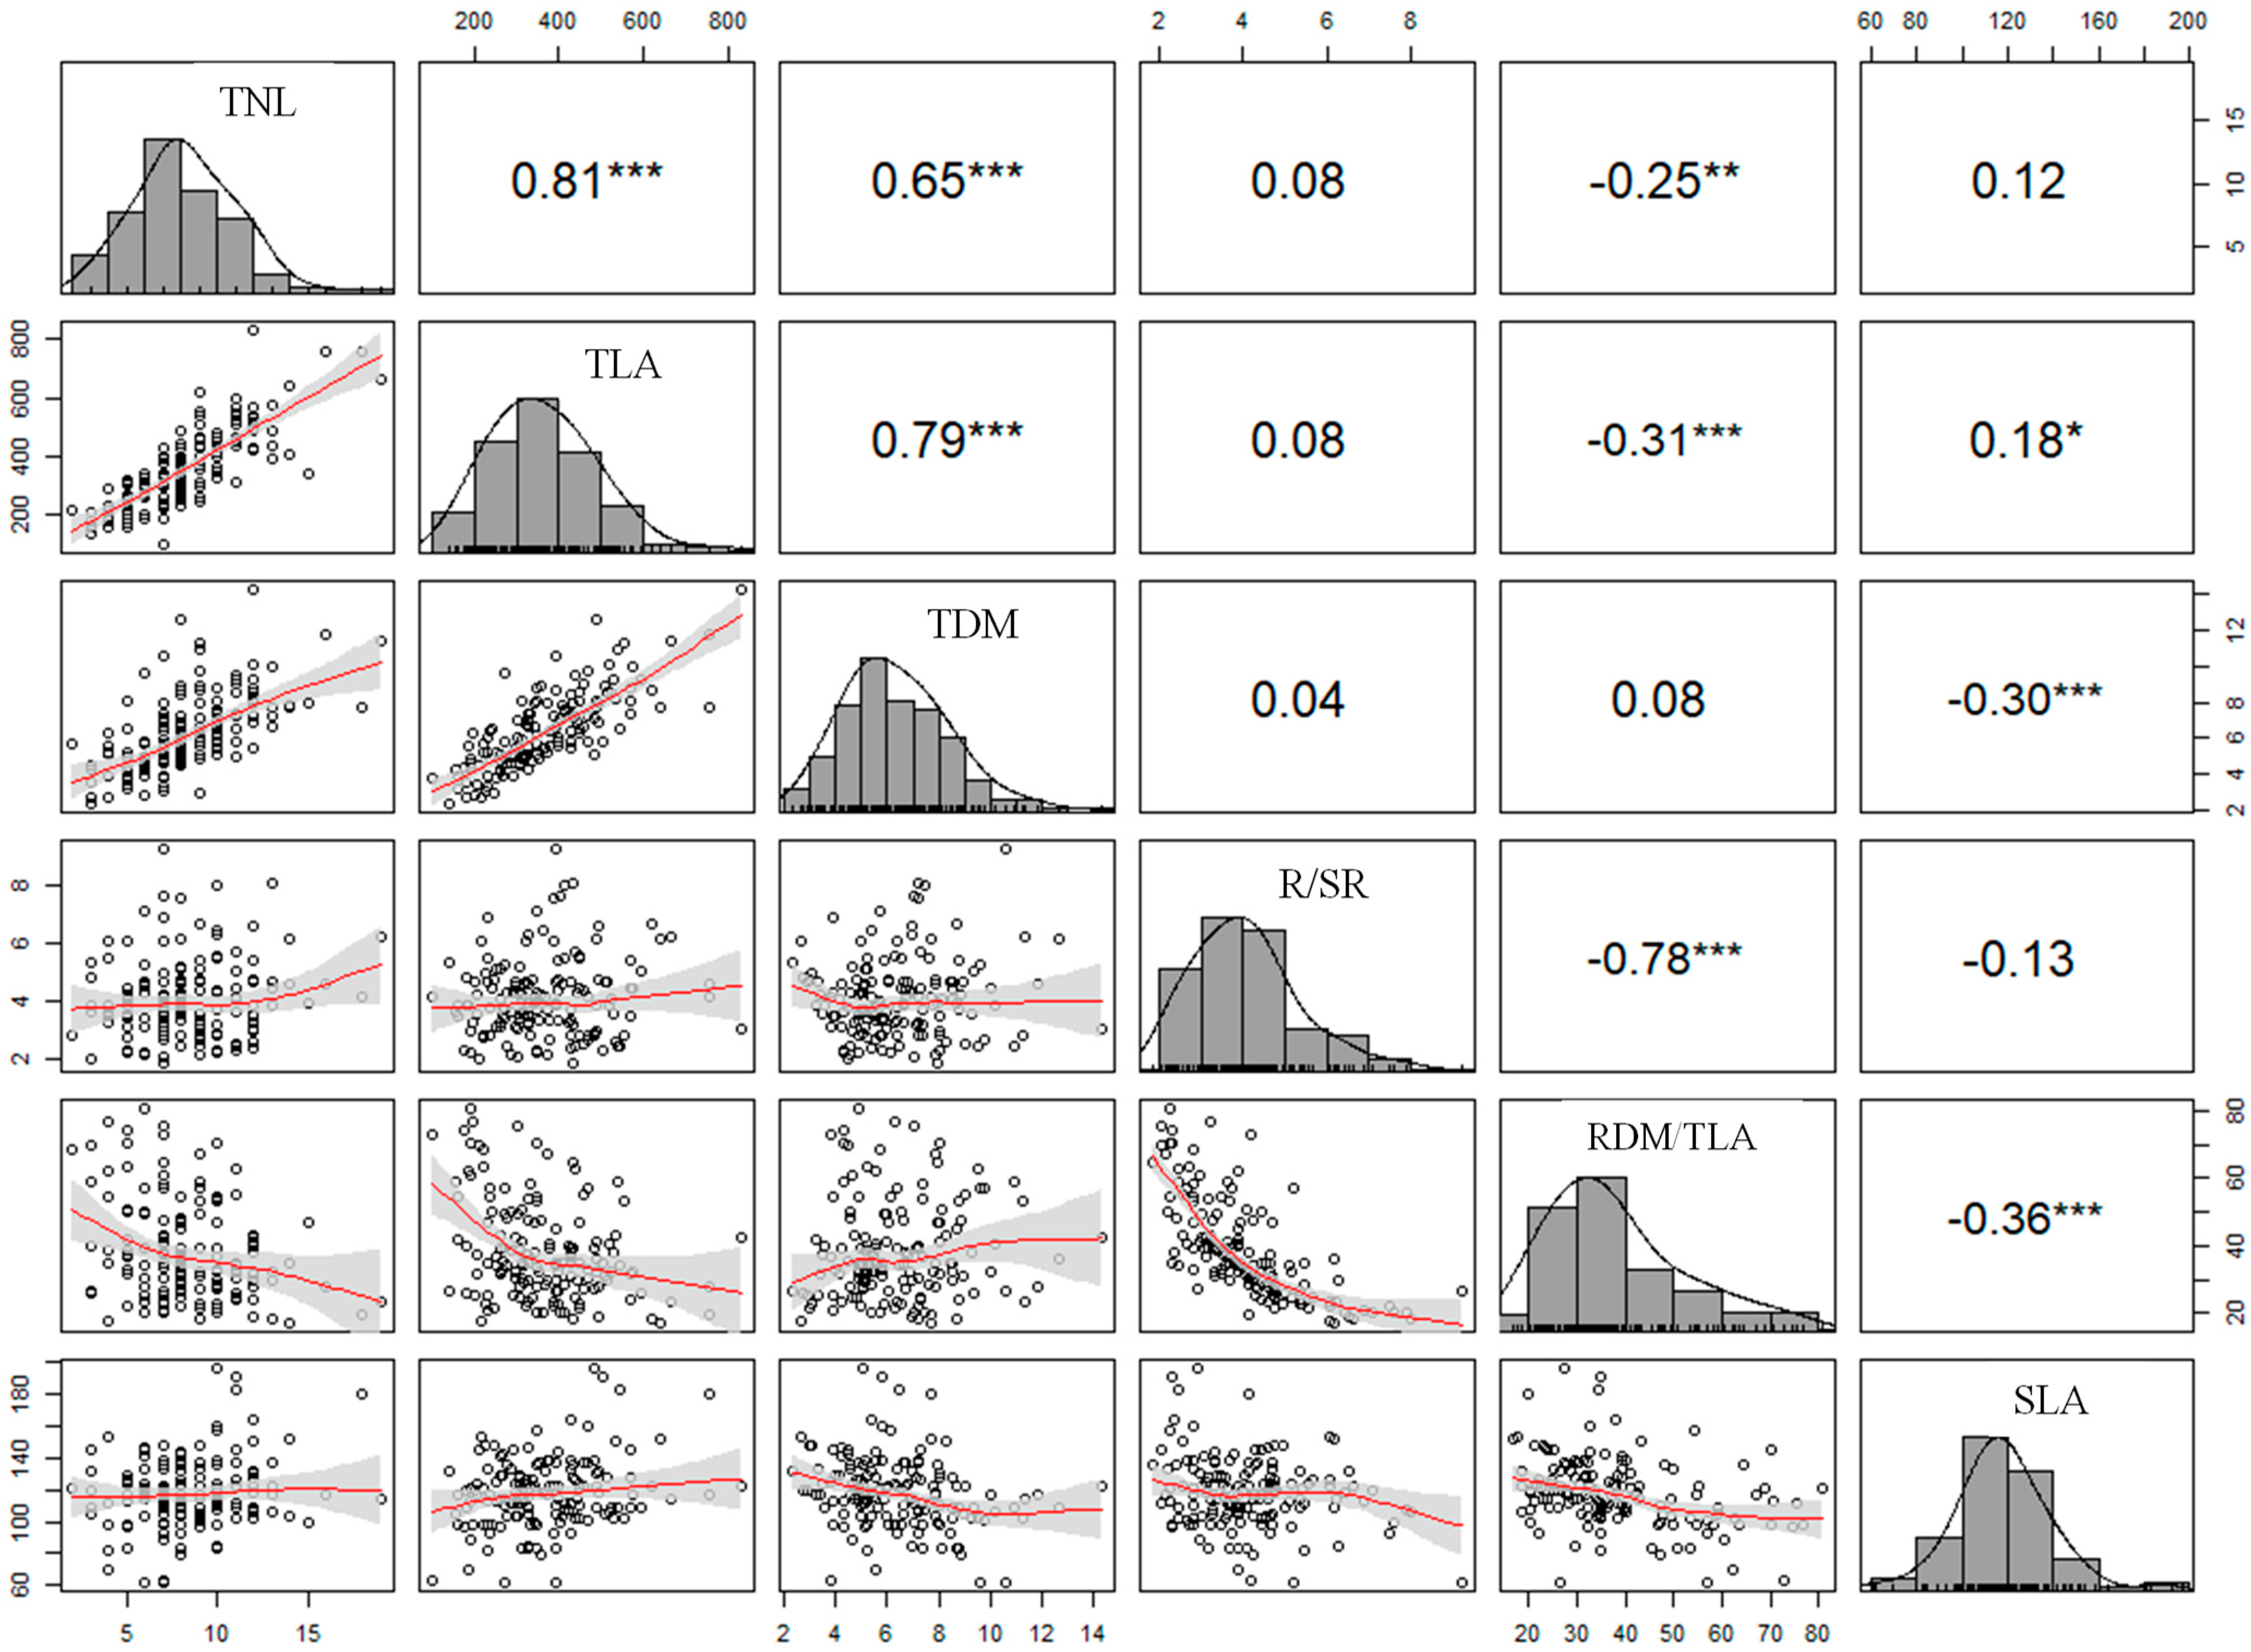
3.1. Growth Parameters and Symptoms

The periods of waterlogging generated different visual responses in the symptoms of the plants. At 4 days, symptoms of foliar epinasty were observed throughout the plant, very pronounced in the apical meristem with a loss of turgidity in the leaves. After 8 days, moderate chlorosis appeared in the mature leaves. Subsequently, after 12 days, the symptoms of chlorosis are recorded throughout the plant with cell death in the leaves. Finally, at 16 days, leaf wilting intensified throughout the plant and advanced to the apical meristem (Figure 3).
The effect of waterlogging in the soil on plant growth parameters saw considerable decreases in TNL, TLA, and TDM. Reductions between 17% for TNL and 14% for TLA were recorded at 8 days of waterlogging, although significant differences were reported after 12 days, with decreases from 22% to 39% for TLN and 30% to 44% for TLA, as compared to the control plants (Figure 4a,b). These results indicated that the plants under waterlogging generated a considerable loss of leaves. The TDM was very sensitive to the waterlogging conditions, and significant differences were detected after 4 days, with reductions from 14% to 44% at 16 days, which were proportional to the increases in the waterlogging periods (Figure 4c).
This study analyzed whether waterlogging conditions generate changes in the DM partition of plants. It was observed that there was a negative effect from 12 days of waterlogging on the accumulation of DM in the leaves (48%), with statistical differences after 16 days compared to the control plants (51% leaves). In addition, the plants under waterlogging conditions in the soil generated a 2% decrease in the DM accumulation of the roots, recorded from 8 days (Figure 5). This result could indicate restrictions in essential physiological processes for growth and development in plants.
On the other hand, the growth indices, such as LAR, SLA, R/SR, and RDM/TLA, were affected according to the periods of waterlogging. For LAR, decreases of 10% were observed with significant differences detected at 16 days compared to control plants. The SLA was very sensitive to waterlogging conditions and increased from 7% after 4 days. On the other hand, the R/SR increased between 9% and 13% at 8 days of waterlogging as compared to the control plants. These results indirectly demonstrated that there was a decrease in the DM accumulation of the aerial part of the plants, particularly with significant reductions in the DM accumulation of the leaves and TLA in the plants subjected to waterlogging. Notably, the RDM/TLA ratio of the plants was also affected by soil waterlogging, generating reductions of 10% to 15% from 4 to 16 days. This growth parameter was sensitive to waterlogging since the DM accumulation in the roots was affected by these stress conditions (Table 2).
Generally, there was a direct association between the growth parameters TNL, TLA, TDM, R/SR, RDM/TLA, and SLA evaluated in the plants with different waterlogging conditions and control plants. In fact, for the TNL, TLA, and TDM, there was a significant positive correlation (p < 0.0001). The opposite occurred for the RDM/TLA and SLA parameters, which showed a low, negative correlation that was significant (p < 0.0001) concerning the other growth parameters evaluated, except for the association between SLA and TLA, which had a low, positive correlation that was significant (p < 0.05), as well as a high, negative, and significant correlation (p < 0.0001) between RDM/TLA and R/SR. There was no correlation between RMD/TLA and TDM and SLA with TNL and R/SR. Likewise, the R/SR did not correlate with the TNL, TLA, and TDM (Figure 6).

3.2. Plant Water Relations

The duration of the waterlogging stress significantly altered Ψpd and Ψmd concerning the control plants. In general, average values of Ψpd − 0.39 and Ψmd − 1.06 MPa were recorded in the control plants throughout the study. At 8 days of waterlogging, a significant reduction (p < 0.05) was observed in Ψpd − 3.50 MPa, as compared to the control plants (Ψpd − 0.39 MPa). This trend was maintained at 12 (Ψpd − 3.61 MPa) and 16 days (Ψpd − 3.21 MPa). The opposite occurred in the plants subjected to 4 days of waterlogging, where a slight decrease in the average values of Ψpd (−1.28 MPa) was recorded, which were statistically similar to the control plants (Figure 7a). Ψmd was more negative than Ψpd and had a similar tendency to progressively reduce after 8 days of waterlogging (Figure 7b).

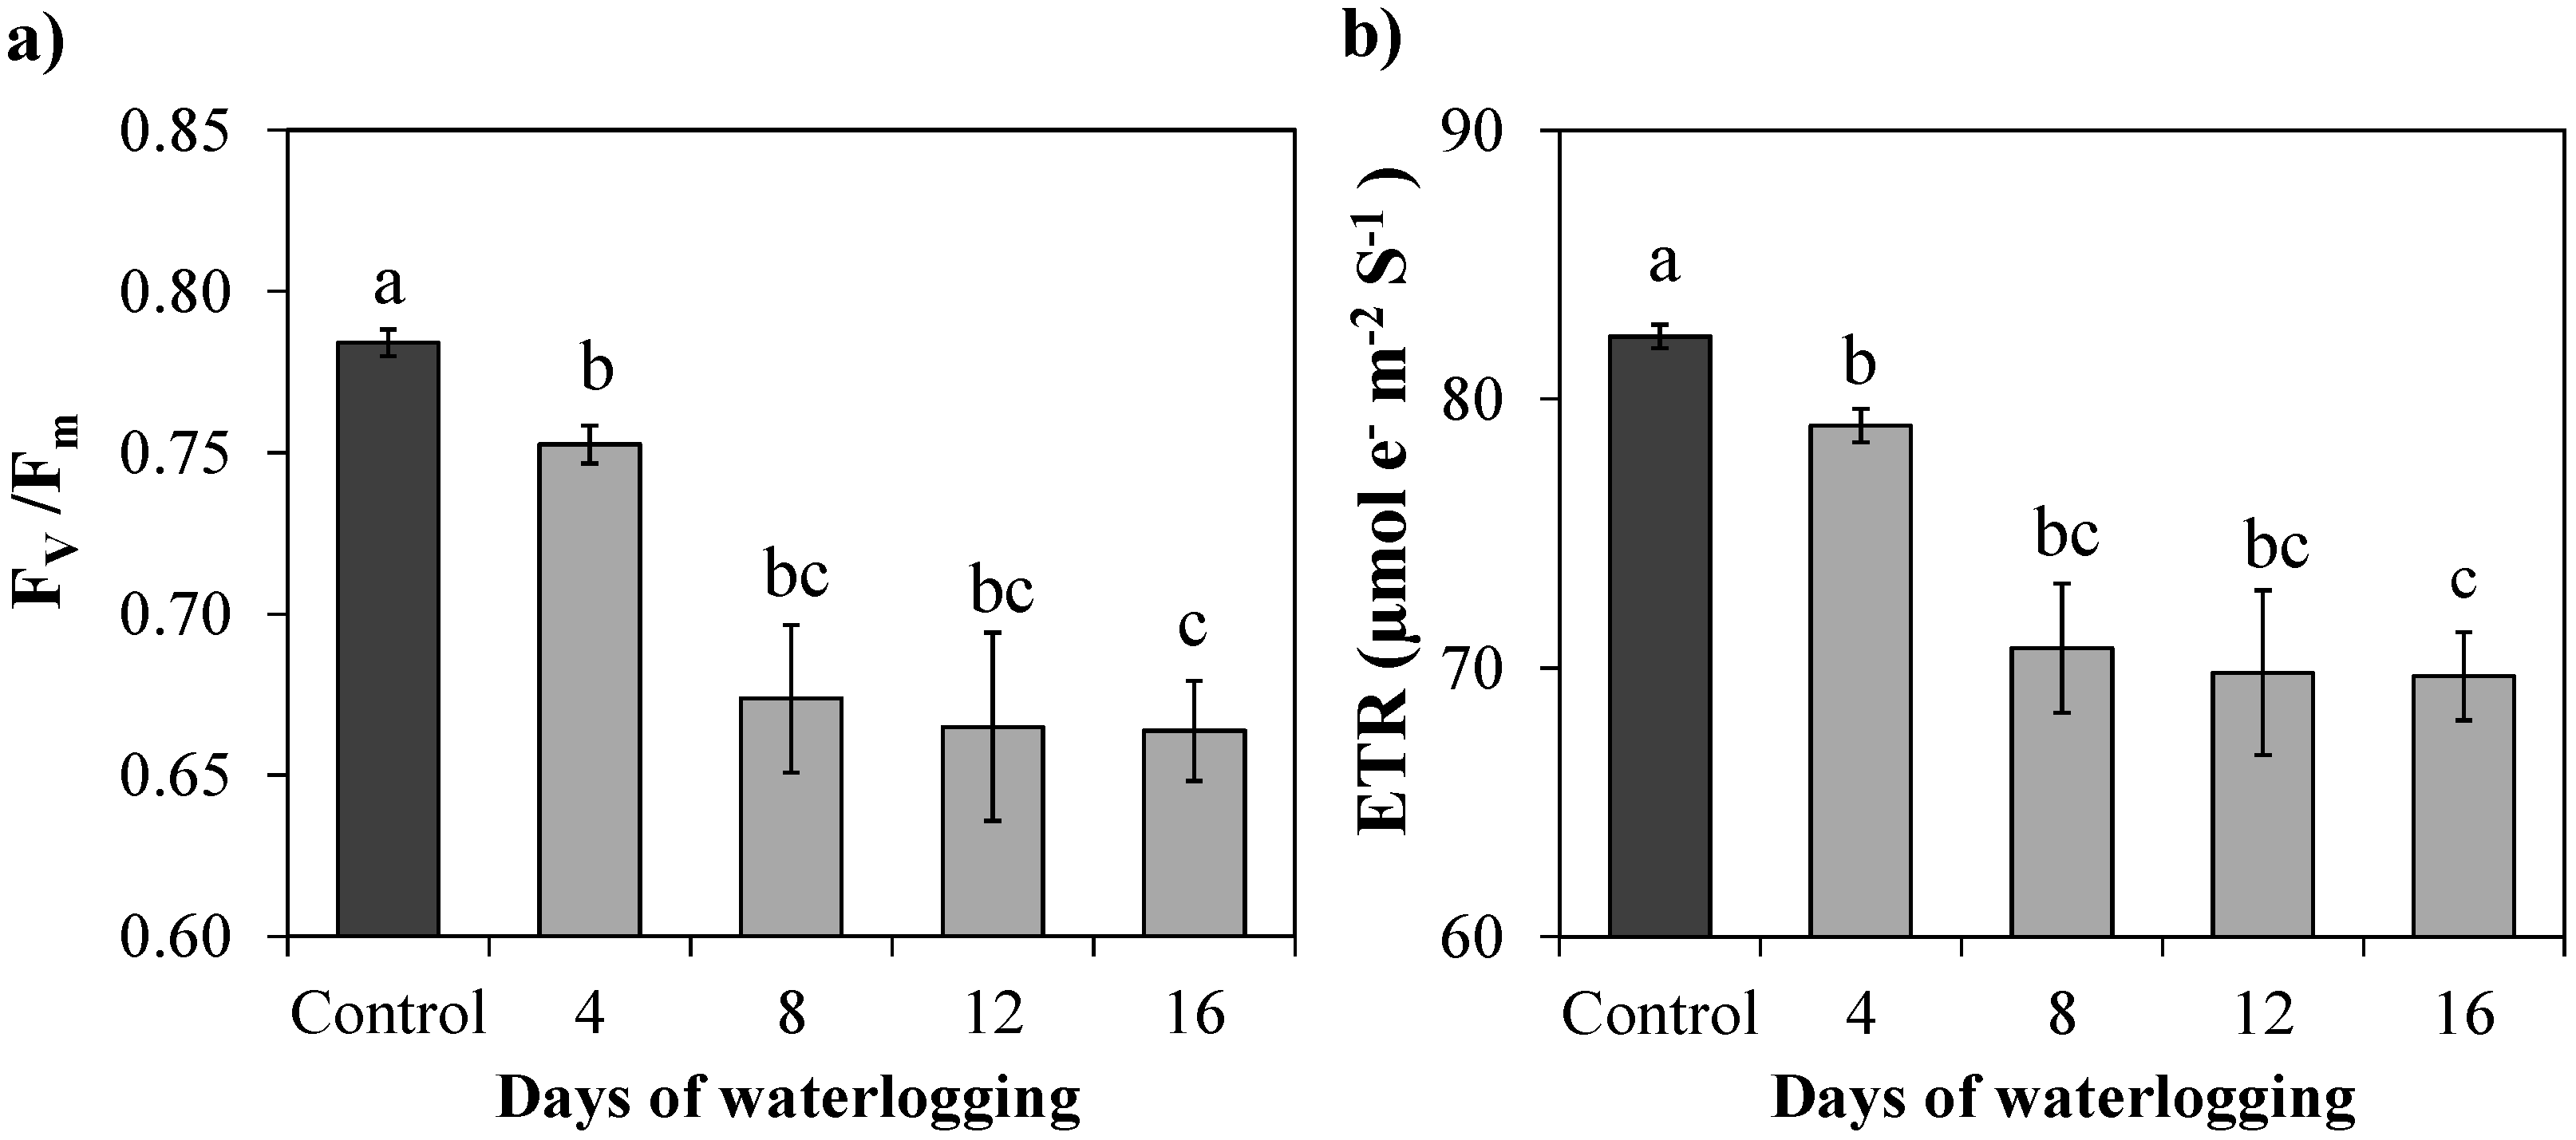
3.3. Chlorophyll “a” Fluorescence Parameters

The plants with waterlogging in the soil had Fv/Fm values between 0.75 and 0.66 and ETR values between 79 and 69 µmol e- m−2 s−1, while the control plants had Fv/Fm values of 0.79 to 0.78 and ETR values from 80 to 85 µmol µmol e- m−2 s−1 throughout the experiment. After 4 days of waterlogging, the plants showed a significant reduction (p < 0.0001) of both Fv/Fm (0.67) and ETR (70.74 µmol e- m−2 s−1), as compared to the control plants (Fv/Fm 0.78 and ETR 82.16 µmol e- m−2 s−1). These decreases in the fluorescence parameters were progressively preserved until 16 days of waterlogging (Fv/Fm 0.66 and ETR 69 µmol e- m−2 s−1). The fluorescence parameters evaluated in this study were sensitive to soil waterlogging conditions (Figure 8).
The physiological parameters evaluated in the plants with different waterlogging conditions and control plants showed a direct relationship between the measurements of water status Ψpd, Ψmd, and fluorescence parameters Fv/Fm and ETR. A high and positive correlation was observed between all physiological parameters with significant differences (p < 0.0001) (Figure 9).

4. Discussion

The waterlogging conditions in the soil affected the growth and physiological performance of the coffee cv “Cenicafé 1” plants, altering the DM accumulation of leaves and roots and TLA, as well as the water status and photosynthetic performance at the photochemical level. The coffee plants were very sensitive to these stress conditions, as has been previously reported [4,17]. Our results showed the physiological responses expressed by the C. arabica plants subjected to waterlogging in the soil, which may be influenced by the climatic variations generated in “La Niña” events, as well as on coffee plantations that have been identified as vulnerable to flood conditions in Colombia [7,10,11]. This information is important to understand the detrimental effects of this stress on the physiological performance of coffee plants widely cultivated in the coffee zone of Colombia. Strategies from crop management that can mitigate the effect of soil waterlogging, as well as building bases for the assisted selection of tolerant cultivars, are needed.
The symptoms of leaf epinasty, loss of turgor, chlorosis, and cell death reported in this study in coffee plants (Figure 3) are representative symptoms in plants subjected to waterlogging conditions in the soil [30,31,32]. Leaf epinasty is characterized by stimulated cell growth towards the adaxial or abaxial part of the leaf blade, it is promoted by ethylene, and it has been reported that it indicates a general inhibition of growth in the aerial part and reorientation of the leaves with changes in the leaf angle [31,32,33]. The loss of turgor in the leaves under waterlogging conditions is associated with increases in the ethylene content that regulates ABA biosynthesis in the mesophyll. This triggers stomatal closure, which restricts physiological processes, such as gas exchange or water uptake [31,34,35]. Chlorosis and cell death in leaves are mainly due to the degradation of photosynthetic pigments, such as chlorophylls, promoted by the low activity of enzymes that synthesize these pigments, the greater activity of chlorophyllase enzymes, and the increases in ROS that promote lipid peroxidation of chloroplast membranes and oxidation of chlorophylls [30,35,36]. These processes are regulated by the activity of ethylene, which triggers premature leaf senescence [30,31].
The waterlogging in the soil affected and inhibited the growth and development of coffee plants. The TDM was significantly affected after 4 days, indicating that this growth parameter is very sensitive to waterlogging conditions, as compared to TNL and TLA (Figure 4). However, the TNL and TLA were also significantly affected after 12 days. The reductions in these parameters indicated that there were very marked processes of premature senescence and leaf abscission, symptoms that are very common in plants subjected to these stress conditions [31]. Likewise, these results were reflected in the DM partition, where changes in the accumulation of DM in the leaves were observed (Figure 5) with decreases in the LAR (Table 2). The waterlogging conditions that the coffee “Cenicafé 1” cv plants were subjected to had a detrimental influence on photosynthesis since there was a high decrease in the growth of the organs responsible for the interception of solar radiation and CO2 assimilation, as evidenced by the increases in the SLA parameter at 8 days (Table 2). Therefore, alterations in carbon metabolism and the production of photoassimilates that could be allocated to plant growth are expected [34,36,37]. Furthermore, a possible cause of the increases in leaf abscission can be associated with increases in R/SR, as observed after 8 days (Table 2), because it indicates that plants are allocating more carbohydrates to the roots from the sources organ (leaves) to maintain the respiratory processes of these organs [17,34,36]. These reductions in TNL, TLA, and TDM have been reported in coffee plants [16] and other plant species subjected to waterlogging [38,39].
Reductions in root DM accumulation (Figure 5) were also reported in the study by Silveira et al. [16], which may be related to the decrease in the availability of oxygen in the soil [4,36], leading to changes in the respiratory metabolism in the roots and, consequently, reduced ATP production [17,37]. Under waterlogging conditions, plants obtain energy through the cycle of glycolysis or ethanol fermentation; however, ATP production is very low (2 moles of ATP/mole of glucose) compared to those obtained with glucose, between 36 moles of ATP/mole of glucose in aerobic metabolism [34,36,40]. When ATP contents are reduced, losses are generated in the accumulation of DM in the roots since they are sink organs that require this compound for growth and development processes. In addition, decreases in the DM of roots from waterlogging conditions generate a loss in the hydraulic conductance of the plants. These results were evidenced by the RDM/TLA parameter in this study (Table 2), which reduces the transport of water to the aerial part, restricts the assimilation of CO2 in leaves because of stomatal limitations, and generates changes in carbon metabolism, leading to decreased photosynthesis and growth [34,37,38].
Ψpd and Ψmd are key measurements for predicting the water status of coffee plants [1]. As expected, waterlogging conditions significantly affected these parameters. This same result has been reported in various plants subjected to these stress conditions [4,34,38]. This study recorded that different waterlogging periods promoted water stress in C. arabica cv “Cenicafé 1” plants, which was more severe as the duration increased (Figure 7). This was evidenced by the average values of Ψpd (−1.28 MPa) and Ψmd (−2.17 MPa) reported after 4 days, where the plants expressed moderate water stress [41,42], which leads to low cell wall elasticity, loss of leaf turgor as Ψpd decreases, and thus limits cell expansion and reduces water uptake [42,43,44,45]. In addition, the values of Ψpd recorded after 4 days of waterlogging may trigger foliar ABA biosynthesis to induce partial stomatal closure and thus reduce the transpiration rates as an avoidance mechanism for leaf dehydration [43,46,47]. These results contrast the study by Toral-Juárez et al. [4], where waterlogging conditions for 6 days in coffee C. canephora plants generated values Ψpd − 0.32 MPa, which indicated that the plants did not promote leaf ABA biosynthesis. The reductions in water status reported in the coffee “Cenicafé 1” cv plants may be related to limitations in the hydraulic conductance of the roots and increases in the concentrations of ABA in the leaves, as has been reported in C. arabica plants [48].
On the other hand, the average values of Ψpd (−3.50 MPa) and Ψmd (−3.50 MPa) observed after 8 days of waterlogging (Figure 7) verified that the coffee plants registered more severe water stress, generating harmful restrictions on essential physiological processes such as gas exchange capacity, water, and nutrient absorption, which decrease CO2 assimilation, affecting carbon metabolism and growth [35,37], as has been previously reported in coffee plants [4,15,49] and in other plant species [39,50]. The values of Ψpd and Ψmd after 12 days of waterlogging showed that the plants subjected to these stress conditions do not present rehydration mechanisms after the stressful conditions in the afternoon. Although the values of water potentials in the leaves recorded at the end of this study were very high, Ψpd (−3.50 MPa) and Ψmd (−3.70 MPa), they did not exceed the reference values (−7.0 to −8.0 MPa), reaching permanent wilting or death in C. arabica plants [1,51].
Under waterlogging conditions in the soil, photochemical and biochemical limitations have been reported in PSII activity [35,52,53]. Fluorescence parameters are physiological markers in plants and are a technique that can record alterations in processes involved in photosynthesis that are influenced by abiotic or biotic factors [35,52]. The Fv/Fm ratio has been reported as the measurement of the maximum quantum efficiency of PSII photochemistry and measurement that is associated with PSII functions and stability [54]. The decreases representative of the Fv/Fm parameter after 8 days of waterlogging (Figure 8a), demonstrating that there is no stability in the reaction centers of photosystem II, which remain inactive for the most part, reducing the transfer flow of photosynthetic electrons, as confirmed by the data: ETR 70.74 µmol e- m−2 s−1 (Figure 8b). Therefore, it can be assumed that there was damage from photoinhibition in the photosynthetic machinery, as can be observed in the Fv/Fm values (0.67) since they were below the reference range (0.85 to 0.75) observed in unstressed plants [54,55]. On the other hand, the Fv/Fm values showed that there was oxidative damage in the pool of photosynthetic pigments, such as chlorophylls and carotenoids, and that these physiological alterations in PSII are very frequently reported in plants under waterlogging conditions [50,53,56].
In contrast, the plants with waterlogging for 4 days had values of Fv/Fm 0.75 and ETR 79.01 µmol e- m−2 s−1 (Figure 8). Although a slight reduction in these parameters was seen, the stability and functionality of PSII were preserved, adjusting the essential processes of the light phase of photosynthesis, such as the production of ATP and NADPH, for the carboxylation reactions in the Calvin–Benson cycle. Therefore, there were no photochemical or biochemical limitations that impaired the photosynthetic processes of the coffee plants under this stress duration [57,58,59]. This effect is very likely to be preserved since plants under waterlogging conditions promote the dissipation of excess energy in the form of heat through the synthesis of zeaxanthin, obtained in the xanthophyll cycle, avoiding structural damage to the thylakoid membrane of chloroplasts, as reported in C. canephora coffee plants and other plant species with non-photochemical quenching-NPQ [4,53,58].
On the other hand, the coffee plants under waterlogging conditions activate the antioxidant system, which includes the superoxide dismutase-SOD, ascorbate peroxidase-APX, and ascorbate, which detoxify ROS and, therefore, prevent oxidative damage in chloroplasts [15]. This is known as a defensive measure in plants under waterlogging conditions in the soil, and, together with other responses, may be related to tolerance mechanisms under these stress conditions [34,36,40].

5. Conclusions

The C. arabica “Cenicafé 1” variety plants were affected by waterlogging conditions in the soil. The plants tolerated 4 days of waterlogging because significant differences or considerable decreases in growth and physiological parameters were not detected. On the other hand, after 8 days of waterlogging, the growth and physiological performance of the coffee plants were significantly affected, registering increases in premature senescence in the leaves and foliar abscission, changes in the accumulation of DM, loss of water status as reported by the water potential values in the leaves and the limitations in the hydraulic conductance of the roots, and sensitivity in the PSII activity, as shown by the Fv/Fm, significantly reducing the ETR and affecting photosynthetic processes with limitations at the photochemical level in the coffee plants.

Author Contributions

Conceptualization, A.F.L.-B. and C.A.U.; methodology, A.F.L.-B., C.A.U., and H.E.B.-L.; formal analysis, A.F.L.-B. and C.A.U.; investigation, A.F.L.-B.; data curation, A.F.L.-B. and C.A.U.; writing—original draft preparation, A.F.L.-B., C.A.U., and H.E.B.-L.; writing—review and editing, A.F.L.-B., C.A.U., and H.E.B.-L.; visualization, A.F.L.-B., C.A.U., and H.E.B.-L.; supervision, C.A.U. and H.E.B.-L.; project administration, A.F.L.-B.; funding acquisition, A.F.L.-B., C.A.U., and H.E.B.-L. All authors have read and agreed to the published version of the manuscript.

Funding

This research received no external funding.

Institutional Review Board Statement

Not applicable.

Data Availability Statement

Not applicable.

Acknowledgments

The authors would like to thank Alexander Jaramillo Jiménez and José Raúl Rendón Sáenz for taking the measurements in the greenhouse and Jhon Félix Trejos Pinzon, Diana María Molina, and the Physiology Department of the National Coffee Research Center-Cenicafé for providing the measurement equipment and plant material. We also thank the Universidad Nacional de Colombia, Bogotá, for their support.

Conflicts of Interest

The authors declare no conflict of interest.

References

  1. DaMatta, F.M.; Avila, R.T.; Cardoso, A.A.; Martins SC, V.; Ramalho, J.C. Physiological and Agronomic Performance of the Coffee Crop in the Context of Climate Change and Global Warming: A Review. J. Agric. Food Chem. 2018, 66, 5264–5274. [Google Scholar] [CrossRef] [PubMed]
  2. DaMatta, F.M.; Rahn, E.; Läderach, P.; Ghini, R.; Ramalho, J.C. Why could the coffee crop endure climate change and global warming to a greater extent than previously estimated? Clim. Chang. 2019, 152, 167–178. [Google Scholar] [CrossRef] [Green Version]
  3. Chemura, A.; Mudereri, B.T.; Yalew, A.W.; Gornott, C. Climate change and specialty coffee potential in Ethiopia. Sci. Rep. 2021, 11, 8097. [Google Scholar] [CrossRef] [PubMed]
  4. Toral-Juárez, M.A.; Avila, R.T.; Cardoso, A.A.; Brito, F.A.L.; Machado, K.L.G.; Almeida, W.L.; Souza, R.P.B.; Martins, S.C.V.; DaMatta, F.M. Drought-tolerant coffee plants display increased tolerance to waterlogging and post-waterlogging reoxygenation. Environ. Exp. Bot. 2021, 182, 104311. [Google Scholar] [CrossRef]
  5. Fischer, G.; Ramírez, F.; Casierra-Posada, F. Ecophysiological aspects of fruit crops in the era of climate change. A review. Agron. Colomb. 2016, 34, 190–199. [Google Scholar] [CrossRef]
  6. IPPC; Pörtner, H.-O.; Roberts, D.C.; Adams, H.; Adler, C.; Aldunce, P.; Ali, E.; Begum, R.A.; Betts, R.; Kerr, R.B.; et al. Climate Change 2022. Impacts, Adaptation and Vulnerability. Final Draft Version. 2022, p. 3676. Available online: https://www.ipcc.ch/report/ar6/wg2/ (accessed on 7 March 2022).
  7. Bastianin, A.; Lanza, A.; Manera, M. Economic impacts of El Niño southern oscillation: Evidence from the Colombian coffee market. Agric. Econ. 2018, 49, 623–633. [Google Scholar] [CrossRef] [Green Version]
  8. Ceballos-Sierra, F.; Dall’Erba, S. The effect of climate variability on Colombian coffee productivity: A dynamic panel model approach. Agric. Syst. 2021, 190, 103126. [Google Scholar] [CrossRef]
  9. Poveda, G.; Jaramillo, A.; Gil, M.M.; Quiceno, N.; Mantilla, R.I. Seasonally in ENSO-related precipitation, river discharges, soil moisture, and vegetation index in Colombia. Water Resour. Res. 2001, 37, 2169–2178. [Google Scholar] [CrossRef]
  10. Hoyos, N.; Escobar, J.; Restrepo, J.C.; Arango, A.M.; Ortiz, J.C. Impact of the 2010–2011 La Niña phenomenon in Colombia, South America: The human toll of an extreme weather event. Appl. Geogr. 2013, 39, 16–25. [Google Scholar] [CrossRef]
  11. Peña-Quiñones, A.J.; Valencia-Arbeláez, J.A.; Ramírez-Carabalí, C. Caracterización del efecto de «El Niño» y «La Niña» sobre la lluvia de la zona cafetera colombiana. Luna Azul 2014, 39, 89–104. [Google Scholar] [CrossRef]
  12. Federación Nacional de Cafeteros de Colombia. FNC en Estadística Cafetera. 2021. Available online: https://federaciondecafeteros.org/wp/estadisticas-cafeteras (accessed on 11 March 2022).
  13. Ovalle-Rivera, O.; Läderach, P.; Bunn, C.; Obersteiner, M.; Schroth, G. Projected Shifts in Coffea arabica Suitability among Major Global Producing Regions Due to Climate Change. PLoS ONE 2015, 10, e0124155. [Google Scholar] [CrossRef] [PubMed] [Green Version]
  14. Pham, Y.; Reardon-Smith, K.; Mushtaq, S.; Cockfield, G. The impact of climate change and variability on coffee production: A systematic review. Clim. Chang. 2019, 156, 609–630. [Google Scholar] [CrossRef]
  15. Tian, L.; Bi, W.; Ren, X.; Li, W.; Sun, L.; Li, J. looding has more adverse effects on the stem structure and yield of spring maize (Zea mays L.) than waterlogging in Northeast China. Eur. J. Agron. 2020, 117, 126054. [Google Scholar] [CrossRef]
  16. Silveira, H.R.D.O.; de Souza, K.R.D.; Alves, J.D.; de Santos, M.O.; Andrade, C.A.; Bomfim, S.C. Gas exchange and carbohydrate partitioning in coffee seedlings under waterlogging. Cienc. Agrotecnol. 2015, 39, 138–146. [Google Scholar] [CrossRef]
  17. Silveira, H.R.; de Santos, M.O.; Alves, J.D.; de Souza, K.R.D.; Andrade, C.A.; Alves, R.G.M. Growth effects of water excess on coffee seedlings (Coffea arabica L.). Acta Sci. Agron. 2014, 36, 211–218. [Google Scholar] [CrossRef]
  18. Loreti, E.; van Veen, H.; Perata, P. Plant responses to flooding stress. Curr. Opin. Plant Biol. 2016, 33, 64–71. [Google Scholar] [CrossRef] [Green Version]
  19. Yamauchi, T.; Colmer, T.D.; Pedersen, O.; Nakazono, M. Regulation of Root Traits for Internal Aeration and Tolerance to Soil Waterlogging-Flooding Stress. Plant Physiol. 2018, 176, 1118–1130. [Google Scholar] [CrossRef] [Green Version]
  20. Maldonado, C.E.M.; Giraldo, L.Á. Resistencia genética a la enfermedad de la cereza del café en variedades cultivadas en Colombia. Rev. Cenicafé 2020, 71, 69–90. [Google Scholar] [CrossRef]
  21. Federación Nacional de Cafeteros de Colombia. Publicaciones en Informe de Gestión 2020. 2021. Available online: https://federaciondecafeteros.org/wp/tipos/informes/ (accessed on 11 March 2022).
  22. Arcila-Pulgarín, J.; Buhr, L.; Bleiholder, H.; Hack, H.; Meier, U.; Wicke, H. Application of the extended BBCH scale for the description of the growth stages of coffee (Coffea spp.). Ann. Appl. Biol. 2002, 141, 19–27. [Google Scholar] [CrossRef]
  23. Sadeghian, K.S.S. Manejo integrado de nutrientes para una caficultura sostenible. Suelos Ecuat. 2014, 44, 74–89. [Google Scholar]
  24. Gaitán, B.A.L.; Villegas, G.C.; Rivillas, O.C.A.; Hincapié, G.E. Almácigos de café: Calidad fitosanitaria, manejo y siembra en el campo. Av. Téc. 2011, 404, 8. Available online: http://hdl.handle.net/10778/350 (accessed on 9 February 2022).
  25. Unigarro-Muñoz, C.A.; Hernández-Arredondo, J.D.; Montoya-Restrepo, E.C.; Medina-Rivera, R.D.; Ibarra-Ruales, L.N.; Carmona-González, C.Y.; Flórez-Ramos, C.P. Estimation of leaf area in coffee leaves (Coffea arabica L.) of the Castillo® variety. Bragantia 2015, 74, 412–416. [Google Scholar] [CrossRef] [Green Version]
  26. Avila, R.T.; de Almeida, W.L.; Costa, L.C.; Machado, K.L.G.; Barbosa, M.L.; de Souza, R.P.B.; Martino, P.B.; Juárez, M.A.T.; Marçal, D.M.S.; Martins, S.C.V.; et al. Elevated air [CO2] improves photosynthetic performance and alters biomass accumulation and partitioning in drought-stressed coffee plants. Environ. Exp. Bot. 2020, 177, 104137. [Google Scholar] [CrossRef]
  27. Genty, B.; Briantais, J.-M.; Baker, N.R. The relationship between the quantum yield of photosynthetic electron transport and quenching of chlorophyll fluorescence. Biochim. Biophys. Acta 1989, 990, 87–92. [Google Scholar] [CrossRef]
  28. Revelle, W. Psych: Procedures for Personality and Psychological Research; R Package Version 2.0.8; Northwestern University: Evanston, IL, USA, 2020; Available online: https://CRAN.r-project.org/package=psych (accessed on 14 March 2022).
  29. R Development Core Team. R: A Language and Environment for Statistical Computing; R Foundation for Statistical Computing: Vienna, Austria, 2019. [Google Scholar]
  30. Singh, R.; Shelke, G.; Kumar, A.; Jha, P. Biochemistry and genetics of ACC deaminase: A weapon to “stress ethylene” produced in plants. Front. Microbiol. 2015, 6, 937. [Google Scholar] [CrossRef]
  31. Ali, S.; Kim, W.-C. Plant growth promotion under water: Decrease of Waterlogging-Induced ACC and Ethylene Levels by ACC Deaminase-Producing Bacteria. Front. Microbiol. 2018, 9, 1096. [Google Scholar] [CrossRef]
  32. Pandey, A.K.; Singh, A.G.; Gadhiya, A.R.; Kumar, S.; Singh, D.; Mehta, R. Chapter 17—Current approaches in horticultural crops to mitigate waterlogging stress. In Stress Tolerance in Horticultural Crops; Rai, E.A.C., Rai, A., Rai, K.K., Rai, V.P., Kumar, A., Eds.; Woodhead Publishing: Sawston, UK, 2021; pp. 289–299. [Google Scholar] [CrossRef]
  33. Jackson, M.B. Ethylene and Responses of Plants to Soil Waterlogging and Submergence. Annu. Rev. Plant Physiol. 1985, 36, 145–174. [Google Scholar] [CrossRef]
  34. Irfan, M.; Hayat, S.; Hayat, Q.; Afroz, S.; Ahmad, A. Physiological and biochemical changes in plants under waterlogging. Protoplasma 2010, 241, 3–17. [Google Scholar] [CrossRef]
  35. Ashraf, M.A. Waterlogging stress in plants: A review. Afr. J. Agric. Res. 2012, 7, 1976–1981. [Google Scholar] [CrossRef]
  36. Pan, J.; Sharif, R.; Xu, X.; Chen, X. Mechanisms of Waterlogging Tolerance in Plants: Research Progress and Prospects. Front. Plant Sci. 2021, 11, 627331. [Google Scholar] [CrossRef]
  37. Ferner, E.; Rennenberg, H.; Kreuzwieser, J. Effect of flooding on C metabolism of flood-tolerant (Quercus robur) and non-tolerant (Fagus sylvatica) tree species. Tree Physiol. 2012, 32, 135–145. [Google Scholar] [CrossRef] [PubMed] [Green Version]
  38. Shukor, N.N.; Abdul-Hamid, H.; Abdu, A.; Ismail, M.K. Waterlogging Effects on Growth and Physiological Characteristics of Azadirachta excelsa Seedlings. Am. J. Plant Physiol. 2014, 9, 78–94. [Google Scholar] [CrossRef] [Green Version]
  39. El-Yazel, M.A.S.; EI-Shewy, A.A.; Matter, F.M.A. Impact of water logging condition on seedling of five timber tree species. Hortic. Int. J. 2022, 6, 37–45. [Google Scholar] [CrossRef]
  40. Sairam, R.K.; Kumutha, D.; Ezhilmathi, K.; Deshmukh, P.S.; Srivastava, G.C. Physiology and biochemistry of waterlogging tolerance in plants. Biol. Plant. 2008, 52, 401. [Google Scholar] [CrossRef]
  41. Taiz, L.; Zeiger, E.; Maller, I.A.; Murphy, A. Plant Physiology and Development, 6th ed.; Sinauer Associates Inc.: Sunderland, MA, USA, 2015; p. 692. [Google Scholar]
  42. Schildwacht, P.M. Is a decreased water potential after withholding oxygen to roots the cause of the decline of leaf-elongation rates in Zea mays L. and Phaseolus vulgaris L.? Planta 1989, 177, 178–184. [Google Scholar] [CrossRef]
  43. Pierce, M.; Raschke, K. Correlation between loss of turgor and accumulation of abscisic acid in detached leaves. Planta 1980, 148, 174–182. [Google Scholar] [CrossRef]
  44. Tounekti, T.; Mahdhi, M.; Al-Turki, T.A.; Khemira, H. Water relations and photo-protection mechanisms during drought stress in four coffee (Coffea arabica) cultivars from southwestern Saudi Arabia. S. Afr. J. Bot. 2018, 117, 17–25. [Google Scholar] [CrossRef]
  45. Ratzmann, G.; Zakharova, L.; Tietjen, B. Optimal leaf water status regulation of plants in drylands. Sci. Rep. 2019, 9, 3768. [Google Scholar] [CrossRef] [Green Version]
  46. Cardoso, A.A.; Brodribb, T.J.; Kane, C.N.; DaMatta, F.M.; McAdam, S.A.M. Osmotic adjustment and hormonal regulation of stomatal responses to vapour pressure deficit in sunflower. AoB Plants 2020, 12, plaa025. [Google Scholar] [CrossRef]
  47. Yao, G.-Q.; Nie, Z.-F.; Turner, N.C.; Li, F.-M.; Gao, T.-P.; Fang, X.-W.; Scoffoni, C. Combined high leaf hydraulic safety and efficiency provides drought tolerance in Caragana species adapted to low mean annual precipitation. New Phytol. 2021, 229, 230–244. [Google Scholar] [CrossRef]
  48. Almeida, W.L.; Ávila, R.T.; Pérez-Molina, J.P.; Barbosa, M.L.; Marçal, D.M.S.; de Souza, R.P.B.; Martino, P.B.; Cardoso, A.A.; Martins, S.C.V.; DaMatta, F.M. The interplay between irrigation and fruiting on branch growth and mortality, gas exchange and water relations of coffee trees. Tree Physiol. 2021, 41, 35–49. [Google Scholar] [CrossRef] [PubMed]
  49. Melke, A.; Fetene, M. Eco-physiological basis of drought stress in coffee (Coffea arabica, L.) in Ethiopia. Theor. Exp. Plant Physiol. 2014, 26, 225–239. [Google Scholar] [CrossRef]
  50. Barickman, T.C.; Simpson, C.R.; Sams, C.E. Waterlogging Causes Early Modification in the Physiological Performance, Carotenoids, Chlorophylls, Proline, and Soluble Sugars of Cucumber Plants. Plants 2019, 8, 160. [Google Scholar] [CrossRef] [PubMed] [Green Version]
  51. Pereira, L.; Bittencourt, P.R.L.; Oliveira, R.S.; Junior, M.B.M.; Barros, F.V.; Ribeiro, R.V.; Mazzafera, P. Plant pneumatics: Stem air flow is related to embolism—New perspectives on methods in plant hydraulics. New Phytol. 2016, 211, 357–370. [Google Scholar] [CrossRef] [Green Version]
  52. Chávez-Arias, C.C.; Gómez-Caro, S.; Restrepo-Díaz, H. Physiological, Biochemical and Chlorophyll Fluorescence Parameters of Physalis Peruviana L. Seedlings Exposed to Different Short-Term Waterlogging Periods and Fusarium Wilt Infection. Agronomy 2019, 9, 213. [Google Scholar] [CrossRef] [Green Version]
  53. Chen, C.-C.; Li, M.-S.; Chen, K.-T.; Lin, Y.-H.; Ko, S.-S. Photosynthetic and Morphological Responses of Sacha Inchi (Plukenetia volubilis L.) to Waterlogging Stress. Plants 2022, 11, 249. [Google Scholar] [CrossRef]
  54. Murchie, E.H.; Lawson, T. Chlorophyll fluorescence analysis: A guide to good practice and understanding some new applications. J. Exp. Bot. 2013, 64, 3983–3998. [Google Scholar] [CrossRef] [Green Version]
  55. Björkman, O.; Demmig, B. Photon yield of O2 evolution and chlorophyll fluorescence characteristics at 77 K among vascular plants of diverse origins. Planta 1987, 170, 489–504. [Google Scholar] [CrossRef]
  56. Zhang, R.D.; Zhou, Y.F.; Yue, Z.X.; Chen, X.F.; Cao, X.; Xu, X.X.; Xing, Y.F.; Jiang, B.; Ai, X.Y.; Huang, R.D. Changes in photosynthesis, chloroplast ultrastructure, and antioxidant metabolism in leaves of sorghum under waterlogging stress. Photosynthetica 2019, 57, 1076–1083. [Google Scholar] [CrossRef] [Green Version]
  57. Demmig-Adams, B.; Adams, W.W.; Winter, K.; Meyer, A.; Schreiber, U.; Pereira, J.S.; Krüger, A.; Czygan, F.-C.; Lange, O.L. Photochemical efficiency of photosystem II, photon yield of O2 evolution, photosynthetic capacity, and carotenoid composition during the midday depression of net CO2 uptake in Arbutus unedo growing in Portugal. Planta 1989, 177, 377–387. [Google Scholar] [CrossRef]
  58. Maxwell, K.; Johnson, G.N. Chlorophyll fluorescence—A practical guide. J. Exp. Bot. 2000, 51, 659–668. [Google Scholar] [CrossRef] [PubMed]
  59. De Oliveira Santos, M.; Coelho, L.S.; Carvalho, G.R.; Botelho, C.E.; Torres, L.F.; Vilela, D.J.M.; Andrade, A.C.; Silva, V.A. Photochemical efficiency correlated with candidate gene expression promote coffee drought tolerance. Sci. Rep. 2021, 11, 7436. [Google Scholar] [CrossRef] [PubMed]
Figure 1. Variation of temperature (● solids symbols) and relative humidity (◊ open symbols) according to waterlogging duration in days.
Agronomy 12 01270 g001
Figure 2. The sequence of the application of treatments with waterlogging and control on coffee seedlings. The red containers are the plants without waterlogging with soil at field capacity and the blue color illustrates the plants subjected to waterlogging with the containers adapted with plastic bags and saturated soil.
Agronomy 12 01270 g002
Figure 3. Visual symptoms of coffee seedlings subjected to different waterlogging periods.
Agronomy 12 01270 g003
Figure 4. Effect of waterlogging on total number of leaves (TNL) (a), total leaf area (TLA) (b), and total dry mass (TDM) (c) of coffee plants. Data are the mean (n = 30). The different letters denote significant differences according to Tukeyʼs test (p < 0.05) for TLA and TDM, and Games–Howellʼs test (p < 0.05) for TNL.
Agronomy 12 01270 g004
Figure 5. Effect of waterlogging on dry matter partitioning of coffee plants. Each bar chart summarizes the mean of 30 replicates. The different letters denote significant differences according to Tukeyʼs test (p < 0.05) for dry matter partitioning of roots and stem, or Games–Howellʼs test (p < 0.05) for dry matter partitioning of leaf.
Agronomy 12 01270 g005
Figure 6. Correlation analysis data. The Spearman correlation analysis was calculated to evaluate the relationship between waterlogging and growth parameters in coffee plants. The coefficients above the diagonal of the matrix show the degree of the correlation and the asterisks denote significant changes for * p < 0.05, ** p < 0.001, and *** p < 0.0001. The scatter plots between the growth parameters are shown below the diagonal of the matrix.
Agronomy 12 01270 g006
Figure 7. Leaf water potential of coffee plants under waterlogging conditions. Predawn-Ψpd (a) and midday-Ψmd (b) were measured in leaves in the control and with different waterlogging periods. Data are the mean (n = 8) ± SE. The different letters denote significant changes according to Tukeyʼs test (p < 0.05).
Agronomy 12 01270 g007
Figure 8. Chlorophyll “a” fluorescence parameters of coffee plants under waterlogging. The maximum efficiency of PSII (Fv/Fm) (a) and ETR (b) were measured in dark-adapted leaves in the control and with different waterlogging periods. Data are the mean (n = 8) ± SE. The different letters denote significant differences according to Games–Howellʼs test (p < 0.05).
Agronomy 12 01270 g008
Figure 9. Correlation analysis data. The Spearman correlation analysis was calculated to evaluate the relationship between physiological parameters and the effect of waterlogging on coffee plants. The coefficients above the diagonal of the matrix show the degree of the correlation and the asterisks denote significant changes at *** p < 0.0001. The scatter plots between the physiological parameters are shown below the diagonal of the matrix.
Agronomy 12 01270 g009
Table 1. Physical–chemical characteristics of the soil used as substrate in the cylindrical containers for the coffee seedlings.
pHTextureOrganic MatterClaySandsSiltNAlKCaMgPSB
%cmol (+) kg−1ppm
5.0Sandy loam9.515.758.126.10.40.40.10.70.32.2160.38
Table 2. The effect of waterlogging on leaf area ratio (LAR), specific leaf area (SLA), roots/shoot ratio (R/SR), and root-dry-mass-to-total-leaf-area ratio (RDM/TLA). Data are the mean (n = 30) ± SE. The different letters denote significant differences within the column according to Tukey’s test (p < 0.05) for SLA, or Games–Howell’s test (p < 0.05) for LAR, R/SR, and RDM/TLA.
Days of WaterloggingParameters
LARSLAR/SRRDM/TLA
Control0.50 ± 0.10 a109 ± 3.50 b3.89 ± 0.19 a41.10 ± 2.40 a
40.50 ± 0.01 a122 ± 3.76 ab3.82 ± 0.23 a37.30 ± 2.32 a
80.50 ± 0.01 a126 ± 5.63 a4.26 ± 0.31 a34.80 ± 2.40 a
120.48 ± 0.01 ab117 ± 3.39 ab4.40 ± 0.27 a37.20 ± 2.81 a
160.45 ± 0.01 b118 ± 3.26 ab4.17 ± 0.21 a36.86 ± 3.19 a
Publisher’s Note: MDPI stays neutral with regard to jurisdictional claims in published maps and institutional affiliations.

