Article

Diversity Chromosome Evolution of Ty1-copia Retrotransposons in Pennisetum purpureum Revealed by FISH

1
Guangxi Key Laboratory for Sugarcane Biology, State Key Laboratory for Conservation and Utilization of Subtropical Agro-Bioresources, Guangxi University, Nanning 530004, China
2
National Engineering Research Center for Sugarcane, Fujian Agriculture and Forestry University, Fuzhou 350002, China
3
Guangdong Key Laboratory of Sugarcane Improvement and Biorefinery, Guangdong Provincial Bioengineering Institute, Guangzhou 510310, China
4
Key Laboratory of Sugarcane Biology and Genetic Breeding, Ministry of Agriculture, Fujian Agriculture and Forestry University, Fuzhou 350002, China
*
Author to whom correspondence should be addressed.
Agronomy 2022, 12(6), 1312; https://doi.org/10.3390/agronomy12061312
Submission received: 6 May 2022 / Revised: 27 May 2022 / Accepted: 27 May 2022 / Published: 30 May 2022

Abstract

:
Pennisetum purpureum is a potential species for biofuel production. Characterization and chromosomal distribution of retrotransposons could enhance the comprehension of the role and dynamics of the repetitive elements in plants. In this study, a phylogenetic tree was constructed according to the conserved reverse transcriptase sequences and revealed that these Ty1-copia retrotransposons had a typical structure. Analysis showed that the total Ty1-copia retrotransposons had a significant component, as high as 5.12 × 10³ copy numbers in P. purpureum. Then, the chromosomal pattern of four known lineages were also analyzed with the Pennisetum glaucum genome, which suggested that the Sire/Maximus lineage had the highest copy number and followed by Tork/Angela, Tork/TAR, Retrofit/Ale. Additionally, the chromosomal distribution of total Ty1-copia retrotransposons was detected by fluorescence in situ hybridization (FISH) to be a dispersed pattern with weak clustering, mostly near the centromeric regions of P. purpureum chromosomes; interestingly, there were four obvious signals in the subterminal chromosomes. These results suggested that there occurred differential dynamic evolution directions of Ty1-copia retrotransposons within P. purpureum. Furthermore, co-localization of Ty1-copia, 5S rDNA, and 35S rDNA indicated that two chromosome 2 and four chromosome 4 were identified. Concurrently, subterminal signals of Ty1-copia-type retrotransposons were located on four other homologous chromosomes. Altogether, these results shed light on the diversification of Ty1-copia retrotransposons and have the significance for generation of valid chromosomal markers in retrotransposon families.

1. Introduction

Developing a new conversion technology has recently attracted increased attention for its potential value for producing bioethanol and methane [1,2]. The tropical species P. purpureum represents a new alternative energy crop that may provide abundant and sustainable lignocellulosic biomass which can be used for biofuel production [3,4]. As a C4 plant, elephant grass can suppress photorespiration and has great potential to efficiently convert solar energy to biomass [5]. This grass also has high productivity compared to other species, producing a large productions per year [6,7]. In addition, this biomass can be grown on different soil types, requiring little additional nutrients for growth. Due to these characteristics, elephant grass is a favorable option as a second-generation ethanol production.
P. purpureum is a tetraploid species (2n = 4x = 28) that belongs to an economically important tropical forage plant in the genus Pennisetum. The DNA content per haploid nucleus for P. purpureum was estimated by flow cytometry to be approximately 1.15 pg (1.12 × 10³ Mb) [8]. Repetitive sequences account for a considerable part of the plant genome, which constitutes up to 80% in some plants [9]. These motifs can be divided into two broad groups as follows: tandemly repeated and dispersed sequences that include transposable elements [10]. Transposable, or mobile elements, are divided into two main classes, DNA transposons and retrotransposons [11]. In general, retrotransposons include long terminal repeats (LTRs) or non-LTR retrotransposons. The content of retrotransposons leads to a large disparity genome in different plants. Retrotransposons ranged from 10~70% in rice [12,13], maize [14] and sorghum [15], resulting in different genomes. Moreover, different LTR retrotransposons in plants result in various chromosomal patterns. LTR retrotransposons are mostly concentrated in highly heterochromatic regions (centromeres, pericentromeres, and telomeres) [16,17,18,19,20] and have the tendency to accumulate in the pericentromeric regions of the genome, while, Xu and Du found that LTR retrotransposons are distributed in euchromatic regions in Solanum lycopersicum [21].
LTR retrotransposons include Ty1-copia, Ty3-gypsy, Bel-Pao, retroviruses, and endogenous retroviruses [1,2,22], and of these, Ty1-copia and Ty3-gypsy retrotransposons are abundant in plant genomes [11,23]. In Ty1-copia elements, there are four subunits including protease, integrase, reverse transcriptase (RT), and ribonuclease H. To date, although genome sequencing can greatly facilitate the analysis of retrotransposons, the cost and assembly of repetitive sequences make it difficult in non-model plants or genomic complexity species. Hence, amplifying Ty1-copia RT domains is more feasible and has led to a better understanding of sequence evolution and phylogenetic relationships in numerous plants [4,24,25,26,27,28,29]. Additionally, the content of Ty1-copia elements is indispensable to study the dynamics of genome size in plants. The relative content of Ty1-copia RT sequences in plant genomes has been widely assessed by dot-blot hybridization [26,27]. The chromosomal pattern of Ty1-copia RT sequence is also vital for studying the retrotransposition dynamics of their retrotransposons. FISH is an efficient molecular technique for karyotype analysis, chromosome recombination, and chromosomal transmission in plant genomes [2,30,31]. 35S rDNA and 5S rDNA sequences are “hot” markers widely used to analyze chromosome evolution and karyotype for FISH [32,33]. Several studies have shown that Ty1-copia sequences are ubiquitous in the plant genome, just like 35S rDNA and 5S rDNA markers. However, there are no studies on the relationship between localization of Ty1-copia RT, 35S rDNA, and 5S rDNA in P. purpureum.
In this study, we isolated the conserved Ty1-copia RTs from the P. purpureum genome to identify retrotransposon sequences and evaluated their heterogeneity, relationship, abundance, and chromosomal patterns. Furthermore, we also analyzed the genomic distribution of Ty1-copia RT, 35S rDNA, and 5S rDNA in P. purpureum.

2. Materials and Methods

2.1. Plant Materials and DNA Isolation

Fujian elephant grass is widely grown in the Fujian province and symbolized plant in this species (P. purpureum, 2n = 4x = 28), which was provided by the Sugarcane Research Institute of Yunnan Agriculture Science Academy. Young leaves were collected from the greenhouse at Fujian Agriculture and Forestry University in Fuzhou, China. A standard cetyltrimethyl ammonium bromide (CTAB) protocol was used for extracting total genomic DNA (gDNA) [34].

2.2. PCR Products and Characterization of Ty1-copia RT Sequences

The RT region of the Ty1-copia retrotransposons was amplified by PCR using gDNA of P. purpureum as templates and a pair of degenerate primers (Ty1-F: 5′-ACNGCNTT (C/T) (C/T) TNCA (C/T) GG-3′; Ty1-R: 5′-A (A/G) CAT (A/G) TC (A/G) TCNAC (A/G) TA-3′) [24]. PCR amplification was performed on a Veriti@96-well Thermal Cycler (Applied Biosystems, United States). Reaction mixtures were 50 μL, containing 50 ng of gDNA, 20 pmol of each primer, 0.2 mM of each dNTP, 1 × ExTaq buffer, and 2.5 U of Ex Taq polymerase (Takara, Bio Inc., Tokyo, Japan). Reactions were denatured at 94 °C for 4 min, followed by 35 cycles of 94 °C denaturation for 50 s, annealing at 45 °C for 45 s, extension at 72 °C for 30 s, and final extension at 72 °C for 5 min. Then, to avoid PCR preference, we selected three times the PCR production mixtures for further cloning and sequencing. In total, 88 clones of successful sequencing were named from PpTy1-copia-1 to PpTy1-copia-88 and available in the GenBank database MH674202-MH674289.

2.3. Sequence Analysis, Comparisons, and Phylogenetic Trees

Identified Ty1-copia RT sequences from P. purpureum were compared with other Ty1-copia RT that come from graminaceous species (Saccharum, Sorghum, Erianthus, Triticum, Zea, Oryza, and Hordeum). MEGA X software was used to align these nucleotide sequences [35]. Then, 88 nucleotide sequences of Ty1-copia retrotransposons from P. purpureum were translated to amino acid sequences by the Transeq tool of the EMBOSS package (https://www.ebi.ac.uk/Tools/st/emboss_transeq/, accessed on 1 May 2022). MACSE was used to align Ty1-copia RT amino acid sequences that were used in this study [36]. Multiple sequence alignment of the Ty1-copia RT amino acid sequences was undertaken by using MUSCLE [37]. MEGA X was used to construct the phylogenetic tree using the neighbor-joining method [35]. TBtools software was used for sequences of local blast with the P. glaucum genome [12], and these positions were visualized with Integrative Genomics Viewer software [38].

2.4. Dot-Blot Hybridization

Reverse dot-blot hybridization (RDB) was performed to detect the content of Ty1-copia RT sequences in the P. purpureum genome. All purified plasmids were quantified in NanoVue PlusTM (GE Healthcare, Princeton, NJ, United States), and a final concentration of 50 ng/μL plasmids was used for hybridization. The P. purpureum gDNA probe was labeled with digoxigenin-11-dUTP (DIG) using a DIG Nick Translation Kit (Roche Diagnostics, Basel, Switzerland). Hybridization was performed as described in the Instruction Manual of the DIG High Prime DNA Labeling and Detection Starter Kit I (Roche Diagnostics). Washing conditions was performed according to Huang et al. [39].
The copy number of total Ty1-copia RT sequences in P. purpureum was estimated by dot-blotting. Serial dilutions of P. purpureum gDNA (500, 400, 250, 200, 100, and 50 ng) and total Ty1-copia RT plasmids (2, 1.5, 1, 0.75, 0.5, 0.375, and 0.25 ng) were used in further hybridization. Total Ty1-copia sequences labeled with DIG were prepared as probes using the PCR-DIG Probe Synthesis Kit (Roche). ImageJ and Calculator software (http://cels.uri.edu/gsc/cndna.html, accessed on 1 May 2022) conducted an estimate of the copy number per genome of total Ty1-copia RT [40].

2.5. FISH

Meristem of the P. purpureum root-tips were prepared according to Huang et al. [39]. Clones containing the isolated RT domain of P. purpureum were labeled with DIG by PCR with degenerate primers according to the PCR-DIG Probe Synthesis Kit (Roche Diagnostics) instructions. 35S rDNA was labeled with DIG or biotin-16-dUTP (Roche) using a Nick Translation Kit (Roche Diagnostics), and 5S rDNA was labeled with biotin-16-dUTP (Roche) using the PCR-DIG Probe Synthesis Kit (Roche Diagnostics). FISH was performed as described by Huang et al. [39]. Chromosomes were counterstained with DAPI (4′, 6-diamidino-2-phenylindole, 6 μg/mL). An AxioScope A1 Imager fluorescent microscope (Carl Zeiss, Gottingen, Germany) was used for capturing image.

3. Results

3.1. PCR Products and Characterization of Ty1-copia RT Sequences

The PCR amplification yielded a product of the expected size (approximately 260 bp) in P. purpureum. Next, 88 independent clones were randomly selected clones from three times the PCR production mixture to avoid being PCR biased. Of these, 84 sequences (95.5%) were found to have lengths of 253~266 bp and four sequences (4.5%) have lengths of 315~316 bp. All translated nucleotide sequences had TAFLHG, S/ALYGLKQ, and YVDDM conserved domains. There were four longer Ty1-copia RT sequences that varied from 315 to 316 bp (PpTy1-copia 39, 74, 78, and 79) and differed from the other plants but shared the upstream TAFLHG, the central conserved domain S/ALYGLKQ, and downstream YVDDM motifs. However, all longer Ty1-copia RT sequences were defective (Table 1). In the other 84 Ty1-copia RT sequences, 20 sequences were defective (contained stop coding or frameshift mutations) (Table 1). In total, 27.27% of Ty1-copia RT sequences may be non-functional (contained stop coding or frameshift mutations) in P. purpureum.

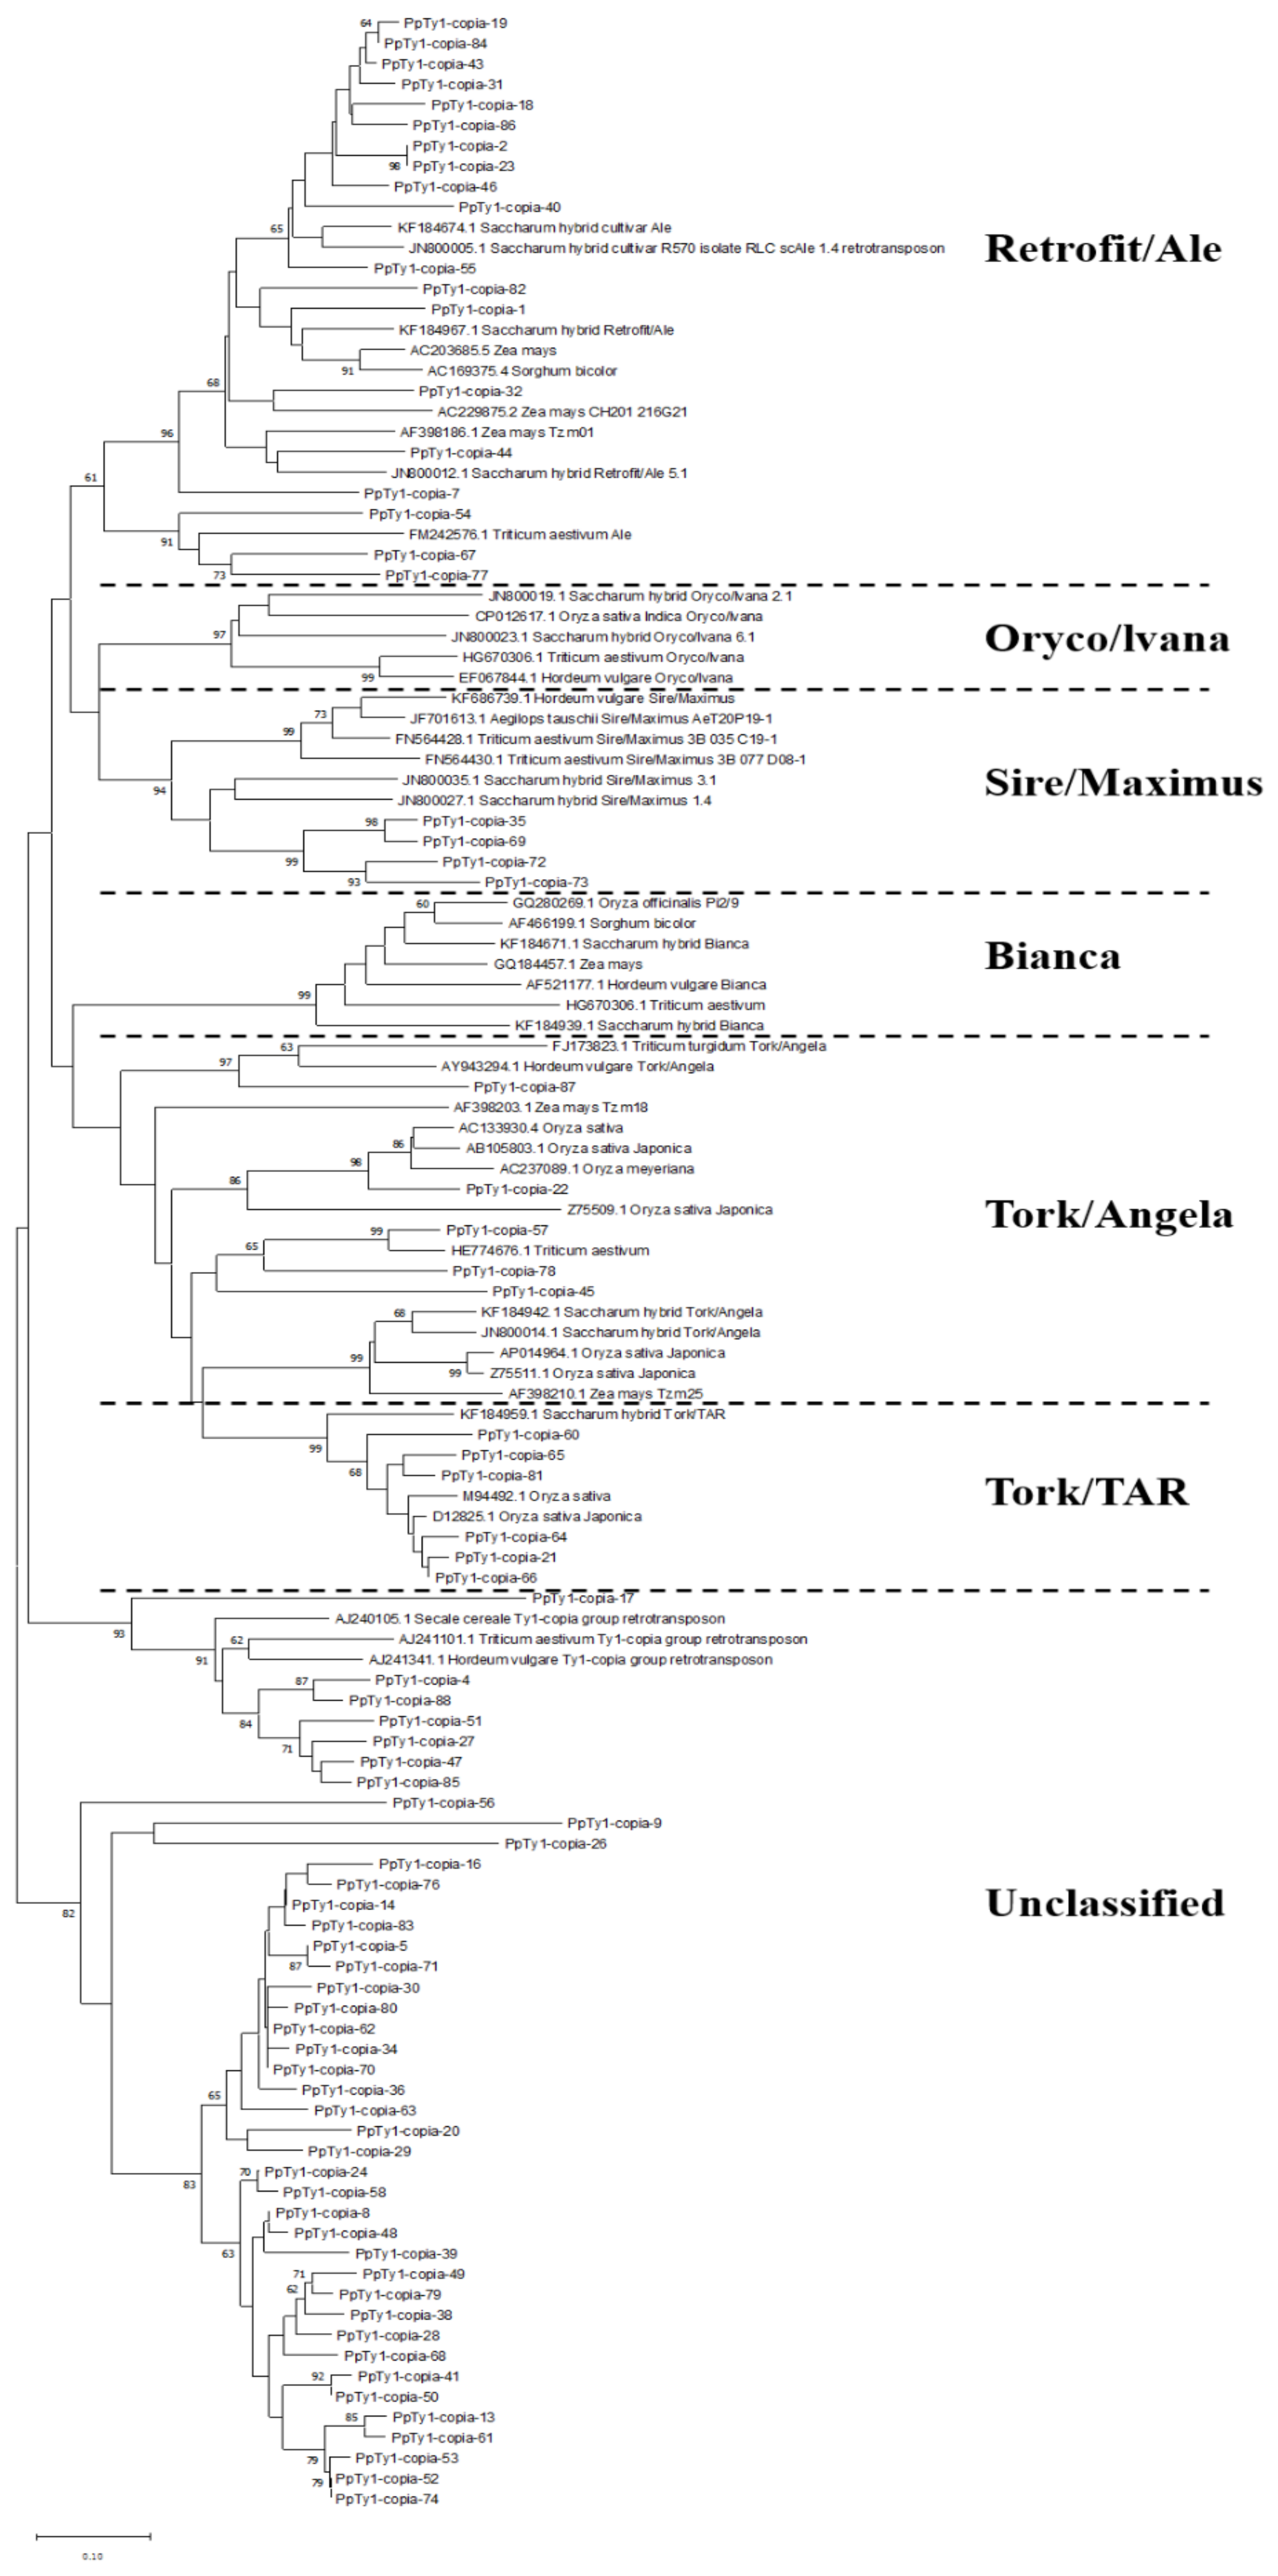
3.2. Classification and Phylogenetic Analysis of Identified Ty1-copia RT Sequences from P. purpureum

All identified 88 Ty1-copia RT nucleotide sequences were translated to 74~95 amino acids in length (EMBOSS Transeq tool). Very high sequence heterogeneity was existed among these amino acid sequences, and they could be classified into several distinct groups (Figure 1). The sequences alignment analysis indicated that these amino acids similarity ranged from 11.3~100%. Of these, partial amino acids similarity was 100% (Table 1).
A neighbor-joining tree was constructed by aligning Ty1-copia RT amino acid sequences among these Ty1-copia RT sequences with related Ty1-copia retrotransposons from other graminaceous species (Figure 2). These RTs were separated into six distinct evolutionary lineages (I–VI) of four known lineages (Retrofit/Ale, Sire/Maximus, Tork/Angela, and Tork/TAR) and two unclassified families. Lineage I contained 19 Ty1-copia clones, which were clustered with a Retrofit/Ale lineage of Saccharum, Triticum, Oryza, Sorghum, or Zea, indicating that the Retrofit/Ale lineage have the largest numbers of known lineages of Ty1-copia in P. purpureum (Figure 2). This lineage included the most numerous clones in known lineages, and of these, 14 (73.7%) putative amino acids contained potentially functional (without stop coding or frameshift mutations) Ty1-copia RT domains. Lineage II contained four Ty1-copia clones (35, 69, 72, 73), which were clustered with a Sire/Maximus lineage of Saccharum. In this lineage, all the Ty1-copia RT sequences included stop coding or frameshift mutations. Lineage III contained five Ty1-copia clones (22, 45, 57, 78, and 87), which were closed to a Tork/Angela lineage of Oryza and Hordeum, respectively, while 4 (80%) of these putative amino acids were functional in P. purpureum. Lineage IV contained seven Ty1-copia clones (3, 64, 21, 60, 65, 66, and 81), which were clustered with a Tork/TAR lineage of Triticum, Saccharum, Oryza, and Zea. Among the Ty1-copia RT sequences, 3 (33.3%) occurred as frameshifts or stop codons; whereas the remaining four contained potentially functional (without stop coding or frameshift mutations) Ty1-copia RT domains. These results indicated that RT sequences might share the common origin and that horizontal transmission of retrotransposons has occurred among the gramineous plants.
However, the other groups clustered to an unclassified lineage. Lineage V contained nine Ty1-copia clones, which were clustered with an unclassified lineage but had high homology to Ty1-copia-like elements belonging to other graminaceous species, including Triticum, Hordeum, and Secale. The last lineage contained 44 Ty1-copia clones, which were clustered with an independent branch in the evolutionary tree. Altogether, these results demonstrated a homology between P. purpureum and other gramineous plants, but also indicated certain heterogeneity (Figure 2).

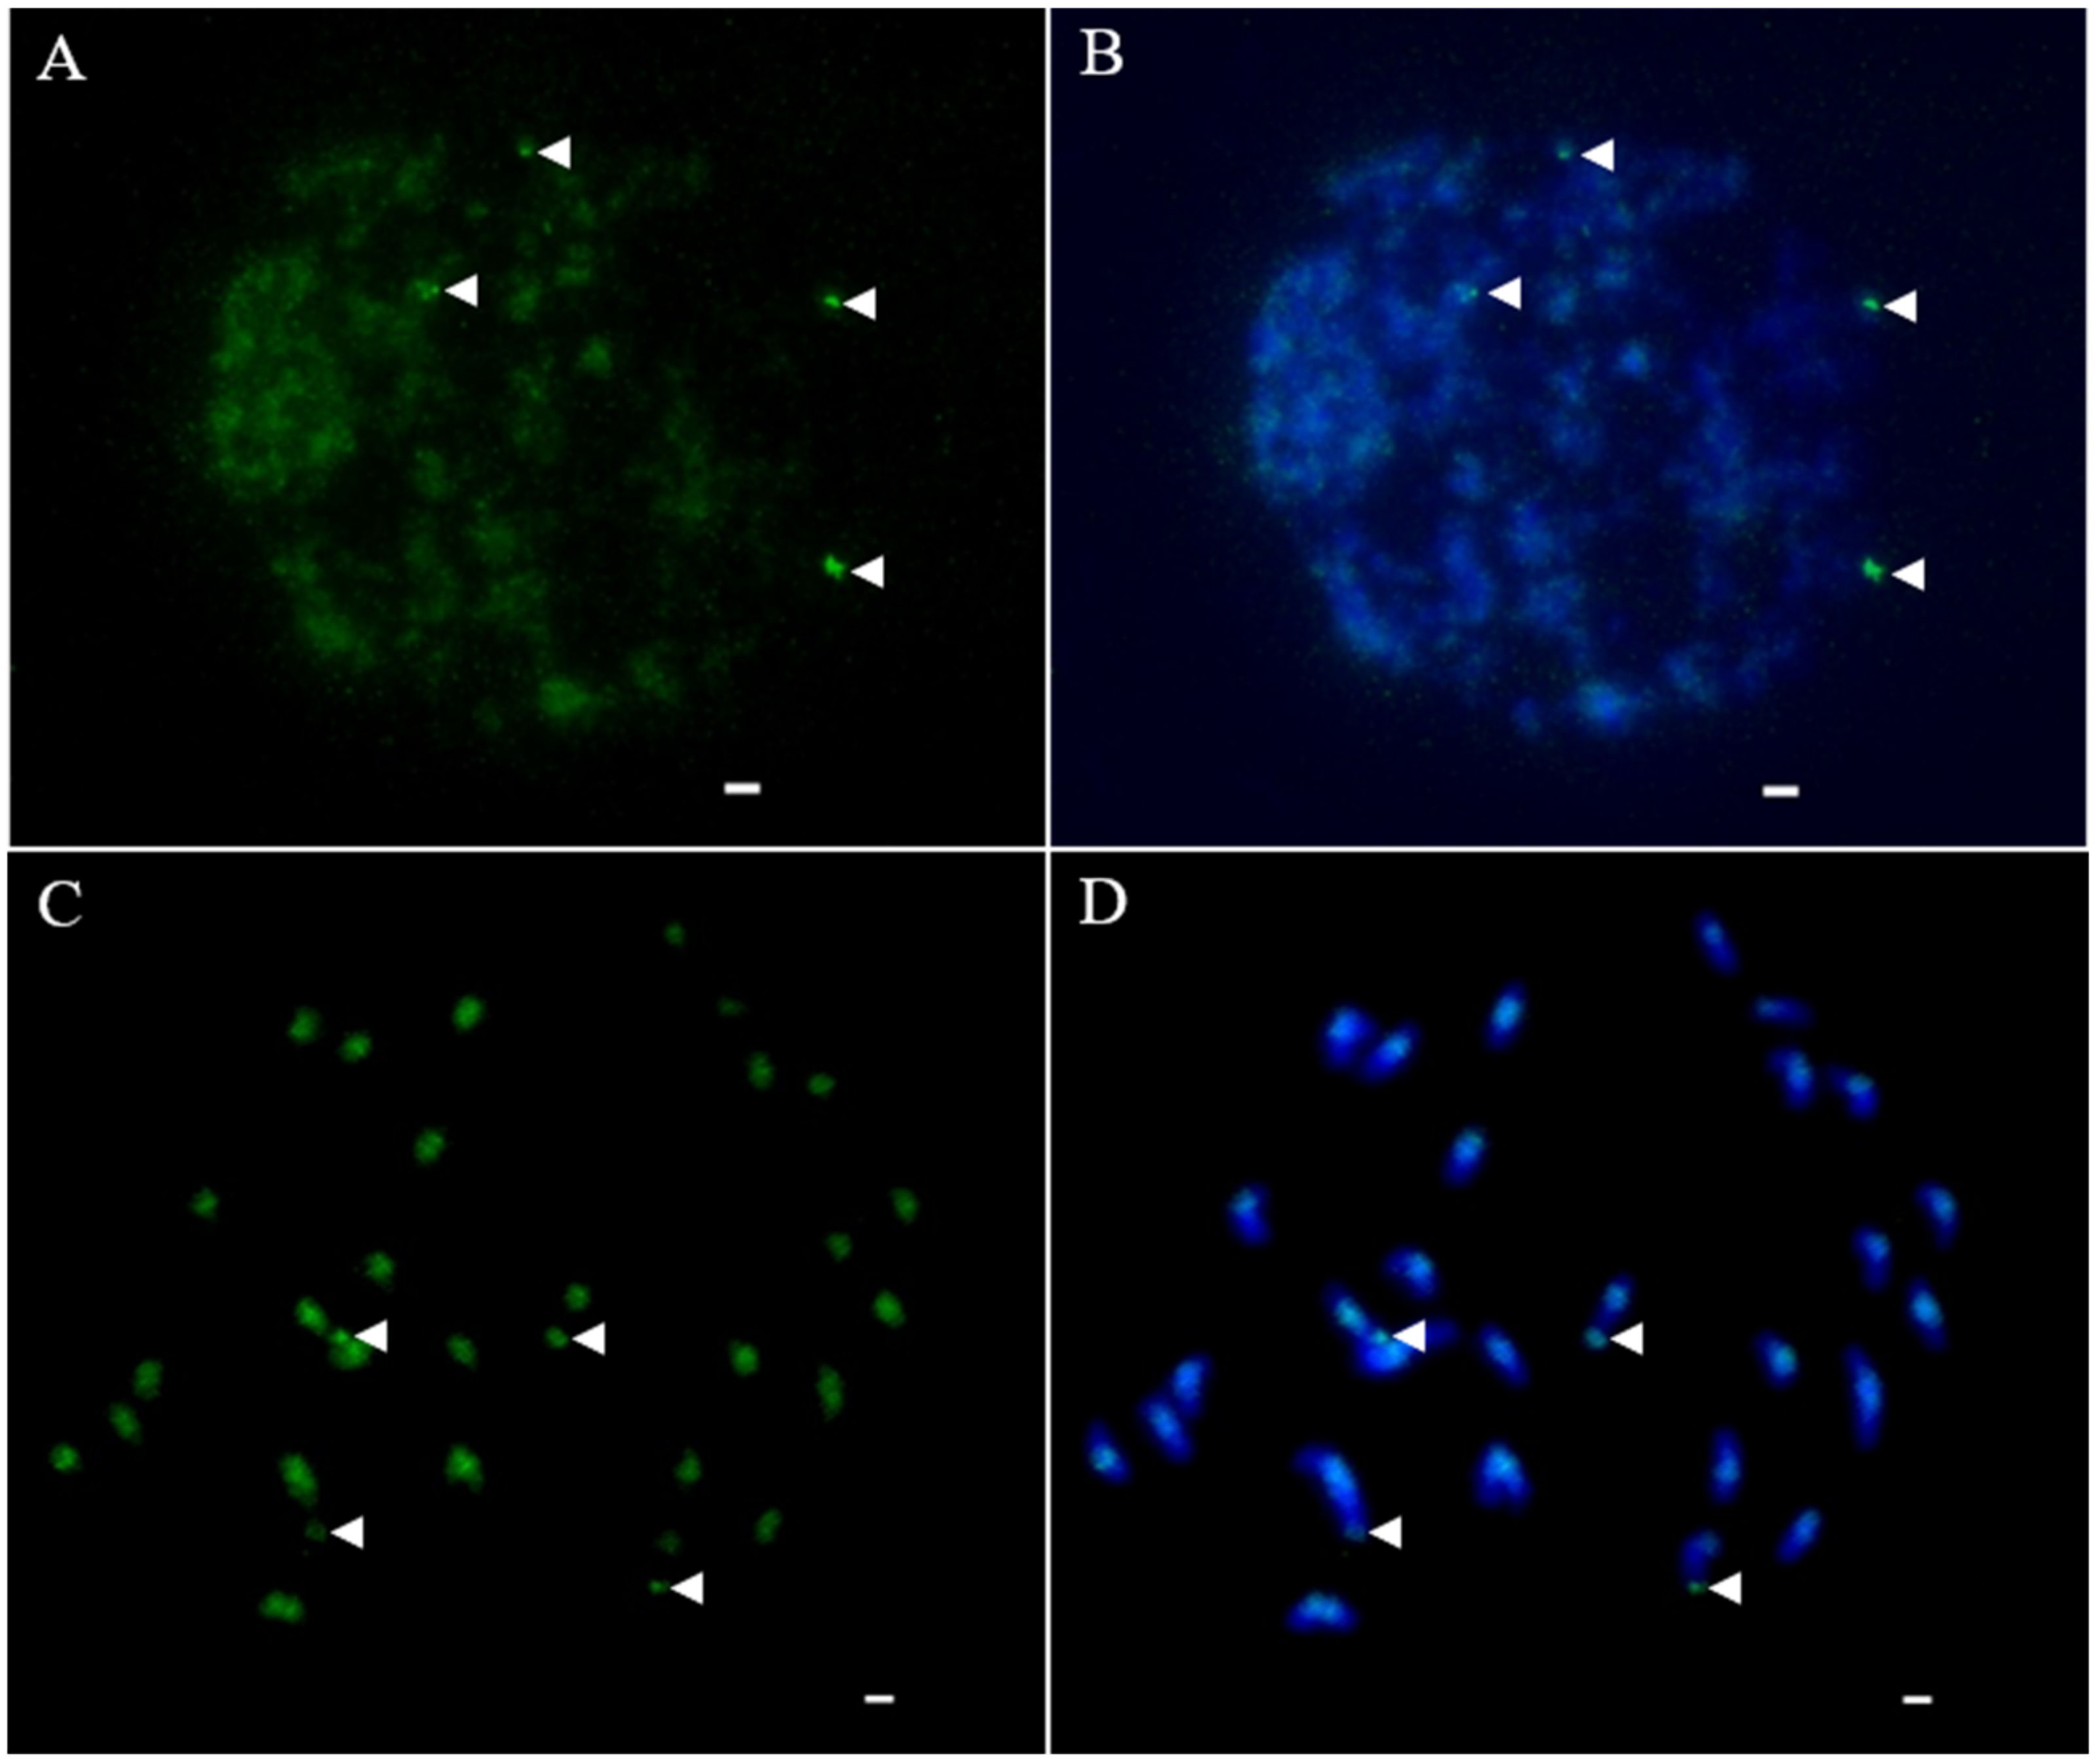
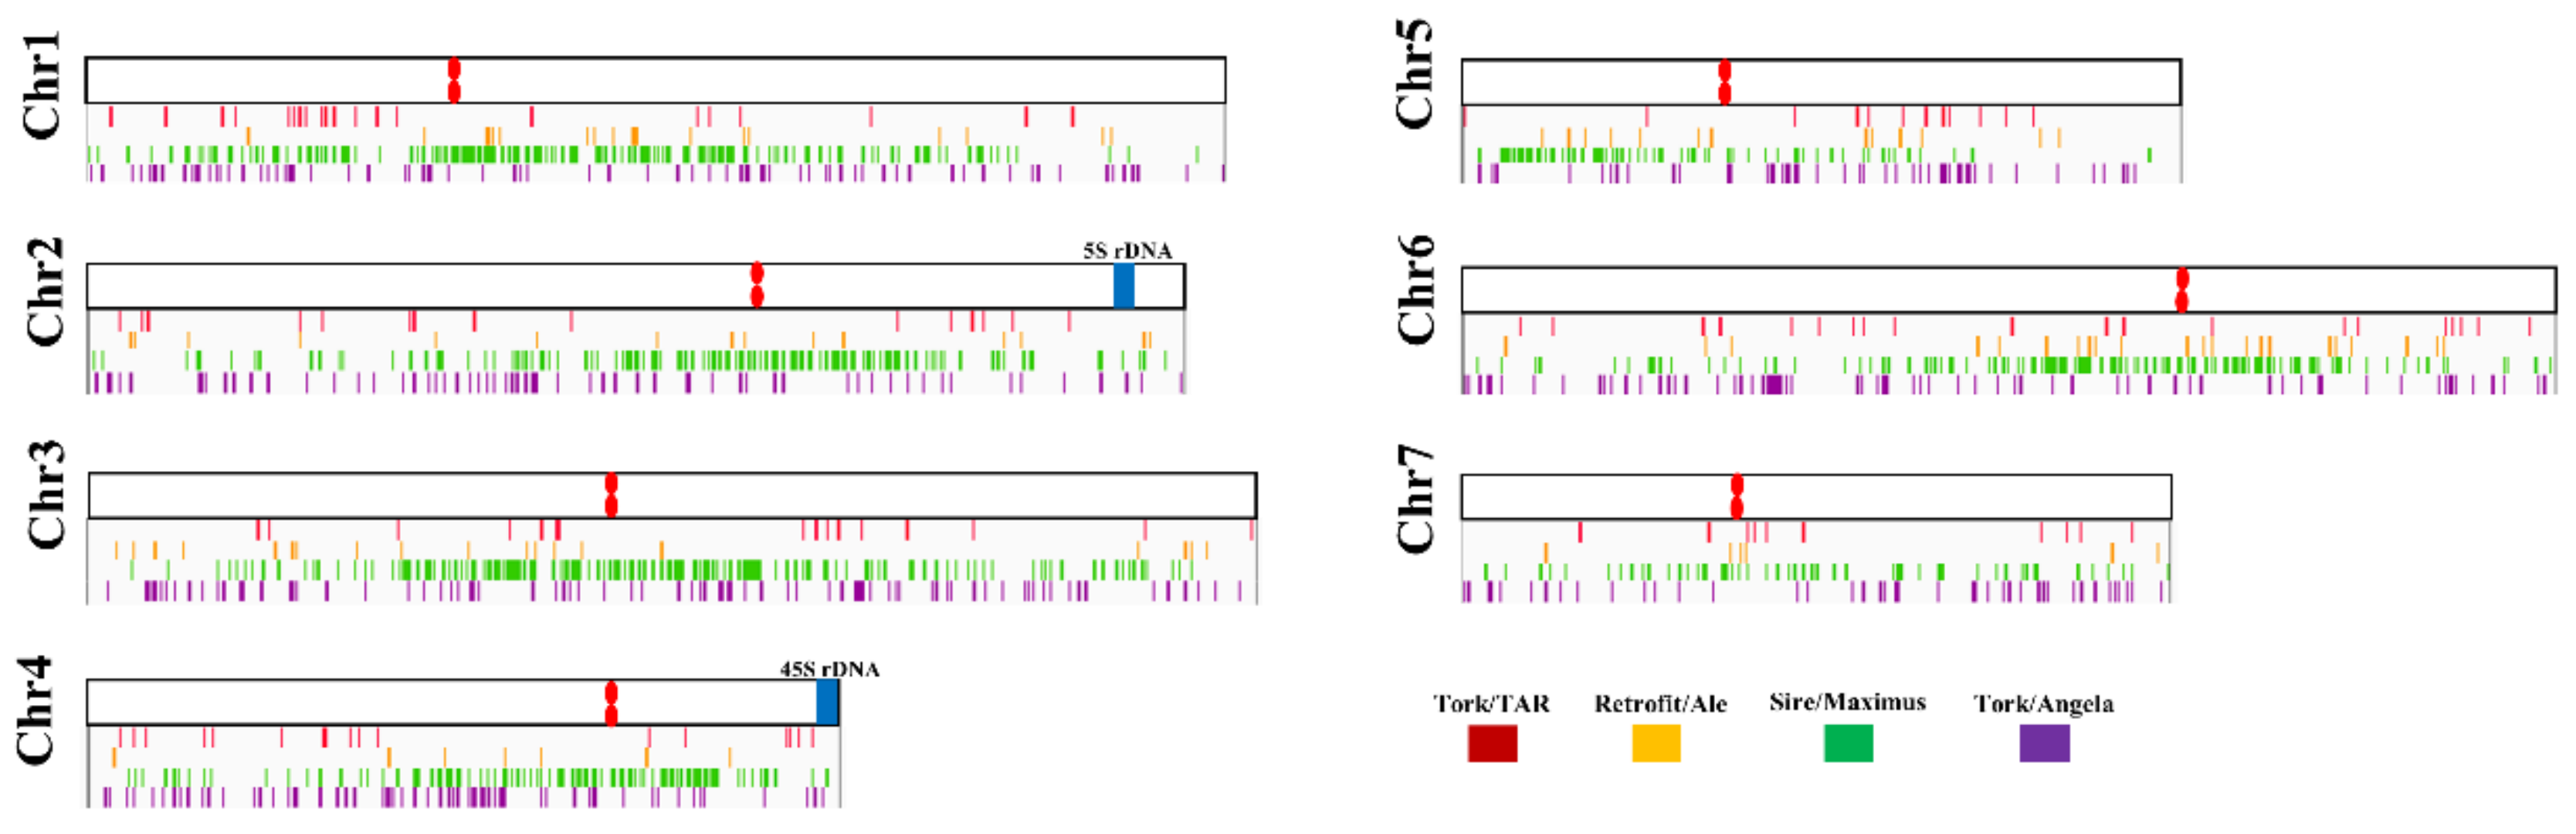
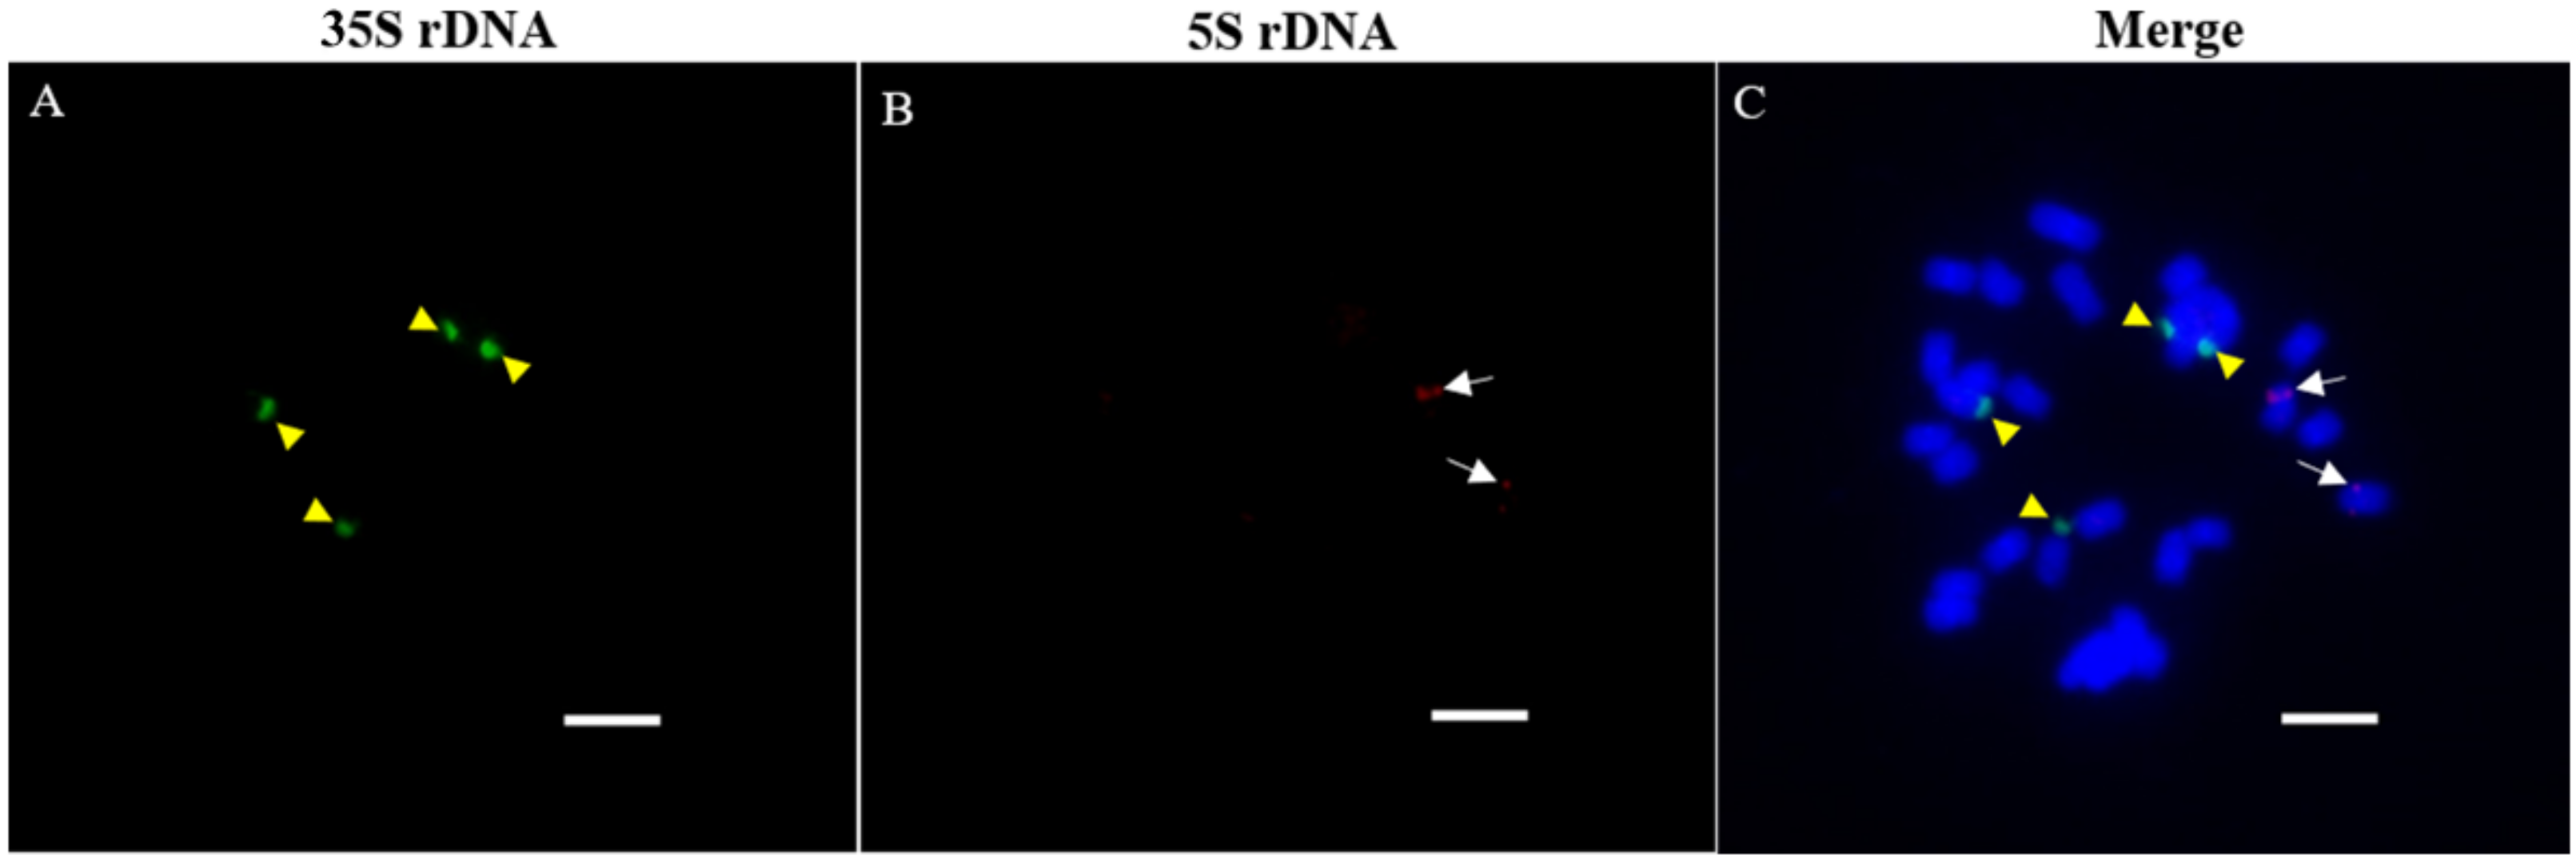
3.3. Relative Abundance in P. purpureum Genome and Chromosomal Patterns of RTs

RDB was performed to estimate the relative content of Ty1-copia RT from the P. purpureum genome. All purified plasmids of Ty1-copia RT sequences were used to hybridize to the genomic DNA of P. purpureum, while there were no obvious hybridization signals, suggesting that the single Ty1-copia RT sequence had a low content in P. purpureum genome. Then, total Ty1-copia sequences were used to hybridize the genomic DNA of P. purpureum. Results showed that they produced obvious hybridization signals, confirming that total Ty1-copia retrotransposons had a large content in the P. purpureum genome (Figure 3). A quantitative dot-blot assay was performed to detect the copy number of the total Ty1-copia RT in the P. purpureum genome, using serial dilutions of total Ty1-copia RT as probes and genomic DNA from P. purpureum. To improve the accuracy of the detection, we set up three technical repeats. The hybridization intensity data indicated that the copy number of total Ty1-copia RT sequences was approximately 5.12 × 10³ in a haploid nucleus (Figure 3).
FISH was carried out on interphase nuclei and somatic metaphase chromosomes for investigating the chromosomal pattern of Ty1-copia RT sequences in the P. purpureum genome. The DAPI-positive heterochromatic region was colored by Ty1-copia probes in interphase nuclei (Figure 4). However, feeble hybridization signals were observed on the euchromatic regions of interphase nuclei. Interestingly, the total Ty1-copia RT probes were differentially dispersed on somatic metaphase chromosomes. These signals showed a dispersed pattern with weak clustering, mostly distributed near the centromere region in somatic metaphase chromosomes (Figure 4). Furthermore, we also found that the total Ty1-copia retrotransposons had four obvious concentrated signals on interphase nuclei (Figure 4B). These signals were located exclusively in the distal regions of four chromosomes in the metaphase chromosomes (Figure 4D). These results suggested that there were two different drove evolution of Ty1-copia retrotransposons in P. purpureum.
Identifying the chromosomal locations of copia-type retrotransposons could facilitate the selection of families for an informative chromosomal marker in karyotype. The previous paper reported that P. purpureum is an allotetraploid (A’A’BB) and confirmed that genome A’A’ has a high homology with P. glaucum (genome A, 2n = 2x = 14) [41]. Hence, the chromosome distribution of our identified four known lineages, Tork/TAR, Tork/Angela, Sire/Maximus, and Retrofit/Ale was evaluated using the published P. glaucum genome. Results suggested that the Sire/Maximus had 1052 copies in P. glaucum. The copy number of Tork/Angela, Tork/TAR and Retrofit/Ale were 551, 131 and 116 respectively (Figure 5). Notably, most Sire/Maximus sequences were closed to the centromeric regions in P. glaucum chromosomes (Figure 5), and these results were partly consistent with the FISH location of RTs in P. purpureum (Figure 4). The conserved 5S and 35S rDNAs sequences were also detected in chromosome 2 and chromosome 4 (Figure 5).
Further, the chromosomal location of 35S rDNA and 5S rDNA in the P. purpureum genome were also detected. FISH analysis was performed using digoxigenin (DIG)-labeled 35S rDNA and biotin-labeled 5S rDNA as probes. The 35S rDNA probe was located in the distal regions of four chromosome 4, and the region was distinctly decondensed compared to the rest of the chromosome (Figure 6). Two of the four homologous chromosomes lacked the 5S rDNA loci, and the 5S rDNA probe was only located in two chromosome 2 (Figure 5 and Figure 6). In addition, a double-label FISH assay was performed using digoxigenin (DIG)-labeled Ty1-copia sequences, biotin-labeled 35S rDNA, and 5S rDNA as probes to examine their co-localization in P. purpureum. As expected, copia-type retrotransposon was located in the distal regions of four chromosomes homologous chromosomes (Figure 7). Moreover, these probes were found to be non-overlapping, indicating that the copia-type retrotransposons may be a reliable marker for chromosome identification and karyotyping studies in P. purpureum (Figure 7D).

4. Discussion

P. purpureum belongs to an economically important tropical forage plant in the genus Pennisetum. Although it is becoming an increasingly popular crop that can be used to produce clean energy ethanol, its allotetraploid genome origin, structure, and evolution have not yet been thoroughly studied. Retrotransposons will drive genetic diversity that can potentially cause alterations in genome structure and gene expression, and these elements are thought to be crucial for genome plasticity and evolution [42,43,44,45,46]. Owing to genome scale sequencing being expensive, using PCR to amplify conserved regions of Ty1-copia retrotransposons has resulted in an explosive number of molecular level researches of these elements on evolution and phylogenetic relationships in different plants [24,25,26,27,29,39,47,48]. In this study, a high degree of heterogeneity was found in Ty1-copia retrotransposon sequences from P. purpureum using PCR amplification, which was consistent with other previous reported in various plants [25,26,27,29,39,47].
Phylogenetic analysis of amino acid sequences showed these Ty1-copia RT sequences clustered into six main subgroups in a highly ramified tree (Figure 2), indicating the large genetic variability within this species. Reis et al. showed that P. purpureum is an allotetraploid (A’A’BB) and confirmed that genome A’A’ has a high homology with P. glaucum (genome A, 2n = 2x = 14), while genome A’A’ was distinguished from genome BB [41]. Therefore, such large genetic variability of Ty1-copia retrotransposon may result from different diploid genomes (A’ and B genome) in P. purpureum, as some belong to the A’ genome while others belong to the B genome. In the present study, 27.27% (24 clones) of Ty1-copia RT sequences may be non-functional in P. purpureum, owing to an appearance in stop codons or frameshifts. Of these, all longer Ty1-copia RT sequences included stop codons. This result suggested that the heterogeneous elements may be derived from the accumulation of mutations of defective elements in the host plant genome. This phenomenon is also ubiquitous in other plants, with a defective rate as high as >80% [39]. Additionally, the majority of Ty1-copia RT sequences was an independent clade in the evolutionary tree among different graminaceous species, indicating that these sequences have potential to be a PCR molecular marker to assist the plant breeding in P. purpureum.
Retrotransposons make a great contribution to the evolution of plant genome size, as retrotransposons comprise less than ~5–17% in a small genome, while as high as ~70–75% in a large genome [9,14,28,49]. In this study, the relative content of the Ty1-copia retrotransposons were nearly 5.12 × 10³ per genome in P. purpureum (Figure 3), indicating that Ty1-copia retrotransposons play a vital role in the genome evolution of P. purpureum. Furthermore, total Ty1-copia sequences showed dispersed organization across all chromosomes (Figure 4). Similarly, intrachromosomal localization was revealed in many taxonomic groups plant species [28,47]. Surprisingly, although total Ty1-copia sequences showed dispersed organization, stronger signals emerged near the centromere region (Figure 4). Usually, pericentromeric regions contain fewer genes and may show suppressed genetic recombination. Hence, it will result in the enrichment of Ty1-copia retrotransposons in the centromere region. Additionally, based on FISH results, we found that four homologous chromosomes have an obvious clustering in telomeres, indicating the presence of Ty1-copia sequences in chromosomal distal regions with high copies (Figure 3). There were two following possibilities that Ty1-copia RT inserted near telomeres: either the element prior inserts into subtelomeric regions or it inserts randomly throughout the genome. However, when it inserts into gene-rich regions, it would be eliminated by selection against deleterious effects of genes and chromosomal rearrangements. Overall, differential evolution pattern of Ty1-copia RTs within this species suggested that P. purpureum will be an ideal plant for further speculation in the molecular evolution determinants of Ty1-copia sequences, or pericentromeric or telomeric targeting.
Owing to the repetitive sequence usually carrying a high copy number, it has been widely used for chromosome identification in plant species [50,51]. In this study, 35S rDNA and 5S rDNA probes were located in four chromosome 4 and two chromosome 2, respectively (Figure 5 and Figure 6). This distribution pattern of 35S rDNA and 5S rDNA loci were consistent with previous studies, indicating that two 5S rDNA loci were lost or too weak to detect [5]. Co-localization of Ty1-copia, 35S rDNA, and 5S rDNA probes showed that these markers were exclusively located in different non-homologous chromosomes, making Ty1-copia probes suitable to identify the other chromosome (excluding chromosomes 2 and 4) in P. purpureum. The physical pattern of retrotransposons will specifically broaden the way to label narrow chromosomal regions or particular sub-genomes, as demonstrated in the previous reports [10,52]. Altogether, the analysis of Ty1-copia RT in this study will be helpful for further understanding the diversification of Ty1-copia retrotransposons and shed light on their chromosomal distribution patterns in P. purpureum.

5. Conclusions

This is the first molecular cytological evidence of phylogenetic diversity, genomic abundance, and chromosomal pattern of Ty1-copia retrotransposons in P. purpureum. We isolated and characterized Ty1-copia retrotransposons, which were then clustered in four known lineages (Tork/TAR, Tork/Angela, Sire/Maximus, and Retrofit/Ale) and two unclassified lineages. These retrotransposons are approximately 5.12 × 10³ per haploid genome in the P. purpureum. FISH results showed that total Ty1-copia sequences had differential distributions, and pericentromere or subtelomere regions. Furthermore, co-localization of Ty1-copia, 35S rDNA, and 5S rDNA confirmed that these sequences were located in different homologous chromosomes. Altogether, these results will be helpful for further understanding the dramatic evolution of Ty1-copia retrotransposons in P. purpureum and indicating an additional marker for identifying chromosome analysis in P. purpureum.

Author Contributions

Z.Y. wrote the original draft of the manuscript and analyzed the experimental data. Y.H. and J.W. made necessary corrections of the draft. M.Z. and Z.D. proof read the manuscript. All authors have read and agreed to the published version of the manuscript.

Funding

This work was funded by the National Natural Science Foundation of China (31771863) and supported by the China Agriculture Research System of MOF and MARA (No. CARS-20-1-5). The funders had no role in the study design, data collection, analysis, decision to publish, or preparation of the manuscript.

Institutional Review Board Statement

Not applicable.

Data Availability Statement

Data is contained within the article.

Acknowledgments

We thank the Sugarcane Research Institute of Yunnan Agriculture Science Academy for providing the plant materials used in this study. We greatly appreciate Bioscience Editing Solutions for critically reading this paper and providing helpful suggestions.

Conflicts of Interest

All the authors agree that there was no conflict of interest to declare.

References

  1. Menegol, D.; Scholl, A.L.; Fontana, R.C.; Dillon, A.J.P.; Camassola, M. Potential of a Penicillium echinulatum enzymatic complex produced in either submerged or solid-state cultures for enzymatic hydrolysis of elephant grass. Fuel 2014, 133, 232–240. [Google Scholar] [CrossRef]
  2. Han, Y.; Zhang, T.; Thammapichai, P.; Weng, Y.; Jiang, J. Chromosome-specific painting in Cucumis species using bulked oligonucleotides. Genetics 2015, 200, 771–779. [Google Scholar] [CrossRef] [Green Version]
  3. Xie, X.-M.; Zhang, X.-Q.; Dong, Z.-X.; Guo, H.-R. Dynamic changes of lignin contents of MT-1 elephant grass and its closely related cultivars. Biomass Bioenergy 2011, 35, 1732–1738. [Google Scholar] [CrossRef]
  4. Li, H.-Q.; Li, C.-L.; Sang, T.; Xu, J. Pretreatment on Miscanthus lutarioriparious by liquid hot water for efficient ethanol production. Biotechnol. Biofuels 2013, 6, 1–10. [Google Scholar] [CrossRef] [Green Version]
  5. Zhu, X.-G.; Long, S.P.; Ort, D.R. What is the maximum efficiency with which photosynthesis can convert solar energy into biomass? Curr. Opin. Biotechnol. 2008, 19, 153–159. [Google Scholar] [CrossRef]
  6. Somerville, C.; Youngs, H.; Taylor, C.; Davis, S.C.; Long, S.P. Feedstocks for lignocellulosic biofuels. Science 2010, 329, 790–792. [Google Scholar] [CrossRef] [Green Version]
  7. Woodard, K.; Prine, G. Dry matter accumulation of elephantgrass, energycane, and elephantmillet in a subtropical climate. Crop Sci. 1993, 33, 818–824. [Google Scholar] [CrossRef]
  8. Martel, E.; De Nay, D.; Siljak-Yakoviev, S.; Brown, S.; Sarr, A. Genome size variation and basic chromosome number in pearl millet and fourteen related Pennisetum species. J. Hered. 1997, 88, 139–143. [Google Scholar] [CrossRef]
  9. Vicient, C.M.; Jaaskelainen, M.J.; Kalendar, R.; Schulman, A.H. Active retrotransposons are a common feature of grass genomes. Plant Physiol. 2001, 125, 1283–1292. [Google Scholar] [CrossRef] [Green Version]
  10. Hanson, R.E.; Islam-Faridi, M.N.; Crane, C.F.; Zwick, M.S.; Czeschin, D.G.; Wendel, J.F.; McKnight, T.D.; Price, H.J.; Stelly, D.M. Ty1-copia-retrotransposon behavior in a polyploid cotton. Chromosome Res. 2000, 8, 73–76. [Google Scholar] [CrossRef]
  11. Wicker, T.; Sabot, F.; Hua-Van, A.; Bennetzen, J.L.; Capy, P.; Chalhoub, B.; Flavell, A.; Leroy, P.; Morgante, M.; Panaud, O. A unified classification system for eukaryotic transposable elements. Nat. Rev. Genet. 2007, 8, 973–982. [Google Scholar] [CrossRef]
  12. Chen, C.; Chen, H.; Zhang, Y.; Thomas, H.R.; Frank, M.H.; He, Y.; Xia, R. TBtools: An integrative toolkit developed for interactive analyses of big biological data. Mol. Plant 2020, 13, 1194–1202. [Google Scholar] [CrossRef]
  13. Kawahara, Y.; de la Bastide, M.; Hamilton, J.P.; Kanamori, H.; McCombie, W.R.; Ouyang, S.; Schwartz, D.C.; Tanaka, T.; Wu, J.; Zhou, S. Improvement of the Oryza sativa Nipponbare reference genome using next generation sequence and optical map data. Rice 2013, 6, 1–10. [Google Scholar] [CrossRef] [Green Version]
  14. Schnable, P.S.; Ware, D.; Fulton, R.S.; Stein, J.C.; Wei, F.; Pasternak, S.; Liang, C.; Zhang, J.; Fulton, L.; Graves, T.A. The B73 maize genome: Complexity, diversity, and dynamics. Science 2009, 326, 1112–1115. [Google Scholar] [CrossRef] [Green Version]
  15. Paterson, A.H.; Bowers, J.E.; Bruggmann, R.; Dubchak, I.; Grimwood, J.; Gundlach, H.; Haberer, G.; Hellsten, U.; Mitros, T.; Poliakov, A. The Sorghum bicolor genome and the diversification of grasses. Nature 2009, 457, 551–556. [Google Scholar] [CrossRef] [Green Version]
  16. Ammiraju, J.S.; Zuccolo, A.; Yu, Y.; Song, X.; Piegu, B.; Chevalier, F.; Walling, J.G.; Ma, J.; Talag, J.; Brar, D.S. Evolutionary dynamics of an ancient retrotransposon family provides insights into evolution of genome size in the genus Oryza. Plant J. 2007, 52, 342–351. [Google Scholar] [CrossRef]
  17. Cheng, Z.; Dong, F.; Langdon, T.; Ouyang, S.; Buell, C.R.; Gu, M.; Blattner, F.R.; Jiang, J. Functional rice centromeres are marked by a satellite repeat and a centromere-specific retrotransposon. Plant Cell 2002, 14, 1691–1704. [Google Scholar] [CrossRef] [Green Version]
  18. Devos, K.M.; Brown, J.K.; Bennetzen, J.L. Genome size reduction through illegitimate recombination counteracts genome expansion in Arabidopsis. Genome Res. 2002, 12, 1075–1079. [Google Scholar] [CrossRef] [PubMed] [Green Version]
  19. Gao, D.; Gill, N.; Kim, H.R.; Walling, J.G.; Zhang, W.; Fan, C.; Yu, Y.; Ma, J.; SanMiguel, P.; Jiang, N. A lineage-specific centromere retrotransposon in Oryza brachyantha. Plant J. 2009, 60, 820–831. [Google Scholar] [CrossRef]
  20. Jiang, N.; Bao, Z.; Temnykh, S.; Cheng, Z.; Jiang, J.; Wing, R.A.; McCouch, S.R.; Wessler, S.R. Dasheng: A recently amplified nonautonomous long terminal repeat element that is a major component of pericentromeric regions in rice. Genetics 2002, 161, 1293–1305. [Google Scholar] [CrossRef]
  21. Xu, Y.; Du, J. Young but not relatively old retrotransposons are preferentially located in gene-rich euchromatic regions in tomato (Solanum lycopersicum) plants. Plant J. 2014, 80, 582–591. [Google Scholar] [CrossRef] [PubMed]
  22. Kumar, A.; Bennetzen, J.L. Retrotransposons: Central players in the structure, evolution and function of plant genomes. Trends Plant Sci. 2000, 5, 509–510. [Google Scholar] [CrossRef]
  23. De la Chaux, N.; Wagner, A. BEL/Pao retrotransposons in metazoan genomes. BMC Evol. Biol. 2011, 11, 1–16. [Google Scholar] [CrossRef] [PubMed] [Green Version]
  24. Flavell, A. Ty1-copia group retrotransposons and the evolution of retroelements in the eukaryotes. In Transposable Elements and Evolution; Springer: Dordrecht, The Netherlands, 1993; pp. 258–274. [Google Scholar]
  25. Goodwin, T.; Poulter, R. A group of deuterostome Ty3/gypsy-like retrotransposons with Ty1/copia-like pol-domain orders. Mol. Genet. Genom. 2002, 267, 481–491. [Google Scholar] [CrossRef] [PubMed]
  26. Kolano, B.; Bednara, E.; Weiss-Schneeweiss, H. Isolation and characterization of reverse transcriptase fragments of LTR retrotransposons from the genome of Chenopodium quinoa (Amaranthaceae). Plant Cell Rep. 2013, 32, 1575–1588. [Google Scholar] [CrossRef] [PubMed] [Green Version]
  27. Ma, Y.; Sun, H.; Zhao, G.; Dai, H.; Gao, X.; Li, H.; Zhang, Z. Isolation and characterization of genomic retrotransposon sequences from octoploid strawberry (Fragaria × ananassa Duch.). Plant Cell Rep. 2008, 27, 499–507. [Google Scholar] [CrossRef] [PubMed]
  28. Pereira, V. Insertion bias and purifying selection of retrotransposons in the Arabidopsis thaliana genome. Genome Biol. 2004, 5, 1–10. [Google Scholar] [CrossRef] [Green Version]
  29. Santini, S.; Cavallini, A.; Natali, L.; Minelli, S.; Maggini, F.; Cionini, P. Ty1/copia-and Ty3/gypsy-like DNA sequences in Helianthus species. Chromosoma 2002, 111, 192–200. [Google Scholar] [CrossRef]
  30. Abd El-Twab, M.H.; Kondo, K. Physical mapping of 45S rDNA loci by fluorescent in situ hybridization and Evolution among polyploid Dendranthema species. Chromosome Sci. 2003, 7, 71–76. [Google Scholar]
  31. Wu, J.; Huang, Y.; Lin, Y.; Fu, C.; Liu, S.; Deng, Z.; Li, Q.; Huang, Z.; Chen, R.; Zhang, M. Unexpected inheritance pattern of Erianthus arundinaceus chromosomes in the intergeneric progeny between Saccharum spp. and Erianthus arundinaceus. PLoS ONE 2014, 9, e110390. [Google Scholar] [CrossRef] [Green Version]
  32. D’Hont, A.; Ison, D.; Alix, K.; Roux, C.; Glaszmann, J.C. Determination of basic chromosome numbers in the genus Saccharum by physical mapping of ribosomal RNA genes. Genome 1998, 41, 221–225. [Google Scholar] [CrossRef]
  33. Zhang, L.; Yang, X.; Tian, L.; Chen, L.; Yu, W. Identification of peanut (Arachis hypogaea) chromosomes using a fluorescence in situ hybridization system reveals multiple hybridization events during tetraploid peanut formation. New Phytol. 2016, 211, 1424–1439. [Google Scholar] [CrossRef] [PubMed]
  34. Stewart, C.N., Jr.; Via, L.E. A rapid CTAB DNA isolation technique useful for RAPD fingerprinting and other PCR applications. BioTechniques 1993, 14, 748–750. [Google Scholar] [PubMed]
  35. Kumar, S.; Stecher, G.; Li, M.; Knyaz, C.; Tamura, K. MEGA X: Molecular evolutionary genetics analysis across computing platforms. Mol. Biol. Evol. 2018, 35, 1547. [Google Scholar] [CrossRef] [PubMed]
  36. Ranwez, V.; Harispe, S.; Delsuc, F.; Douzery, E.J. MACSE: Multiple Alignment of Coding SEquences accounting for frameshifts and stop codons. PLoS ONE 2011, 6, e22594. [Google Scholar] [CrossRef]
  37. Santos, G.; Maia, I.M.; Araújo, F.F.; Pacheco, A.; Medeiros, S.; Gadelha, C.R.; Silva, S.C.; Araujo-Filho, R.; Oliveira, D. HiperMUSCLE: An Intuitive Graphical User Interface for the Multiple Sequence Alignment Program MUSCLE (Edgar, 2004); 2008; pp. 818–824. [Google Scholar]
  38. Thorvaldsdóttir, H.; Robinson, J.T.; Mesirov, J.P. Integrative Genomics Viewer (IGV): High-performance genomics data visualization and exploration. Brief. Bioinform. 2013, 14, 178–192. [Google Scholar] [CrossRef] [Green Version]
  39. Huang, Y.; Luo, L.; Hu, X.; Yu, F.; Yang, Y.; Deng, Z.; Wu, J.; Chen, R.; Zhang, M. Characterization, genomic organization, abundance, and chromosomal distribution of Ty1-copia retrotransposons in Erianthus arundinaceus. Front. Plant Sci. 2017, 8, 924. [Google Scholar] [CrossRef] [Green Version]
  40. Schneider, C.A.; Rasband, W.S.; Eliceiri, K.W. NIH Image to ImageJ: 25 years of image analysis. Nat. Methods 2012, 9, 671–675. [Google Scholar] [CrossRef]
  41. Dos Reis, G.B.; Mesquita, A.T.; Torres, G.A.; Andrade-Vieira, L.F.; Vander Pereira, A.; Davide, L.C. Genomic homeology between Pennisetum purpureum and Pennisetum glaucum (Poaceae). Comp. Cytogenet. 2014, 8, 199. [Google Scholar]
  42. Hawkins, J.S.; Kim, H.; Nason, J.D.; Wing, R.A.; Wendel, J.F. Differential lineage-specific amplification of transposable elements is responsible for genome size variation in Gossypium. Genome Res. 2006, 16, 1252–1261. [Google Scholar] [CrossRef] [Green Version]
  43. Kidwell, M.G.; Lisch, D. Transposable elements as sources of variation in animals and plants. Proc. Natl. Acad. Sci. USA 1997, 94, 7704–7711. [Google Scholar] [CrossRef] [PubMed] [Green Version]
  44. Lisch, D. How important are transposons for plant evolution? Nat. Rev. Genet. 2013, 14, 49–61. [Google Scholar] [CrossRef] [PubMed]
  45. Ma, J.; SanMiguel, P.; Lai, J.; Messing, J.; Bennetzen, J.L. DNA rearrangement in orthologous orp regions of the maize, rice and sorghum genomes. Genetics 2005, 170, 1209–1220. [Google Scholar] [CrossRef] [PubMed] [Green Version]
  46. Zedek, F.; Šmerda, J.; Šmarda, P.; Bureš, P. Correlated evolution of LTR retrotransposons and genome size in the genus Eleocharis. BMC Plant Biol. 2010, 10, 1–10. [Google Scholar] [CrossRef] [Green Version]
  47. Alipour, A.; Tsuchimoto, S.; Sakai, H.; Ohmido, N.; Fukui, K. Structural characterization of copia-type retrotransposons leads to insights into the marker development in a biofuel crop, Jatropha curcas L. Biotechnol. Biofuels 2013, 6, 1–13. [Google Scholar] [CrossRef] [Green Version]
  48. Pearce, S.R.; Pich, U.; Harrison, G.; Flavell, A.J.; Heslop-Harrison, J.; Schubert, I.; Kumar, A. TheTy1-copia group retrotransposons ofAllium cepa are distributed throughout the chromosomes but are enriched in the terminal heterochromatin. Chromosome Res. 1996, 4, 357–364. [Google Scholar] [CrossRef]
  49. McCarthy, E.M.; Liu, J.; Lizhi, G.; McDonald, J.F. Long terminal repeat retrotransposons of Oryza sativa. Genome Biol. 2002, 3, 1–11. [Google Scholar] [CrossRef] [Green Version]
  50. Kato, A.; Lamb, J.C.; Birchler, J.A. Chromosome painting using repetitive DNA sequences as probes for somatic chromosome identification in maize. Proc. Natl. Acad. Sci. USA 2004, 101, 13554–13559. [Google Scholar] [CrossRef] [Green Version]
  51. Malik, H.S.; Henikoff, S. Major evolutionary transitions in centromere complexity. Cell 2009, 138, 1067–1082. [Google Scholar] [CrossRef] [Green Version]
  52. Wang, S.; Liu, N.; Peng, K.; Zhang, Q. The distribution and copy number of copia-like retrotransposons in rice (Oryza sativa L.) and their implications in the organization and evolution of the rice genome. Proc. Natl. Acad. Sci. USA 1999, 96, 6824–6828. [Google Scholar] [CrossRef] [Green Version]
Figure 1. Phylogenetic analysis of Ty1-copia RT isolated from P. purpureum. The bootstrap support above 60% were retained.
Agronomy 12 01312 g001
Figure 2. Phylogenetic analysis of amino acid sequences based on Ty1-copia RT sequences from P. purpureum. The RT sequences of Saccharum, Oryza, Hordeum, Sorghum, Triticum, and Zea were used for comparative phylogenetic analysis. Bootstrap values over 60 are indicated at the nodes.
Agronomy 12 01312 g002
Figure 3. Estimation of the total copy number of Ty1-copia RT sequences in the P. purpureum genome. Serial dilutions (ng) of genomic DNA from P. purpureum row (a) and Ty1-copia RT sequences plasmids row (b).
Agronomy 12 01312 g003
Figure 4. FISH results of Ty1-copia RT sequences on different stage chromosomes of P. purpureum (2n = 4x = 28). Nucleus and prometaphase chromosomes stained with DAPI (B,D). Total Ty1-copia RT probes on the interphase nucleus (A) and metaphase chromosomes (C). White arrows indicated obvious concentrated signals in telomeres. Scale bars = 5 μm.
Agronomy 12 01312 g004
Figure 5. Genome distribution of RTs, 35S rDNA, and 5S rDNA in P. glaucum. The sequences of PpTy-copia-21 (Tork/TAR), PpTy-copia-46 (Retrofit/Ale), PpTy-copia-69 (Sire/Maximus), and PpTy-copia-87 (Tork/Angela) were used for alignment with P. glaucum genome.
Agronomy 12 01312 g005
Figure 6. Localization of 35S rDNA and 5S rDNA probes on root-tip mitosis prometaphase chromosomes of P. purpureum (2n = 4x = 28) by FISH. (A) Location of 35S rDNA on prometaphase chromosomes. Yellow arrows indicated 35S rDNA signals (green). (B) Location of 5S rDNA on prometaphase chromosomes. Long white arrows indicated 5S rDNA signals (red). (C) The merged signals combined 35S rDNA, 5S rDNA and chromosomes (DAPI). Scale bars = 5 μm.
Agronomy 12 01312 g006
Figure 7. Localization of Ty1-copia 35S rDNA and 5S rDNA probes on root-tip mitosis prometaphase chromosomes of P. purpureum (2n = 4x = 28) by FISH. (A) Location of 35S rDNA and 5S rDNA on prometaphase chromosomes. (B) Location of Ty1-copia on prometaphase chromosomes. (C) The merged signals combined Ty1-copia and chromosomes (DAPI). (D) The merged signals combined Ty1-copia, 35S rDNA, 5S rDNA and chromosomes (DAPI). White arrows indicated Ty1-copia signals (green). Yellow arrows indicated 35S rDNA signals (red). Long white arrows indicated 5S rDNA signals (red). Scale bars = 5 μm.
Agronomy 12 01312 g007
Table 1. Classification of PCR products into families based on amino acid similarity.
Clones NumberAmino Acid SimilarityStop Coding or Frameshift MutationsClones NumberAmino Acid SimilarityStop Coding or Frameshift Mutations
1N/A-43N/A-
2N/A-44N/A-
3, 64100%-45N/AFrameshift mutations
4N/AStop coding46N/A-
5N/A-49N/A-
6, 24100%Stop coding51N/A-
7N/AStop coding52N/A-
8N/A 53N/A-
9N/AFrameshift mutations54N/A-
10, 30100%-55N/AFrameshift mutations
11, 33, 59, 62100%-56N/AStop coding
12, 14100%-57N/A-
13N/A-58N/A-
15,47100%-60N/AFrameshift mutations
16N/AStop coding61N/A-
17N/AStop coding63N/A-
18N/A-65N/AStop coding
19N/A-66N/AStop coding
20N/AFrameshift mutations67N/AFrameshift mutations
21N/A-68N/A-
22N/A-69N/AFrameshift mutations
23N/A-71N/A-
24N/AStop coding72N/AFrameshift mutations
25, 48100%-73N/AFrameshift mutations
26N/AStop coding74N/A-
27N/A-75, 85N/A-
28N/A-76N/A-
29N/AFrameshift mutations77N/A-
31N/AStop coding78N/A-
32N/A-79N/A-
34N/A-80N/A-
35N/AFrameshift mutations81N/A-
36N/A-82N/A-
37,50100%-83N/A-
38N/AFrameshift mutations84N/A-
39N/A-86N/A-
40N/AFrameshift mutations87N/A-
41N/A-88N/A-
42, 70N/A-
Note: N/A means not applicable. “-” means did not contain stop coding or frameshift.
Publisher’s Note: MDPI stays neutral with regard to jurisdictional claims in published maps and institutional affiliations.

