Article

Effect of Tillage and Residue-Returning Mode on Soil Carbon Mineralizability and Accumulation in a Wheat–Maize System

College of Agronomy and Biotechnology, China Agricultural University/Key Laboratory of Farming System of Ministry of Agriculture and Rural Affairs of China, Beijing 100193, China
*
Author to whom correspondence should be addressed.
Agronomy 2022, 12(6), 1442; https://doi.org/10.3390/agronomy12061442
Submission received: 10 May 2022 / Revised: 4 June 2022 / Accepted: 13 June 2022 / Published: 16 June 2022

Abstract

:
Conservation tillage has been widely adopted to improve soil organic carbon (SOC) accumulation. To assess the effects of different tillage and residue-returning modes on SOC mineralizability and accumulation, a field experiment was conducted in 2015, including two tillage modes, i.e., no-tillage (NT) and rotary-tillage (RT), as well as three straw-returning modes, i.e., no straw returning (N0), wheat straw returning (WR), and wheat–maize straw retuning (WM). Wheat–maize root, maize straw, and wheat straw were added to soil samples during laboratory incubation. The results showed that NT significantly increased SOC concentration by 26.75% at a depth of 0–10 cm (p < 0.01). Although NT significantly decreased SOC mineralizability at soil depths of 0–10 cm and 10–20 cm (p < 0.05), the residue did not significantly affect SOC mineralizability in the 0–20 cm layer. The potentially mineralized C (Cp) and organic labile C fraction (C1) increased with the increase of residue amount. A significant correlation (R2 = 0.662) was observed between C1 and SOC concentration. Notably, SOC concentration and mineralizability without straw returning were insignificant between N0 and WR in the 0–10 cm and 0–20 cm layers, respectively. This suggests that NT with WR is a promising strategy to increase SOC concentration and decrease mineralizability.

1. Introduction

A soil organic carbon (SOC) stock (~1580 Gt C) [1] about three times the levels of global atmospheric carbon (C) [2,3] is essential for climate mitigation. SOC can act as a source and pool of carbon dioxide (CO2) [4]. Thus, SOC variation can result in greenhouse gas variation, thus affecting climate change [5]. The interpretation of SOC in agroecosystems depends on the C input from straw returning and the C output from C mineralization [6]. Therefore, it is critical to clarify different treatment effects on SOC accumulation and mineralization that increase SOC concentration to mitigate global warming.
Previous studies indicated that SOC mineralization changes are sensitive to tillage and straw-returning modes [7,8]. Additionally, the incubation time significantly impacts on SOC mineralization. For example, the results of Kan et al. [9] and Qi et al. [10] who conducted incubations for 60 days are different from those of Das et al. [11] who performed incubations for 42 days. Thus, long-term laboratory incubation experiments are needed to identify the tillage practice effects on SOC mineralization. SOC mineralization variation under crop returning has also reported inconsistent results. Sarker et al. [12] reported that straw returning could enhance SOC mineralization by adding labile organic C from crop straw. However, previous studies also indicated that straw returning potentially protected SOC from mineralization, which could be due to the increase of soil aggregates caused by straw returning [13,14]. These opposite conclusions may contribute to C pool enhancement by straw returning, and the C pool increase could lead to a higher SOC mineralization potential (Cp). Considering the SOC concentration increase by continuous C input, SOC mineralizability (expressed as mg C g−1 SOC) is a reasonable indicator of the capability of SOC protection. However, the straw-returning and tillage effects on SOC mineralizability remain to be further investigated.
Tillage practices substantially influence SOC cycling and play a decisive role in climate-smart agriculture [15,16]. Conservation tillage based on no-tillage (NT) with straw returning benefits SOC accumulation due to minimizing soil disturbance and topsoil straw addition [17]. Previous studies also showed that traditional tillage (i.e., plow tillage [PT]) could stimulate CO2 emission due to soil organic matter exposure after soil aggregate destruction [18]. Dimassi et al. [19] reported that mineralizability positively correlated with the particulate organic carbon (POC). Compared with tillage, NT contributed to higher POC and produced more SOC mineralizability. However, SOC mineralization results under no-tillage are contradictory. Sarker et al. [20] and Qin et al. [21] reported NT decreased mineralization compared with PT. Dimassi et al. [19] and Sauvadet et al. [22] reported that conservation tillage increased SOC mineralization. These contrasting results may be due to variations in local environmental conditions or tillage practices. Thus, identifying the effects of tillage modes on SOC mineralizability and accumulation are critical to protecting soil health around the world.
The North China Plain (NCP) is a critical food-producing area in China and accounts for about 30% of China food production [9]. The winter wheat (Triticum aestivum L.)–summer maize (Zea mays L.) cropping system in the NCP generates an enormous amount of straw. In the past, straw was used for heating, animal feed, and biofuel. However, currently, crop straw is usually burnt in the open, thus producing large amounts of pollutants, leading to severe environmental pollution [23]. Moreover, intensive cultivation and the use of fertilizers, due to an increasing food demand in the NCP, have negative impacts [24]. Conservation tillage improves the soil quality to meet agricultural sustainability requirements [25]. Therefore, no-tillage with straw returning has been widely adopted in the NCP to enhance the SOC concentration and improve the soil quality. Kan et al. [9] reported how conservation tillage affects SOC sequestration and mineralization under both wheat and maize residue returning. When returned to the field, large amounts of wheat and maize residue may lower SOC sequestration efficiency. Thus, exploring reasonable tillage and residue-returning modes (e.g., no-tillage with wheat–maize straw or rotary tillage with no straw returning) and identifying the mechanisms of SOC accumulation under different tillage and residue managements is crucial.
The objectives of this study were to (1) identify the tillage effects on SOC mineralizability; (2) identify the straw-returning effects on SOC mineralizability; and (3) assess the relationship between SOC accumulation and mineralizability under different tillage and straw-returning modes. We hypothesized that straw returning would increase SOC concentration and that long-term no-tillage with straw returning could help to protect SOC from mineralization.

2. Materials and Methods

2.1. Study Site and Experiment Design

This study assessed C accumulation and mineralizability under different residue and tillage modes based on laboratory incubation and field experiments. The field experiment was conducted at the Wuqiao Experimental Station (37°36′ N, 116°21′ E), Hebei Provence, China, in 2015. This site is considered to be in a temperate continental climate zone, with annual precipitation of 531.1 mm and temperature of 12.6 °C. The soil physical and chemical properties were presented by Pu et al. [26].
The experiment involved two factors (straw returning and tillage) arranged in a randomized block design: (1) no-tillage with no straw returning (N0); (2) no-tillage with wheat straw returning (NWR); (3) no-tillage with maize and wheat straw returning (NWM); (4) rotary tillage with no straw returning (X0); (5) rotary tillage with wheat straw returning (XWR); (6) rotary tillage with maize and wheat straw returning (XWM). The treatments above were designed as a triplicate, completely randomized experiment with 18 plots (plot size of 7 m × 25 m). The tillage methods were applied only before wheat planting (after maize harvesting), and each treatment was non-tilled in the maize season. Straw management (returning or non-returning) differed between the wheat and the maize seasons. The carbon input from wheat and maize straw (above-ground fraction) was approximately 3200 and 4500 kg ha−1 y−1, respectively.
After maize harvesting, the soil surface was plowed twice (about 15 cm deep) with a rotary tiller. The maize straw was shredded by rotary tillage and incorporated into the topsoil of the straw-returning treatment.

2.2. Soil Sampling

Soil sampling occurred in the 0–10 cm and 10–20 cm layers after the winter wheat harvest during June 2020. Five samples were obtained from each plot. Before analysis, air-dried soil samples were sieved through a 2 mm sieve and stored at 4 °C.
Soil samples without straw addition were used to simulate different treatment effects on SOC mineralizability as field experiments. Soil samples from tillage treatments (NT and RT) were added to the wheat–maize root (WMR), maize straw (MS), and wheat straw (WS) treatments (Table 1), to simulate different treatment effects in the laboratory incubation after straw addition.

2.3. Laboratory Incubation

All soil samples were kept in 330 mL air-tight jars. The equivalent of 30 g of soil was stored in each sample and kept at 70% water holding capacity. After seven days of pre-incubation, the vessels were kept at 25 °C for 112 days. The released CO2 was trapped in a vessel containing 10 mL of 1 M NaOH, and SOC was measured using K2Cr2O7−H2SO4 oxidation [27]. The bottom was taken out on the 3rd, 7th, 14th, 28th, 56th, 84th, and 112th incubation day to measure the soil CO2 emission with HCl; the results are expressed as mineralizability (mg CO2−C kg−1 of SOC). Three empty vessels were set up as a control to eliminate the influence of atmospheric CO2 in the air.

2.4. SOC Mineralization

2.4.1. Cumulative SOC Mineralization

The first-order-kinetic one-compartment model was used to calculate the mean cumulative C mineralization. This model assumes that SOC mineralization originates from the potentially mineralized C (Cp). Cp can be estimated as a liable mineralized carbon component, and the rate of its decomposition is K0:
Ccu (t) = Cp (1 − e−K0×),
where Ccu(t) is the average accumulated C per unit of carbon at time t (mg C g−1 C), Cp is the potentially mineralizable C (mg C g−1 C), and K0 is the rate of constant mineralization. SPSS 25.0 (SPSS Inc., Chicago, IL, USA) estimates two unknown quantifications (Cp and K0).
Ccu also satisfies the following equation [11]:
Ccu = Cm/(SOC concentration),
Cm is the cumulative SOC mineralization after time t (mg CO2−C kg−1 soil).

2.4.2. Mean Cumulative C Mineralization

The first-order-kinetic two-compartment model was used to calculate the mean cumulative C mineralization. Two pools (C1 and C2) contribute to the sample’s total initial organic carbon:
Ccu(t) = C1(1 − e−K1×t) + C2(1 − e−K2×t),
where Ccu (t) (mg C g−1 C) is the average cumulative C mineralization per unit carbon in time t, C1 (mg C g−1 C) is the mass of the organic labile carbon fraction, C2 (mg C g−1 C) is the mass of the more recalcitrant, resistant C fraction. K1 and K2 (day−1) are the mineralization constant rates for the labile and more recalcitrant carbon fractions, respectively.
To match the model to the data, we assumed that the sum of C1 and C2 equaled 1000 mg C g−1 C. We also applied the following two restrictions between the parameters:
(1)
The value of K2 is less than that of K1;
(2)
K1 is more significant than 0.
SPSS 25.0 (SPSS Inc., Chicago, IL, USA) estimates four unknown quantifications (C1, K1, C2, and K2).
Normality and homogeneity of variance were validated before analysis of variance (ANOVA), which was used to study the effects of the treatments (tillage and residue). A general linear model for two-way ANOVA was used to test the tillage effects. The results were tested by the least significant difference (LSD) test at p < 0.05.

3. Results

3.1. SOC Concentration

Residue, tillage, and their interaction significantly affected the SOC stock in the 0–10 cm layer (Table 2). However, only the residue treatment affected the SOC concentration significantly in the 10–20 cm layer. In the 0–10 cm soil layer, the SOC under NT was higher than that under RT by 26.75% (2.25 g kg−1 soil). As for WM, SOC was higher for the residue treatment than for the other treatments by 25.92–34.48% (2.32–2.89 g kg−1 soil). There was no significant difference in the 10–20 cm layer for NT and RT. The WM residue was 15.2–26.08% (0.88–1.38 g kg−1 soil) higher than the residue for N0 and WR treatments.

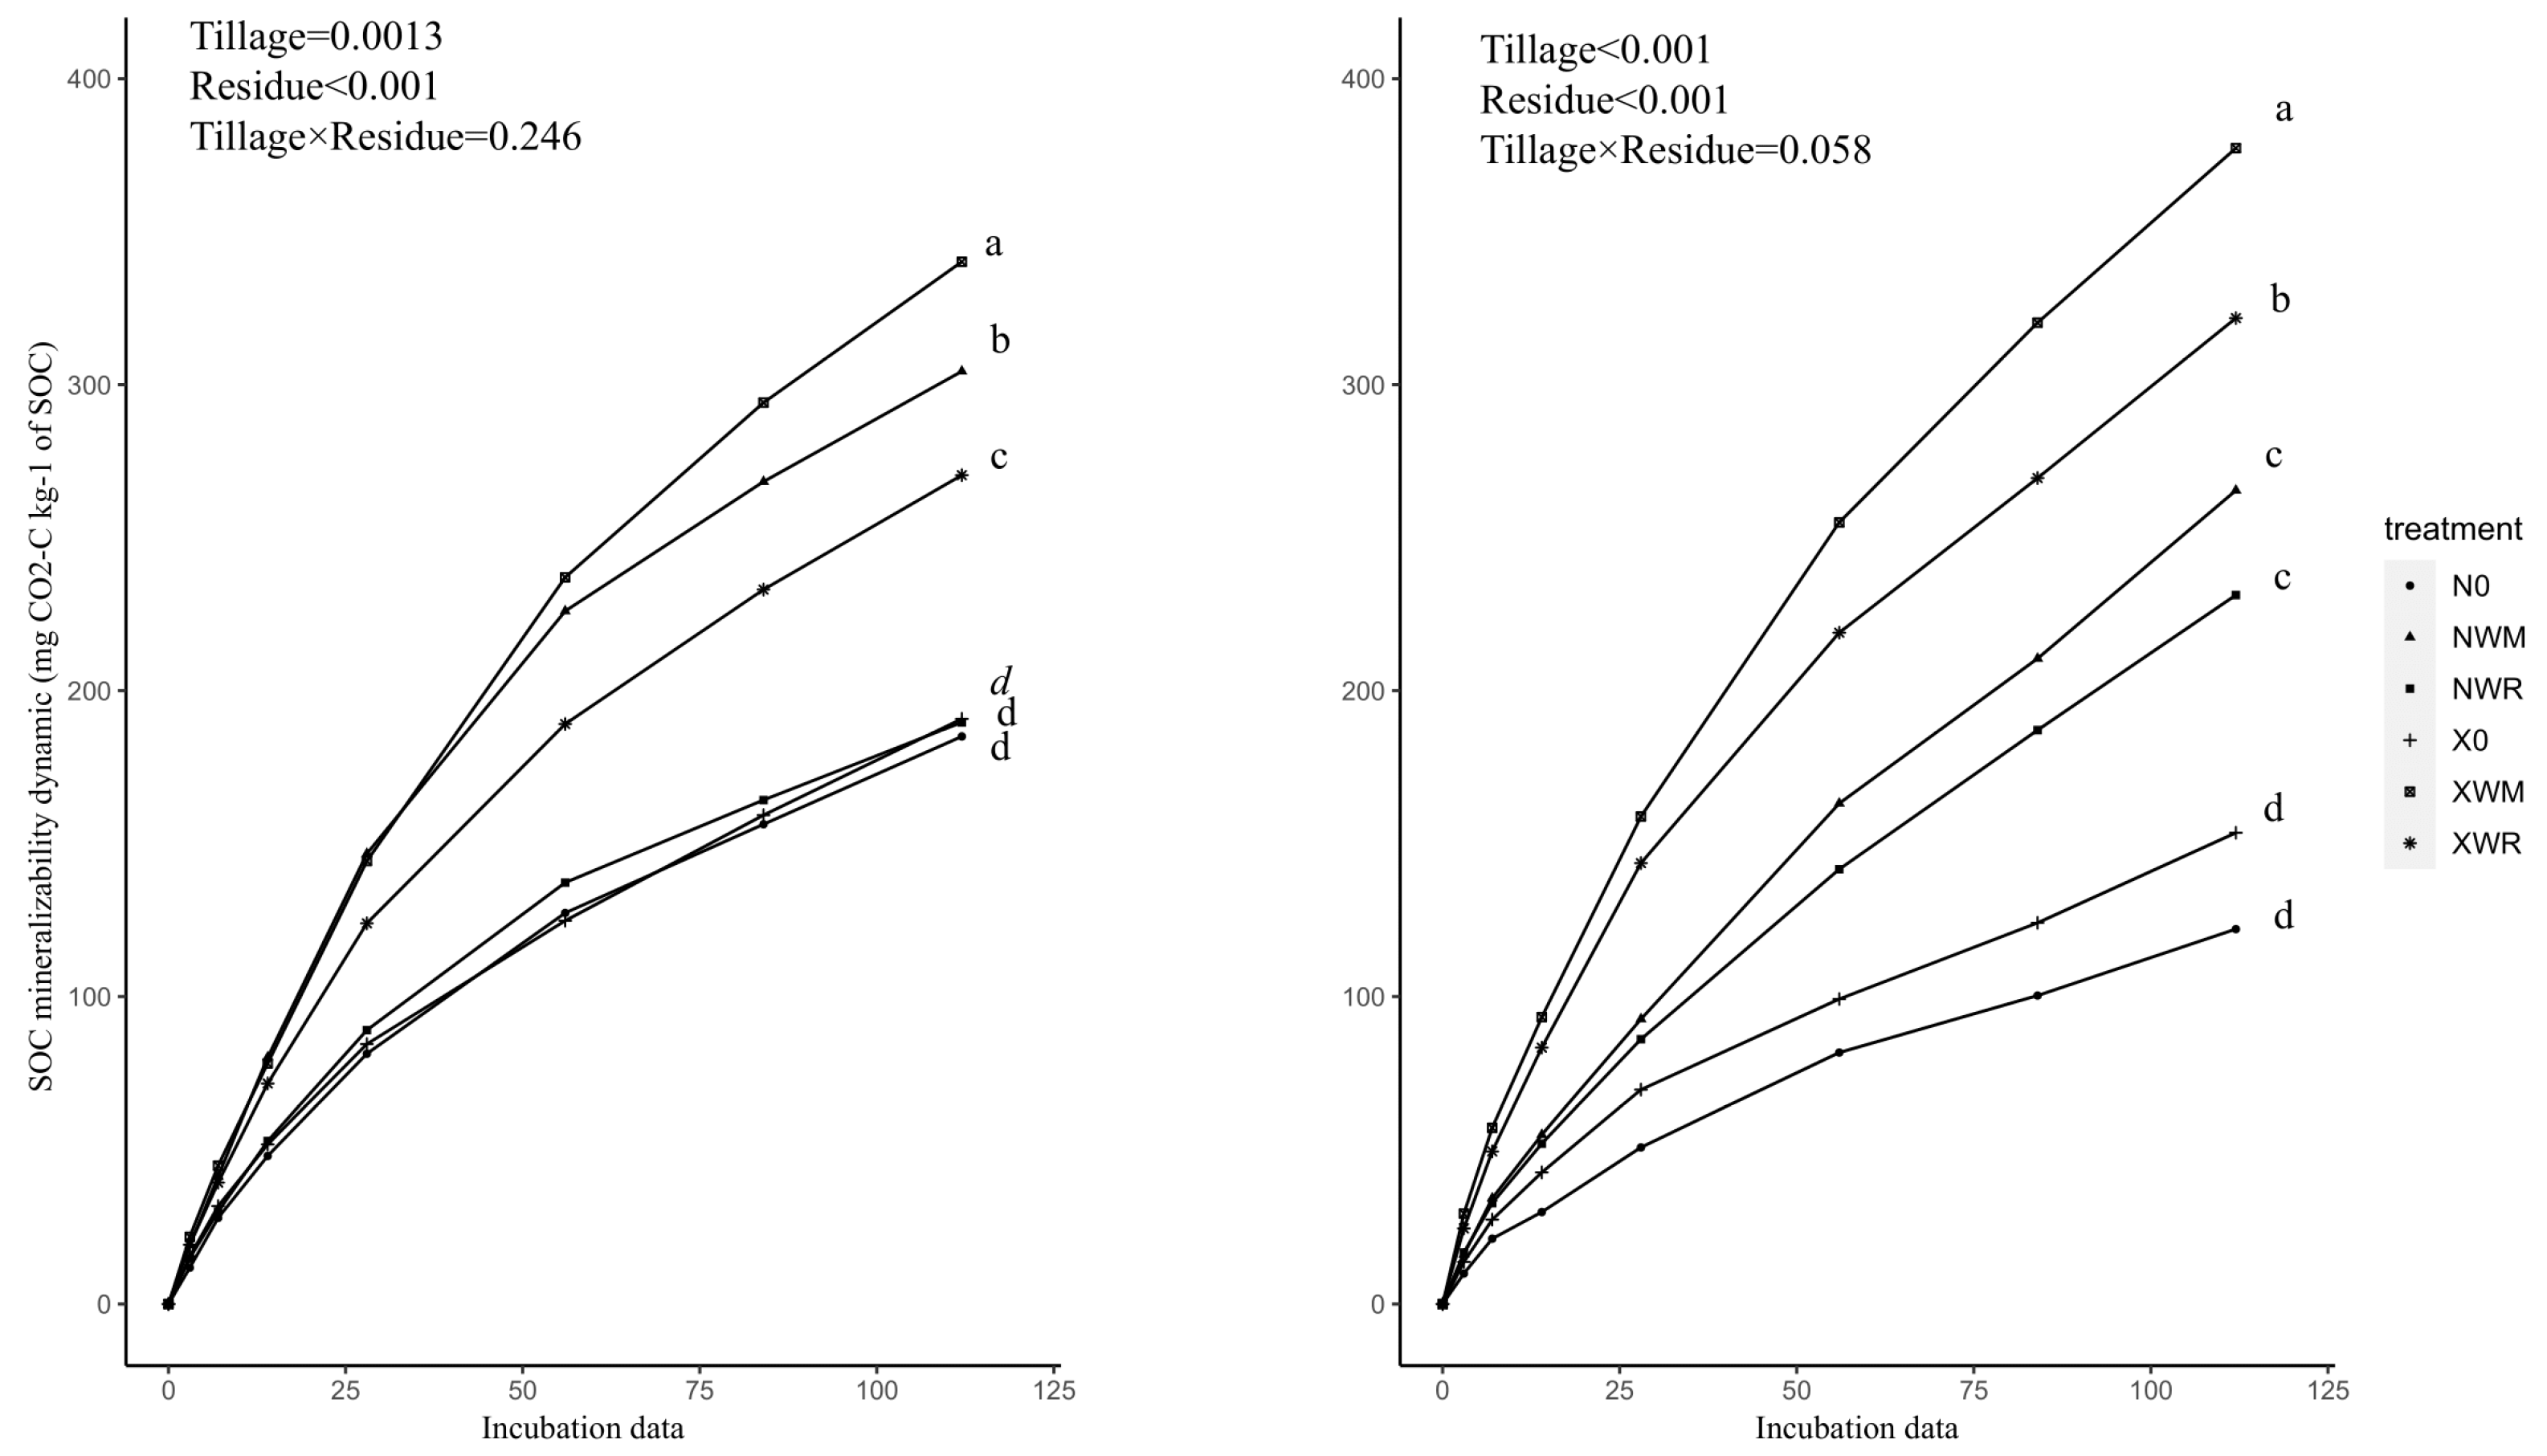
3.2. SOC Mineralizability

3.2.1. SOC Mineralizability with Straw Addition

N0, NWR, and X0 showed similar trends for the 0–10 cm layer, and the mineralizability with the same residue had similar trends in the 10–20 cm layer. The tillage practice effects on SOC mineralizability were significant, with RT > NT (p < 0.01) (Figure 1) in the laboratory incubation. Cumulative mineralizability was lower in NT than in RT by 15.27% in the 0–10 cm layer and by 27.43% in the 10–20 cm layer. Additionally, the residue significantly affected SOC mineralizability in the laboratory incubation (p < 0.01) (Figure 1). SOC mineralizability was higher for NWM than for N0 by 71.52% and 40.11% in the 0–10 cm layer and by 133.24% and 16.23% in the 10–20 cm layer. Tillage and residue interactions did not show any significant differences. Soil layer did not significantly effect SOC mineralizability (Table 3).

3.2.2. SOC Mineralizability without Straw Addition

Cumulative mineralizability did not exhibit the same trend in the experiment without straw addition compared to the field experiments. However, tillage significantly affected the cumulative mineralizability in the 0–10 cm and 10–20 cm soil layers, with RT having a higher effect than NT by 20.67% and 19.45%, respectively (p < 0.05) (Figure 2). The residue did not significantly affect the cumulative mineralizability, whereas the mineralizability with WM returning was the lowest in both the 0–10 cm and the 10–20 cm soil layers. Cumulative mineralizability was lower for WM than for WR and N0 by 20.73% and 11.58% in the 0–10 cm layer and 18.52% and by 30.7% in the 10–20 cm layer, respectively. The difference in mineralizability between N0 and NWR at 0–10 and 10–20 cm was insignificant. Soil layer did not significantly effect SOC mineralizability (Table 3).

3.2.3. Potentially Mineralizable C (Cp)

Potentially mineralizable carbon (Cp) in the laboratory incubation increased with the amount of straw returned to the soil (Table 1). Notably, Cp at 0–10 cm was higher than at 10–20 cm. The rate of increase for RT was lower compared with that for NT by 52.32–87.41% and 21.51–53.62%, with the highest Cp (with straw addition) for NWM (0–10 cm) and the lowest Cp for N0 (10–20 cm) (Table 2).

3.2.4. Rate Constants of SOC Mineralization (K0)

Tillage and the straw-returning modes impacted the rate constant of SOC mineralization (K0) (Table 4 and Table 5). In the 0–10 cm layer, NWR (without straw addition) and N0 (with straw addition) had the lowest rate constants in laboratory incubation and field experiments under NT, respectively. The difference in the K0 values between field experiments for RT was slight, as observed in the laboratory incubation. In the 0–10 cm layer, the K0 values varied widely between treatments.

3.2.5. Labile C (C1) and Constants Rate for Labile and More Recalcitrant C Fractions (K1, K2)

The field experiments and laboratory incubations impacted the cumulative carbon mineralization rates. The double-exponential model provided a good data fit, with R2 values ranging between 0.995 and 0.999 (Table 6 and Table 7). The model indicated that C1 and C2 represented the size of active and intermediate C pools decomposing at the specific rates of K1 and K2, respectively, and t was the time (in days). All treatment C1 values were greater in the 0–10 cm layer than in the 10–20 cm layer. This trend was also evident for different straw-returning modes under the same conditions. Simultaneously, the C1 values were smaller in the field experiments than in the laboratory incubations under the same tillage. The C1 values under NWR were consistently higher than those for the remaining two field experiment treatments in both soil layers. The C1 values were similar in trend to Cp for both tillage methods due to straw returning.

3.3. Pearson’s Correlation Coefficients of Cp and SOC, C1, K0, Ccu

Pearson’s correlation coefficient analysis estimated the correlations between Cp, SOC concentration, C1, K0, and Ccu (Table 8). A significantly strong correlation between C1 and SOC concentration (R2 = 0.662, p < 0.01) was observed. Additionally, SOC concentration and K0, C1, and Ccu were significantly correlated with R2 = 0.538 (SOC and K0, p < 0.01) and R2 = 0.536 (Cm and Ccu, p < 0.01). Notably, Ccu was positively correlated with Cp (p < 0.05), and Ccu was positively correlated with C1 (p < 0.01). The relationships between C1 and SOC (R2 = 0.662) showed an especially high correlation (p < 0.01).

4. Discussion

4.1. SOC Accumulation under Different Tillage and Residue Modes

Zhang et al. [28] found conservation tillage only increased SOC concentration in the upper soil layers (0–5 cm or 0–10 cm), similar to our data. However, many studies have reported the necessity of considering the subsoil when studying SOC sequestration capacity [29,30]. Thus, our study measured the effects of different tillage and straw-returning modes at deeper soil layers. In our study, returning straw significantly increased SOC concentration in the 0–10 and 10–20 cm soil layers.
Moreover, tillage, and the interaction between tillage and residue, significantly affected SOC concentration at 0–10 cm. Previous studies [26,31] reported similar results in the NCP, indicating that no-tillage with straw returning can enhance SOC accumulation in upper NCP soil layers. Potter et al. [32] reported that only when straw was retained on the topsoil did conservation tillage enhance SOC concentration in the 0–5 cm layer. In contrast, CT could increase SOC concentration compared with NT with the crop straw removed. However, SOC concentration under NT was significantly higher than under RT in the 0–10 cm soil layer according to our data. Kan et al. [33] also reported that no-tillage with straw returning increased SOC concentration at 0–10 cm compared with conventional tillage, which is similar to our results. Therefore, in addition to straw returning, no-tillage practices can also enhance SOC concentrations.

4.2. SOC Mineralizability under Different Tillage and Residue-Returning Modes

SOC mineralization in laboratory incubation is purportedly related to CO2 emissions under field experiments [34]. Thus, laboratory C mineralization data can indicate how different managements (e.g., no-tillage with wheat straw returning) affect SOC turnover. However, the mineralization of SOC varies at specific sites or on different sampling dates in the field (soil spatial heterogeneity) [35]. Vazquez et al. [36] and Sauvadet et al. [22] reported that no-tillage increased SOC mineralization in their experiments. In contrast, Raiesi and Kabiri [8] argued that reduced tillage decreased total mineralization compared with conventional tillage systems at the end of incubation. SOC mineralization could explain this positive relation to SOC content [19], and the labile C fraction is easily mineralized. Sampling date differences may cause C pool variation, which contributes to labile C fraction variation. Thus, quantifying the ability to protect SOC by mineralizability is reasonable and has been reported by some studies [11,37]. A previous study [35] reported that SOC mineralizability was lower in conservation tillage (0.041–0.089 g CO2 g−1 SOC) compared to conventional systems (0.039–0.110 g CO2 g−1 SOC) after a 60 day indoor incubation, which is similar to our results in both 0–10 and 10–20 cm soil layers. NT potentially increases macro-aggregation, which decreases mineralizability during the wheat and maize seasons [35]. The lower C mineralization indicates that less SOC is easily mineralized, contributing to SOC accumulation. However, the soil layer did not significantly affect SOC mineralizability. This may be due to the fact that both NT and RT can affect soil in the 0–20 layer (Table 3).
Moreover, our results showed that straw returning increased the cumulative C mineralizability and potential C mineralizability. C1 and SOC were significantly correlated, which indicates that labile C increased when the straw was returned. This may be related to wheat and maize straw biomass, thus enhancing labile C in SOC pools [34,38]. Ma et al. [39] previously observed a significant correlation between mineralization and SOC concentration. However, the straw residue effect was not significant in our field experiments. Moreover, WR and N0 effects were insignificant in our field experiments, indicating that the wheat straw input did not effectively decrease mineralizability. It could be that the labile C underwent mineralization for a long time in the field. SOC concentration significantly increased under WR in the 10–20 cm layer compared with N0. Thus, crop residue enhanced SOC concentration in NCP without increasing mineralization per unit SOC.

4.3. Limitations and Perspectives

Our study explored SOC accumulation and mineralizability under different straw-returning and tillage-returning modes based on a field experiment in June 2015. It showed that no-tillage with straw returning could protect and promote the accumulation of SOC. Similar results were also found by Kan et al. [33] and Ma et al. [39]. However, unlike previous studies, which reported a long-term dynamic SOC accumulation, we only analyzed soils sampled in 2020. This may have caused insignificant effects in different treatments. A meta-analysis conducted across China found that SOC at upper soil depths was saturated after 16 years of conservation [17]. Thus, further research investigating the effects of tillage and residue when the SOC capacity is saturated is needed.
However, our experiments included field experiments and laboratory incubations, which indicated different tillage and straw return treatment effects. Notably, mineralizability and SOC accumulation between N0 and WR in the 0–10 layer was insignificant in our study, which could indicate that wheat straw returning does not increase mineralization per unit C. This finding suggests that wheat straw returning is an effective strategy to enhance SOC accumulation in the upper soil layers of the NCP.

5. Conclusions

This study evaluated SOC mineralizability under different tillage and residue modes in laboratory incubations and field experiments. NT had significantly lower mineralizability compared to RT, by 15.27–27.44%, regardless of residue management and soil layer, and increased SOC concentration at a depth of 0–10 cm in the field experiment. Straw returning (R1, R2, and R3) significantly increased SOC mineralizability by 16.23–133.24% in the laboratory incubation. However, the residue-mode effects were insignificant for the field experiment. Moreover, no significant difference was observed between N0 and WR for SOC mineralizability. Thus, enhancing SOC by NT and WR is an excellent strategy, since straw returning does not promote additional mineralization per SOC unit in the NCP.

Author Contributions

Conceptualization, H.D. and J.C.; methodology, H.D.; software, J.C.; validation, H.D., J.C. and M.H.; formal analysis, H.D.; investigation, H.D.; resources, H.Z.; data curation, H.D.; writing—original draft preparation, H.D.; writing—review and editing, J.C.; visualization, H.D.; supervision, H.Z.; project administration, H.Z.; funding acquisition, H.Z. All authors have read and agreed to the published version of the manuscript.

Funding

This research was funded by National Natural Science Foundation of China grant number 32071977.

Data Availability Statement

Data available on request due to restrictions.

Conflicts of Interest

The authors declare no conflict of interest.

References

  1. Wang, X.J.; Chen, G.H.; Wang, S.Y.; Zhang, L.Y.; Zhang, R. Temperature sensitivity of different soil carbon pools under biochar addition. Environ. Sci. Pollut. Res. 2019, 26, 4130–4140. [Google Scholar] [CrossRef] [PubMed]
  2. Scharlemann, J.P.W.; Tanner, E.V.J.; Hiederer, R.; Kapos, V. Global soil carbon: Understanding and managing the largest terrestrial carbon pool. Carbon Manag. 2014, 5, 81–91. [Google Scholar] [CrossRef]
  3. Jobbagy, E.G.; Jackson, R.B. The vertical distribution of soil organic carbon and its relation to climate and vegetation. Ecol. Appl. 2000, 10, 423–436. [Google Scholar] [CrossRef]
  4. Schlesinger, W.H.; Andrews, J.A. Soil respiration and the global carbon cycle. Biogeochemistry 2000, 48, 7–20. [Google Scholar] [CrossRef]
  5. Bond-Lamberty, B.; Thomson, A. Temperature-associated increases in the global soil respiration record. Nature 2010, 464, 579–582. [Google Scholar] [CrossRef]
  6. Zhao, Y.C.; Wang, M.Y.; Hu, S.J.; Zhang, X.D.; Ouyang, Z.; Zhang, G.L.; Huang, B.A.; Zhao, S.W.; Wu, J.S.; Xie, D.T.; et al. Economics- and policy-driven organic carbon input enhancement dominates soil organic carbon accumulation in Chinese croplands. Proc. Natl. Acad. Sci. USA 2018, 115, 4045–4050. [Google Scholar] [CrossRef] [Green Version]
  7. Raiesi, F. Carbon and N mineralization as affected by soil cultivation and crop residue in a calcareous wetland ecosystem in Central Iran. Agric. Ecosyst. Environ. 2006, 112, 13–20. [Google Scholar] [CrossRef]
  8. Raiesi, F.; Kabiri, V. Carbon and nitrogen mineralization kinetics as affected by tillage systems in a calcareous loam soil. Ecol. Eng. 2017, 106, 24–34. [Google Scholar] [CrossRef]
  9. Kan, Z.R.; Ma, S.T.; Liu, Q.Y.; Liu, B.Y.; Virk, A.L.; Qi, J.Y.; Zhao, X.; Lal, R.; Zhang, H.L. Carbon sequestration and mineralization in soil aggregates under long-term conservation tillage in the North China Plain. Catena 2020, 188, 104428. [Google Scholar] [CrossRef]
  10. Qi, J.Y.; Jing, Z.H.; He, C.; Liu, Q.Y.; Wang, X.; Kan, Z.R.; Zhao, X.; Xiao, X.P.; Zhang, H.L. Effects of tillage management on soil carbon decomposition and its relationship with soil chemistry properties in rice paddy fields. J. Environ. Manag. 2021, 279, 111595. [Google Scholar] [CrossRef]
  11. Das, S.; Richards, B.K.; Hanley, K.L.; Krounbi, L.; Walter, M.F.; Walter, M.T.; Steenhuis, T.S.; Lehmann, J. Lower mineralizability of soil carbon with higher legacy soil moisture. Soil Biol. Biochem. 2019, 130, 94–104. [Google Scholar] [CrossRef]
  12. Sarker, J.R.; Singh, B.P.; Fang, Y.Y.; Cowie, A.L.; Dougherty, W.J.; Collins, D.; Dalal, R.C.; Singh, B.K. Tillage history and crop residue input enhanced native carbon mineralisation and nutrient supply in contrasting soils under long-term farming systems. Soil Tillage Res. 2019, 193, 71–84. [Google Scholar] [CrossRef]
  13. Six, J.; Bossuyt, H.; Degryze, S.; Denef, K. A history of research on the link between (micro)aggregates, soil biota, and soil organic matter dynamics. Soil Tillage Res. 2004, 79, 7–31. [Google Scholar] [CrossRef]
  14. Six, J.; Elliott, E.T.; Paustian, K. Soil macroaggregate turnover and microaggregate formation: A mechanism for C sequestration under no-tillage agriculture. Soil Biol. Biochem. 2000, 32, 2099–2103. [Google Scholar] [CrossRef]
  15. Thierfelder, C.; Chivenge, P.; Mupangwa, W.; Rosenstock, T.S.; Lamanna, C.; Eyre, J.X. How climate-smart is conservation agriculture (CA)?—Its potential to deliver on adaptation, mitigation and productivity on smallholder farms in southern Africa. Food Secur. 2017, 9, 537–560. [Google Scholar] [CrossRef] [Green Version]
  16. Xavier, C.V.; Moitinho, M.R.; Teixeira, D.D.; Santos, G.A.D.; Barbosa, M.D.; Milori, D.; Rigobelo, E.; Cora, J.E.; La Scala, N. Crop rotation and succession in a no-tillage system: Implications for CO2 emission and soil attributes. J. Environ. Manag. 2019, 245, 8–15. [Google Scholar] [CrossRef]
  17. Zhao, X.; Zhang, R.; Xue, J.F.; Pu, C.; Zhang, X.Q.; Liu, S.L.; Chen, F.; Lal, R.; Zhang, H.L. Management-Induced Changes to Soil Organic Carbon in China: A Meta-analysis. Adv. Agron. 2015, 134, 1–50. [Google Scholar]
  18. Zhang, Y.; Li, X.J.; Gregorich, E.G.; McLaughlin, N.B.; Zhang, X.P.; Guo, Y.F.; Liang, A.Z.; Fan, R.Q.; Sun, B.J. No-tillage with continuous maize cropping enhances soil aggregation and organic carbon storage in Northeast China. Geoderma 2018, 330, 204–211. [Google Scholar] [CrossRef]
  19. Dimassi, B.; Mary, B.; Fontaine, S.; Perveen, N.; Revaillot, S.; Cohan, J.P. Effect of nutrients availability and long-term tillage on priming effect and soil C mineralization. Soil Biol. Biochem. 2014, 78, 332–339. [Google Scholar] [CrossRef]
  20. Sarker, J.R.; Singh, B.P.; Cowie, A.L.; Fang, Y.Y.; Collins, D.; Dougherty, W.J.; Singh, B.K. Carbon and nutrient mineralisation dynamics in aggregate-size classes from different tillage systems after input of canola and wheat residues. Soil Biol. Biochem. 2018, 116, 22–38. [Google Scholar] [CrossRef]
  21. Qin, S.Q.; Chen, L.Y.; Fang, K.; Zhang, Q.W.; Wang, J.; Liu, F.T.; Yu, J.C.; Yang, Y.H. Temperature sensitivity of SOM decomposition governed by aggregate protection and microbial communities. Sci. Adv. 2019, 5, eaau1218. [Google Scholar] [CrossRef] [PubMed] [Green Version]
  22. Sauvadet, M.; Lashermes, G.; Alavoine, G.; Recous, S.; Chauvat, M.; Maron, P.A.; Bertrand, I. High carbon use efficiency and low priming effect promote soil C stabilization under reduced tillage. Soil Biol. Biochem. 2018, 123, 64–73. [Google Scholar] [CrossRef]
  23. Zhou, Y.; Xing, X.F.; Lang, J.L.; Chen, D.S.; Cheng, S.Y.; Wei, L.; Wei, X.; Liu, C. A comprehensive biomass burning emission inventory with high spatial and temporal resolution in China. Atmos. Chem. Phys. 2017, 17, 2839–2864. [Google Scholar] [CrossRef] [Green Version]
  24. Zhang, H.L.; Zhao, X.; Yin, X.G.; Liu, S.L.; Xue, J.F.; Wang, M.; Pu, C.; Lal, R.; Chen, F. Challenges and adaptations of farming to climate change in the North China Plain. Clim. Chang. 2015, 129, 213–224. [Google Scholar] [CrossRef]
  25. Dicks, L.V.; Rose, D.C.; Ang, F.; Aston, S.; Birch, A.N.E.; Boatman, N.; Bowles, E.L.; Chadwick, D.; Dinsdale, A.; Durham, S.; et al. What agricultural practices are most likely to deliver “sustainable intensification” in the UK? Food Energy Secur. 2019, 8, e00148. [Google Scholar] [CrossRef]
  26. Pu, C.; Kan, Z.R.; Liu, P.; Ma, S.T.; Qi, J.Y.; Zhao, X.; Zhang, H.L. Residue management induced changes in soil organic carbon and total nitrogen under different tillage practices in the North China Plain. J. Integr. Agric. 2019, 18, 1337–1347. [Google Scholar] [CrossRef]
  27. Bao, S.D. Methods for Soil Agricultural and Chemical Analysis; China Agricultural Press: Beijing, China, 2000. [Google Scholar]
  28. Zhang, H.L.; Lal, R.; Zhao, X.; Xue, J.F.; Chen, F. Opportunities and Challenges of Soil Carbon Sequestration by Conservation Agriculture in China. Adv. Agron. 2014, 124, 1–36. [Google Scholar]
  29. VandenBygaart, A.J.; Gregorich, E.G.; Angers, D.A. Influence of agricultural management on soil organic carbon: A compendium and assessment of Canadian studies. Can. J. Soil Sci. 2003, 83, 363–380. [Google Scholar] [CrossRef]
  30. Min, K.; Berhe, A.A.; Khoi, C.M.; van Asperen, H.; Gillabel, J.; Six, J. Differential effects of wetting and drying on soil CO2 concentration and flux in near-surface vs. deep soil layers. Biogeochemistry 2020, 148, 255–269. [Google Scholar] [CrossRef]
  31. Dikgwatlhe, S.B.; Kong, F.L.; Chen, Z.D.; Lal, R.; Zhang, H.L.; Chen, F. Tillage and residue management effects on temporal changes in soil organic carbon and fractions of a silty loam soil in the North China Plain. Soil Use Manag. 2014, 30, 496–506. [Google Scholar] [CrossRef]
  32. Potter, K.N.; Velazquez-Garcia, I.; Scopel, E.; Torbert, H.A. Residue removal and climatic effects on soil carbon content of no-till soils. J. Soil Water Conserv. 2007, 62, 110–114. [Google Scholar]
  33. Kan, Z.R.; Virk, A.L.; He, C.; Liu, Q.Y.; Qi, J.Y.; Dang, Y.P.; Zhao, X.; Zhang, H.L. Characteristics of carbon mineralization and accumulation under long-term conservation tillage. Catena 2020, 193, 104636. [Google Scholar] [CrossRef]
  34. Sierra, J.; Desfontaines, L. Predicting the in situ rate constant of soil carbon mineralisation from laboratory-based measurements in tropical soils under contrasting tillage management systems. Soil Tillage Res. 2018, 180, 175–181. [Google Scholar] [CrossRef]
  35. Kan, Z.R.; Virk, A.L.; Wu, G.; Qi, J.Y.; Ma, S.T.; Wang, X.; Zhao, X.; Lal, R.; Zhang, H.L. Priming effect intensity of soil organic carbon mineralization under no-till and residue retention. Appl. Soil Ecol. 2020, 147, 103445. [Google Scholar] [CrossRef]
  36. Vazquez, E.; Benito, M.; Espejo, R.; Teutscherova, N. Effects of no-tillage and liming amendment combination on soil carbon and nitrogen mineralization. Eur. J. Soil Biol. 2019, 93, 103090. [Google Scholar] [CrossRef]
  37. Tang, Z.X.; Sun, X.L.; Luo, Z.K.; He, N.P.; Sun, O.J. Effects of temperature, soil substrate, and microbial community on carbon mineralization across three climatically contrasting forest sites. Ecol. Evol. 2018, 8, 879–891. [Google Scholar] [CrossRef]
  38. Fang, Y.Y.; Nazaries, L.; Singh, B.K.; Singh, B.P. Microbial mechanisms of carbon priming effects revealed during the interaction of crop residue and nutrient inputs in contrasting soils. Glob. Chang. Biol. 2018, 24, 2775–2790. [Google Scholar] [CrossRef]
  39. Ma, S.T.; Kan, Z.R.; Qi, J.Y.; Zhang, H.L. Effects of Straw Return Mode on Soil Aggregates and Associated Carbon in the North China Plain. Agronomy 2020, 10, 61. [Google Scholar] [CrossRef] [Green Version]
Figure 1. SOC mineralizability dynamics under different practices at 0–10 and 10–20 cm in the laboratory incubation (with straw addition). N0: no-tillage with no straw addition; NWR: no-tillage with wheat straw addition; NWM: no-tillage with maize and wheat straw addition; X0: rotary tillage with no straw addition; XWR: rotary tillage with wheat straw addition; XWM: rotary tillage with maize and wheat straw addition. Lower case letters indicate significant differences (p < 0.05) among treatments within the same soil depth.
Agronomy 12 01442 g001
Figure 2. SOC mineralizability dynamics under different practices at 0–10 and 10–20 cm in the field soil experiments (without straw addition). N0: no-tillage with no straw returning; NWR: no-tillage with wheat straw returning; NWM: no-tillage with maize and wheat straw returning; X0: rotary tillage with no straw returning; XWR: rotary tillage with wheat straw returning; XWM: rotary tillage with maize and wheat straw returning. Lower case letters indicate significant differences (p < 0.05) among treatments within the same soil depth.
Agronomy 12 01442 g002
Table 1. Tillage and residue management in the laboratory incubation.
TreatmentTillageAddition Rate
N0No tillage0.4%MWR
NWRNo tillage0.4%MWR + 0.4%MS
NWMNo tillage0.4%MWR + 0.4%MS + 0.4%WS
X0Rotary tillage0.4%MWR
XWRRotary tillage0.4%MWR + 0.4%MS
XWMRotary tillage0.4%MWR + 0.4%MS + 0.4%WS
N0: no-tillage with no straw addition; NWR: no-tillage with wheat straw addition; NWM: no-tillage with maize and wheat straw addition; X0: rotary-tillage with no straw addition; XWR: rotary tillage with wheat straw addition; XWM: rotary tillage with maize and wheat straw addition; MWR: maize–wheat root; MS: maize straw; WS: wheat straw.
Table 2. SOC concentration in the 0–10 cm and 10–20 cm soil layers in field experiments under different treatments.
Treatment0–10 cm10–20 cm
N09.95c5.43cd
NWR10.48bc5.86bc
NWM11.56a6.44ab
X07.96d5.15d
XWR6.28e5.72cd
WM11.00ab6.91a
Tillage (T)
NT10.66a5.91a
RT8.41b5.93a
Residue(R)
N08.95b5.29c
WR8.38b5.79b
WM11.27a6.67a
ANOVA
T<0.01N.S
R<0.01<0.01
T × R<0.01N.S
N0: no straw returning; WR: only wheat straw returning; WM: both wheat and maize straw returning; NT: no-tillage; RT: rotary tillage; T: tillage; R: residue; T × R: interaction between tillage and residue; N.S: not significant. N0: no-tillage with no straw returning; NWR: no-tillage with wheat straw returning; NWM: no-tillage with maize and wheat straw returning; X0: rotary tillage with no straw returning; XWR: rotary tillage with wheat straw returning; XWM: rotary tillage with maize and wheat straw returning. Lower case letters indicate significant differences (p < 0.05) among treatments within the same soil depth.
Table 3. ANOVA of SOC mineralizability under different treatments.
TreatmentField ExperimentLaboratory Incubation
ANOVA
T<0.01<0.01
R<0.01<0.01
LN.SN.S
T × RN.S0.02
T × LN.SN.S
R × L0.030.04
T × R × LN.SN.S
T: tillage; R: residue; L: soil layer; T × R: interaction between tillage and residue; T × L: interaction between tillage and soil layer; R × L: interaction between residue and soil layer; T × R × L: interaction between tillage, residue and soil layer; N.S: not significant.
Table 4. Values of the parameters obtained for the carbon mineralization model (single-exponential model) fitted to the cumulative carbon mineralization data for the laboratory incubations (soil samples with straw addition).
TreatmentParameter
Cp (×10−2 mg C g−1 C)K0 (×103 day−1)R2
0–10 cm
N019.96 (1.79)26.030.972
NWR 33.72 (1.08)19.800.998
NWM39.98 (2.04)25.400.991
X019.37 (1.87)25.640.967
XWR34.74 (2.69)25.610.979
XWM36.86 (4.11)24.960.964
10–20 cm
N013.10 (1.26)25.820.967
NWR 19.07 (2.70)23.560.948
NWM21.33 (3.24)22.420.949
X015.34 (1.60)26.480.959
XWR22.61 (1.86)26.770.974
XWM30.33 (3.14)25.830.964
N0: no-tillage with no straw addition; NWR: no-tillage with wheat straw addition; NWM: no-tillage with maize and wheat straw addition; X0: rotary tillage with no straw addition; XWR: rotary tillage with wheat straw addition; XWM: rotary tillage with maize and wheat straw addition. Values in brackets are Standard Errors.
Table 5. Values of the parameters obtained for the carbon mineralization model (single-exponential model) fitted to the cumulative carbon mineralization data for the field experiments (soil samples without straw addition).
TreatmentParameter
Cp (×10−2 mg C g−1 C)K0 (×103 day−1)R2
0–10 cm
NWR23.68 (2.42)11.770.994
NWM13.80 (2.10)24.060.941
N014.56 (1.83)25.730.947
XWR12.18 (2.85)21.100.909
XWM17.30 (2.68)22.740.946
X012.99 (2.70)21.450.924
10–20 cm
NWR10.71 (1.90)15.790.955
NWM10.84 (2.16)15.040.948
N014.34 (3.83)10.290.967
XWR10.32 (1.71)23.910.924
XWM20.21 (7.08)6.550.983
X021.46 (7.37)6.680.986
N0: no-tillage with no straw returning; NWR: no-tillage with wheat straw returning; NWM: no-tillage with maize and wheat straw returning; X0: rotary tillage with no straw returning; XWR: rotary tillage with wheat straw returning; XWM: rotary tillage with maize and wheat straw returning. Values in brackets are Standard Errors.
Table 6. Parameter values obtained for the carbon mineralization model (double-exponential model) fitted to cumulative carbon mineralization data for the laboratory incubations (soil samples with straw addition).
TreatmentParameter
C1 (mg C g−1 C)K1 (×103 day−1)K2 (×103 day−1)R2
0–10 cm
N0138.81 (14.99)43.872.720.999
NWR246.45 (37.05)41.854.870.999
NWM505.29 (154.83)24.002.520.999
X088.61 (4.65)79.472.960.999
XWR202.69 (17.22)41.224.150.999
XWM370.13 (191.61)23.645.250.999
10–20 cm
N044.69 (9.60)58.871.000.998
NWR33.62 (3.55)91.231.730.999
NWM35.87 (9.23)72.372.170.999
X057.19 (5.53)89.231.570.999
XWR84.36 (8.49)48.451.490.999
XWM120.63 (22.62)47.773.110.999
N0: no-tillage with no straw addition; NWR: no-tillage with wheat straw addition; NWM: no-tillage with maize and wheat straw addition; X0: rotary tillage with no straw addition; XWR: rotary tillage with wheat straw addition; XWM: rotary tillage with maize and wheat straw addition. Values in brackets are Standard Errors.
Table 7. Parameter values obtained for the carbon mineralization model (double-exponential model) fitted to cumulative carbon mineralization data for the field experiments (soil samples without straw addition).
TreatmentParameter
C1 (mg C g−1 C)K1 (×103 day−1)K2 (×103 day−1)R2
0–10 cm
NWR60.37 (28.40)60.902.700.996
NWM52.72 (20.47)69.872.850.998
N056.57 (15.23)131.852.930.995
XWR19.00 (16.93)81.002.340.996
XWM39.96 (8.49)76.992.560.999
X011.41 (4.15)392.103.170.999
10–20 cm
NWR17.38 (2.51)254.830.700.995
NWM16.15 (2.03)500.950.750.995
N012.52 (1.74)583.230.840.997
XWR15.45 (1.18)523.991.340.999
XWM11.14 (2.58)267.741.040.997
X09.85 (3.06)249.451.450.995
N0: no-tillage with no straw returning; NWR: no-tillage with wheat straw returning; NWM: no-tillage with maize and wheat straw returning; X0: rotary tillage with no straw returning; XWR: rotary tillage with wheat straw returning; XWM: rotary tillage with maize and wheat straw returning. Values in brackets are Standard Errors.
Table 8. Relationship between SOC, C1, Ccu, Cp and K0.
VariablesC1K0CcuSOC
Cp0.365−0.3810.427 *0.103
C1 0.3620.536 **0.662 **
K0 0.2840.538 **
Ccu 0.069
* stands for p < 0.05; ** stands for p < 0.01. Ccu is total cumulative SOC mineralization after 112 days; SOC is soil organic carbon concentration; K0 is the constant rate of decomposition; C1 is the mass of the organic labile C fraction; Cp is the potentially mineralized carbon.
Publisher’s Note: MDPI stays neutral with regard to jurisdictional claims in published maps and institutional affiliations.

