Article

Competition and Niche Differentiation of Water and Nutrients between Broussonetia papyrifera and Platycladus orientalis under Prolonged Drought Stress

1
School of Life Sciences, Guizhou Normal University, Guiyang 550025, China
2
State Key Laboratory of Environmental Geochemistry, Institute of Geochemistry, Chinese Academy of Sciences, Guiyang 550081, China
*
Authors to whom correspondence should be addressed.
Agronomy 2022, 12(7), 1489; https://doi.org/10.3390/agronomy12071489
Submission received: 1 April 2022 / Revised: 10 June 2022 / Accepted: 15 June 2022 / Published: 22 June 2022
(This article belongs to the Special Issue Emerging Research on Adaptive Plants in Karst Ecosystems)

Abstract

:
Little is known about the competition between and niche differentiation of water and nutrients between angiosperm and gymnosperm tree species under prolonged drought stress, especially in fragile environments. We imposed 21 d drought and competition treatments on Broussonetia papyrifera and Platycladus orientalis and measured water, N, and P contents, the isotopic composition of N and C, the activity of P assimilation enzymes, and stomatal conductance under solo planting and mixed planting to characterize resource diversity and competition in response to treatments. The N content, δ13C, δ15N, phosphomonoesterase, phosphodiesterase, gs, and foliage water content were significantly affected by the soil water content. The δ15N content in young leaves showed that N competition between these two plants could be alleviated through niche differentiation, but the changes in the PDE: PME ratio for these two plants indicated that they lost the niche differentiation of the P source under drought stress. Additionally, it was observed that foliage water content, WUE, N contents, and N and P sources were significantly affected by interspecific competition, and Broussonetia papyrifera benefited from water competition under moderate drought. Our results indicate that plants have different competition and niche differentiation modes to different nutrients under drought stress, and the effect of interspecific water competition should be seriously considered in mixed forests in semiarid areas.

1. Introduction

Global warming may lead to an increase in the duration, intensity, and frequency of drought worldwide [1]. Long-term or extreme drought will lead to plant death or change the composition, structure, and function of plant communities. When studying the impact of environmental change, interspecific relationships and the effects of species competition have been viewed as dominant factors influencing community structure in ecological research. It is generally believed that niche differentiation can mitigate the negative effects of drought stress on plants, but Kunstler et al. [2] found that the degree of trait dissimilarity between species had little influence on reducing competition. Competition determines the interspecific or intraspecific distribution pattern of net available resources [3]. Dominant, highly competitive species in the community can alleviate the risk of drought stress by “plundering resources”, but interspecific competition also makes the position of the lowly competitive species deteriorate more. Although a broad body of literature exists regarding the study of plant performance responses to drought combined with competition, less is known about the underlying variation in physiology [4]. Many studies have reported the water source niche differentiation and competition of mixed-species stands under water deficiency, but their results are inconsistent. [5,6,7]. The fact that resources competition and niche differentiation occur in mixed-species stands can be obtained from in situ studies, but the results are often formed by many ecological factors [8] and species-specific functional traits of plants, so confusing results are easily obtained. To study the interspecific competition more accurately under drought conditions, artificial simulation experiments under controllable laboratory conditions and in situ experiments are both indispensable.
Drought not only affects the water characteristics of plants but also affects their nutrient absorption [9,10]. Soil water deficit significantly directly inhibited the absorption of soil elements with transpiration flow and reduced ion mobility in the soil [11] and limited the decomposition, mineralization, and nutrient cycling of soil elements [12]. Therefore, under drought conditions, the water competition of plants in a community will also affect the nutritional status of plants. Among all the nutrient elements required for plant growth, nitrogen (N) and phosphorus (P) are undoubtedly the most important and widely considered. The N: P ratio can determine the main characteristics and structure of plant communities and reflect the relationship between supply and demand and the circulation of nutrition [13,14,15], especially in nutrient-limited systems. Inorganic N, which includes nitrate and ammonium, may nonetheless be generally thought to be the dominant source of N for plants [16]. The nitrogen source composition of plants has always been an issue that has received much attention. P is an essential nutrient taken up by plants as the orthophosphate anion (Pi). Phosphate monoesters are the main phosphorus sources for plants, and phosphate diesters also can be absorbed by plants in cold or damp environments [17,18,19]. Phosphomonoesterase (PME, EC 3.1.3.2) and phosphodiesterase (PDE, EC 3.1.4.1) are rate-limiting enzymes in the assimilation processes of phosphate monoesters and phosphate diesters, respectively [20]; therefore, the PDE: PME ratio can be used for the qualitative analysis of plant P source changes [21].
B. papyrifera and P. orientalis are native to eastern Asia [22,23] and frequently coexist in mixed forests. With the main objective of studying the variations in water, nitrogen, and phosphorus nutritional status between B. papyrifera and P. orientalis under the combined effects of drought and competition, we conducted a simulation experiment in an artificial climate chamber and focused on the following specific questions:
(1)
Does the niche differentiation of nitrogen and phosphorus occur between B. papyrifera and P. orientalis under drought stress?
(2)
Does interspecific competition affect the status of the water, nitrogen, and phosphorus nutrition of B. papyrifera and P. orientalis under drought stress, and who is the winner?

2. Materials and Methods

2.1. Plant Material and Drought Treatment

The angiosperm specie—Broussonetia papyrifera L. Vent. and gymnosperm specie—Platycladus orientalis L. Franco were selected as the experimental materials. B. papyrifera belongs to the Moraceae family and is a large, fast-growing, shallow-root-system, deciduous broad-leaved woody species. P. orientalis from the Cupressaceae family is an evergreen tree species with a well-developed root system and a long lifespan. Seeds were sown in wet perlite and germinated at 25 °C in a greenhouse. On the 15th day after seed germination, vigorous seedlings were transplanted into humus soil. The environmental conditions for seedling growth were as follows: a 12 h photoperiod with a day/night temperature of 25/16 °C and a photosynthetic photon flux density of 400 μmol m−2 s−1 with 60–65% relative humidity. To eliminate individual size differences as much as possible, an experiment was started when the seedlings grew to 30 cm tall (approximately 2.5 months old for B. papyrifera and 10 months old for P. orientalis).
To study the effect of soil water competition in these two plant species under drought stress, plants were planted alone in a 40 cm × 30 cm box with 18 cm of nutrient soil, and they were also planted with two species together in a 40 cm × 60 cm box with the same thickness of nutrient soil. Figure 1 shows the planting modes and soil sampling points. In order to supplement the water consumed via evapotranspiration, and according to the results of the pre-experiment, 75 mL and 55 mL of water was added to the control group of B. papyrifera and P. orientalis every day to maintain soil moisture, respectively. The prolonged drought treatment group stopped adding water until the end of the experiment (21 days) to simulate long-term drought without rainfall. Following treatment, soils were sampled once every ten days at the positions shown in Figure 1 to analyze the water content of plants; the parameters of leaf gas exchange were measured once every five days; and the leaves and roots were sampled to determine the water content, carbon, phosphorus, and nitrogen contents and δ13C, δ15N, and PME and PDE activities. Plant tissue was stored at −80 °C until further analysis was performed.

2.2. Measurement of Leaf Gas Exchange

The latest fully developed leaves in the middle and upper parts of the plant were selected for the determination of leaf gas exchange. The stomatal conductance (gs) was measured using a Li-6400 portable photosynthesis measurement system (Li-6400, Li-Cor, Lincoln, NE, USA) from 10: 00 to 11: 00 am. The PPFD was 400 μmol m−2 s−1, and the temperature was 25 °C. Here, the leaf area of P. orientalis was converted from its leaf dry weight using the following formula [24]:
Sori = 161 × Mori
where Sori is the leaf area of P. orientalis and Mori is the leaf dry weight of P. orientalis.

2.3. Nitrogen and Phosphorus Contents

Fresh plant samples were dried at 65 °C for 3 days and ground for N and P content testing, and a 0.3 g sample was added to 10 mL of H2SO4. Then, a graphite digestion instrument (SH420, Hanon, Dezhou, China) was used. A total P assay kit was used for sample P content determination, and the test was carried out with a microplate reader (Synergy H1, BioTek, Winooski, VT, USA) according to the instructions. A Kjeldahl apparatus (K1100, Hanon, Dezhou, China) was used for N content determination.

2.4. Carbon (δ13C) and Nitrogen (δ15N) Isotope Compositions

The fresh samples were soaked in 1 mol L−1 HCl for 1 h to remove exogenous inorganic carbon. Then, the samples were dried at 65 °C for 3 days and ground to a fine powder. A 2.0 mg fine-powder sample was wrapped in a tin capsule (5 × 8 mm), and the δ13C and δ15N values were determined using a continuous-flow isotope ratio mass spectrometer (MAT 253; Thermo Fisher Scientific, Waltham, MA, USA).

2.5. Root PME and PDE Activities

PME activity was assayed according to the method of Tabatabai and Bremmer [25] with some modifications. The reaction mixture containing 0.2 g of fresh root sample was incubated for 10 min at 37 °C with 4 mL of modified universal buffer (MUB), pH 8, and 1 mL of 5 mmol L−1 para-nitrophenyl phosphate (pNPP; MFCD00284586, Sigma–Aldrich, St Louis, MO, USA). The reaction was stopped by adding 1 mL of 0.5 mol L−1 CaCl2 and 4 mL of 0.5 mol L−1 NaOH and immediately centrifuging the mixture for 2 min at 12,000 g. The amount of p-nitrophenol released was measured in the supernatant at 412 nm.
PDE activity was assayed according to the method of Eivazi and Tabatabai [26] with some modifications. The reaction mixture containing 0.2 g of fresh root sample was incubated for 10 min at 37 °C with 4 mL of modified universal buffer (MUB; 0.1 mol L−1) pH 8.0 and 1 mL of 5 mmol L−1 bis para-nitrophenyl phosphate (bis-pNPP; CAS645-15-8, Aladdin, Shanghai, China). The reaction was stopped by adding 1 mL of 0.5 mol L−1 CaCl2 and 4 mL of 0.5 M NaOH and immediately centrifuging the mixture for 2 min at 12,000 g. The amount of p-nitrophenol released was measured in the supernatant at 412 nm.

2.6. Data Analysis

Five replicates were used for soil and leaf water contents measurement, and three replicates were used for physiology and biochemistry parameter measurement. One-way ANOVA followed by Duncan’s multiple range test was performed to explore the differences among the plant parameters under separate treatments. A general linear model was used to explore the interspecific competition effect, with the planting pattern (sole or mixed) as a fixed effect and the plant parameters at every sampling time as dependent variables. If there were significant differences (p < 0.05) between the two groups, we judged that a competition effect definitely existed. To explore the difference in the water control strategy between B. papyrifera and P. orientalis, ANOVA and a general linear model were performed using SPSS 25.0 (SPSS Inc., Chicago, IL, USA). Linear regression analysis was performed to calculate Pearson’s correlations between soil water content and N content, P content, δ13C, δ15N, PME, PDE, gs, and foliage water content, and this test was performed using ORIGIN 95 (OriginLab Inc., Northampton, MA, USA).

3. Results

3.1. Soil Water Content

To study the water competition between B. papyrifera and P. orientalis under mixed planting conditions, the change in soil water content was continuously monitored. As shown in Figure 2, at 11 d, soil water contents in the rhizosphere of B. papyrifera were not significantly different between the solo planting and mixed planting conditions within the 3 cm deep soil layer via Duncan’s test (p < 0.05). Within the 9 cm deep soil layer, the water content was significantly different between the mixed planting inside (MPI) and mixed planting outside (MPO) conditions, but the difference was not significant compared with the solo planting (SP) condition and MPO or MPI, and MPO < SP < MPI. The differences among the three simple points disappeared within the 15 cm deep soil layer. At 21 d, the water content in the SP condition was significantly lower than in the MPI and MPO conditions, and there no significant differences between the MPI and MPO conditions within the 3 cm deep soil layer. Within 9 cm deep soil layers, the water content was significantly different between the MPI and SP conditions, but the difference was not significant compared with the MPO and MPI or SP conditions, and SP < MPO < MPI, and there were no significant differences among the three sample points at the 15 cm depth.
At 11 d, the water contents in the rhizospheres of P. orientalis displayed significant differences between the solo planting (SO) and mixed planting inside (MOI) conditions, and MOI < MOO (mixed planting outside) < SO within the 3 cm and 9 cm deep soil layer, and the water content in the MOI condition was significantly lower than that in the MOO and SO conditions, and there no significant differences between the MOO and SO conditions within the 15 cm deep soil layer. At 21 d, the water content in the MOI condition was significantly lower than that in the MOO and SO conditions, and there no significant differences between the MOO and SO conditions within the 3 cm and 15 cm deep soil layer; the water content in the MOI condition was significantly lower than that in the SO condition within the 9 cm deep soil layer.

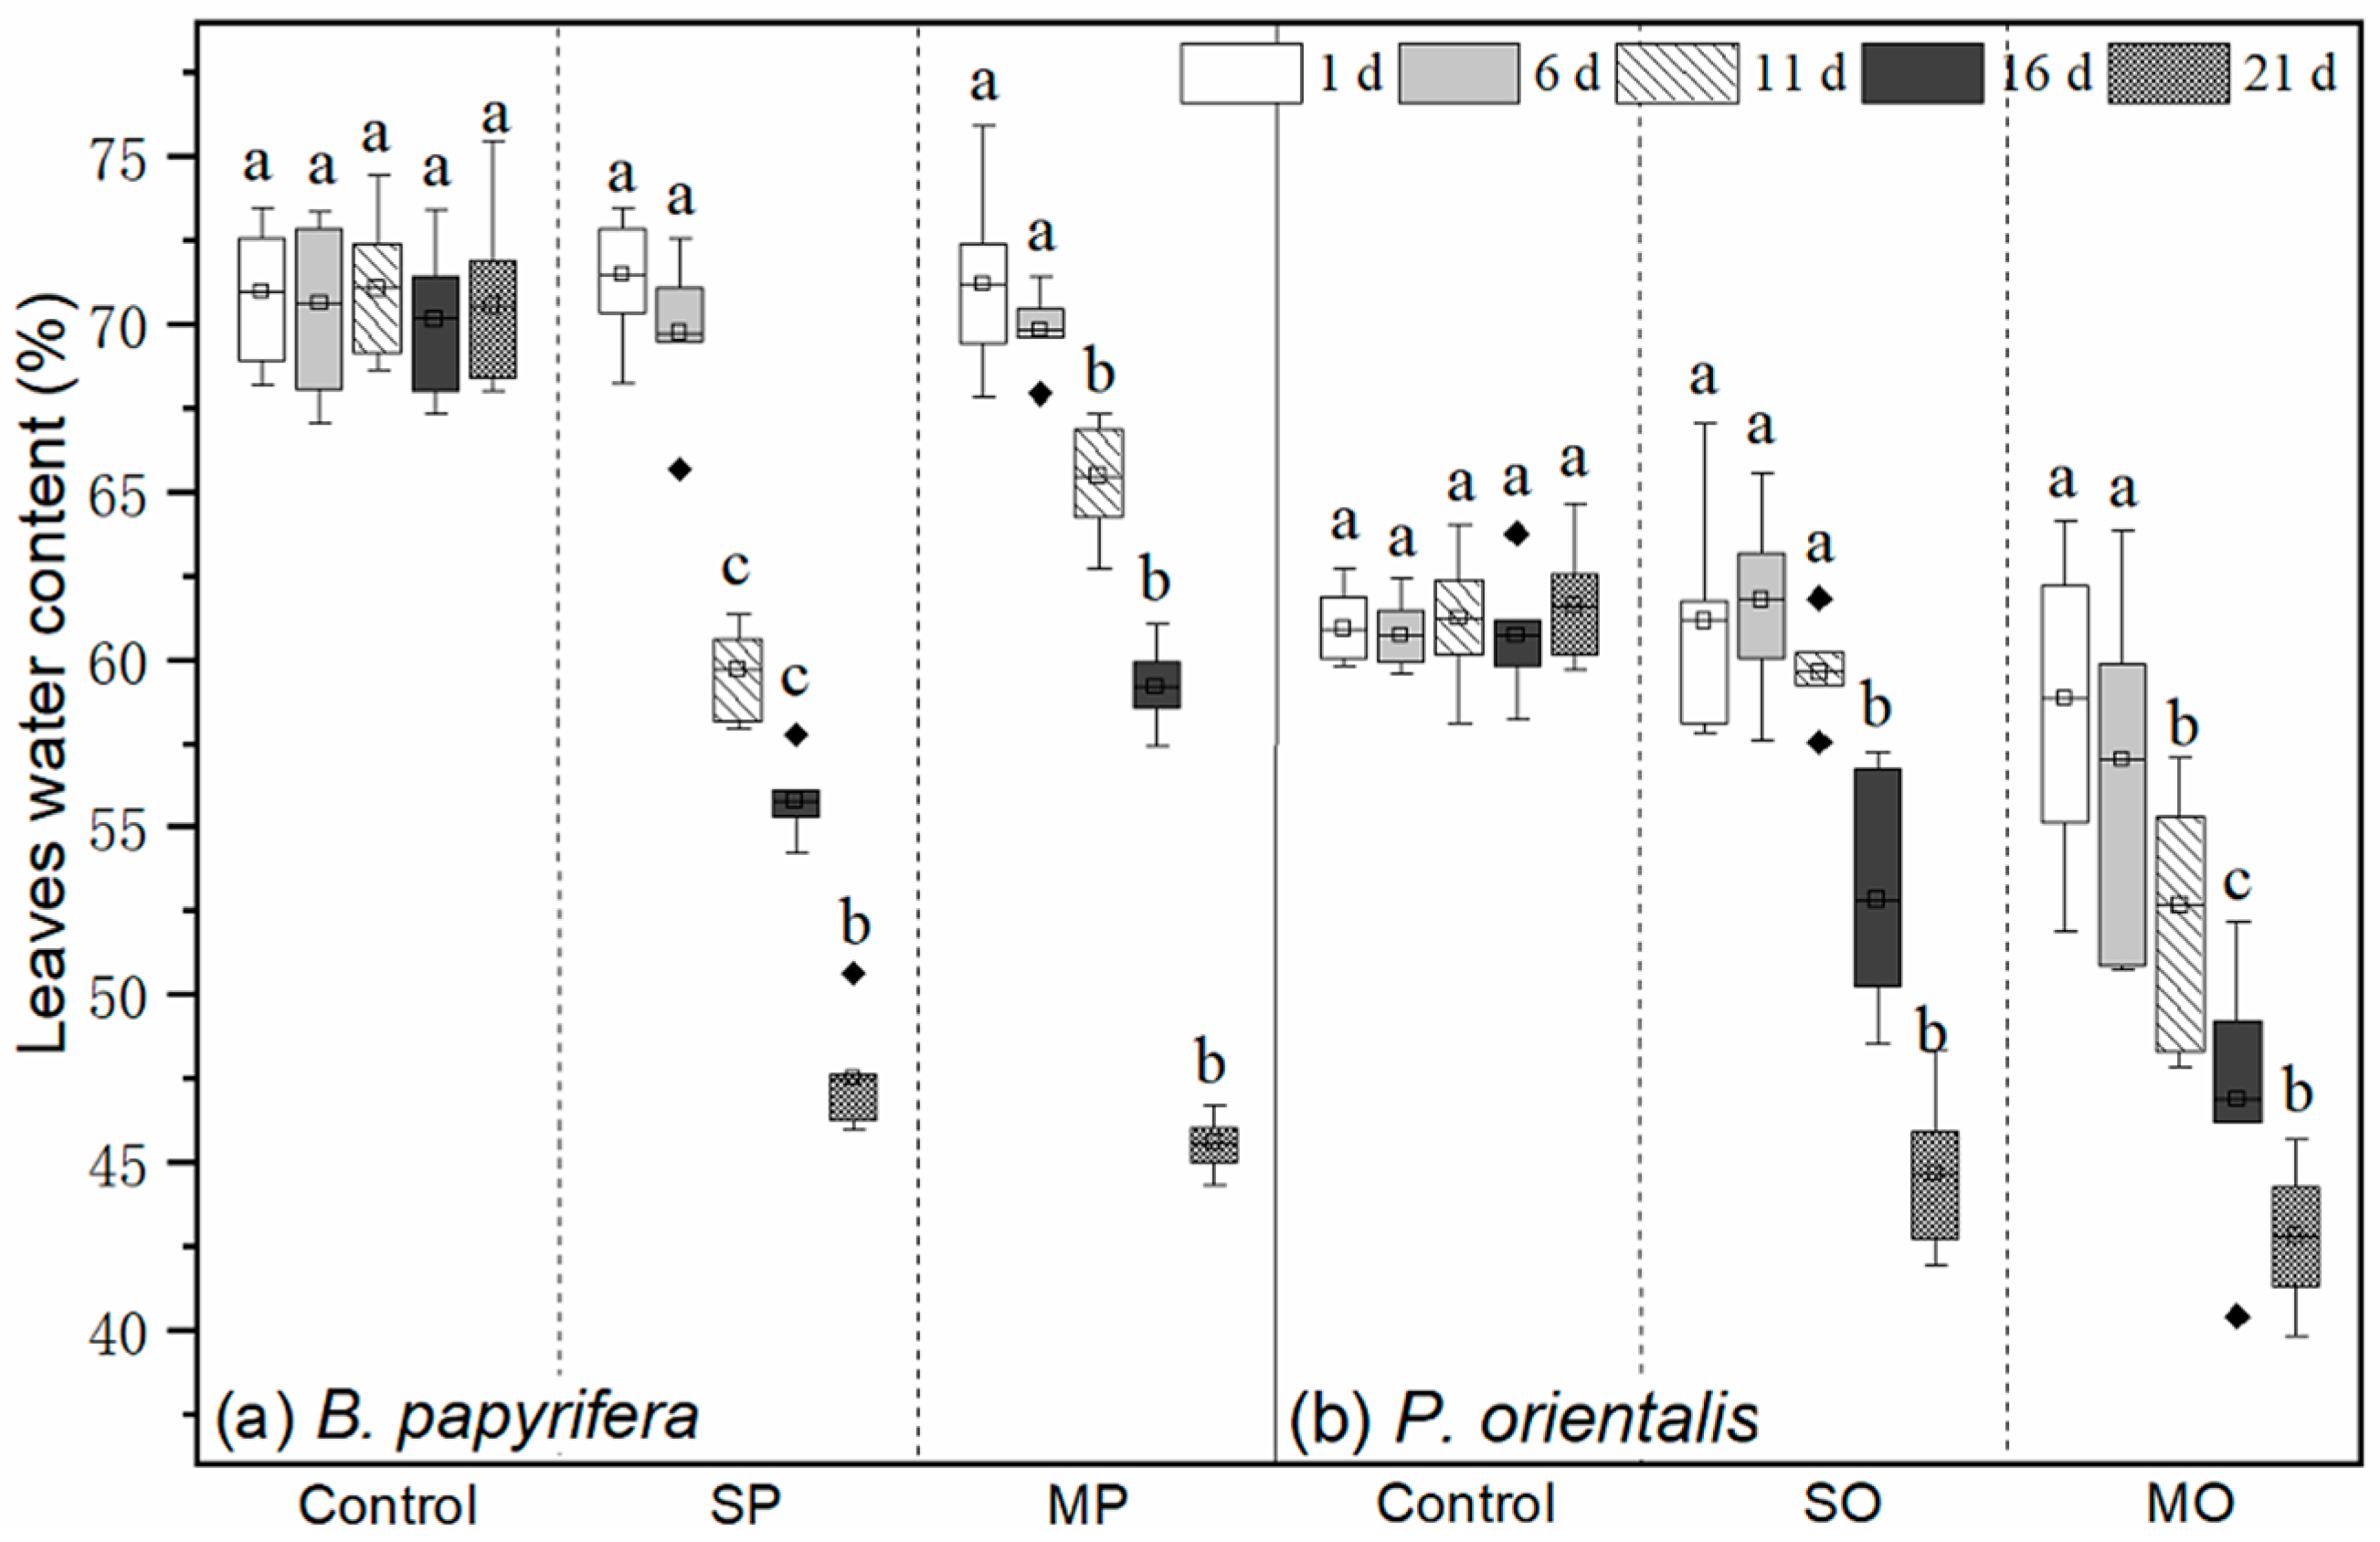
3.2. Leaf Water Contents, δ13C Value, and gs

As shown in Figure 3, the water contents in both plant leaves steadily dropped under prolonged drought conditions. Using Duncan’s test (p < 0.05), significant differences existed between the solo planting and mixed planting conditions at 11 d and 16 d for B. papyrifera and 11 d for P. orientalis. Under prolonged drought conditions, the δ13C values in both plants increased at 11 d.
After 11 d, the δ13C value in B. papyrifera continued to increase, but the δ13C value in P. orientalis was almost maintained at the same level. Significant differences (p < 0.05) existed between the solo planting and mixed planting conditions and only occurred on day 16 for B. papyrifera (Figure 4A,B). As shown in Figure 4C,D, under prolonged drought conditions, the gs in B. papyrifera under the two planting modes both decreased with the extension of processing time after 6 d. The gs in P. orientalis decreased sharply at 11 d and then declined slightly.

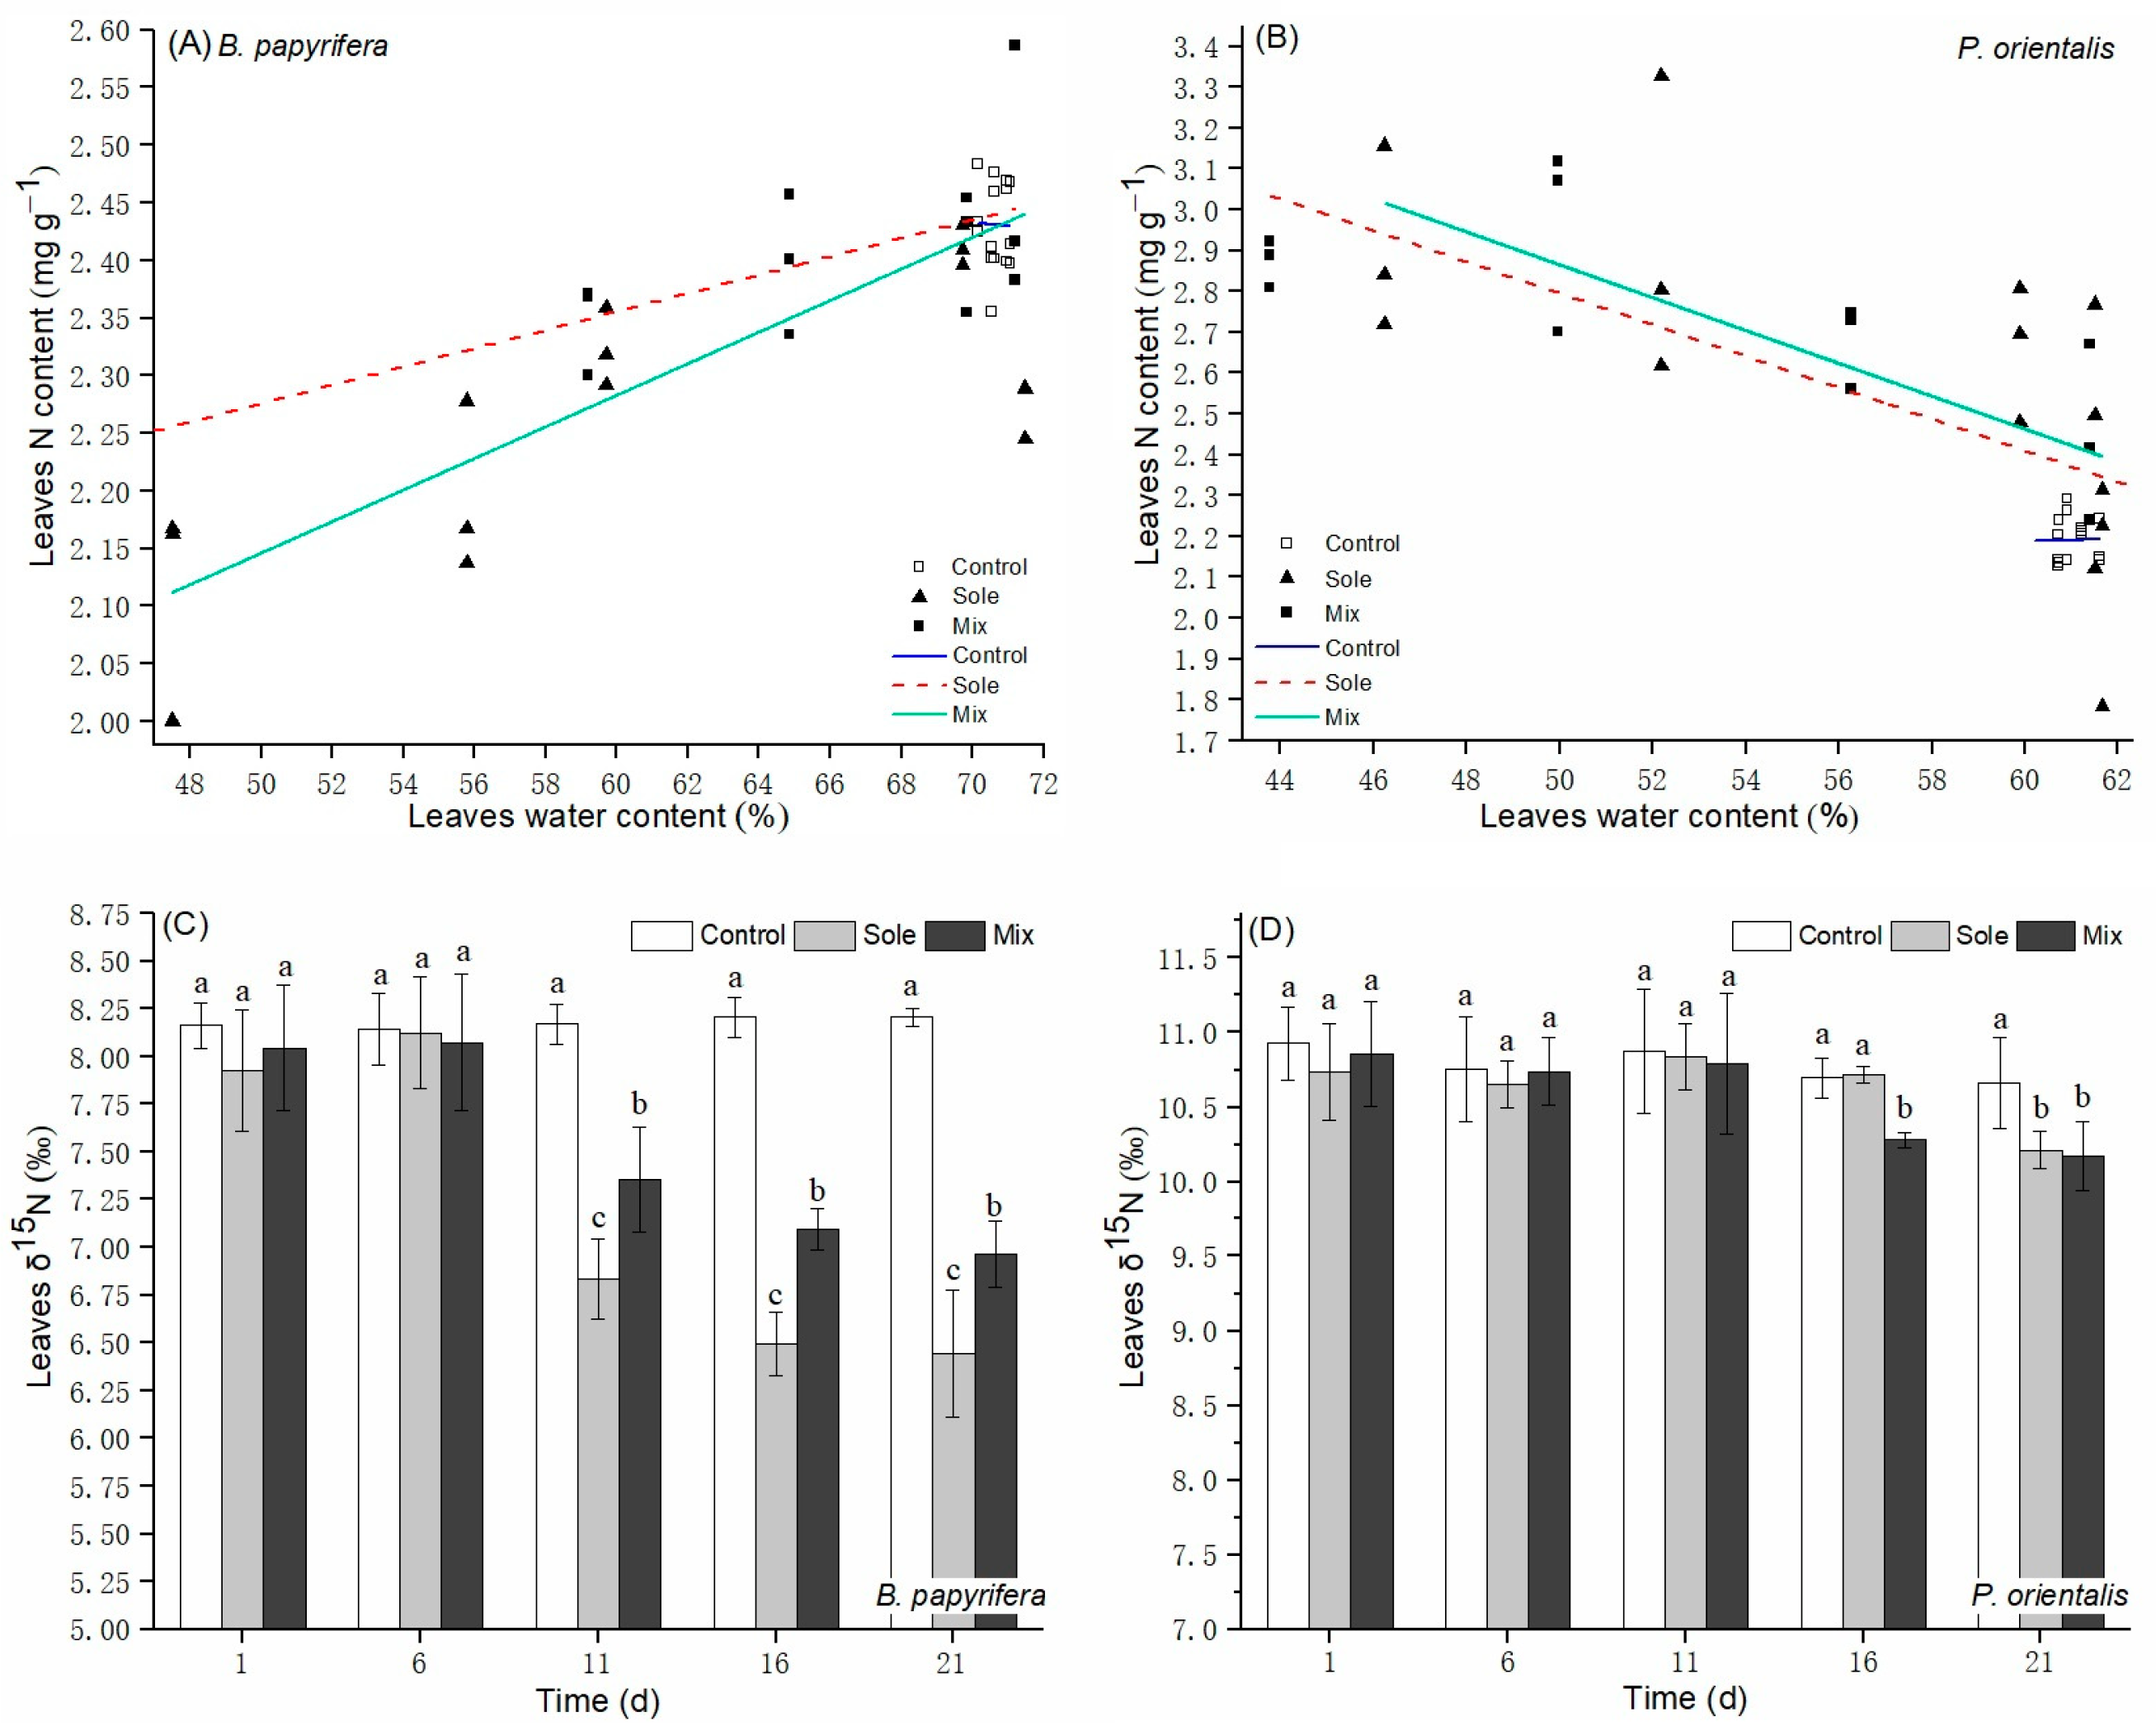
3.3. N Contents and δ15N Values

The N contents relative to water contents of leaves are represented in Figure 5A,B. Using linear regression analysis, the nitrogen content and water content in B. papyrifera leaves showed a significant positive relation under the solo planting and mixed planting conditions (solo: r = 0.7229, p < 0.01; mixed: r = 0.7702, p < 0.01), On the contrary, there were significant negative correlations between the nitrogen content and water content in P. orientalis leaves under the solo planting and mixed planting conditions (solo: r = −0.6459, p < 0.01; mixed: r = −0.7976, p < 0.01).
Under prolonged drought conditions, the δ15N value in B. papyrifera leaves began to decrease sharply from the 11th d, and there was a significant difference (p < 0.05) between the mixed planting and solo planting conditions. The δ15N value in P. orientalis leaves decreased slightly from the 16th d, and a significant difference between the two planting modes only existed at 16 d (Figure 5C,D).

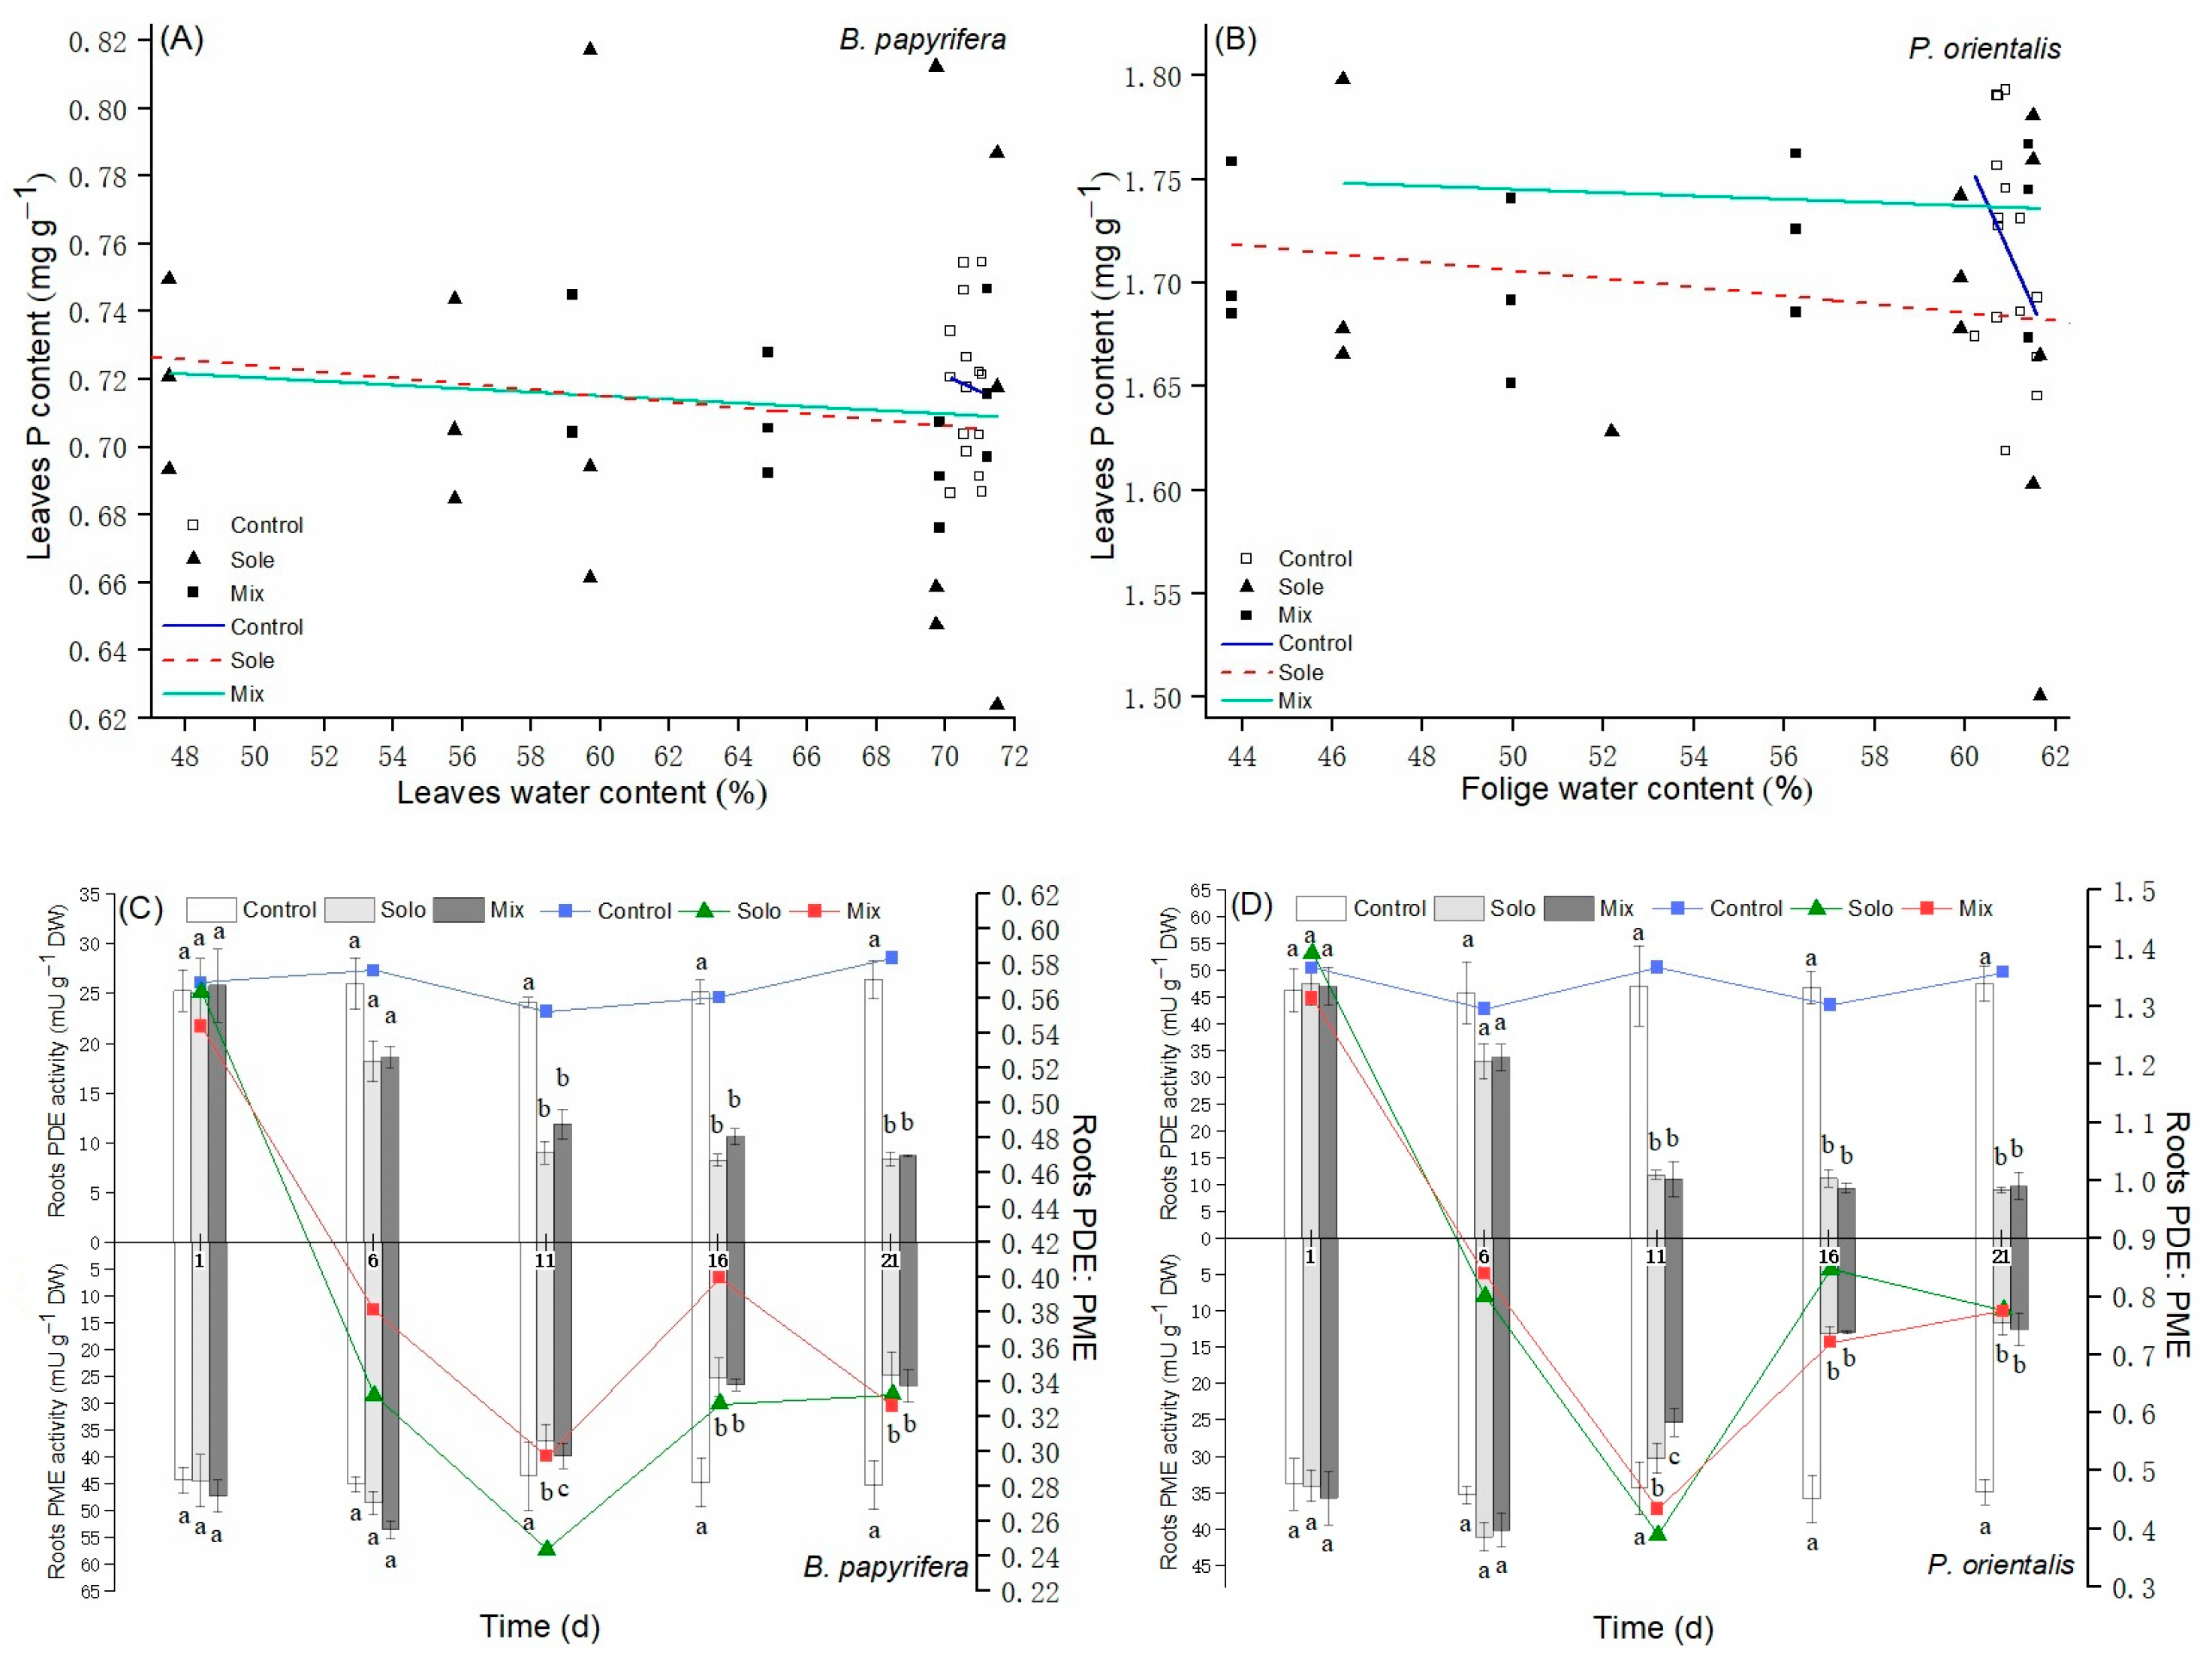
3.4. P Contents and PDE: PME Ratio

The P contents relative to the water contents in leaves are represented in Figure 6A,B. There was no correlation between the phosphorus content and water content in B. papyrifera leaves under the solo and mixed planting conditions (solo: p = 0.7652; mixed: p = 0.1913), and the same was true for P. orientalis (solo: p= 0.7652; mixed: p = 0.1913). Under prolonged drought, the PDE: PME ratio in B. papyrifera roots decreased from 0. 56 on day 1 to 0.24 at 11 d under the solo planting condition, and from 0.54 at 1 d to 0.30 at 11 d under the mixed planting condition. Then, this ratio increased at 21 d and was 0.33 under the solo and mixed planting conditions. The PDE: PME ratio in P. orientalis roots decreased from 1.39 at 1d to 0.39 at 11 d under the solo planting condition and from 1.31 at 1 d to 0.43 at 11 d under the mixed planting condition. Then, this ratio increased at 21 d and was 0.78 under the solo and mixed planting conditions. (Figure 6C,D).

3.5. Correlation and Difference Analysis

As shown in Table 1, linear regression analysis was performed to calculate Pearson’s correlations between the soil water content and N content, P content, δ13C, δ15N, PME, PDE, gs, and foliage water content. For B. papyrifera, there was no correlation between soil water contents and P contents; there was a significant positive correlation between soil water contents and N contents; and there was an extremely significant positive correlation between soil water contents and δ13C, δ15N, PME, PDE, gs, and leaf water contents. For P. orientalis, there was no correlation between soil water contents and P contents; a significant positive correlation between soil water contents and δ15N; an extremely significant positive correlation between soil water contents and δ13C, PME, PDE, gs, and leaves’ water contents; and an extremely significant negative correlation between soil water contents and N contents.
As shown in Table 2, a general linear model was used to analyse the difference between solo planting and mixed planting. For B. Papyrifera, a significant difference between the two planting methods in leaf water contents emerged at 11 d, and in δ15N, δ13C, N content, PDE and leaf water content emerged at 16 d. For P. orientalis, a significant difference between the two planting methods in PME and leaf water contents emerged at 11 d, in δ15N, δ13C and PDE at 16 d.

4. Discussion

4.1. Plants’ Water Status and Water Source Competition

How much water plants can get from soil is not only related to the distribution and absorption capacity of their roots but is also affected by the water competitiveness of neighboring plants [27]. In this study, the variation in water distribution in rhizosphere soil between the two planting modes was caused by water competition under mixed planting conditions, and B. papyrifera benefited from water competition, as shown by Duncan’s test. The δ13C was positively related to WUE under drought stress [28]. The competition effect emerged in B. papyrifera at 16 d, and plants under the mixed planting condition had lower WUEs (Figure 4A), which would imply that they were in a better water available environment. There was no difference in the δ13C value of P. orientalis between the two planting modes (Figure 4B), and the slow growth rate and rigid stomatal regulation strategy of P. orientalis may have weakened the effect of interspecific competition. Conifers and broad-leaved plants have different strategies in water and nutrition regulation in arid environments because of their significant differences in morphological structures and physiological mechanisms [29,30]. Stomatal behavior can respond to environmental changes and interspecific competition [31]. Under prolonged drought conditions, the gs values in P. orientalis showed that this plant took more rigid stomatal regulation and tried to reduce water loss, but B. papyrifera still maintained stomatal conductance before extreme drought occurred (Figure 4C,D). Previous studies observed that seedlings employed a riskier strategy when planted with a high-water-use competitor, and seedlings employed a more conservative strategy when planted with a low-water-use competitor [31]. However, in the current study, there were no significant differences in plants’ stomatal behavior between the solo planting and mixed planting conditions. This competitive advantage is related to the two species exhibiting significant differences in their root morphology. B. papyrifera has more root branches and fine roots, which is beneficial for enhancing the absorption of soil water; the main root of the P. orientalis root is wider and has fewer branches, which is better for the expansion of roots to further ranges and deeper soil layers. Additionally, there is a difference in the xylem structure between angiosperms and gymnosperms [32]. Due to the low hydraulic conductivity of tracheids relative to vessels, the absorption and transportation of water are limited in gymnosperms [33].

4.2. Plants N Status and N Sources Change

B. papyrifera and P. orientalis displayed opposite change patterns in the relationship between leaf water and nitrogen content (Figure 5A,B). Under solo planting and mixed planting conditions, there was a significant positive correlation between the leaf nitrogen content and water content in B. papyrifera, which was similar to the results of many studies [34,35,36]; however, there was a significant negative correlation between the leaf nitrogen content and water content of P. orientalis. It is speculated that the young leaves of P. orientalis obtain N from old leaves to synthesize abundant N-containing osmoregulation substances to maintain osmotic pressure during stomatal closure under water deficiency conditions. Under prolonged drought conditions, the change in δ15N value in B. papyrifera leaves was greater than that in P. orientalis leaves (Figure 5C,D), which also implied that B. papyrifera obtain more N from the environment and have more flexible N sources, while N in P. orientalis was transported from old tissues. In addition, because NO3 must be reduced to NH4+ before it can be used for plant metabolism, the assimilation event of nitrate is more complex, as mentioned by Evans et al. [37]; if plants use NO3- as a nitrogen source, the leaves have relatively high δ15N. From this view, B. papyrifera used more ammonium as a nitrogen source under drought stress in this study. The differences in the N source composition and the N pool in young leaves may show that the N competition pressure between these two plants could be alleviated under drought stress.

4.3. Plants P Status and P Sources Change

The availability of N and P is affected by drought in soil through different mechanisms. There was no correlation between the leaf P contents and water contents in B. papyrifera and P. orientalis (Figure 6A,B), which suggests that there was enough P stored in the plants to supply the growth of young leaves. P stored in roots could be used by plants for growth at times when availability is low [38]. The P content in young P. orientalis leaves was much higher than that in B. papyrifera, which should be because the growth time of P. orientalis of the same size is much longer than that of B. papyrifera, so more P accumulates in the P body. A large number of nutrient reserves obtained before drought events would make P. orientalis acquire a stronger recovery ability after rainfall [39,40,41]. Under the control treatment, the PME activity in B. papyrifera was higher than that in P. orientalis, but the PDE activity in P. orientalis was higher than that in B. papyrifera (Figure 6C,D), which should be related to the fact that angiosperms are more suitable for mesophytic habits and gymnosperms are more suitable for hydrophytic habits [42] and enable niche differentiation between these two plants in P resource utilization. Under drought stress, the PDE: PME ratio in both plants decreased sharply under prolonged drought, showing that the activity of PDE is heavily dependent on soil moisture; this may be because phosphate diesters are usually degraded rapidly in dry environments and the enzyme activity is driven by relative resource availability [43,44]. The PDE: PME ratio in these two plants underwent almost the same changes under prolonged drought, which indicated that they might have lost the niche differentiation of the P source and that P competition was exacerbated under drought stress.

4.4. Interspecific Competition Analysis

The competition mode of trees is driven by environmental factors and controlled by the dominant limiting factor [45]. In this study, except for the P content in leaves, the physiological and biochemical parameters of plants were significantly affected by soil water contents under prolonged drought conditions (Table 1). This shows that water competition was a decisive factor in interspecific nutritional competition between B. papyrifera and P. orientalis. Meanwhile, a general linear model was used to analyze the interspecific competition effect (the difference between the solo planting and mixed planting conditions) (Table 2). The results showed that water characteristics, N and P characteristics, and resources were significantly affected by interspecific competition under moderate drought conditions, but the interspecific competition effect did not exist under heavy drought conditions. In the current study, B. papyrifera benefited from interspecific competition. Previous studies also indicated that broad-leaved species competition dominates interspecific interactions in growth and water and nutrition utilization in mixed stands [46,47]. However, Liu et al. found that the level of N uptake in Pinus massoniana and Pinus elliottii were inhibited by the presence of Michelia maudiae and Schima superba, respectively, but almost no inhibitions occurred when M. maudiae was grown together with P. elliottii or S. superba was grown together with P. massoniana [48]. This indicates that angiosperms do not always have the advantage when competing with gymnosperms.

5. Conclusions

The present study indicated that B. papyrifera benefits from water and nutrient competition under moderate drought, and the competition mode of B. papyrifera and P. orientalis is controlled by the dominant limiting factor—soil water content. The N competition between these two plants could be alleviated through niche differentiation, but they lose the niche differentiation of the P source under drought stress conditions. This study illustrated that when coexisting with B. papyrifera in mixed stands, the effect of drought stress on P. orientalis will be amplified through interspecific competition; this means that the effect of interspecific water competition on mixed forests should be seriously considered in semiarid areas.

Author Contributions

Conceptualization, K.Y. and Y.W. (Yanyou Wu); experimentation, K.Y. and Y.W. (Yanqing Wang); writing, K.Y.; data analysis, Y.W. (Yanqing Wang); review and editing, Y.W. (Yanyou Wu). All authors have read and agreed to the published version of the manuscript.

Funding

This research was funded by the National Natural Science Foundation of China (U1612441) and the Doctoral Research Program of Guizhou Normal University (11904/0517067).

Institutional Review Board Statement

Not applicable.

Informed Consent Statement

Not applicable.

Data Availability Statement

Not applicable.

Acknowledgments

The authors are grateful to staff members from the 3rd Institute of Oceanography, Ministry of Natural Resources for the measurement of the isotopic composition.

Conflicts of Interest

The authors declare no conflict of interest.

References

  1. Cramer, W.; Guiot, J.; Fader, M.; Garrabou, J.; Gattuso, J.P.; Iglesias, A.; Lange, M.A.; Lionello, P.; Llasat, M.C.; Paz, S. Climate change and interconnected risks to sustainable development in the Mediterranean. Nat. Clim. Chang. 2018, 8, 972–980. [Google Scholar] [CrossRef] [Green Version]
  2. Kunstler, G.; Falster, D.; Coomes, D.A.; Hui, F.; Kooyman, R.M.; Laughlin, D.C.; Poorter, L.V.; Vanderwel, M.; Vieilledent, G.; Wright, S.J.; et al. Plant functional traits have globally consistent effects on competition. Nature 2016, 529, 204–207. [Google Scholar] [CrossRef] [PubMed] [Green Version]
  3. Calama, R.; Conde, M.; Dios-García, J.; Madrigal, G.; Vázquez-Piquéc, J. Linking climate, annual growth and competition in a Mediterranean forest: Pinus pinea in the Spanish Northern Plateau. Agric. For. Meteorol. 2019, 264, 309–321. [Google Scholar] [CrossRef]
  4. Lorts, C.M.; Lasky, J.R. Competition × drought interactions change phenotypic plasticity and the direction of selection on Arabidopsis traits. New Phytol. 2020, 227, 1060–1072. [Google Scholar] [CrossRef] [PubMed]
  5. Grossiord, C. Having the right neighbors: How tree species diversity modulates drought impacts on forests. New Phytol. 2019, 228, 42–49. [Google Scholar] [CrossRef] [Green Version]
  6. Jourdan, M.; Lebourgeois, F.; Morin, X. The effect of tree diversity on the resistance and recovery of forest stands in the French Alps may depend on species differences in hydraulic features. For. Ecol. Manag. 2019, 450, 117486. [Google Scholar] [CrossRef]
  7. Schwarz, J.A.; Bauhus, J. Benefits of mixtures on growth performance of silver fir (Abies alba) and european beech (Fagus sylvatica) increase with tree size without reducing drought tolerance. Front. For. Glob. Chang. 2019, 2, 79. [Google Scholar] [CrossRef]
  8. Forrester, D.I.; Bauhus, J. A review of processes behind diversity-productivity relationships in forests. Curr. For. Rep. 2016, 2, 45–61. [Google Scholar] [CrossRef] [Green Version]
  9. He, M.; Dijkstra, F.A. Drought effect on plant nitrogen and phosphorus: A meta-analysis. New Phytol. 2014, 204, 924–931. [Google Scholar] [CrossRef]
  10. Sardans, J.; Urbina, I.; Grau, O.; Asensio, D.; Ogaya, R.; Peñuelas, J. Long-term drought decreases ecosystem C and nutrient storage in a Mediterranean holm oak forest. Environ. Exp. Bot. 2020, 114, 104135. [Google Scholar] [CrossRef]
  11. Suriyagoda, L.D.B.; Ryan, M.H.; Renton, M.; Lambers, H. Plant responses to limited moisture and phosphorus availability: A meta-analysis. Adv. Agron. 2014, 124, 143–200. [Google Scholar]
  12. Cregger, M.A.; McDowell, N.G.; Pangle, R.E.; Pockman, W.T.; Classen, A.T. The impact of precipitation change on nitrogen cycling in a semi-arid ecosystem. Funct. Ecol. 2014, 28, 1534–1544. [Google Scholar] [CrossRef]
  13. Agren, G.I. Stoichiometry and nutrition of plant growth in natural communities. Annu. Rev. Ecol. Evol. Syst. 2008, 39, 153–170. [Google Scholar] [CrossRef]
  14. Le Bauer, D.S.; Treseder, K.K. Nitrogen limitation of net primary productivity in terrestrial ecosystems is globally distributed. Ecology 2008, 89, 371–379. [Google Scholar] [CrossRef] [Green Version]
  15. Vitousek, P.M.; Porder, S.; Houlton, B.Z.; Chadwick, O.A. Terrestrial phosphorus limitation: Mechanisms, implications, and nitrogen-phosphorus interactions. Ecol. Appl. 2010, 20, 5–15. [Google Scholar] [CrossRef] [Green Version]
  16. Homyak, P.M.; Slessarev, E.W.; Hagerty, S.; Greene, A.C.; Marchus, K.; Dowdy, K.; Iverson, S.; Schimel, J.P. Amino acids dominate diffusive nitrogen fluxes across soil depths in acidic tussock tundra. New Phytol. 2021, 231, 2162–2173. [Google Scholar] [CrossRef]
  17. Leake, J.R.; Miles, W. Phosphodiesters as mycorrhizal P sources: I. Phosphodiesterase production and the utilization of DNA as a phosphorus source by the ericoid mycorrhizal fungus Hymenoscyphus ericae. New Phytol. 1996, 132, 435–443. [Google Scholar] [CrossRef]
  18. Makarov, M.I.; Haumaier, L.; Zech, W. The nature and origins of diester phosphates in soils: A 31P-NMR study. Biol. Fertil. Soils 2002, 35, 136–146. [Google Scholar]
  19. Turner, B.L.; Newman, S. Phosphorus cycling in wetland soils: The importance of phosphate diesters. J. Environ. Qual. 2005, 34, 1921–1929. [Google Scholar] [CrossRef] [Green Version]
  20. Turner, B.L. Resource partitioning for soil phosphorus: A hypothesis. J. Ecol. 2008, 96, 698–702. [Google Scholar] [CrossRef]
  21. Rejmάnkovά, E.; Dagmara Sirovά, D.; Carlson, E. Patterns of activities of root phosphomonoesterase and phosphodiesterase in wetland plants as a function of macrophyte species and ambient phosphorus regime. New Phytol. 2011, 190, 968–976. [Google Scholar] [CrossRef]
  22. Huston, M.A. Management strategies for plant invasions: Manipulating productivity, disturbance, and competition. Divers. Distrib. 2004, 10, 167–178. [Google Scholar] [CrossRef]
  23. Lei, H.P.; Wang, Y.G.; Liang, F.Y.; Su, W.W.; Feng, Y.F.; Guo, X.L.; Wang, N. Composition and variability of essential oils of Platycladus orientalis growing in China. Biochem. Syst. Ecol. 2010, 38, 1000–1006. [Google Scholar] [CrossRef]
  24. Li, J.Y. Studies on drought tolerance of some main used in afforestation in Taihang mountain tree species region (III)—Water parameters. J. Beijing For. Univ. 1990, 13, 230–239. [Google Scholar]
  25. Tabatabai, M.A.; Bremmer, J.A. Use of p-nitrophenylphosphate for assay of soil phosphatase activity. Soil Biol. Biochem. 1969, 1, 301–307. [Google Scholar] [CrossRef]
  26. Eivazi, F.; Tabatabai, M.A. Phosphatases in soils. Soil Biol. Biochem. 1977, 9, 167–172. [Google Scholar] [CrossRef]
  27. Farrior, C.E.; Dybzinski, R.; Levin, S.A.; Pacala, S.W. Competition for water and light in closed-canopy forests: A tractable model of carbon allocation with implications for carbon sinks. Am. Nat. 2013, 181, 314–330. [Google Scholar] [CrossRef] [Green Version]
  28. Jucker, T.; Grossiord, C.; Bonal, D.; Bouriaud, O.; Gessler, A.; Coomes, D.A. Detecting the fingerprint of drought across Europe’s forest: Do carbon isotope ratios and stem growth rates tell similar stories? For. Ecosyst. 2017, 4, 24. [Google Scholar] [CrossRef] [Green Version]
  29. DeSoto, L.; Cailleret, M.; Sterck, F.; Jansen, S.; Kramer, K.; Robert, E.M.R.; Aakala, T.; Amoroso, M.M.; Bigler, C.; Camarero, J.J.; et al. Low growth resilience to drought is related to future mortality risk in trees. Nat. Commun. 2020, 11, 545. [Google Scholar] [CrossRef]
  30. Adams, H.D.; Zeppel, M.J.B.; Anderegg, W.R.L.; Hartmann, H.; Landhäusser, S.M.; Tissue, D.T.; Huxman, T.E.; Hudson, P.J.; Franz, T.E.; Allen, C.D.; et al. A multi-species synthesis of physiological mechanisms in drought-induced tree mortality. Nat. Ecol. Evol. 2017, 1, 1285–1291. [Google Scholar] [CrossRef]
  31. Zenes, N.; Kerr, K.L.; Trugman, A.T.; Anderegg, W.R.L. Competition and drought alter optimal stomatal strategy in tree seedlings. Front. Plant Sci. 2020, 11, 478. [Google Scholar] [CrossRef] [PubMed]
  32. Brodribb, T.J.; Field, T.S. Leaf hydraulic evolution led a surge in leaf photosynthetic capacity during early angiosperm diversification. Ecol. Lett. 2010, 13, 175–183. [Google Scholar] [CrossRef] [PubMed]
  33. Piper, F.I.; Hoch, G.; Fajardo, A. Revisiting the relative growth rate hypothesis for gymnosperm and angiosperm species co-occurrence. Am. J. Bot. 2019, 106, 101–112. [Google Scholar] [CrossRef] [PubMed]
  34. Urbina, I.; Sardans, J.; Beierkuhnlein, C.; Jenntsch, A.; Backhaus, S.; Grant, K.; Peñuelas, J. Shifts in the elemental composition of plants during a very severe drought. Environ. Exp. Bot. 2015, 111, 63–73. [Google Scholar] [CrossRef] [Green Version]
  35. Mouradi, M.; Bouizgarenb, A.; Farissi, M.; Latracha, L.; Qaddourya, A.; Cherki, G. Seed osmopriming improves plant growth, nodulation, chlorophyll fluorescence and nutrient uptake in alfalfa (Medicago sativa L.)—Rhizobia symbiosis under drought stress. Sci. Hortic. 2016, 213, 232–242. [Google Scholar] [CrossRef]
  36. Mariotte, P.; Cresswell, T.; Johansen, M.P.; Harrison, J.J.; Keitel, C.; Dijkstra, F.A. Plant uptake of nitrogen and phosphorus among grassland species affected by drought along a soil available phosphorus gradient. Plant Soil. 2020, 448, 121–132. [Google Scholar] [CrossRef]
  37. Evans, R.D.; Bloom, A.J.; Sukrapanna, S.S.; Ehleringer, J.R. Nitrogen isotope composition of tomato (Lycopersicon esculentum Mill. cv. T-5) grown under ammonium or nitrate nutrition. Plant Cell Environ. 1996, 19, 1317–1323. [Google Scholar] [CrossRef]
  38. Peuke, A.D.; Rennenberg, H. Carbon, nitrogen, phosphorus, and Sulphur concentration and partitioning in beech ecotypes (Fagus sylvatica L.): Phosphorus most affected by drought. Trees 2004, 18, 639–648. [Google Scholar] [CrossRef]
  39. Hacke, U.G.; Sperry, J.S.; Wheeler, J.K.; Castro, L. Scaling of angiosperm xylem structure with safety and efficiency. Tree Physiol. 2006, 26, 689–701. [Google Scholar] [CrossRef]
  40. Gessler, A.; Schaub, M.; McDowell, N.G. The role of nutrients in drought-induced tree mortality and recovery. New Phytol. 2017, 214, 513–520. [Google Scholar] [CrossRef] [Green Version]
  41. Schönbeck, L.; Gessler, A.; Schaub, M.; Rigling, A.; Hoch, G.; Kahmen, A.; Li, M.H. Soil nutrients and lowered source: Sink ratio mitigate effects of mild but not of extreme drought in trees. Environ. Exp. Bot. 2020, 169, 103905. [Google Scholar] [CrossRef]
  42. Bond, W.J. The tortoise and the hare: Ecology of angiosperm dominance and gymnosperm persistence. Bot. J. Linn. Soc. 1989, 36, 227–249. [Google Scholar] [CrossRef]
  43. Bowman, R.A.; Cole, C.V. Transformations of organic phosphorus substrates in soils as evaluated by NaHCO3 extraction. Soil Sci. 1978, 125, 49–54. [Google Scholar] [CrossRef]
  44. Sinsabaugh, R.L.; Follstad Shah, J.J. Ecoenzymatic stoichiometry and ecological theory. Annu. Rev. Ecol. Evol. Syst. 2012, 43, 313–343. [Google Scholar] [CrossRef] [Green Version]
  45. Pretzsch, H.; Biber, P. Size-symmetric versus size-asymmetric competition and growth partitioning among trees in forest stands along an ecological gradient in central Europe. Can. J. For. Res. 2010, 40, 370–384. [Google Scholar] [CrossRef]
  46. Reyer, C.; Lasch, P.; Mohren, G.M.J.; Sterck, F.J. Inter-specific competition in mixed forests of Douglas-fir (Pseudotsuga menziesii) and common beech (Fagus sylvatica) under climate change—A model-based analysis. Ann. For. Sci. 2010, 67, 805. [Google Scholar] [CrossRef]
  47. Ferrio, J.P.; Shestakova, T.A.; Castillo, J.; Voltas, J. Oak competition dominates in-terspecific interactions in growth and water-use efficiency in a mixed pine–oak medi-terranean forest. Forests 2021, 12, 1093. [Google Scholar] [CrossRef]
  48. Liu, Q.Y.; Xu, M.J.; Yuan, Y.; Wang, H.M. Interspecific competition for inorganic nitrogen between canopy trees and underlayer-planted young trees in subtropical pine plantations. For. Ecol. Manag. 2021, 494, 119331. [Google Scholar] [CrossRef]
Figure 1. Planting modes and soil sampling points. (a) Solo planting; (b) mixed planting; • are the soil sampling points.
Agronomy 12 01489 g001
Figure 2. Soil water contents in the rhizosphere of B. papyrifera (A) and P. orientalis (B). Letters denote significant differences among soil sampling points (p < 0.05). SP—B. papyrifera under solo planting, MPO—outside of B. papyrifera under mixed planting, MPI—inside of B. papyrifera under mixed planting, SO—P. orientalis under mixed planting, MOO—outside of P. orientalis under mixed planting, MOI—inside of P. orientalis under mixed planting.
Agronomy 12 01489 g002
Figure 3. Leaf water contents in B. papyrifera and P. orientalis. Letters denote significant differences among different planting and treatment modes (p < 0.05). SP—B. papyrifera under solo planting, MP—B. papyrifera under mixed planting, SO—P. orientalis under mixed planting, MO—P. orientalis under mixed planting.
Agronomy 12 01489 g003
Figure 4. The leaves’ δ13C value in B. papyrifera (A) and P. orientalis (B). Leaves’ gs value in B. papyrifera (C) and P. orientalis (D). Letters denote significant differences among different planting and treatment modes (p < 0.05).
Agronomy 12 01489 g004
Figure 5. The leaves’ N content relative to water content in B. papyrifera (A) and P. orientalis (B). Curve fits in the graphs are separate linear regressions. Leaves’ δ15N value in B. papyrifera (C) and P. orientalis (D). Letters denote significant differences among different planting and treatment modes (p < 0.05).
Agronomy 12 01489 g005
Figure 6. The leaves’ P content relative to water content in B. papyrifera (A) and P. orientalis (B). Curve fits in the graphs are separate linear regressions. The roots’ PDE: PME ratio in B. papyrifera (C) and P. orientalis (D). Letters denote significant differences among different planting and treatment modes (p < 0.05).
Agronomy 12 01489 g006
Table 1. p-value and Pearson’s r between soil water content and N content, P content, δ13C, δ15N, PME, PDE, gs, and leaf water content.
B. papyriferaP. orientalis
p-ValuePearson’s rp-ValuePearson’s r
δ13C3.65 × 10−6 ***0.86482.20 × 10−7 ***0.9064
N content0.0206 *0.54052.30 × 10−7 ***−0.9059
δ15N2.28 × 10−4 ***0.76340.0128 *0.5739
P content0. 8149−0.05940.6883−0.1016
PME6.24 × 10−5 ***0.80212.50 × 10−7 ***0.9048
PDE2. 54 × 10−7 ***0.90466.07 × 10−9 ***0.9411
gs2.79 × 10−4 ***0.75673.61 × 10−13 ***0.9828
Leaf water content1.89 × 10−5 ***0.83164.71 × 10−7 ***0.8967
Soil water content is the average value of soil layers and sampling points. p-value and Pearson’s r were calculated with linear regression analysis (* p < 0.05 and *** p < 0.001).
Table 2. p-values in solo planting and mixed planting conditions in B. papyrifera and P. orientalis.
p-Value
B. papyriferaP. orientalis
1 d 6 d 11 d 16 d 21 d 1 d 6 d 11 d 16 d 21 d
δ13C 0.689 0.964 0.440 0.012 0.655 0.6890.9640.4400.012 0.655
N content 0.870 0.959 0.136 0.035 0.157 0.9110.9350.8740.861 0.822
δ15N 0.675 0.865 0.059 0.006 0.072 0.6760.6190.8780.001 0.800
P content 0.845 0.799 0.761 0.779 0.791 0.4900.8330.5880.299 0.977
PME 0.426 0.091 0.264 0.568 0.587 0.5420.6110.0360.710 0.617
PDE 0.815 0.817 0.058 0.013 0.334 0.8150.8170.0580.013 0.334
gs0.9380.5670.3400.6590.6580.2050.2860.9800.9540.758
Leaf water content0.8730.9300.0100.0400.0730.5850.9510.0100.2120.695
p-values were calculated with general linear model.
Publisher’s Note: MDPI stays neutral with regard to jurisdictional claims in published maps and institutional affiliations.

