Abstract
Field pea (Pisum sativum L.) is one of the most important pulse crops, and is widely grown in North China. To exploit potential pea varieties suitable for growing in spring planting areas, a set National Regional Trials of Spring Pea Genotype was carried out under irrigated and rainfed environments across seven locations. Grain yield and agronomic traits of fourteen pea cultivars were evaluated. Analysis of variance indicated that the effect of genotype, environments and genotypes × environments interaction was significant (p < 0.01). Results of GGE biplot analysis showed that the first and second principal components accounted for 77.5% and 14.5%, respectively. Genotypes accounted for just 14.7% of the variation in seed yield, while environments accounted for 39.9%, and genotypes × environments interaction accounted for 45.5% of the variation. Investigating the polygon view led to the identification of five superior genotypes and five productivity environments. Superior genotypes and key environments for grain yield were determined using a general linear model. The significant genotypes × environments interaction effects indicated the inconsistent performance of genotypes across the tested environments. Among the tested genotypes, significant differences were observed for grain yield and yield-related traits. The semi-leafless pea variety Longwan 10 was observed the highest yield (3308 kg/ha) over seven locations. Dingwan 12, Dingwan 13, Tongwan 5, Kewan 7 showed higher, stable grain yield than the overall mean of genotypes and check variety Zhongwan 6. The most representative and productivity regions for grain yield of field pea were Yondeng, Qitai, Liaoyang, Dingxi and Tangshan. These findings represent a comprehensive analysis of yield and stability of spring pea varieties and growing locations, which may be useful for national and international pea improvement programs.
1. Introduction
Pea (Pisum sativum L.), a cool-season legume crop grown in more than 85 countries, is the second-most-important grain legume in the world [1]. Pea seed is highly nutritious, and approximately half the world’s production is fed to livestock while the remaining portion is used for human food, primarily in developing counties. Pea also plays an important role in crop rotation as a plant that interrupts the frequent succession of cereals [2]. Due to its short growing season and the ability of N2 fixation, it has been accepted as one of the valuable crops of organic farming [3].
In China, dry pea is one of the most important pulse crops, which has been produced for a long time in high-altitude marginal lands and low-input areas by smallholder farmers. Pea has good potential in new food applications due to its moderate protein concentration and slowly digestible starch [4]. A major new use for dry pea is the Chinese vermicelli, which utilizes pea starch. China has favorable agroecological conditions for the cultivation of peas for seeds, especially in northwest China, including Gansu, Xingjiang, Hebei, Ningxia and Inner Mongolia, which are the dominant regions for planting spring peas, with sowing in late March to early May and harvesting in early August [5]. Field pea breeding in China started in the 1960s, with the objective of improving productivity through the generation of high yielding varieties with tolerance/resistance to different production constraints and suitable for different agro-ecologies of the country [6].
Current demand of field pea is high, but the productivity is very low and unstable. In 2020, China’s total acreage was about 935,517 hectares with production volume of 1,440,627 t [7]. However, the average yield of 1587 kg per hectare is very low as compared to its potential and yield obtained in many developed countries, which may be attributed to the non-adoption of improved varieties. Other factors like the non-usage of recommended agronomic practices, application of improper fertilizer doses, diseases and harvesting losses also play an important role in yield reduction. In addition, environmental factors such as temperature, rainfall, soil type and moisture also affect pea yield. By far, genotype by environment interaction is the most difficult factor to increase yield of field pea in China, due to diverse agro-climatic zones and the high sensitivity of field pea to various environmental factors.
Genotypes (G) × environments (E) interaction (GEI) refers to differential responses of genotypes across diverse environments [8]. Most agronomically and economically important traits, such as grain yield, are quantitative in nature and routinely exhibit GEI [9]. Detecting GEI effects on yield and other agronomically important traits is one of the most important components for multi-environment yield trials (MEYT) [10]. To be widely accepted, a new crop variety must show good performance across multi-environments before registration and release. The estimation of G, E and GEI ensures valid recommendations of suitable varieties able to overcome the pressure due to variable occurring conditions [11]. The determination of GEI factors helps geneticists in their breeding programs to shift the selection toward varieties suited for wide environments. For analysis of MEYT, additive main effects and multiplicative interactions (AMMI), as well as genotype plus genotype environment interaction (GGE) biplots, have been developed to study GEI effects [12]. However, the GGE biplot model provided an excellent graphical presentation for breeders, visualizing various aspects of genotype and genotype × environment in different biplots, not only showing the stability of genotype but also discrimination strength of recognition in given environments [13].
The GGE biplot methodology has been used to evaluate test environments in cowpea [14], grass pea [15], fava bean [16], chickpea [17], mung bean [18,19], dry beans [20], dry peas [21,22], lentils [23] and other pulses. The objective of this study was to assess the grain yield performance and agronomic traits of local pea genotypes improved by different province research institutes under multiple environments, in order to further exploit high yield potential elite pea varieties with tolerance to biotic and abiotic stresses, and which are widely suitable for planting in spring sowing areas in China.
2. Materials and Methods
2.1. Genotypes, Testing Location, and Experimental Design
Material for the studies covered fourteen pea cultivars, which were bred and released by pea breeders from nine public research institutions. Twelve are normal leaf type and two are semi-leafless type pea. The source and some main quality traits of these pea varieties are presented in Table 1.

Table 1.
Main qualitative traits and original of fourteen pea genotypes.
The locations of MEYT include Yondeng, Qitai, Liaoyang, Dingxi, Tangshan, Langfang and Maerkang, among which Yondeng, Qitai, and Langfang are in irrigated agricultural areas; and Liaoyang, Dingxi, Tangshan and Maerkang are in rain-fed agricultural area. For the seven locations, long-term average total precipitation varied from 201 mm to 717 mm per year, with 26.9–74.5% of the yearly precipitation occurring during the pea growing season. Long-term average annual temperature of the locations was 16.4 °C, with yearly average temperatures ranging from 5.5 °C to 12.0 °C. The daily minimum temperatures in spring varied from −4 °C to −11 °C, and the daily maximum temperatures in summer varied from 22 °C to 28 °C between locations. Additional information on soil type, biotic or crop management factors and climatic characteristics of experimental locations are presented in Table 2.
Table 2.
Locational and climatic characteristics of experimental locations, soil types, agricultural climatic zone and growing conditions during the pea growing season.
Fourteen field pea genotypes, together with standard check, were evaluated during the main cropping season for two years (2020 to 2021) in seven locations, and each environment and year were treated as a single environment. During each year, the experiment with genotypes was carried out in a randomized complete block design (RCBD) with three replications. The plot size was 2 × 5 m (10 m2), with six rows and spacing 40 cm between rows and 5 cm between plants being maintained. Diammonium phosphate (46% P, 18% N) fertilizer and urea (46% N) were applied at rates of 150 kg/ha and 75 kg/ha, respectively. Weeds were controlled periodically by hand weeding, irrigation was performed in E1, E2 and E6 location at the seedling and flowering stage, and other management practices like pest or disease-control was done as required. Pea is most often sown in mid-March. The harvest took place in late July and early August.
2.2. Data Collection and Analysis
Data on grain yield and yield-related traits were collected on plot and plant basis from each plot, respectively. Branches per plant (BP) and date of maturity (DM) were taken when each plot attained 50% flowering and 90% of the pod’s physiological maturity, respectively, and days were calculated beginning from the date of sowing. Data for plant height (PH), seeds per plant (SPP), grain weight per plant (GWP) and seeds per pod (SPD) were collected on the basis of five sample plants which were randomly taken from each plot, and the average of five sample plants was used for analysis. Hundred seed weight (HSW) and grain yield of plot (GYP) were measured on clean, dried seed and the measured grain yield value has converted to kilogram per hectare for analysis. Statistical analysis was carried out by SPSS for Windows version 26.0 (IBM Corporation, New York, NY, USA). Standard statistical techniques were used, and the data were subjected to analysis of variance (ANOVA) using the Fisher’s least significant difference (LSD) method to test the significance difference between means. To compare the differences among the genotype means, the significant data were further analyzed statistically using a Least Significant Difference (LSD) test at p < 0.05 and p < 0.01 probability level. A two-way fixed effect model was fitted to determine the magnitude of the main effects of variation and their interaction on seeds yield. To perform GGE biplot analysis, least square means from each environment were analyzed using the GGE BiplotGUI package from the statistical software R.
3. Results and Discussion
3.1. Analysis of Variance of Grain Yield
The combined analysis of variance for grain yield of fourteen field pea genotypes over seven locations across two years showed that there were significant differences for grain yield among locations, pea genotypes and GEI (Table 3) The result showed that field pea grain yield was significantly (p < 0.01) affected by environments (locations and years), genotype and GEI. The significance of GEI indicated that grain yield and yield-related traits of the genotypes was not consistent in different experimental environments, and the impact of environment on yield potential of the genotypes was also different. The additive main effects and multiplicative interactions (AMMI) model was used to partition the GEI of grain yield of field pea. The results showed that genotypes accounted for just 14.7% of the variation in seed yield, whereas environments accounted for 39.9% (37.1% and 2.8% for locations and years, respectively) and GEI accounted for 45.5% (18.1%, 1.4% and 26.0% for G × L, G × Y and G × L × Y) of the variation (Table 3). The finding indicated that field pea grain yield was significantly affected by GEI, followed by the changes in the environment and genotypic effect. The effect of different environment on pea grain yield was significantly different, indicating that different environment had a great difference on pea grain yield. Pea is often described as a species adapted to a wide type of environmental conditions [24]. Many studies have showed a significant influence of environment and GEI on phenotypic performance of resistance to pea weevil [21], dry matter and seed yield [22] and other agronomically important traits [25]. GEI effects are very significant for pea variety improvement to identify adaptation targets and test locations. When GEI are due to variations in predictable factors, pea breeders can choose either to develop specific genotypes for selected environments or broadly adapted genotypes that perform well under variable conditions [26]. However, when GEI results from unpredictable sources, breeders need to develop stable genotypes that perform reasonably well under a range of environmental conditions.
Table 3.
Combined analysis of variance for grain yield (kg/ha) of the fourteen pea genotypes over seven locations across two years.
3.2. Mean Performance of Different Genotypes and Environment
Average grain yields of individual location were calculated for each year and across years (Table 4). There was no significant difference in pea grain yield between irrigated and rain-fed conditions. Under irrigated condition, the yields ranged from 774 kg/ha in E6 to 5444 kg/ha in E1, with the regional average of 2543 kg/ha. Under rain-fed conditions, the yields ranged from 758 kg/ha in E7 to 5485 kg/ha in E3, with a regional average of 2389 kg/ha. However, site variation was observed in the individual years, and across years, the ranges of grain yield and yield-related traits were generally wider. In rain-fed conditions, the average yields in 2020 ranged from 1029 kg/ha in E7 to 3335 kg/ha in E3, with the regional average (across four sites) of 2279 kg/ha. The yield advantage of the highest yield environment E1 was 24.5% higher than the average yield of the environment. Environments E2 and E3 were the second- and the third-highest yielding environments, with mean grain yields of 2933 kg/ha and 2899 kg/ha, respectively.
Table 4.
Mean grain yield (kg/ha) of fourteen field pea genotypes at seven locations across two years.
The mean grain yield of field pea genotypes across seven environments ranged from 1619 kg/ha for G14 to 3308 kg/ha for G1, with an environmental average of 2455 kg/ha (Table 4). Among the tested genotypes, the semi-leafless pea variety G1 was recorded the highest yield (5484 kg/ha) at E3 in 2021, and the average grain yield of 3308kg/ha showed a 44.1% yield advantage over the check genotypes G10 (2295 kg/ha). Generally, the semi-leafless genotypes had a higher seed yield than normal-leafed ones, as the semi-leafless trait allows for penetration of sunlight to the lower canopy and mechanical support to prevent lodging [27]. Four varieties – G2 (2866 kg/ha), G3 (2832 kg/ha), G4 (2710 kg/ha) and G5 (2723 kg/ha) – had statistically significantly higher grain yield than other genotypes and standard check variety G10, and there were no significant yield differences between them at experimental locations. The grain yield of most improved varieties was statistically higher than that of standard control varieties. The differences observed between improved varieties may be due to genetic variation. This is consistent with the results of genetic differences in grain yield between varieties reported by Bocianowski et al. [2].
Among the tested environments, the most representative and discriminating regions for grain yield of field pea were E1, E2, E3, E4 and E5. The reason of low yields in E7 location was the high altitude (2620 m) and high amount of rainfall (110 mm) in August, which caused late maturity and strong lodging of pea cultivars. Rainfall amounts and distribution were very favorable during pea growth seasons in the locations E3, E4, E5 (375.6 mm; 203.7 mm; and 164.8 mm). In reality, favorable and high-yield environments are not necessarily due to natural climate or soil factors. Optimal management at research stations, including abundant fertilization, accurate field preparation, timely sowing and harvesting, precision irrigation and effective control of weeds, pests and diseases, are also important aspects for better yield and production of pea. Such differences in yield may also imply remarkable GEI between these environments. These findings represent a comprehensive analysis of yield and stability of spring pea variety and growing environment, which may be useful for national and international pea improvement programs.
3.3. GGE-Biplot Analysis for Adaptation and Yield Stability
GGE biplot technique is one of the appropriate methods for investigating the genotype environment interaction of the multi-environment grain yield trial data [28]. Results of biplot analysis showed that the first and second principal components accounted for 77.5% and 14.5%, respectively, and in total 91.9% of grain yield variance (Figure 1). The which-won-where/what pattern is one of the most attractive features of the GGE biplot, which graphically addresses the crossover GE, mega-environment differentiation, and more specifically, adaptation [29]. It also facilitates the identification of superior genotypes and the testing environment for planting such genotypes. According to the biplot shown in Figure 1, the corner genotypes that are the most responsive ones can be visually determined. These corner genotypes were G1, G8, G13, G14 and G11. Ranking the cultivars based on the ideal genotype introduced the genotype G1 as the best genotype. The seven locations are grouped into two major groups, indicating the existence of two mega-environments for spring pea in North China. One group includes E1, E2, E3, E4, E6 and E7, with genotype G1 as the most favorable, while the other group involves E5 with genotype G8 as the most favorable. Results obtained from ranking the environments based on the ideal environment introduced the locations E1, E2, E3 and E4 as the most stable environments for grain yield. Therefore, these four locations should be considered as the most suitable environments for selecting widely cultivated pea genotypes. In fact, the performance of a good pea variety consists of mean yield and adaptation and yield stability. In present research, the observation and analysis of GEI in multi-environment yield trials is very important for the evaluation, selection and recommendation of pea cultivars.
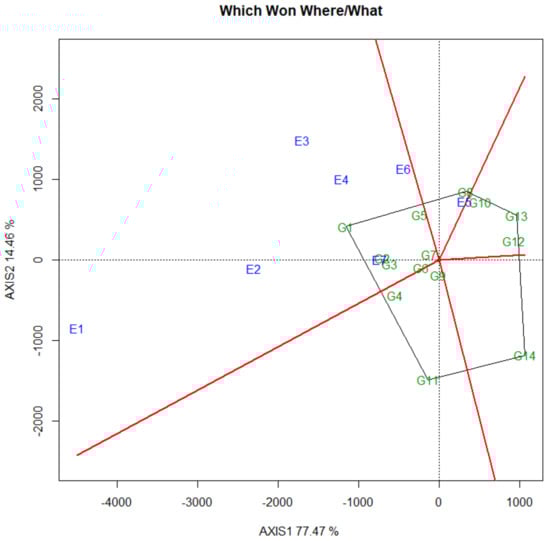
Figure 1.
Polygon views of the GGE-biplot based on symmetrical scaling for the “Which Won Where/What” pattern for 14 spring pea genotypes and seven locations from 2020 to 2021. The data were not transformed (Transform = 0), not scaled (Scaling = 0) and were environment-centered (Centering = 2). See Table 1 and Table 2 for genotypes and environments legends, respectively. Green and blue numbers stand for genotypes and environments, respectively.
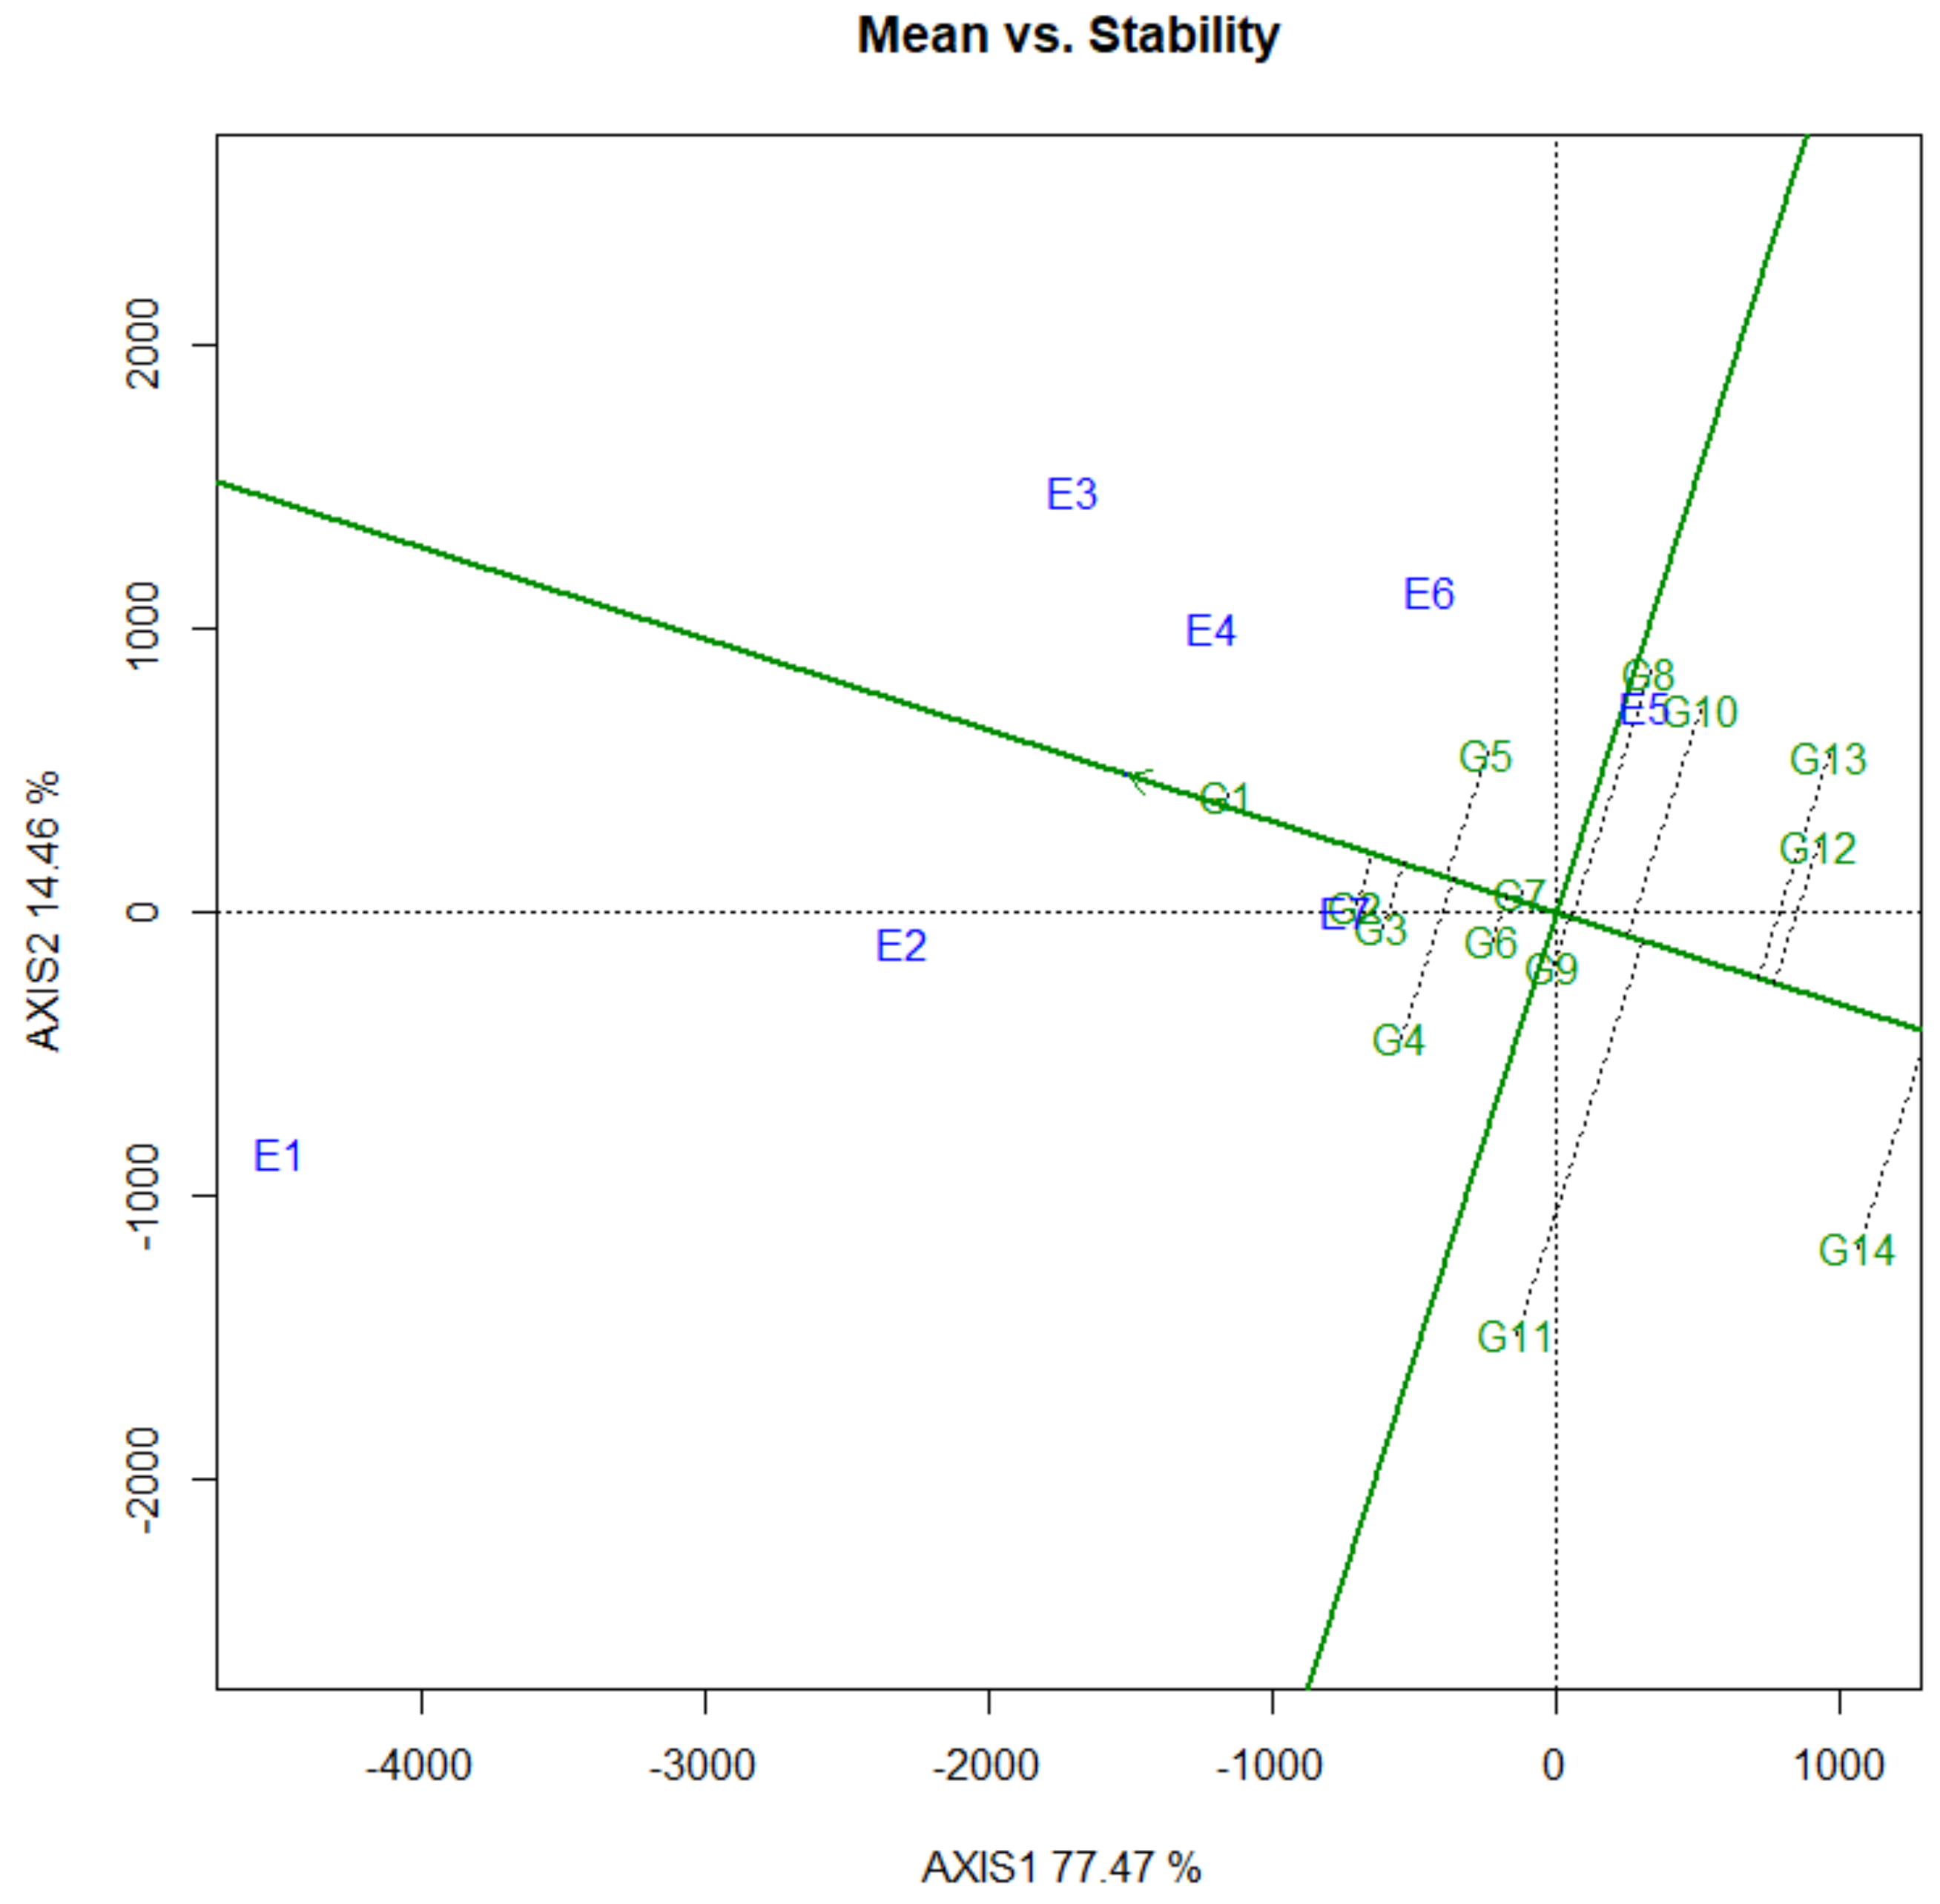
Yield is the most important and complex trait in crops. It reflects the interaction of the environment with all growth and development processes that occur throughout the life cycle [30]. Yield performances consist of mean grain yield and stability concepts [31]. Stability analysis is an important and efficient tool for plant breeders and agronomists. It helps to identify and select the most stable, high-performing genotypes that are best suitable under a given set of environmental conditions. Compared to the conventional procedures of yield stability analysis, the GGE biplot analysis integrates some features from all of them, such as a visual interpretation of the GE interaction [32]. The mean yield and stability effects of the genotypes were examined by defining an average tester coordinate (ATC) (Figure 2). Genotype G1 had the highest average yield, and G14 had the lowest. The stability of each genotype is explored by its projection onto the ATC vertical axis. Genotypes G1, G2, G3, G6, G7 and G9 were the most stable, while genotypes G11, G14 and G13 were the least stable. However, considering both mean yield and stability performance, genotypes G1 to G2, G3, G4 and G5 could be regarded as the most favorable. In the face of a changing climate, yield stability is becoming increasingly important for farmers and breeders [33]. Estimates for stability have derived from an analysis of GEI, and the significant GEI have resulted from changes in the magnitude of differences between genotypes in different environments.

Figure 2.
The “mean vs. stability” view of the GGE biplot based on a G × E yield data of fourteen pea genotypes evaluated at seven environments from 2020 to 2021. The data were not transformed (Transform = 0), not scaled (Scaling = 0), and were environment-centered (Centering = 2). The biplot was based on cultivar focused singular value partitioning (SVP = 2), and is therefore appropriate for visualizing the similarities among genotypes. See Table 1 and Table 2 for genotypes and environments legends, respectively. Green and blue numbers stand for genotypes and environments, respectively.
3.4. Performance of Main Agronomic Traits and Correlation Analysis
Crop yield is directly and multiply determined by yield-component traits or agronomic traits [34]. To analyze the performance of yield and agronomic traits in pea is useful for selecting excellent varieties. Mean performances of main agronomic traits of 14 spring pea varieties were represented in Table 5. There were significant differences in agronomic traits of different pea varieties. Based on the result, DM varied from 79 d to 93 d, with a mean of 85 d. The longest DM was recorded for G2 and G3 (91.4 d), while the earliest varieties to mature were G8 (80.6 d) and G10 (80.7 d). However, the best semi-leafless pea variety G1 was 6.1 days later than dwarf variety G10. PH is an important agronomic character of pea varieties. The PH ranged from 37 cm to 110 cm, with a mean of 67.5 cm. SPP from 8.4 to 49.0 with a mean of 24.4, BP from 1.0 to 1.6 with a mean of 1.3, HSW from 19.5 g to 24.8 g with a mean of 22.3 g and GWP from 1.8 g to 9.5 g with a mean of 5.2 g. The combined analysis of variance for seven agronomic characters showed that there was significant difference in DM, PH, SPP, SPD, BP, HSW, GWP and GYP across locations, indicating that the environment and genotypes factors were mainly attributed to the variation. The difference of grain yield and seven agronomic traits might have come from genetic variation among the tested varieties. These findings are in agreement with other reports [35]. Compared to check genotype G10 and other genotypes, G1 was an ideal genotype with high grain yield and excellent agronomic traits (Figure 3).
Table 5.
Performance of main agronomic traits of fourteen pea genotypes over seven locations across two years.
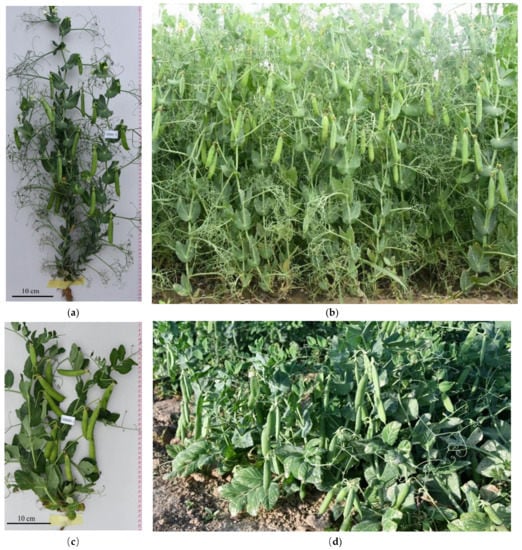
Figure 3.
The characteristic of individual plant and population of pea variety ((a,b) for G1 and (c,d) for G10) in the field at E1 location in 2021. G1 = Semi-leafless pea variety Longwan 10; G10 = Check variety Zhongwan 6.
To determine association between grain yield and agronomic traits, we calculated the coefficient of correlation. Estimate the simple correlation coefficient among eight main agronomic traits of fourteen pea genotypes are presented in Table 6. In present research, at phenotypic level, a significantly positive association of GYP observed with SPP (r = 0.981) and GWP (r = 0.956). Significantly positive correlations were also observed between SPP and GWP (r = 0.932), DM and PH (r = 0.864). The non-significant but positive correlation of GYP was recorded with DM (r = 0.128), PH (r = 0.177), BP (r = 0.01) and HSW (r = 0.009). These findings are similar to the results of other researchers [36]. Thus, these characters emerged as the most vital component traits, and are associated positively with grain yield. The value of genotypic and phenotypic variation suggests that there is good scope for yield improvement through selection for SPP, GWP, DM and PH. However, a significant negative correlation was found between PH and HSW (r = −0.301), which are similar to other reports [36].
Table 6.
Estimates of simple correlation coefficients among eight traits in field pea genotypes.
4. Conclusions
We evaluated the stability and yield potential of pea genotypes based on combined ANOVA and GGE biplot analysis. GEI has a key effect on crop variety development by complicating the release of varieties across challenging environments. Analysis of variance for every location and combined over seven locations showed significant differences among genotypes, environments and GEI for grain yield, as well as most of the yield-related traits of spring pea. The significant GEI effects indicated the inconsistent performance of genotypes across the tested environments. Different genotypes have had different genetic potentials. Among the tested genotypes, G1, G2, G3, G4, G5, G6, G7 and G8 had mean grain yield above the overall mean grain yield of genotypes. Overall, the semi-leafless pea variety G1 was the best genotype, with an average grain yield of 3308 kg/ha, followed by G2 (2866 kg/ha), G3 (2832 kg/ha), G4 (2710 kg/ha) and G5 (2723 kg/ha), which were significantly higher than other genotypes and standard check variety G10. It is suggested that G1 should be used as the standard check genotype for dry field pea breeding in the future. The most representative and productivity environments were identified for spring pea-producing areas in North China, including E1, E2, E3, E4 and E5, with G1 as the highest average yield and most suitable genotype. It was worthwhile to mention that the G1 variety had the highest grain yield under the E1 location. Therefore, it is recommended to use elite genotype G1 for the wider cultivation in North China and similar areas. These findings represent a comprehensive analysis of yield and stability of spring pea variety and growing locations, which may be useful for national and international pea improvement programs.
Author Contributions
Experiment design, Y.H.; investigation, Y.H., X.Z., G.M., R.L., Z.L., C.X., L.L., B.X. and L.Z.; statistical analysis, J.Y. and Z.G.; and data curation and original draft preparation, X.Y. All authors have read and agreed to the published version of the manuscript.
Funding
This work was supported by China Agriculture Research System of MOF and MARA-Food Legumes (CARS-08).
Institutional Review Board Statement
Not applicable.
Informed Consent Statement
Not applicable.
Data Availability Statement
The datasets used and/or analyzed during the current study are available from the corresponding author upon reasonable request.
Conflicts of Interest
The authors declare no conflict of interest.
References
- Pandey, A.K.; Rubiales, D.; Wang, Y.; Fang, P.; Sun, T.; Liu, N.; Xu, P. Omics resources and omics-enabled approaches for achieving high productivity and improved quality in pea (Pisum sativum L.). Theor. Appl. Genet. 2021, 134, 755–776. [Google Scholar] [CrossRef] [PubMed]
- Bocianowski, J.; Księżak, J.; Nowosad, K. Genotype by environment interaction for seeds yield in pea (Pisum sativum L.) using additive main effects and multiplicative interaction model. Euphytica 2019, 215, 191. [Google Scholar] [CrossRef] [Green Version]
- Pellicanò, A.; Romeo, M.; Pristeri, A.; Preiti, G.; Monti, M. Cereal-pea intercrops to improve sustainability in bioethanol production. Agron. Sustain. Dev. 2015, 35, 827–835. [Google Scholar] [CrossRef]
- Dahl, W.J.; Foster, L.M.; Tyler, R.T. Review of the health benefits of peas (Pisum sativum L.). Brit. J. Nutr. 2012, 108, S3–S10. [Google Scholar] [CrossRef] [PubMed] [Green Version]
- Li, L.; Yang, T.; Liu, R.; Redden, B.; Maalouf, F.; Zong, X. Food legume production in China. Crop J. 2017, 5, 115–126. [Google Scholar] [CrossRef] [Green Version]
- Yang, X.; Gou, Z.; Zhu, Z.; Wang, C.; Zhang, L.; Min, G. Breeding and Evaluation of a New-Bred Semi-Leafless Pea (Pisum sativum L.) Cultivar Longwan No. 6. Agronomy 2022, 12, 850. [Google Scholar] [CrossRef]
- Food and Agriculture Organization of the United Nations. FAOSTAT. Value of Agricultural Production, Food and Agricultural Organization Statistical Database.Statistics Division. Available online: https://www.fao.org/faostat/en/#data/QV (accessed on 1 May 2022).
- Fan, X.; Kang, M.S.; Chen, H.; Zhang, Y.; Tan, J.; Xu, C. Yield Stability of Maize Hybrids Evaluated in Multi-Environment Trials in Yunnan, China. Agron. J. 2007, 99, 220. [Google Scholar] [CrossRef]
- Signor, C.E.; Dousse, S.; Lorgeou, J.; Denis, J.B.; Bonhomme, R.; Carolo, P.; Charcosset, A. Interpretation of Genotype × Environment Interactions for Early Maize Hybrids over 12 Years. Crop Sci. 2001, 41, 663–669. [Google Scholar] [CrossRef]
- Price, J.S.; Bever, J.D.; Clay, K. Genotype, environment, and genotype by environment interactions determine quantitative resistance to leaf rust (Coleosporium asterum) in Euthamia graminifolia (Asteraceae). New Phytol. 2004, 162, 729–743. [Google Scholar] [CrossRef]
- Egea-Gilabert, C.; Pagnotta, M.A.; Tripodi, P. Genotype × Environment Interactions in Crop Breeding. Agronomy 2021, 11, 1644. [Google Scholar] [CrossRef]
- Alizadeh, K.; Mohammadi, R.; Shariati, A.; Eskandari, M. Comparative analysis of statistical models for evaluating genotype × environment interaction in rainfed safflower. Agric. Res. 2017, 6, 455–465. [Google Scholar] [CrossRef]
- Gauch, H.G.; Piepho, H.; Annicchiarico, P. Statistical Analysis of Yield Trials by AMMI and GGE: Further Considerations. Crop Sci. 2008, 48, 866. [Google Scholar] [CrossRef]
- Omoigui, L.O.; Kamara, A.Y.; Ajeigbe, H.A.; Akinwale, R.O.; Timko, M.P.; Oyekunle, M.; Bello, L.L. Performance of cowpea varieties under Striga gesnerioides (Willd.) Vatke infestation using biplot analysis. Euphytica 2017, 213, 244. [Google Scholar] [CrossRef] [Green Version]
- Rubiales, D.; Emeran, A.A.; Flores, F. Adaptation of Grass Pea (Lathyrus sativus) to Mediterranean Environments. Agronomy 2020, 10, 1295. [Google Scholar] [CrossRef]
- Papastylianou, P.; Vlachostergios, D.N.; Dordas, C.; Tigka, E.; Papakaloudis, P.; Kargiotidou, A.; Pratsinakis, E.; Koskosidis, A.; Pankou, C.; Kousta, A.; et al. Genotype X Environment Interaction Analysis of Faba Bean (Vicia faba L.) for Biomass and Seed Yield across Different Environments. Sustainability 2021, 13, 2586. [Google Scholar] [CrossRef]
- Pande, S.; Sharma, M.; Gaur, P.M.; Basandrai, A.K.; Kaur, L.; Hooda, K.S.; Basandrai, D.; Kiran Babu, T.; Jain, S.K.; Rathore, A. Biplot analysis of genotype × environment interactions and identification of stable sources of resistance to Ascochyta blight in chickpea (Cicer arietinum L.). Australas. Plant Path. 2013, 42, 561–571. [Google Scholar] [CrossRef]
- Iqbal, J.; Shabbir, G.; Shah, K.N.; ul-Hassan, F.; Qayyum, A. Deciphering of Genotype × Environment Interaction to Identify Stable Heat-Tolerant Mung Bean Genotypes by GGE Biplot Analysis. J. Soil Sci. Plant Nut. 2021, 21, 2551–2561. [Google Scholar] [CrossRef]
- Samyuktha, S.M.; Malarvizhi, D.; Karthikeyan, A.; Dhasarathan, M.; Hemavathy, A.T.; Vanniarajan, C.; Sheela, V.; Hepziba, S.J.; Pandiyan, M.; Senthil, N. Delineation of Genotype × Environment Interaction for Identification of Stable Genotypes to Grain Yield in Mungbean. Front. Agron. 2020, 2, 577911. [Google Scholar] [CrossRef]
- Sozen, O.; Karadavut, U.; Ozcelik, H.; Bozoglu, H.; Akcura, M. Genotype x environment interaction of some dry bean (Phaseolus vulgaris L.) genotypes. Legume Res. 2017, 41, 189–195. [Google Scholar] [CrossRef] [Green Version]
- Aznar-Fernández, T.; Carrillo-Perdomo, E.; Flores, F.; Rubiales, D. Identification and multi-environment validation of resistance to pea weevil (Bruchus pisorum) in Pisum germplasm. J. Pest Sci. 2018, 91, 505–514. [Google Scholar] [CrossRef]
- Acikgoz, E.; Ustun, A.; Gul, I.; Anlarsal, E.; Tekeli, A.S.; Nizam, I.; Avcioglu, R.; Geren, H.; Cakmakci, S.; Aydinoglu, B.; et al. Genotype x environment interaction and stability analysis for dry matter and seed yield in field pea (Pisum sativum L.). Span. J. Agric. Res. 2009, 7, 96–106. [Google Scholar] [CrossRef] [Green Version]
- Karimizadeh, R.; Mohammadi, M.; Sabaghni, N.; Mahmoodi, A.; Roustami, B.; Sayyedi, F.; Akbari, F. GGE Biplot analysis of yield stability in multi-environment trials of lentil genotypes under rainfed condition. Not. Sci. Biol. 2013, 5, 256. [Google Scholar] [CrossRef] [Green Version]
- Annicchiarico, P.; Iannucci, A. Adaptation strategy, germplasm type and adaptive traits for field pea improvement in Italy based on variety responses across climatically contrasting environments. Field Crop. Res. 2008, 108, 133–142. [Google Scholar] [CrossRef]
- Parihar, A.K.; Hazra, K.K.; Lamichaney, A.; Dixit, G.P.; Singh, D.; Singh, A.K.; Singh, N.P. Characterizing plant trait(s) for improved heat tolerance in field pea (Pisum sativum L.) under subtropical climate. Int. J. Biometeorol. 2022, 66, 1267–1281. [Google Scholar] [CrossRef] [PubMed]
- Dehghani, H.; Ebadi, A.; Yousefi, A. Biplot Analysis of Genotype by Environment Interaction for Barley Yield in Iran. Agron. J. 2006, 98, 388–393. [Google Scholar] [CrossRef]
- Tran, C.T.; Becker, H.C.; Horneburg, B. Agronomic performance of normal-leafed and semi-leafless pea (Pisum sativum L.) genotypes. Crop Sci. 2022, 1–13. [Google Scholar] [CrossRef]
- Olanrewaju, O.S.; Oyatomi, O.; Babalola, O.O.; Abberton, M. GGE Biplot Analysis of Genotype × Environment Interaction and Yield Stability in Bambara Groundnut. Agronomy 2021, 11, 1839. [Google Scholar] [CrossRef]
- Rakshit, S.; Ganapathy, K.N.; Gomashe, S.S.; Rathore, A.; Ghorade, R.B.; Kumar, M.V.N.; Ganesmurthy, K.; Jain, S.K.; Kamtar, M.Y.; Sachan, J.S.; et al. GGE biplot analysis to evaluate genotype, environment and their interactions in sorghum multi-location data. Euphytica 2012, 185, 465–479. [Google Scholar] [CrossRef]
- Quarrie, S. Dissecting a wheat QTL for yield present in a range of environments: From the QTL to candidate genes. J. Exp. Bot. 2006, 57, 2627–2637. [Google Scholar] [CrossRef] [Green Version]
- Yan, W.; Hunt, L.A.; Sheng, Q.; Szlavnics, Z. Cultivar Evaluation and Mega-Environment Investigation Based on the GGE Biplot. Crop Sci. 2000, 40, 597–605. [Google Scholar] [CrossRef]
- Khan, M.M.H.; Rafii, M.Y.; Ramlee, S.I.; Jusoh, M.; Al Mamun, M. AMMI and GGE biplot analysis for yield performance and stability assessment of selected Bambara groundnut (Vigna subterranea L. Verdc.) genotypes under the multi-environmental trails (METs). Sci. Rep. 2021, 11, 22791. [Google Scholar] [CrossRef]
- Reckling, M.; Ahrends, H.; Chen, T.; Eugster, W.; Hadasch, S.; Knapp, S.; Laidig, F.; Linstädter, A.; Macholdt, J.; Piepho, H.; et al. Methods of yield stability analysis in long-term field experiments. A review. Agron. Sustain. Dev. 2021, 41, 27. [Google Scholar] [CrossRef]
- Shi, J.; Li, R.; Qiu, D.; Jiang, C.; Long, Y.; Morgan, C.; Bancroft, I.; Zhao, J.; Meng, J. Unraveling the complex trait of crop yield with quantitative trait loci mapping in brassica napus. Genetics 2009, 182, 851–861. [Google Scholar] [CrossRef] [Green Version]
- Mogiso, M. Adaptation and Performance on Yield and Yield Components of Field Pea (Pisum sativum L.) Varieties at Adiyo District, Southwestern Ethiopia. J. Biol. Agric. Healthc. 2017, 7, 42–46. [Google Scholar]
- Singh, S.K.; Singh, V.P.; Srivastava, S.; Singh, A.K.; Chaubey, B.K.; Srivastava, R.K. Estimation of correlation coefficient among yield and attributing traits of field pea (Pisum sativum L.). Legume Res. 2018, 41, 20–26. [Google Scholar] [CrossRef] [Green Version]


Publisher’s Note: MDPI stays neutral with regard to jurisdictional claims in published maps and institutional affiliations. |
© 2022 by the authors. Licensee MDPI, Basel, Switzerland. This article is an open access article distributed under the terms and conditions of the Creative Commons Attribution (CC BY) license (https://creativecommons.org/licenses/by/4.0/).