Abstract
Agricultural production in oases requires extensive irrigation and nitrogen (N) inputs, which result in a high incidence of non-point-source pollution. Information on how soil texture affects crop productivity and water and N use efficiency is needed to improve N management in oases. A two-year field study with six free-draining leaching pits was set up to quantify soil water content (SWC), drainage, yield, N uptake, soil residual N, N leaching, water-use efficiency (WUE), and N fertilizer-use efficiency (NFUE) on sandy-textured soils in a young oasis field (24 years, YOF) and loam-textured soils in an old oasis field (>60 years; OOF) within an intensive oasis agricultural zone in Northwest China. The results showed that sand content in the YOF was significantly higher than that in the OOF (p < 0.01), while both clay and silt contents in the YOF were significantly lower than those in the OOF (p < 0.01). Soil water storage (SW) in the 0–100 cm soil layer, evapotranspiration water-use efficiency (WUEET) and irrigation water-use efficiency (WUEIrrig) in the OOF were, respectively, 87.1, 23.5, and 24.1% higher than those in the YOF (p < 0.05), and deep drainage in the YOF was 6.2 times higher than that in the OOF (p < 0.01). Maize N uptake and soil N accumulation in the OOF in the 0–100 cm soil layer were, respectively, 33.4 and 10.3% higher than those in the YOF (p < 0.05), and N leaching loss in the YOF was 1.65 times higher than that in the OOF (p > 0.01). Crop yield and NFUE in the OOF were, respectively, 23.9 and 27.2% higher than those in the YOF (p < 0.05). These results indicated that sandy-textured soils with high sand content were not conducive to water and N retention, resulting in lower crop yields and water- and fertilizer-use efficiency in YOF. Therefore, it is imperative that management practices in sandy-textured land promote improvements in soil structure and maintain the long-term productivity of the young cultivated fields.
1. Introduction
China ranks first in the world in intensive agriculture, which requires substantial amounts of synthetic fertilizer to meet the demands for crop growth and yield, and this results in agricultural non-point-source pollution [1,2]. Nitrogen (N) is an essential nutrient for crop yield, and over half of the world’s population is nourished by crops grown with N fertilizers [3]. However, only about 42–47% of N added to croplands is converted to crop growth, while the rest remains in soil, often leaching into groundwater following heavy rains or irrigation [4,5,6].
Nitrate (NO3−-N) concentrations increased sharply in groundwater after the 1980s in China, and 80.2% of the monitoring wells in the country contained >30 mg·L−1 of NO3−-N in 2016, with stable isotope analyses showing that the main source was agricultural N applications [7]. NO3−-N leaching in agricultural ecosystems has become a universal challenge worldwide [8,9,10], and is also the main cause for the deterioration of groundwater quality in China.
Soil texture greatly affects soil aeration, water-holding capacity, soil fertility, and crop yield, and plays an important role in regulating N leaching [11,12]. Silt, clay, or silty clays reduce the number of soil macropores, increase water retention times, and can ensure sufficient available water and N supply for crop growth [5]; sand or sandy loams with strong saturated hydraulic conductivity and weak water holding capacity are conducive to the leaching of water and N [13,14]. Maize productivity and N-uptake efficiency in clay textures were more responsive to N fertilizer than other soil textures [15]. Therefore, soil texture was key to crop yield and the utilization efficiency of water and N fertilizer [12]. However, to date, there has been a lack of quantitative research on the impacts of soil textures on land productivity and agricultural non-point-source pollution. An increased understanding of the impacts of soil textures on water- and N-use efficiency and crop productivity is critical to efforts to improve crop N-use efficiency to achieve control of agricultural non-point-source pollution.
The Zhangye irrigation district located in the Heihe River Basin is one of the regions with the highest yield of a highest yields of crops in China. Irrigated cropland in this region covers an area of 2896 km2, of which nearly half are oasis fields cultivated in the desert for the past 50 years [16,17]. The climate conditions of scarce rainfall and strong evaporation necessitate irrigation, and agriculture in the area requires 19.8 × 10⁸ m3 of irrigation water annually [18]. Approximately 75% of agricultural land is cultivated with maize using flood irrigation, with an irrigation depth of 600–1200 mm depending on soil conditions [17]. In this region, the average N fertilizer application rate is 350 kg·hm−2; however, N-use efficiency is only 35–49% [16]. These fertilization rates inevitably increase the possibility of NO3−-N leaching, non-point-source pollution, and a decrease in land productivity.
Previous studies have focused on ways to reduce N loss by regulating hydrological processes with crop mulching [19], addition of biochar and organic fertilization [16,20], intercropping [21], and the optimization of irrigation schedule and fertilizer applications [14,22]. However, the implementation of those measures is limited in Zhangye irrigation district. Cultivation in the oasis leads to high spatial heterogeneity in soil texture because (1) long-term irrigation with silt-laden river water increases soil silt and clay contents [5], and it is the increase in clay content that dramatically enhances the development of soil aggregates and improves soil structure; and (2) inputs of manure, chemical fertilizers, and crop residues increases organic matter and nutrient content due to cultivation, which may in turn promote adsorption of clay particles and improve soil aeration and water- and fertilizer-holding capacity to some extent [5].
We conducted a two-year field experiment to determine the effects of soil texture on crop productivity, water- and N-use efficiency, and hydrological N losses from an intensive spring maize system in a desert-oasis ecotone of China. The specific objectives of this study were: (1) to determine how soil texture affects water and N retention; (2) to define the impacts of soil texture on leaching and accumulation of NO3−-N; and (3) to establish how and to what extent soil texture affects maize productivity.
2. Materials and Methods
2.1. Study Area
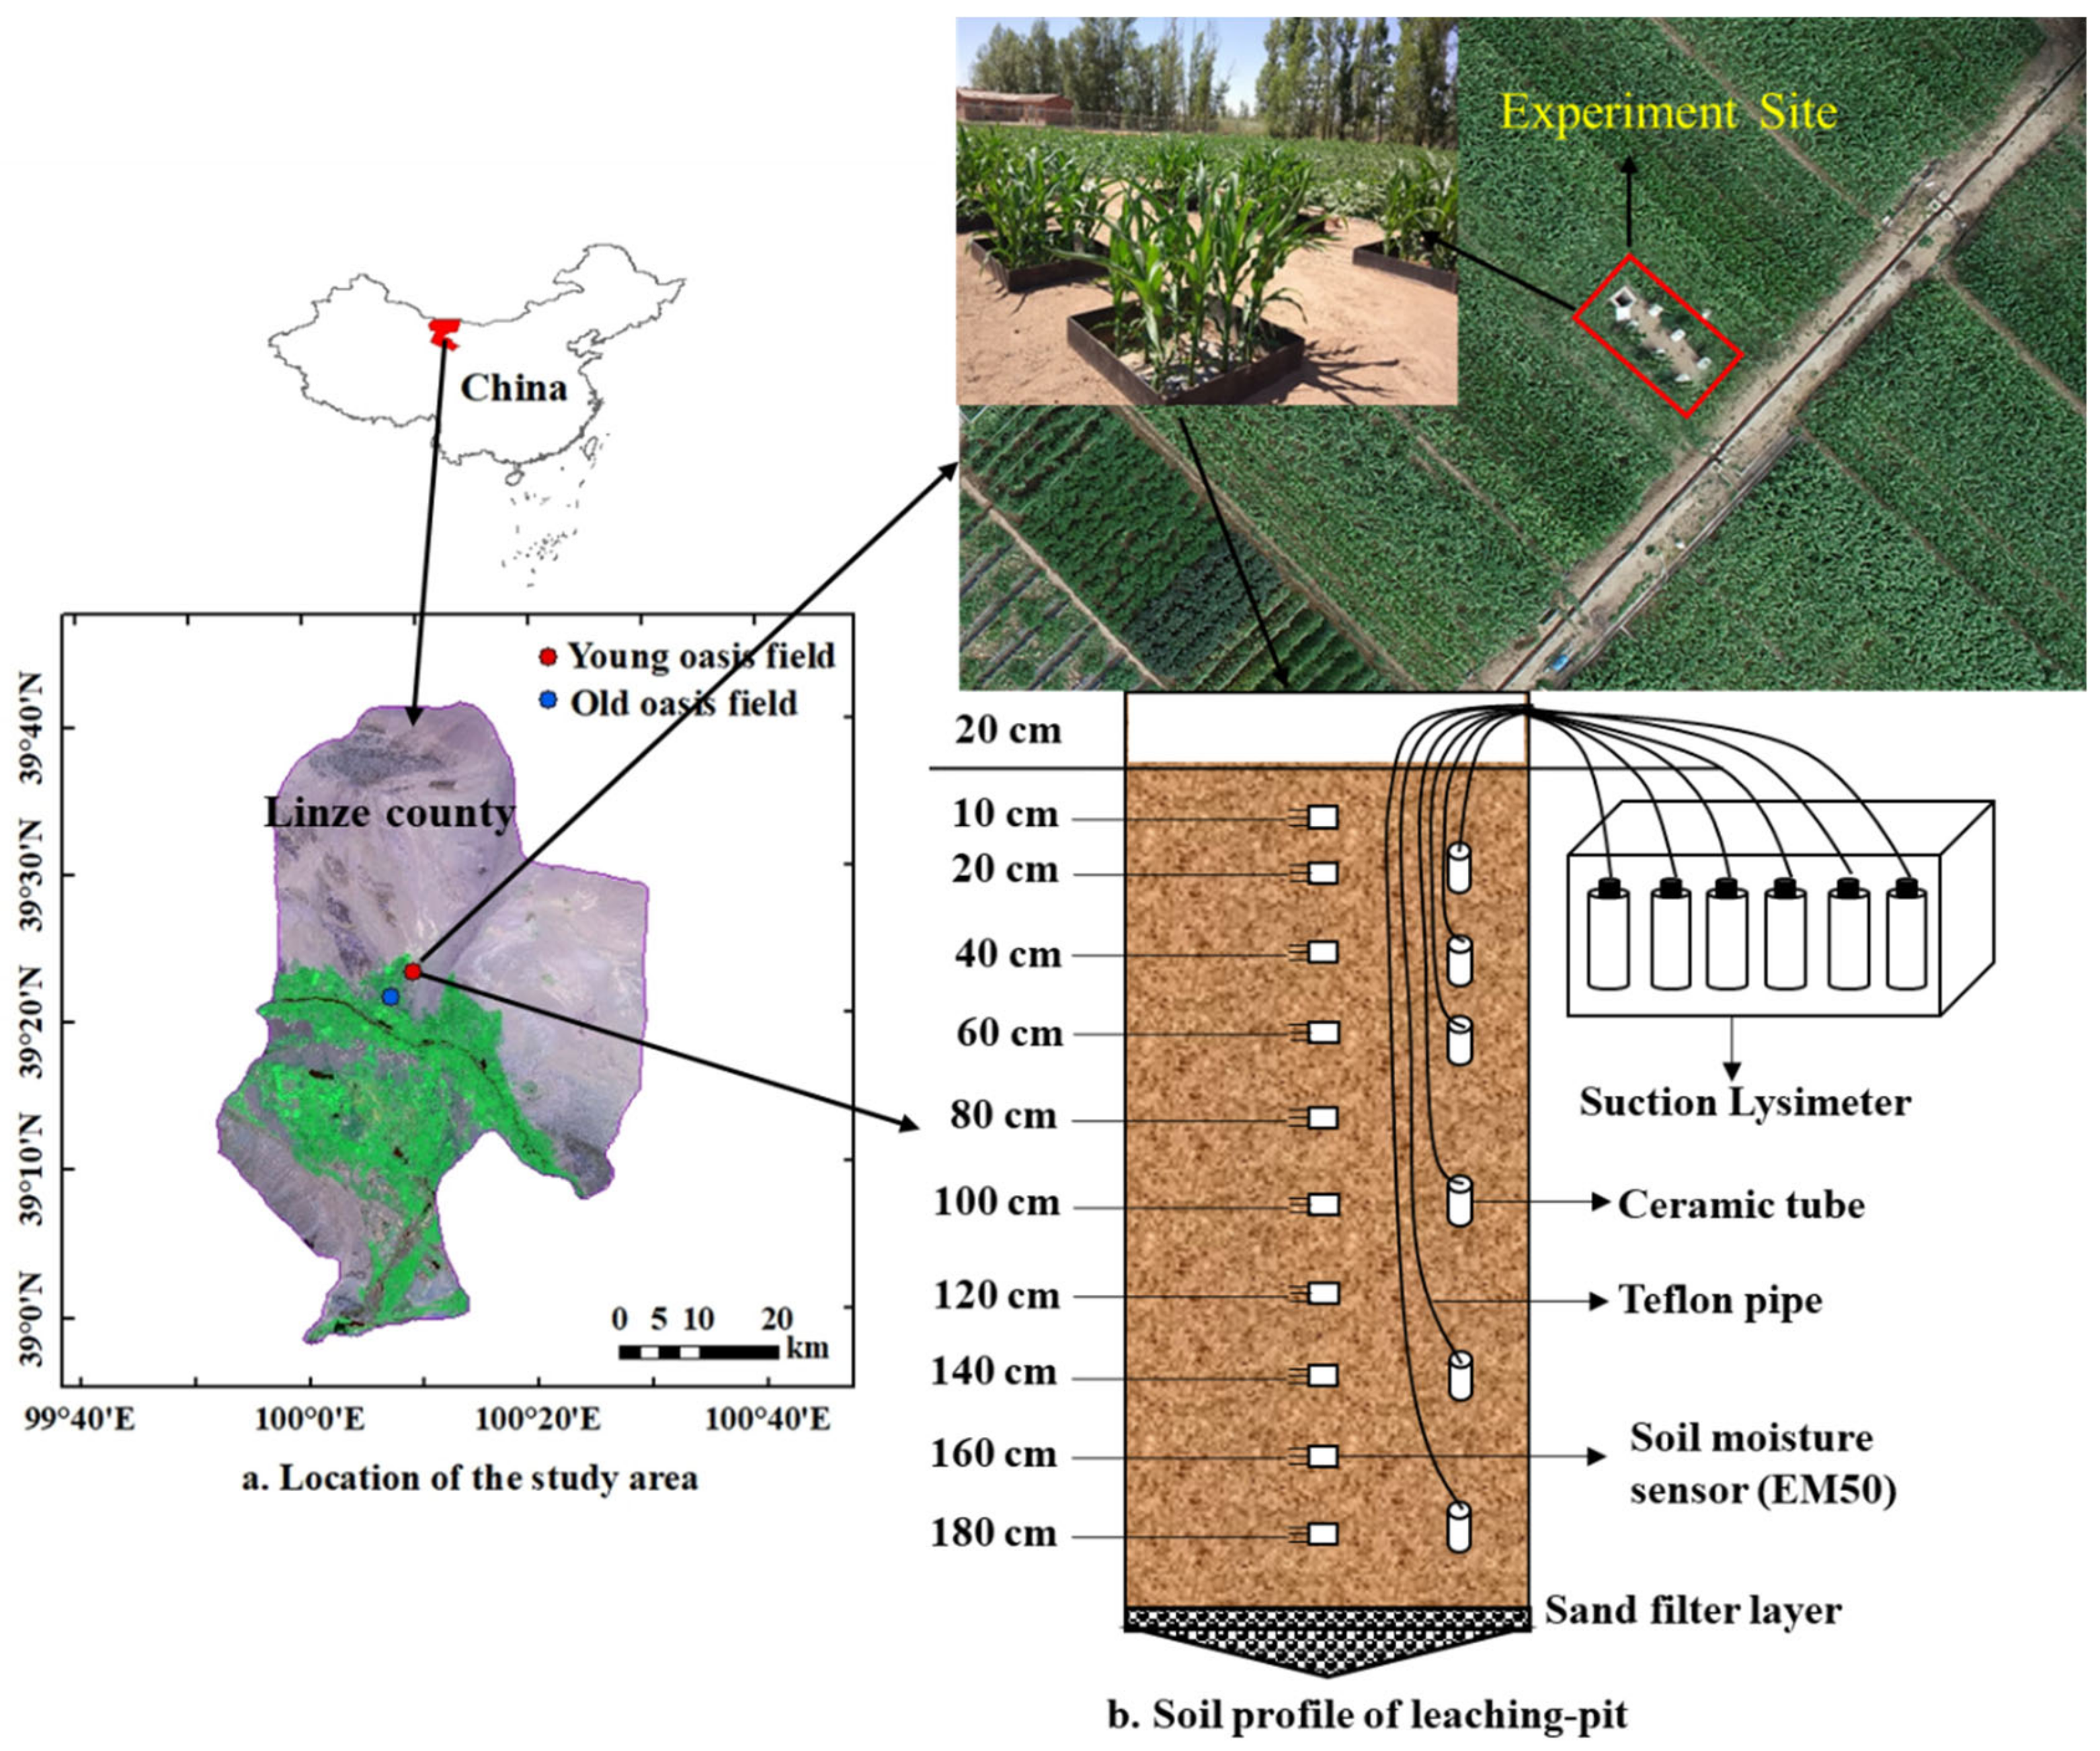
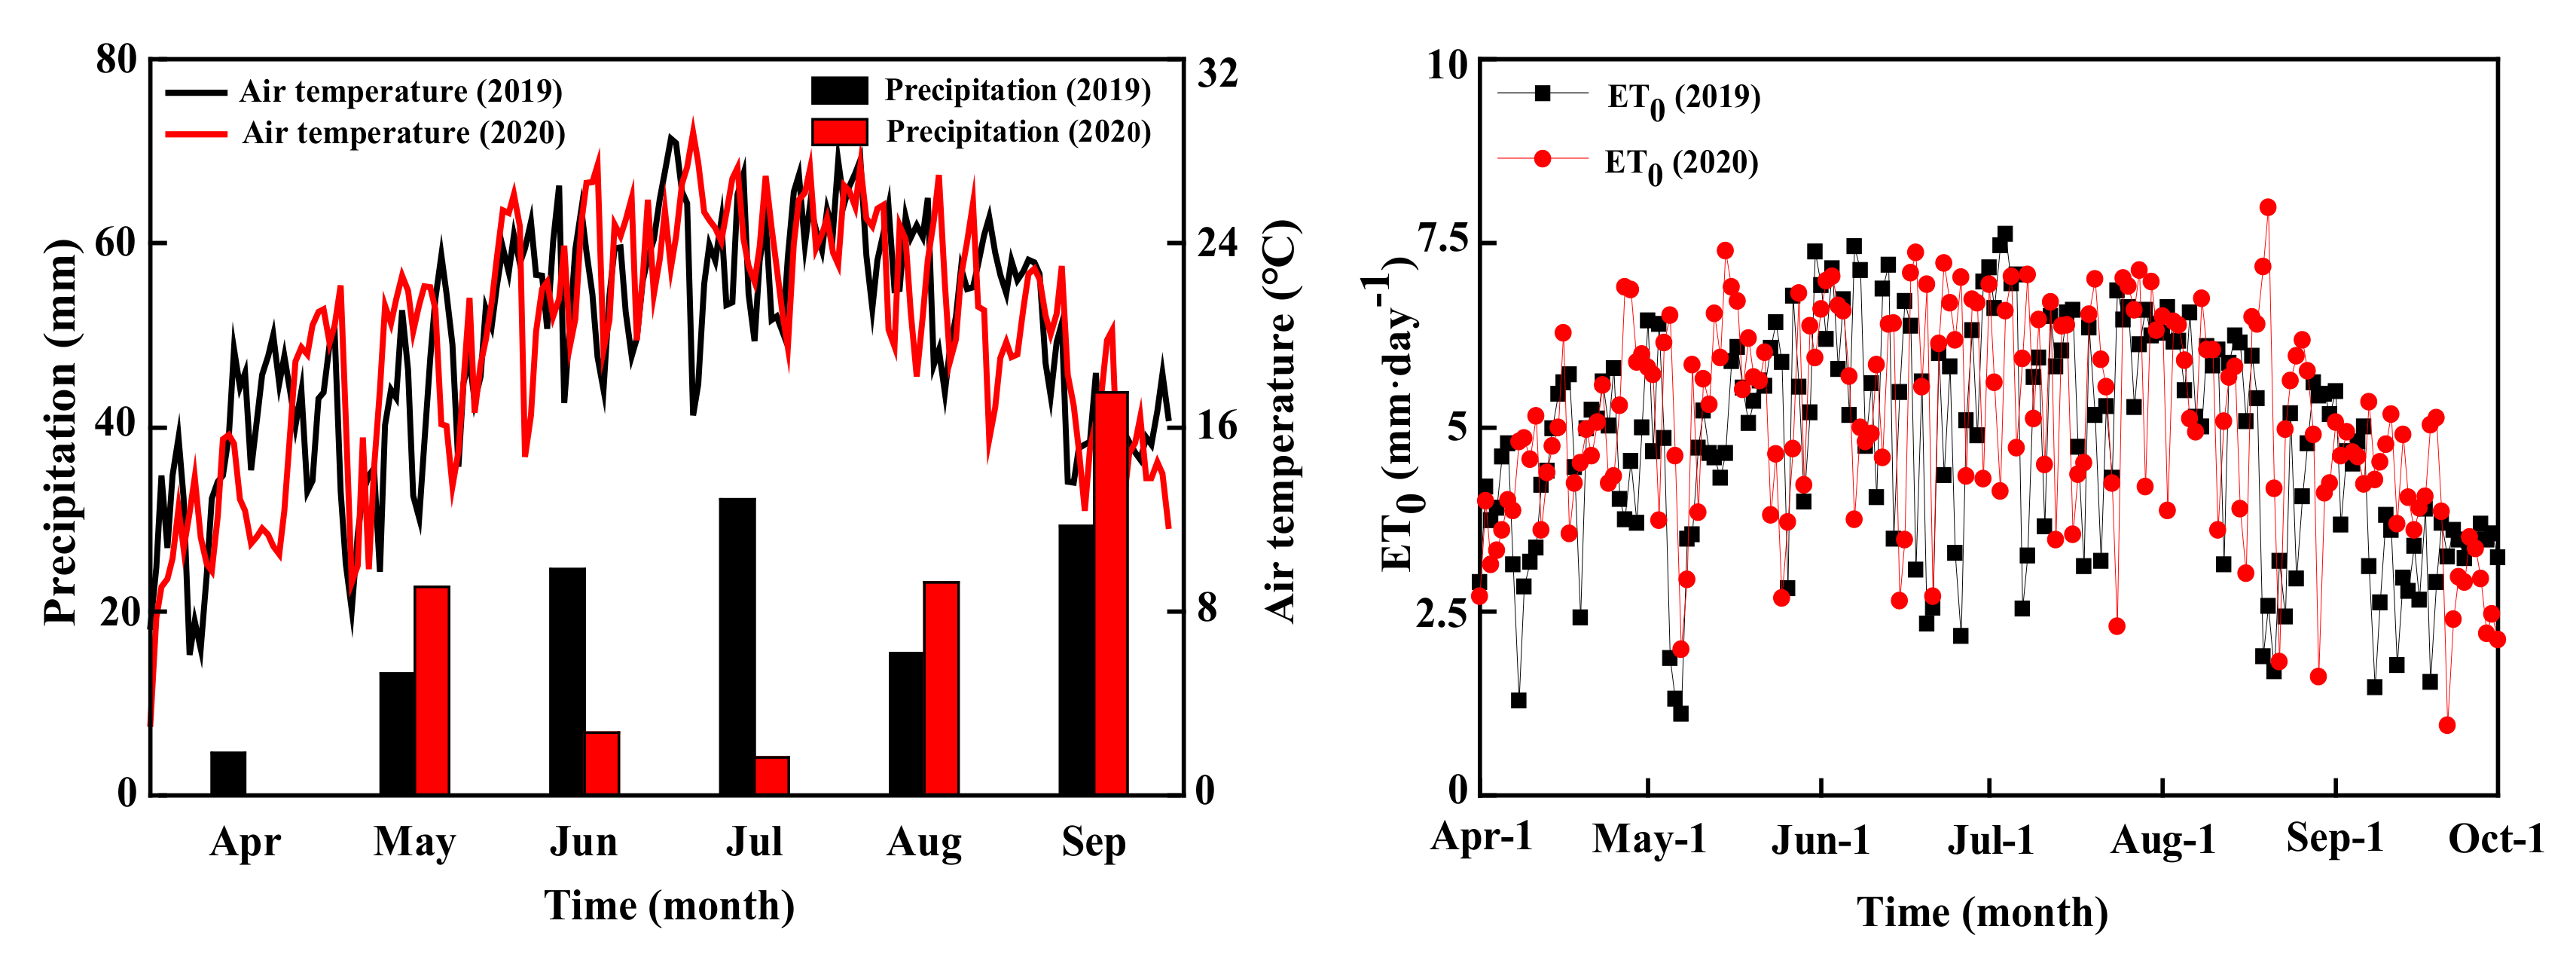
A controlled field experiment was conducted at Linze Inland River Basin Research Station, Chinese Ecosystem Research Network (100°07′ E, 39°24′ N; elevation,1383 m), located in the middle reaches of the Heihe River Basin in Gansu Province, China (Figure 1a). Climate conditions in the study area are temperate, arid, and continental, with an annual precipitation of 112 mm, annual potential pan evaporation of 2400 mm, annual temperature of 7.6 °C, and annual total sunshine duration of 3051 h [22]. The depth of the water table is relatively high, and varies from 2.5 to 4.5 m due to fluctuations in the water level of the Heihe River [22]. Peripheral desert, desert-oasis ecotone, and central oasis constitute the main landscape types in this region. The sandy lands in the peripheral of oasis have been gradually cultivated for agricultural use since the 1960s; hence, the age of cultivation of irrigated fields range from 1 year to more than 60 years old [5]. The croplands and the adjacent sandy land have the same soil parent material, and there was no obvious difference in soil particle size composition and organic matter content at the initial stage of cultivation for croplands in different periods in this region [23]. The recorded meteorological information of maize growth period is shown in Figure 2. The potential evapotranspiration (ET0) was calculated through the FAO56 Penman–Monteith equation [24].

Figure 1.
Location of the study area (a), and experiment sites with the soil profile of the leaching pit (b).
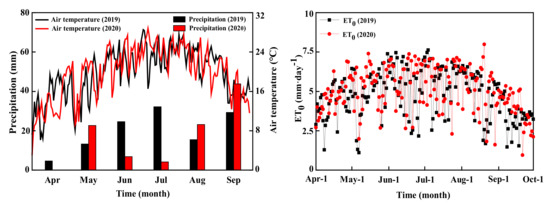
Figure 2.
Monthly precipitation amounts and daily air temperature (Left), and evapotranspiration (ET0) (Right) in the experimental area during a maize growth period.
2.2. Experimental Design and Field Management
Two irrigated fields were selected for this study. One was at the edge of the desert with a cultivation period of 24 years, considered a “young oasis field” (YOF); the other was in the central oasis, with the cultivation history of more than 60 years, designated an “old oasis field” (OOF) (Figure 1a). The soil type in the YOF was Ari psamment, and in the OOF it was irrigation-farmed fluvent. An experimental site, approximately 48 m2 (6 m (width) × 8 m (length)), was established in a field where spring maize has been maintained for almost ten years. Test plots were demarcated by 1 m alleys, and contained 6 sub-plots 1 × 1 m with two treatments (the YOF and OOF), and three replicates for each treatment (Figure 1b). Soils at the two fields were sampled in triplicate from the 0–200 cm soil profile with intervals of 20 cm to analyze soil properties. Soil texture and soil properties were determined using the methods of Zhang et.al [5]. Detailed soil properties for the 0–200 cm soil profile is summarized in Table 1.

Table 1.
Soil physical and chemical properties in a young oasis field (YOF) and old oasis field (OOF). Averages are based on three replicates.
The maize (Zea mays L.) cultivar used in this study was ‘Zhengdan 958’, which was widely planted in the area, and it was planted using a typical practice of sowing in late April and harvesting in late September. The planting pattern for maize included mulching with a polypropylene film before planting, and seed spacing of 20 cm, row spacing of 60 cm, planting depth of 5–10 cm, and planting density of 80,000 plants·hm−2.
To determine NO3−-N leaching from the two irrigated croplands, the irrigation amount and irrigation time were kept uniform, and traditional flood irrigation was carried out based on soil-moisture and crop-growth conditions. Irrigation and fertilization management measures were the same as those commonly used by local farmers. Fields were irrigated a total of 8–9 times during maize growing season, with irrigation depth of 90 mm each time. A flow meter was used to apply the same amount of water to each plot. Fertilizers were applied at rates of 330, 116, and 40 kg·ha−1, respectively, for NPK. Fertilizers were uncoated urea, diammonium phosphate (DPA), and compound fertilizer. N fertilizer was applied in three parts (⅓ at jointing, ⅓ at tasseling, and ⅓ at milking stages), and phosphorus and potassium were applied at the time of tasseling and milking. All fertilizer applications were performed by broadcasting evenly in the rows, followed by irrigation. The detailed schedule of irrigation and fertilizer applications are shown in Table 2.
Table 2.
Irrigation and fertilization information.
2.3. The Leaching Pit
In July 2015, 6 free-draining leaching pits were installed in clusters of two at the test plot. To avoid the effects of oasis or fringe, the leaching pit was directly implemented into the test plots. The height of the leaching pit was 220 cm, and the length and width were both 100 cm, and soil (200 cm deep) was backfilled into the leaching pit with original soil bulk density. Ten soil moisture sensors (Em50, Decagon, Pullman, WA, USA) and 6 sampling devices (a suction lysimeter designed by Institute of Geographic Sciences and Natural Resources Research, which was composed of a Teflon pipe and porous ceramic tube) were installed in each leaching pit. Soil moisture sensors were installed at 10, 20, 40, 60, 80, 100, 120, 140, 160, and 180 cm depths for monitoring the soil water content, and the measurement duration was set to 30 min each time. Ceramic tubes were installed at 20, 40, 60, 100, 140, and 180 cm depths for collection of leachates. With the occurrence of flood irrigation, the soil water content increased, and leachate entered the ceramic tube and was sucked out with a vacuum pump. After irrigation, a vacuum pump at about −0.8 MPa was applied to the suction lysimeter for 12 h of equilibrium to collect soil water. To facilitate drainage and prevent clogging, the bottom of each leaching pit was designed as an inverted cone and packed with 20 cm gravel and coarse sand (Figure 1b). After irrigation, the leakage was weighed, and 250 mL of the leakage was collected with a polyethylene bottle. The water samples were collected and stored in a −20 ℃ refrigerator until the NO3−-N concentration was analyzed. The collection time, leakage amount, and leakage rate during the collection process were recorded.
2.4. Sampling and Measurements
2.4.1. Soil Water Storage
Soil water storage (SW, mm) refers to the soil water content of a certain soil layer thickness. SW can reflect the migration and change in soil water in a growth period, calculated as Equation (1):
where, SWC is soil water content (cm3·cm−3); h is soil depth (cm).
2.4.2. Soil Water Balance
The water balance in the leaching pit is shown in Equation (2), ignoring horizontal flow and capillary rise (Zheng et al., 2020):
where P and I are precipitation (mm) and irrigation (mm), respectively; ET is evapotranspiration (mm); S is deep drainage (mm); and ∆S is the change in SW (mm).
2.4.3. Plant N Uptake
Four maize plants were randomly sampled from each plot to measure the aboveground biomass and plant N uptake at maturity. Plants in each plot were first separated into straw (including stems and leaves), corn, and cob, and samples were kept at 80 °C to reach a constant weight. Following this, dried samples were ground and passed through an 80-mesh sieve for analysis of TN content. Dried samples were first digested using an H2SO4-H2O2 method, and TN was then measured using an automatic flow-injection analyzer (AA3, Fia Star 5000, Foss Tecator, Zurich, Sweden). The N uptake of each plant was estimated by multiplying plant dry weight (1 combined plant) and plant N content of 3 parts per plot.
2.4.4. Soil N Residual
Prior to maize seeding and following harvest, 0~200 cm soil samples were collected at 20 cm intervals with a soil auger (3.8 cm in diameter) in the central area of each leaching pit, and holes were then backfilled with the same layers of soil. The soil NO3−-N was extracted with 0.5 M K2SO4 and then determined with AA3. In our study area, fields enter a fallow period following maize harvest, with no new N inputs (atmospheric nitrogen deposition is negligible) [16]. Therefore, we used the measured soil NO3−-N value following harvest in 2019 as the initial content for 2020. Soil residual N was calculated by multiplying soil bulk density and net accumulated NO3−-N in the soil for the period after harvesting and prior to sowing.
2.4.5. NO3−-N Dynamics in Soil Solution
To understand the dynamics of soil NO3−-N content after irrigation, soil solutions were collected from different soil layers from treatments with and without N fertilizer separated in time in the same field. Thus, soil solution extracted on 13 June, 6 July, and 12 August was treated with N fertilizer (with N fertilizer), while that extracted on 14 June, 19 July, and 27 August did not receive prior N fertilizer (without N-fertilizer) in 2020. Normally, the maximum leaching of N fertilizer applied to soils occurs 3–5 days after irrigation due to high relative soil moisture content [14]. Therefore, soil solutions were extracted with a vacuum pump before N application (without fertilizer; day 0) and then daily following N application for 6 days (with fertilizer; days 1, 2, 3, 4, 5, 6) from 20, 40, 60, 100, 140, and 180 cm soil depth. To ensure consistency, soil solutions with and without fertilizer were collected three times during the maize growth period. Meanwhile, deep soil drainage was collected at the bottom of the leaching pits after each irrigation using a polyethylene barrel, and the volume of soil drainage was recorded. NO3−-N concentrations of the soil solution and drainage were analyzed using AA3.
2.4.6. N Leaching
In the research of field crops, N leaching usually means the process of water-soluble nitrate (NO3−-N) in soil migrates down to the root active layer, entering the groundwater under the influence of heavy rainfall or irrigation [25]. In addition, N leaching also refers to a difference between the amount of total N inputs and N outputs and the N change in the soil profile. Previous studies have shown that the maize roots are distributed over 0–100 cm in depth [14,26]; therefore, in our experiment, the 0–100 cm soil profile was used for calculating N balance (Equation 3):
where L is N loss through leaching; iRN and pRN are N residual in soil of pre-sowing and postharvest, respectively; AN is the amount of added N, including N input from wet deposition, irrigation, and fertilization; and NU is N uptake by maize.
Wet deposition and irrigation samples were collected from April 2019 to October 2020. Wet deposition samples were collected with an automatic wet deposition sampler (LB-8110, Lubo, Qingdao, China), which was controlled by microcomputer. The sampler was automatically opened to collect when the rain began, and the cover was closed immediately after the rain stopped. The triplicate irrigation samples (100 mL) were collected using a white polyethylene bottle after each irrigation. The N input from wet deposition and irrigation was calculated by multiplying the amount of rainwater or irrigation by their corresponding N concentrations, respectively. The rainfall data were provided by an agro-meteorological station owned by Linze Ecological Observational and Experimental Station, which is 50 m away from our experimental plots.
2.4.7. Water- and Nitrogen-Use Efficiencies
Water-use efficiency (WUE) is an important indicator of the relationship between crop yield and water consumption. It mainly includes irrigation water-use efficiency (WUEIrrig) and evapotranspiration water-use efficiency (WUEET). Fertilizer N-use efficiency (NFUE) is an effective index to measure nitrogen-use efficiency in agricultural production. WUEIrrig, WUEET, and NFUE were calculated using Equations (4)–(6) of Ma et al. (2022).
where Y is grain yield (kg·ha−1), and N is the nitrogen application rate (kg·ha−1).
2.5. Data Analysis
All data were expressed as means ± standard deviation (SD). The 2-independent-samples t-test (p < 0.05) was applied to compare soil particle size distribution, apparent water balance, and apparent N balance between the YOF and OOF. Statistical analysis was performed in SPSS 21.0 (Chicago, IL, USA). Surfer 11.0 (Golden Software, Denver, CO, USA) was used to draw the map of spatiotemporal variability in soil moisture content.
3. Results
3.1. Soil Texture
Soil particle size distribution in the 0–200 cm soil profile is shown in Figure 3. The sand content in the YOF in the 0–200 cm profile was very significantly higher than that in the OOF (p < 0.01). However, the silt and clay contents in the OOF in the whole profile were higher than those in the YOF (p < 0.01). The soil is classified as sandy loam (at 0–20 cm depth) and sandy (at 20–200 depth) in YOF, and loamy (at 0–40 cm depth) and silty loam (at 40–200 depth) in OOF, according to the USDA soil classification.
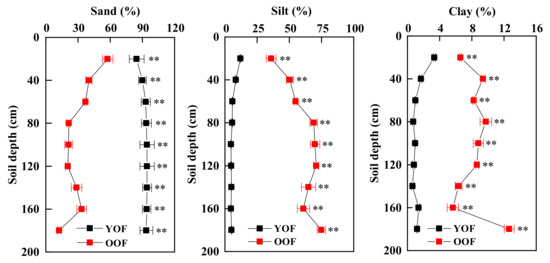
Figure 3.
Soil particle size distribution in the 0–200 cm soil profile in the old oasis field (OOF) and young oasis field (YOF). Error bars represent standard deviation. ** represent p < 0.01 between the YOF and the OOF at the same depth, respectively.
3.2. Soil Moisture
3.2.1. Dynamics of Soil Water Content
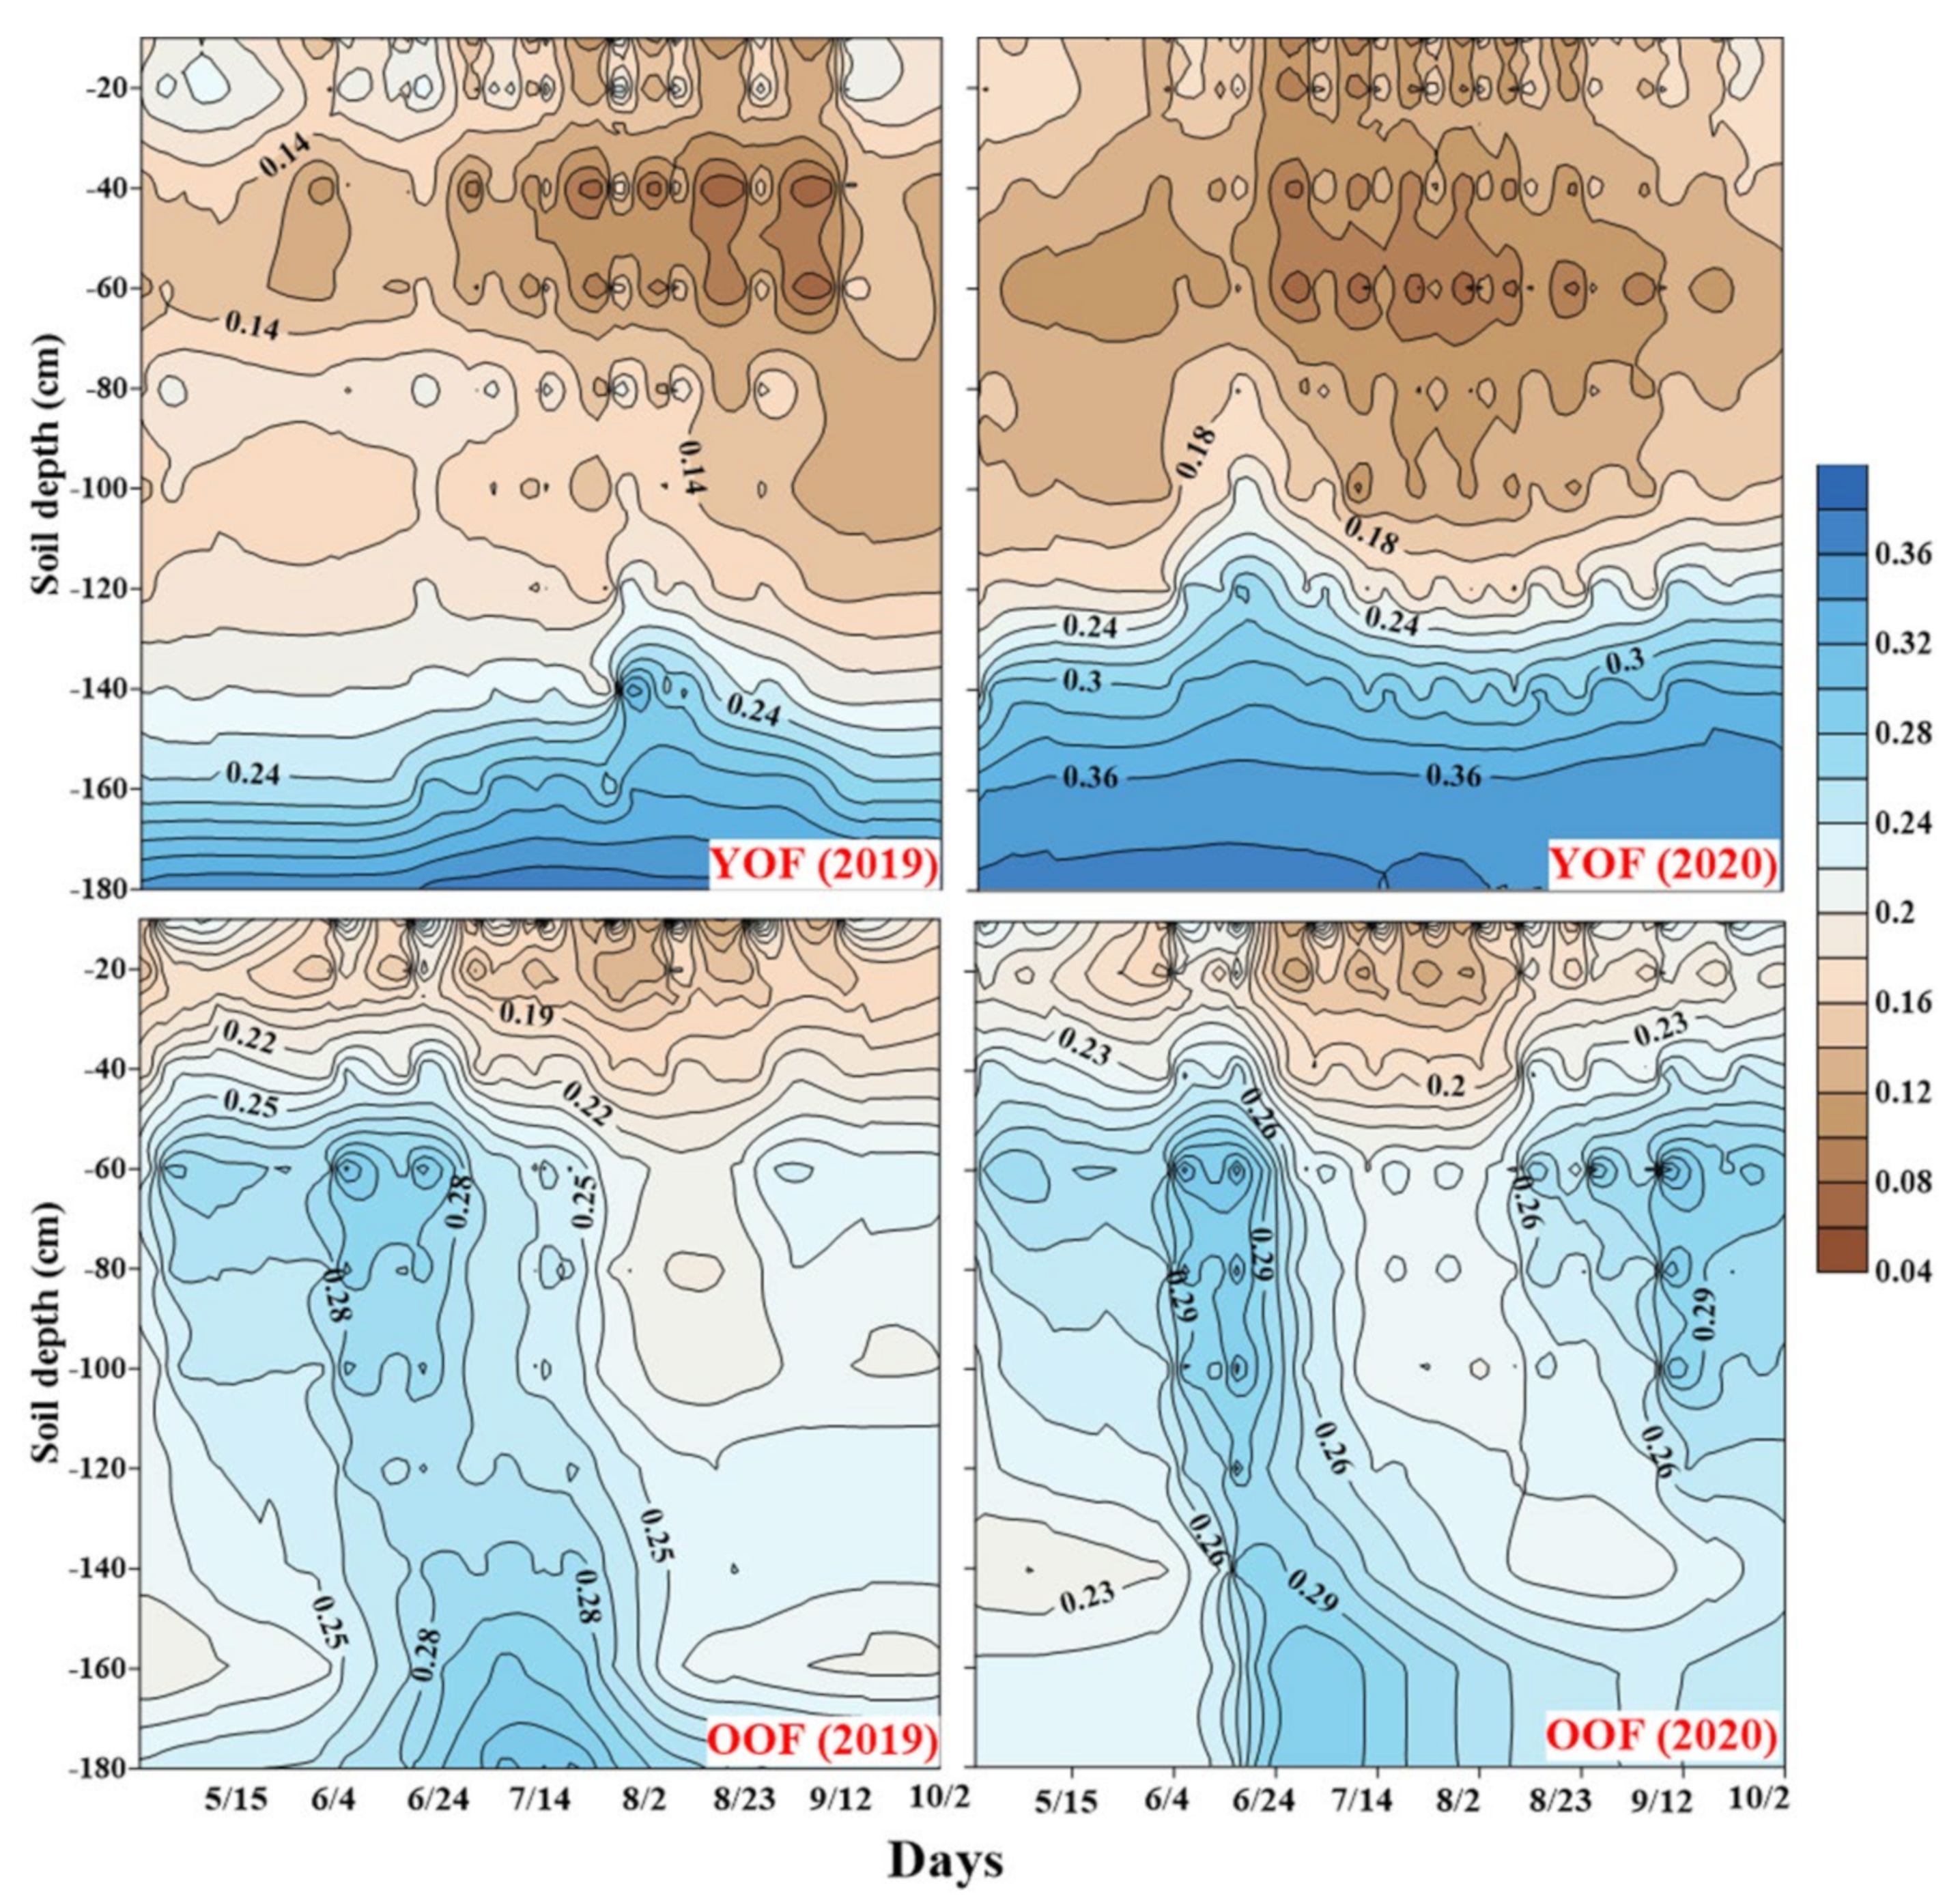
Figure 4 illustrates the spatiotemporal variability in daily soil water content (SWC) in the growing season of 2019 and 2020. Overall, SWC dynamics responded to irrigation, and distinct spikes appeared after each irrigation event. SWC in deep soil (120–180 cm) was higher than that in upper (0–60 cm) and middle soil layers (60–120 cm). The lowest value of SWC in the YOF and the OOF was 0.046 and 0.137 cm3·cm−3 at 40–60 cm and 10–20 cm depths, respectively, and 0.39 cm3·cm−3 in the YOF and 0.35 cm3·cm−3 in the OOF at 180 cm depth. SWC fluctuated sharply in upper and gently in deep soil. The isopleth of SWC in upper soil was dense and curved, while in the deep layer it was loose and smooth, indicating the changes in SWC in the upper layer fluctuated in deep soil. SWC also changed with stages of maize growth. The lowest SWC occurred at tasseling and milking.
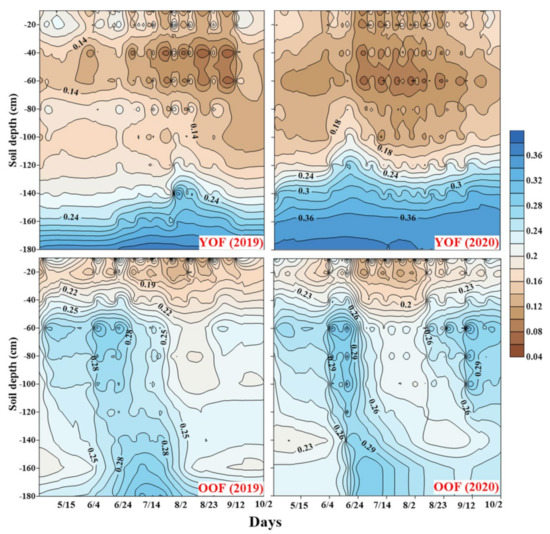
Figure 4.
Spatiotemporal variability in daily soil moisture content of the young oasis field (YOF) and old oasis field (OOF) during the maize growth period of 2019 and 2020.
3.2.2. Water Balance and WUE
The amount of irrigation was 720 and 810 mm, and that of precipitation was 119.5 and 100.5 mm in 2019 and 2020 growth seasons, respectively (Table 3). The annual in ET, SW in 0–100 cm, and the variability in SW in 0–200 cm in the OOF were higher than those in the YOF (p < 0.05). No significant difference was found between the YOF and the OOF in SW for the 100-180 cm soil layer (p > 0.05). The annual deep drainage in the YOF was 7.2 times that in the OOF (p > 0.05). ET was the largest single item of water consumption, and accounted for 67.7 and 60.4% of water input in the YOF and OOF, respectively. During the maize growing seasons, higher water-use efficiency was found in the OOF treatment (Table 3). The average annual WUEET and WUEIrrig in the OOF were significantly higher than those in the YOF (p < 0.05).
Table 3.
Apparent water balance (mm) of soil–plant system in the YOF and OOF.
3.3. Apparent Nitrogen
3.3.1. Dynamic of NO3−-N Concentration in Soil Solution
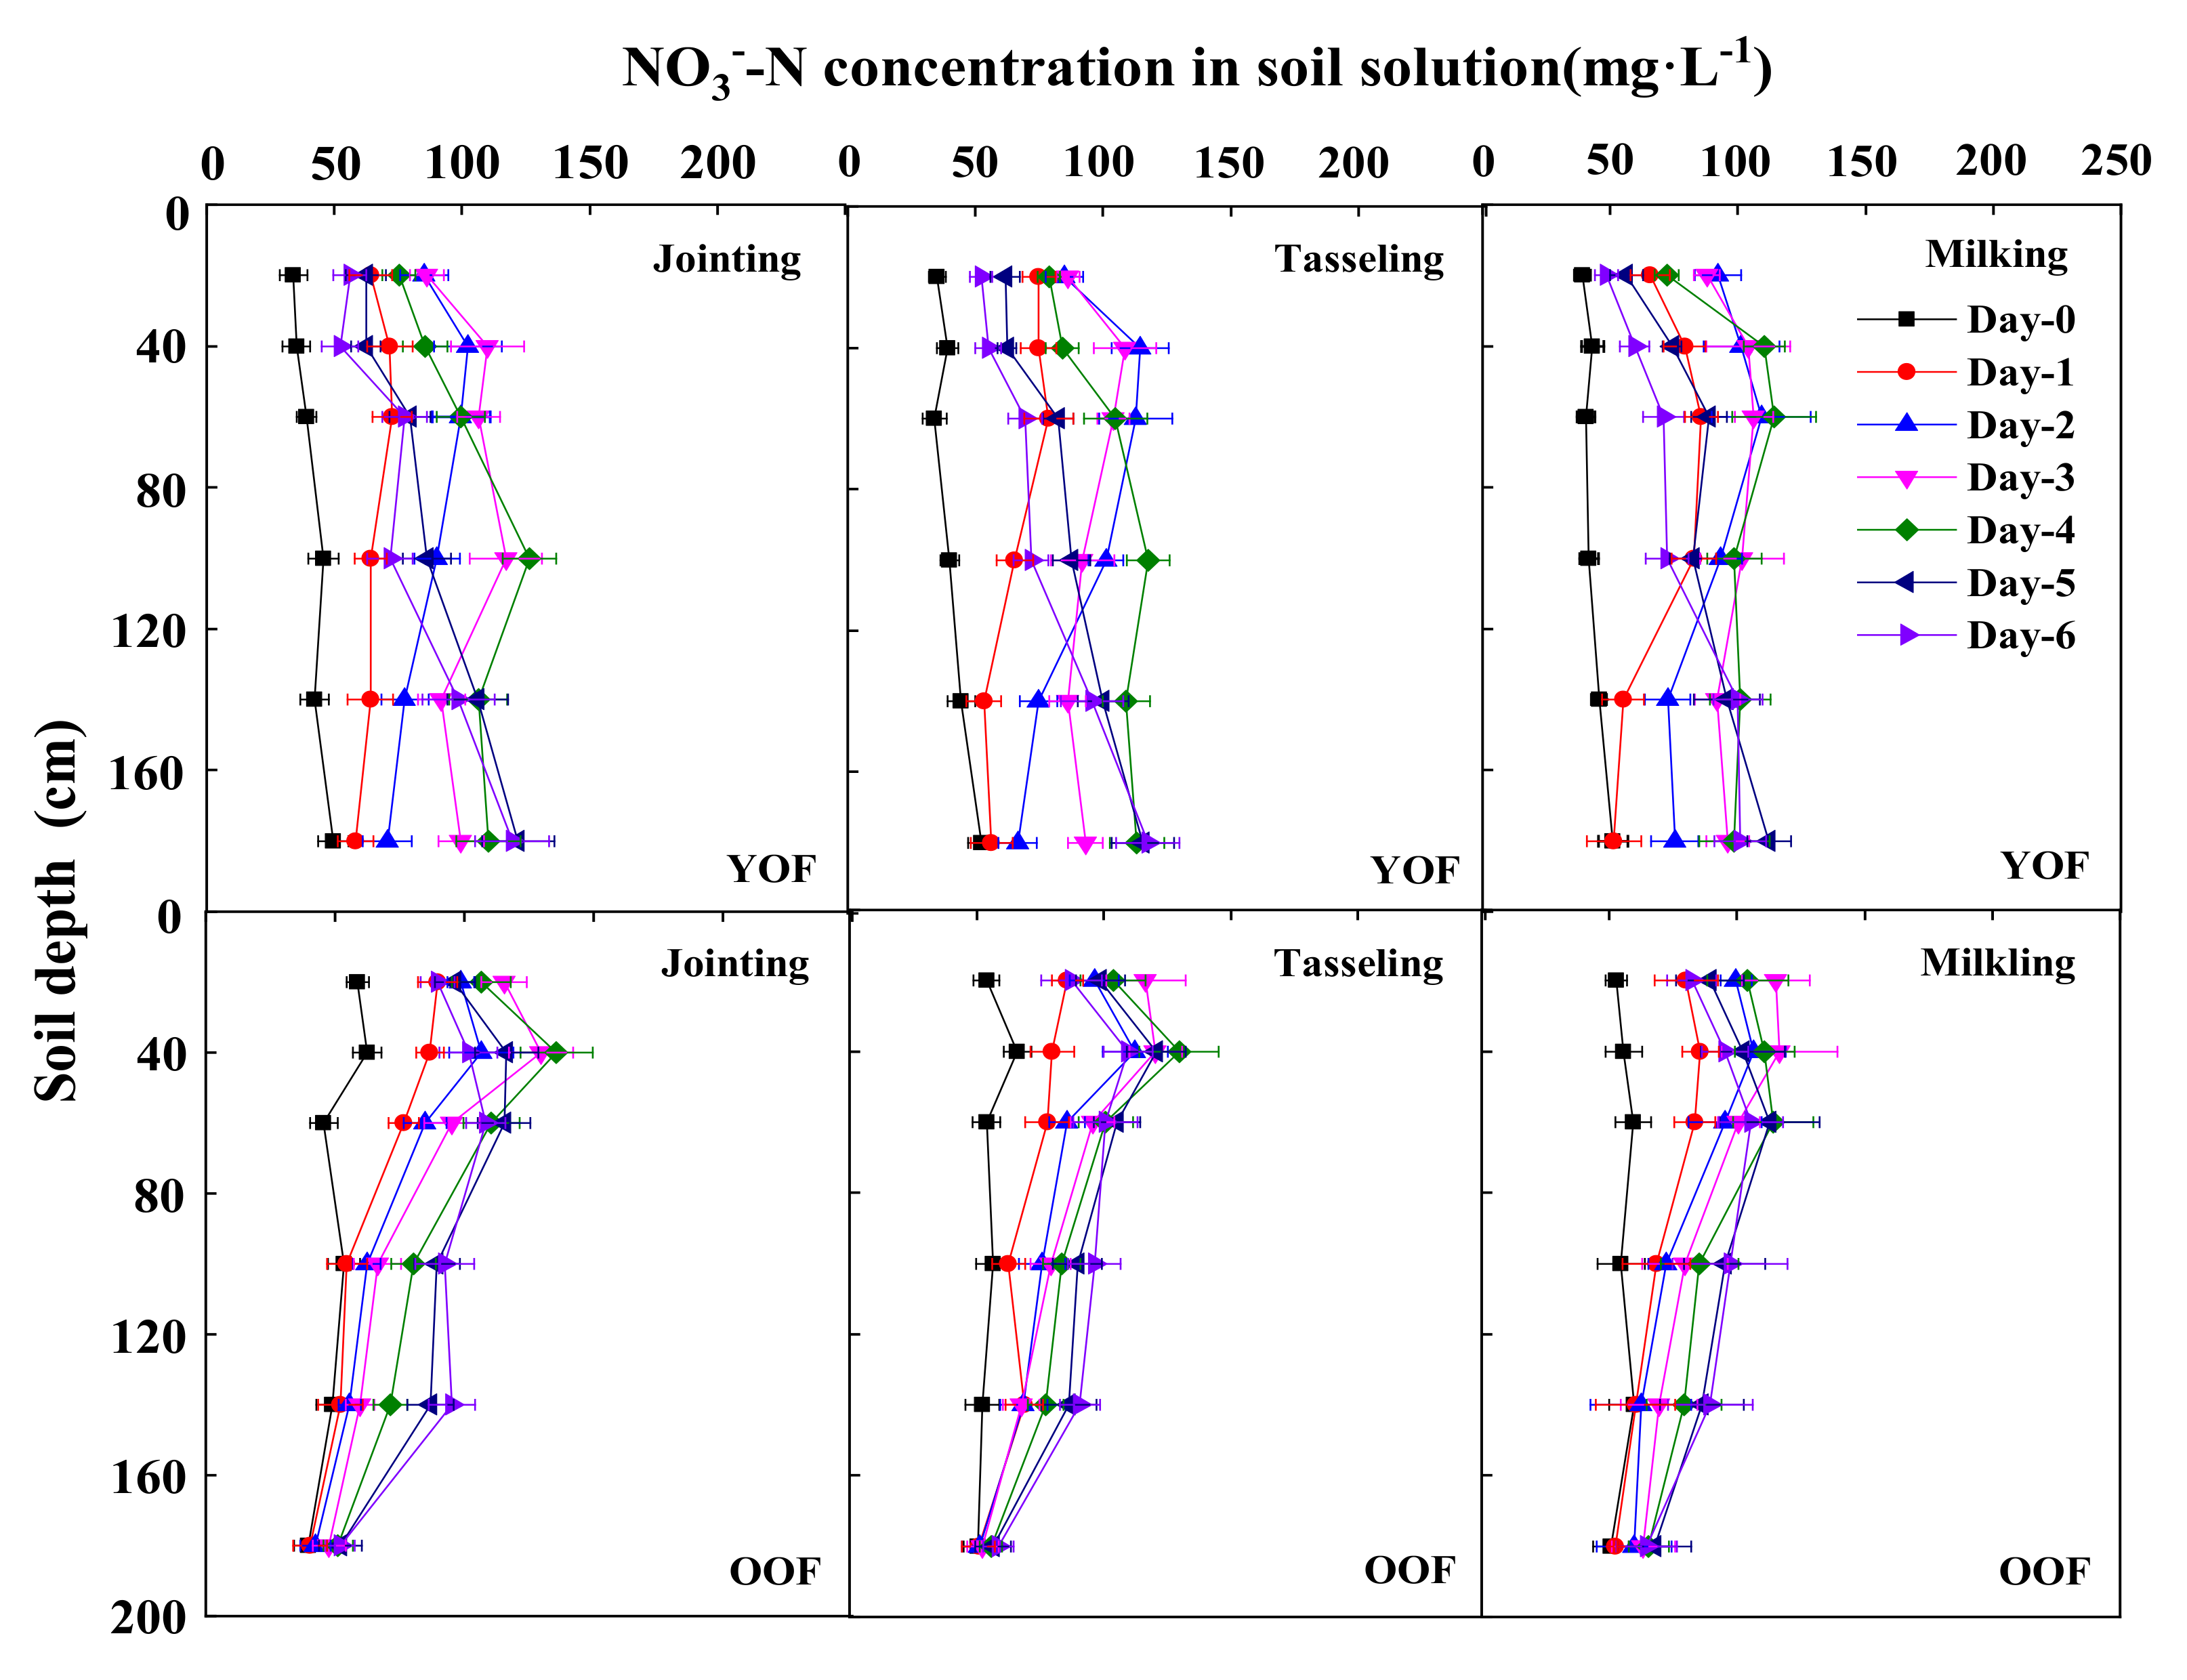
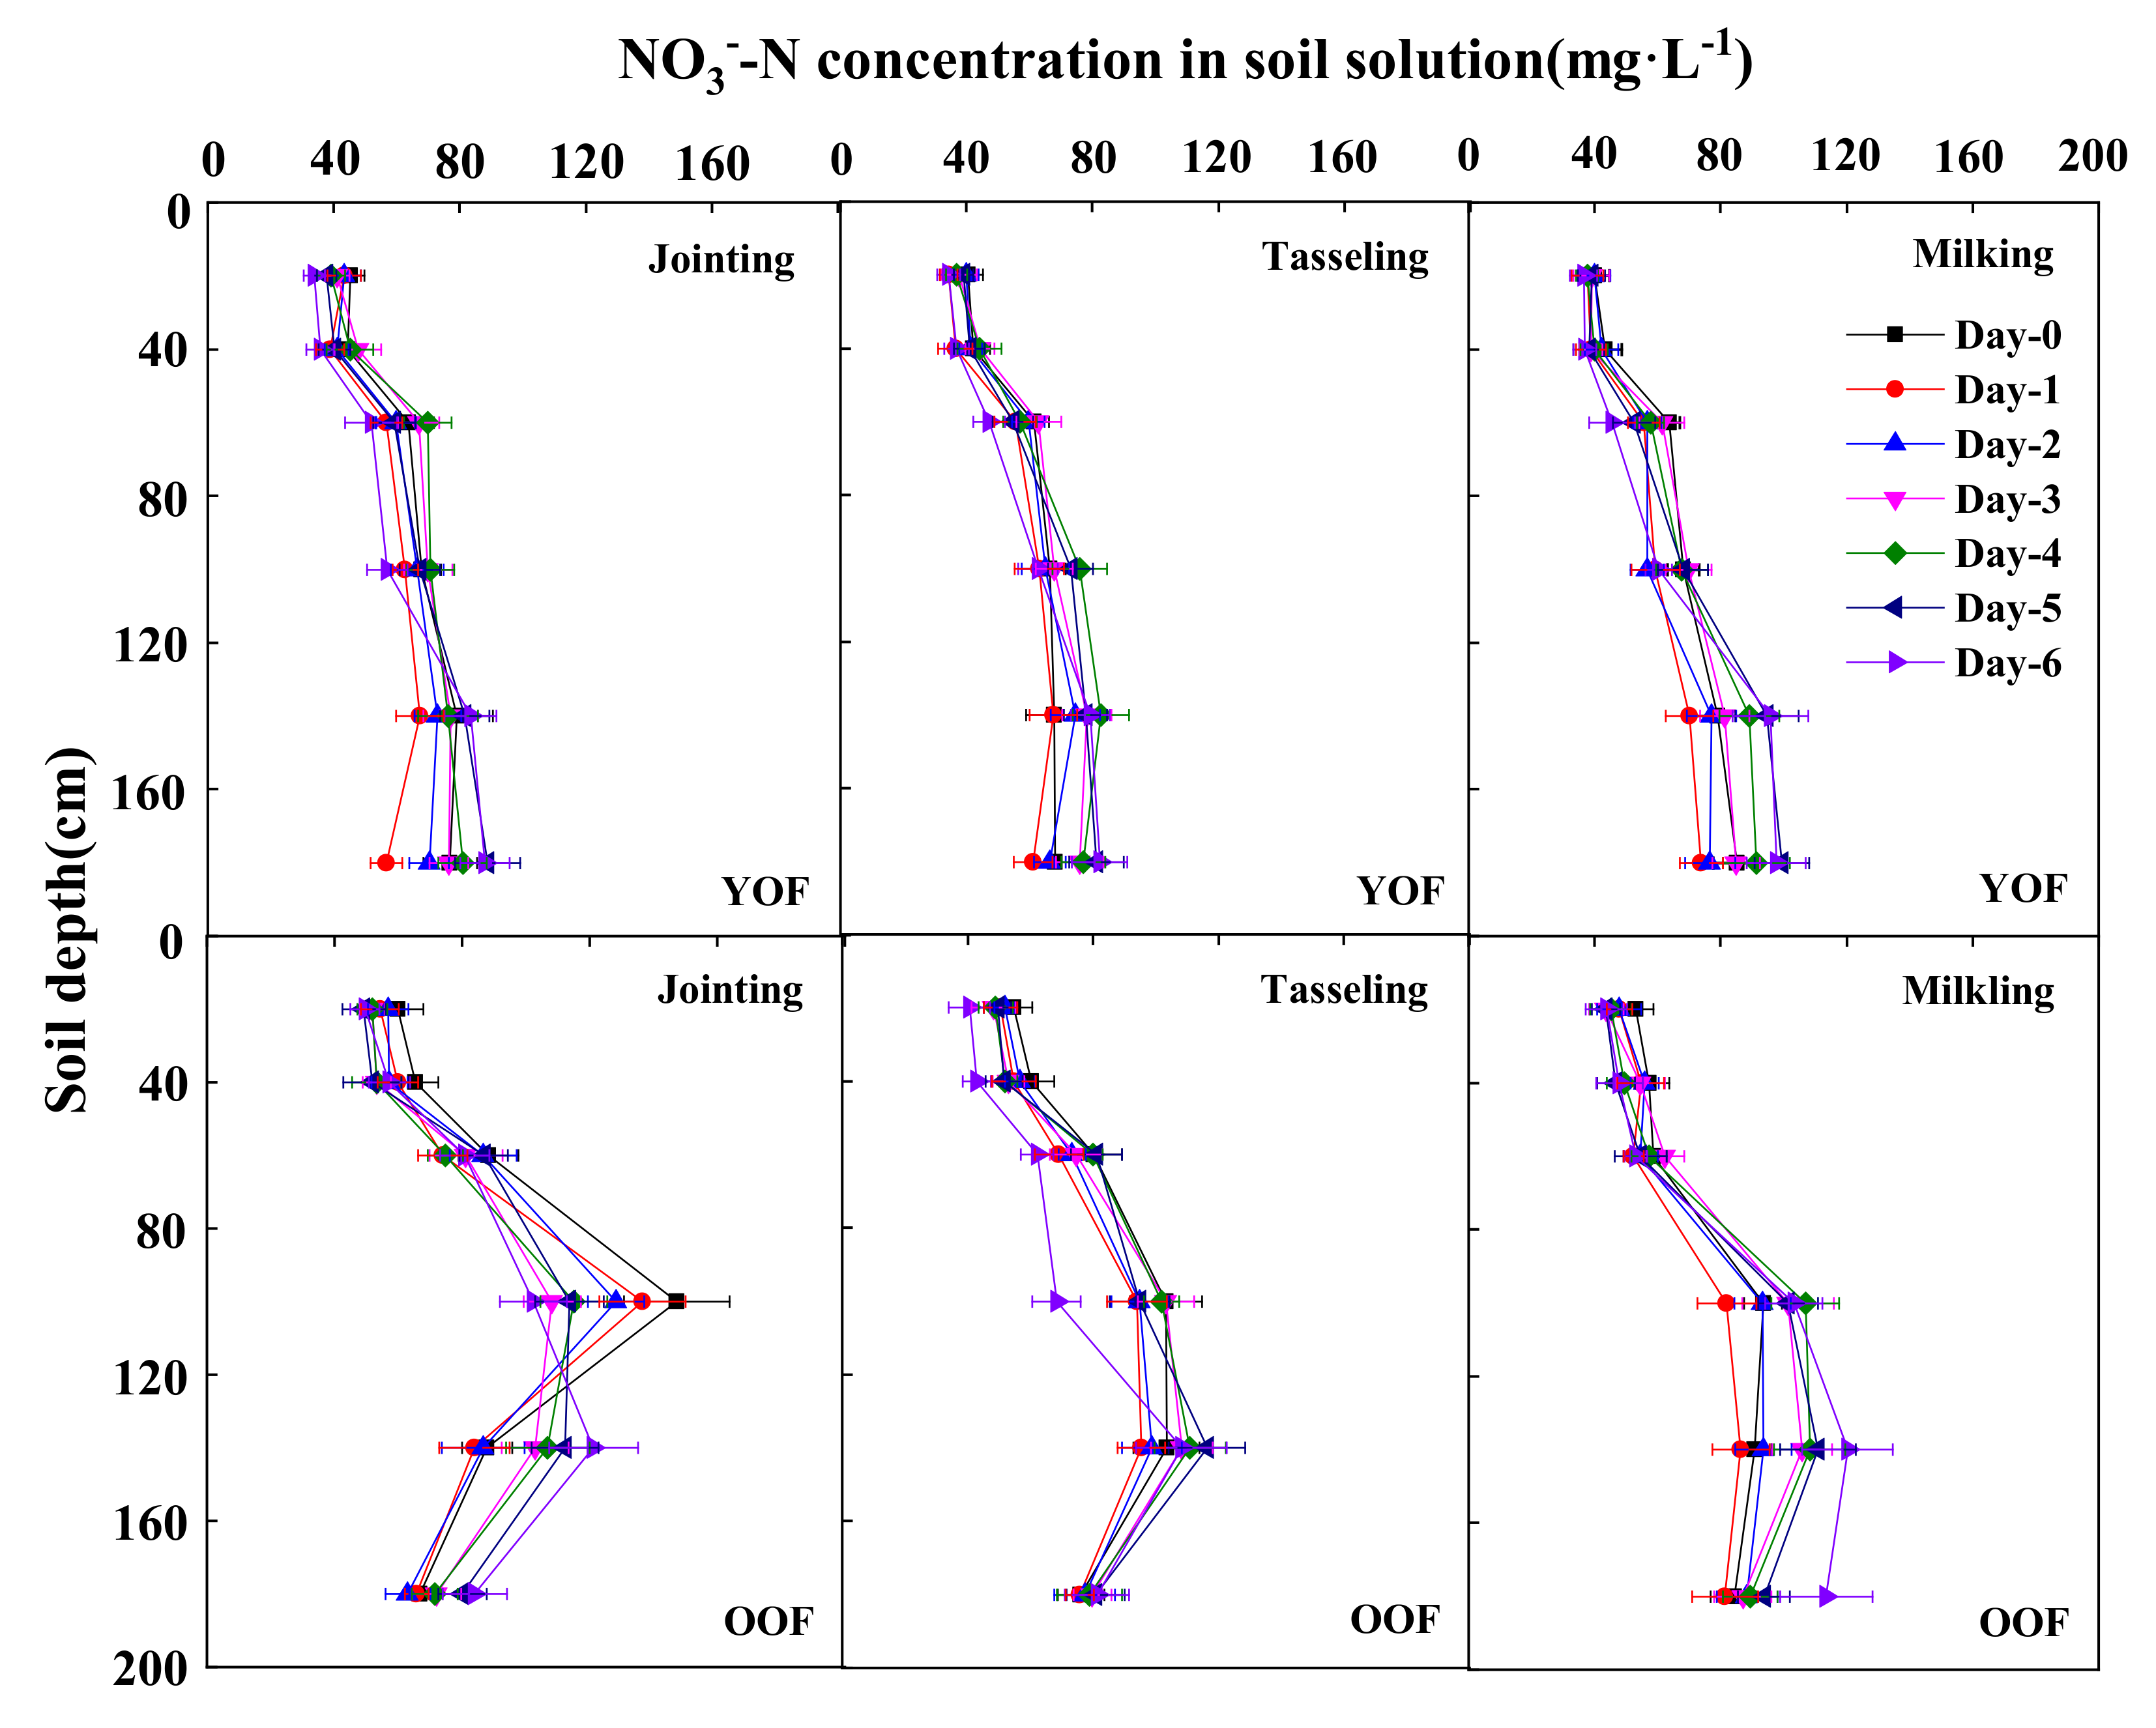
NO3−-N concentration in soil solutions from layers of 0–180 cm varied by field, soil depth, and crop-growth stages (Figure 5 and Figure 6). In general, with irrigation, the change in NO3−-N in different soil layers with fertilization was more dramatic than that without fertilization. In the former, NO3−-N increased sharply, then decreased slowly in upper soil (0–60 cm), while it increased steadily in deep soil (100–180 cm). Morevoer, NO3−-N at 140–180 cm depth in the YOF was significantly higher than that in the OOF after day three (Figure 4). In contrast, the concentration of NO3−-N across the whole profile without fertilization exhibited a decreasing trend, then increasing, and then decreasing again (Figure 5).
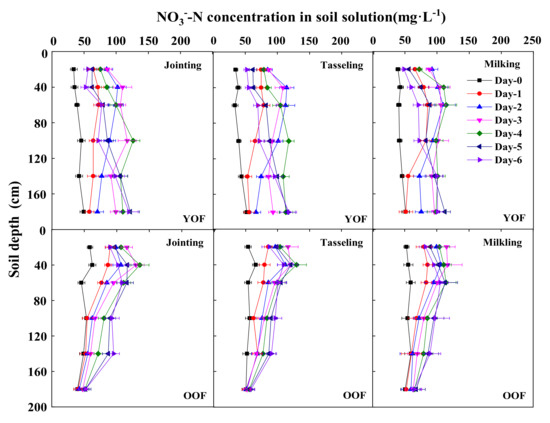
Figure 5.
NO3−-N concentrations in soil solution after N input was measured at three maize growth stages during 2020. Error bars represent standard deviation. Day zero represents measurements on the day before nitrogen application.
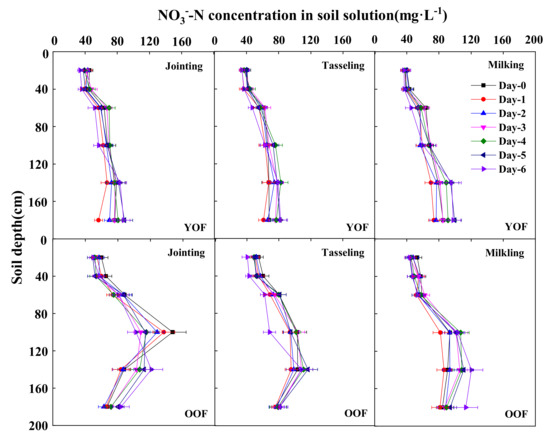
Figure 6.
NO3−-N concentrations in soil solutions without N input measured at three crop growth stages during 2020. Error bars represent standard deviation.
With fertilization and at the jointing stage, NO3−-N in the OOF reached the maximum in the upper soil (0–60 cm) on day four, NO3−-N peak in the middle layers (60–120 cm) was observed on day five, while peak in deep layers (120–180 cm) was observed on day six. A NO3−-N peak in the 0–100 cm layer in the YOF was observed 1–2 days earlier than that in OOF. At tasseling and milking stages in both fields, NO3−-N dynamics exhibited the same trend as for the jointing stage, but peak NO3−-N was observed 1–2 days earlier than at the jointing stage.
3.3.2. Residual of NO3−-N in Soil Profile
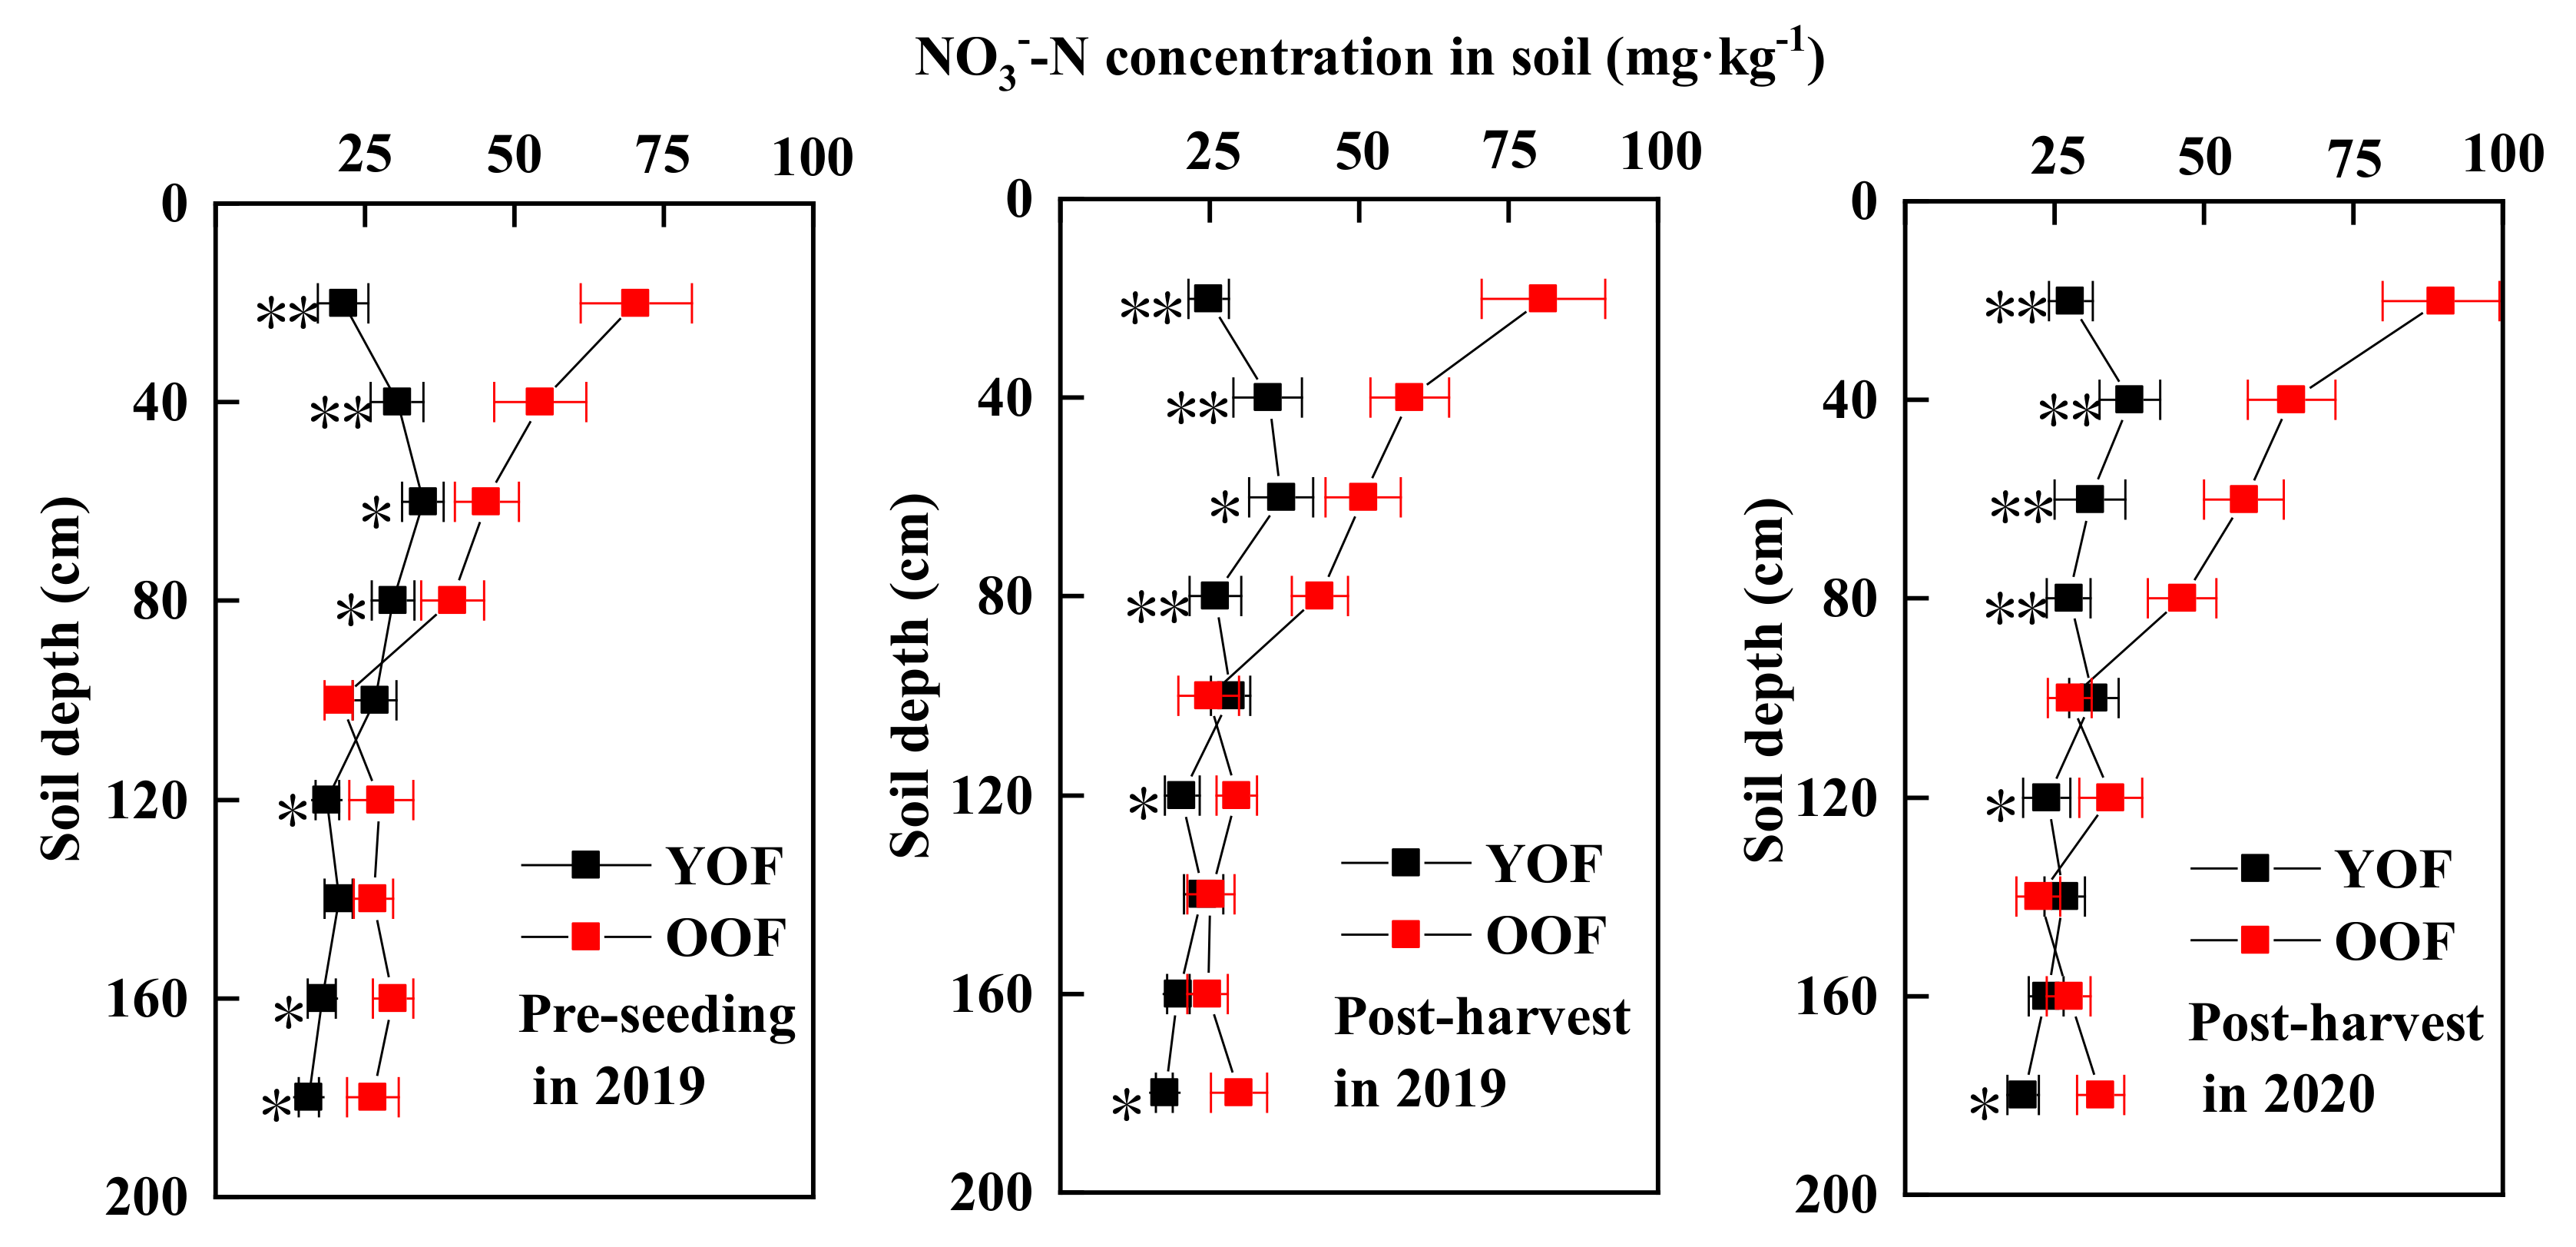
Soil residual NO3−-N at pre-seeding and post-harvest is shown in Figure 7. Soil NO3−-N fluctuated and decreased with the increase in soil depth; the peak appeared at 20 cm in the OOF and at 40 or 60 cm in YOF. Soil NO3−-N in the OOF at 20, 40, 60, 80, 120, and 180 cm was significantly different (p < 0.05) than that in the YOF at pre-seeding in 2019 and post-harvest in 2019 and 2020. There was a significant difference (p < 0.05) in soil NO3−-N at 160 cm between the OOF and the YOF at pre-seeding in 2019, while no significant difference (p > 0.05) was found in this layer post-harvest in 2019 and 2020. Fertilization and irrigation resulted in NO3−-N migration through the soil layers, and the maximum increase was found at 20 cm, with an average of 3.14 mg·kg−1 for YOF and 9.65 mg·kg−1 for OOF; the maximum decrease was observed at 60 cm for the YOF (1.85 mg·kg−1) and at 140 cm for the OOF (2.0 mg·kg−1).
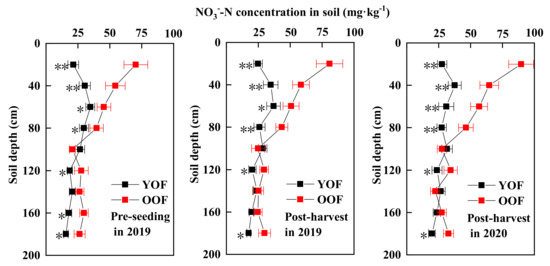
Figure 7.
Soil NO3−−N in the 0−200 cm soil profile. Error bars represent standard deviation. ** and * represent p < 0.01 and p < 0.05 between the young oasis field (YOF) and old oasis field (OOF) at the same depth, respectively.
Maximum NO3−-N accumulation in the YOF was found in the upper soil (0–60 cm) with the average of 42.45 kg·hm−2, which was significantly higher than that in the OOF (p < 0.05) (Table 4). NO3−-N accumulation in the YOF reached the lowest level in the middle layer (60-120 cm), where it tended toward negative accumulation in 2020. Higher accumulations in the OOF were observed in the middle (36.25 kg·hm−2) and deep soil layers (42.35 kg·hm−2), and were significantly different from those in the YOF (p < 0.05).
Table 4.
NO3−-N accumulation (kg·hm−2) in different soil layers in the YOF and OOF.
3.3.3. Plant Biomass Production and N Uptake
Dry aboveground biomass and the amount of N uptake in the late maturity stage is shown in Table 5. Aboveground biomass and plant N uptake of all maize tissue exhibited the order grain > straw > cob. Biomass and total N uptake in the OOF was significantly higher than that in the YOF (p < 0.05) with the same fertilization and irrigation measures. The difference in biomass between experimental years may be attributed to the variability in climate.
Table 5.
Aboveground biomass and plant N uptake in the YOF and OOF.
3.3.4. N Leaching, N Balance, and NFUE
The apparent N balance in the soil–plant system is shown in Table 6. Maize N uptake and NFUE in the OOF were significantly higher than those in the YOF (p < 0.05). No significant difference was found between the YOF and the OOF in soil N accumulation at the 100–200 cm layer (p > 0.05). There were significant differences between the YOF and the OOF in N-leaching losses below 100 and 200 cm. Maize N uptake was the largest single item in N consumption, which accounted for 45.2 and 60.4% of N input in the YOF and OOF, respectively.
Table 6.
Apparent N balance (kg·hm−2) of soil–plant system and NFUE in the YOF and OOF.
4. Discussion
4.1. Impact of Soil Texture on Water Balance and WUE
Variability in SWC results from the balance of irrigation, precipitation, evaporation, root water absorption, and deep drainage [27,28]. Deep drainage from a soil profile depended predominantly on the soil permeability coefficients of individual soil layers and on irrigation intensity [22]. The soil permeability coefficient is mainly determined by soil texture under a certain irrigation intensity. In general, sandy soils with strong soil water repellency lead to high soil permeability coefficients, with preferential flow [4,22] which increases water sequestration and the possibility of solute movement via macropore flow and funnel flow, resulting in a lower WUE [29,30]. Fine soil texture with high organic matter and clay contents enhances crop WUE by decreasing deep percolation [15]. Loamy and clayey textures result from high silt and clay, which act as binders to promote the development of soil aggregates and water retention [5,31]. In our study, SW 0-100 cm deep in the OOF was significantly higher than that in the YOF (p < 0.05); however, deep drainage in the YOF was 6.22 times higher than in the OOF (Table 3), resulting in significantly higher WUEET and WUEIrrig in the OOF than in the YOF (p < 0.05) (Table 6). In the study area, a 60% increase in clay and silt content in the YOF could increase SW within the rooting zone by 87.2%, reduce deep drainage 6.22 times, and increase WUEET by 20.9% and WUEIrrig by 24.1% following irrigation strategies implemented by local farmers. Bruand et al. [32] also observed that sandy soils may reduce percolation by 65–236% and increase water productivity by 30–50% when clay and silt content increases from 15% to 60%. Therefore, field management measures should be implemented in the YOF that are conducive to improvement in soil water retention.
Soil moisture has a strong response to irrigation and is more sensitive in upper soil in arid regions [28,33]. The contour lines of SWC in this study at 0–40 cm were relatively intensive and had columnar distribution, indicating that SWC fluctuated sharply after irrigation; this phenomenon was more noticeable in the YOF than in the OOF (Figure 4), suggesting that sandy soils are more sensitive to changes in irrigation because sandy soils have smaller porosity and relatively uniform particle-size distribution compared to loam soils [34]. The annual average ET of the OOF was greater than that of the YOF (Table 3). This discrepancy was likely due to sandy soil with low field capacity, where the surface becomes dry 1–2 days after irrigation, effectively reducing surface evaporation [33]. SW below the rooting zone of the YOF and the OOF was 462.3 and 241.4 mm (Table 3), accounting for 60.4% and 31.6% of irrigation, respectively, indicating that with current irrigation strategies, irrigation exceeds crop water demand, especially in YOF. Therefore, soil texture must be taken into consideration when deciding on irrigation strategies.
4.2. Impact of Soil Texture on N Balance and NFUE
To understand the use of N fertilizer, a detailed calculation of N accumulation in soil profile, N deep leaching, plant N uptake, and other potential losses is required [27,35,36]. Yield, a part of N uptake, is an important criterion for evaluating NFUE and land productivity. In this study, yield in the OOF was significantly higher than that in the YOF (p < 0.05) (Table 5), likely due to the differences in soil [37]. Soil properties, such as soil texture, control both water and N transport, and therefore the partitioning of N between plant uptake, retention in soil, leaching, and losses by denitrification, which eventually affect crop yield and NFUE [6,12,38].
NO3−-N leaching loss occurs when NO3−-N accumulation and water percolation exist within a soil profile [27]. NO3−-N concentrations 120–180 cm deep in the YOF were higher than those in the OOF after day three, and NO3−-N peaked 1–2 days earlier in the 0–100 cm soil layers in the YOF (Figure 5). NO3−-N leaching loss in the YOF was significantly higher than that in the OOF (p < 0.05); however, NO3−-N accumulation within the root zone in the OOF was significantly higher than that in the YOF (p < 0.05) (Table 5). Sand content was strongly negatively correlated with N uptake (p < 0.01), and it was positively correlated with N leaching (p < 0.01). These results indicated that a fine soil texture is conducive to N retention and crop growth, resulting in significantly higher N uptake and NFUE of the OOF (p < 0.05) (Table 5 and Table 6). A sandy texture will lead to excessive water infiltration and NO3−-N leaching, which reduces N-use efficiency [4]. Maize grown in the loamy texture was more responsive to N uptake than that grown in the sandy texture [15]. In our study, N-leaching loss in the YOF accounted for 38.6% of applied N (Table 6), which was much higher than that in other areas of China (2.3–2.8% in Guanzhong Plain [36]; 8.6–16.8% in Loess Plateau [19]; 9.6–14% in North China Plain [27]; 18% in Hetao Irrigation District [39]. Therefore, the management of soil texture and improvements in soil structure and nutrient leaching are needed for sustainable agricultural and environmental management in sandy soils.
The amount of applied N fertilizer (330 kg·hm−2), which exceeded crop N uptake (by 185.5 kg·hm−2 in the YOF and by 247.5 kg·hm−2 in OOF), resulted in 127.4 kg·hm−2 (YOF) and 48.1 kg·hm−2 (OOF) of applied N leaching below the rooting zone (Table 6) and becoming a potential source of nitrate pollution in groundwater [30]. N fertilizer with site-specific management is an effective strategy to improve N-use efficiency and reduce the risk of leaching [40], but soil texture should be considered. Nitrate leaching decreased with an increased soil clay content. Crop yields in a silty loam were more responsive to increases in N [41], while crops grown in soils with low water- and nutrient-holding capacity may exhibit a lack of response to the application of N fertilizer [40]. However, excessive application of N fertilizer is a common practice for high yields, with some farmers applying 450–500 kg·hm−2·yr−1 to achieve high yields in young reclaimed oasis fields, greatly increasing the risk of groundwater contamination [17]. These results make a strong case for incorporating soil textural information into an optimal fertilization strategy.
4.3. Regional Soil and Water Management Practices
An increasing demand for food production fueled intensive land conversion from the native desert to irrigated croplands in arid regions of northwestern China. The cultivated area in Zhangye irrigation district in 2010 was 2896 km2. Nearly half of this was young oasis fields cultivated in the past 50 years in sandy lands in the periphery of the oasis, resulting in sandy fields playing an important role in agricultural production [16,17]. However, we found in previous studies that sandy soils still maintained high sand content after 40 years of cropping, and soil aggregate, SOC, and nutrients were insufficient to support high crop production. We propose that YOFs will contribute to water and fertilizer waste for a long time. Therefore, it is urgent to mitigate this negative impact through informed field management.
Best management practices (BMPs) can reduce fertilizer and irrigation inputs, improve crop yield and productivity, and reduce the potential risks of groundwater contamination in sandy soils [30]. A number of management practices have been proposed to improve soil structure and reduce infiltration in sandy soils, including enhanced aggregation [42]; the use of soil amendments such as biochar, clay [43], and organic fertilization in fertilized soils; conservation tillage; crop and grass rotation [13]; and mulching [19]. Water-saving irrigation, including micro-irrigation [44], drip irrigation [14], and border irrigation [39], may be another way to improve soil productivity by reducing water loss and deep drainage to improve N retention.
5. Conclusions
Two-year field experiments were conducted in the Heihe irrigation district in arid northwestern China to investigate the effects of soil texture on crop yield, NO3−-N leaching, and water and nitrogen productivity. Under the current irrigation and fertilization regimes, crops grown in the OOF had a higher crop yield, total N uptake, residual N in 0–100 cm soil layer, WUEET, WUEIrrig, and NFUE and a lower deep drainage and NO3−-N leaching than the YOF (Table 3, Table 4, Table 5 and Table 6). Therefore, sustainable agricultural production requires appropriate field management for YOFs to increase land productivity and reduce the loss of water and nitrogen resources.
Neglecting capillary rise returning nitrogen to the root zone, residual N and N leaching below the root zone will eventually enter groundwater with irrigation due to the relatively high water table in the study area. However, there were differences in N loss due to the differences in soil texture across different cultivation spans. Therefore, how to quantify the contribution rate of N loss to the N load of groundwater under different soil textures is an important topic for future agricultural non-point-source pollution research in the study area. More research is needed to explore the effects of different soil textures on maize productivity and nitrogen retention.
Author Contributions
Conceptualization, L.W. and D.M.; data curation, L.W.; investigation, Z.H.; supervision, L.W. and C.W.; visualization, L.W.; writing—original draft, W.Z.; writing—review and editing, L.W., Z.H., W.Z., C.W. and D.M. All authors have read and agreed to the published version of the manuscript.
Funding
This research was jointly supported by the National Natural Science Foundation of China (No. 41630861) and the Second Tibetan Plateau Scientific Expedition and Research (STEP) program (No. 2019QZKK0303).
Institutional Review Board Statement
Not applicable.
Informed Consent Statement
Not applicable.
Data Availability Statement
The data presented in this study are available on request from the corresponding author.
Conflicts of Interest
We declare that we have no known competing financial interests or personal relationships that could have appeared to influence the work reported in this paper.
References
- Yu, C.; Huang, X.; Chen, H.; Godfray, H.C.J.; Wright, J.S.; Hall, J.W.; Gong, P.; Ni, S.Q.; Qiao, S.C.; Huang, G.R. Managing nitrogen to restore water quality in China. Nature 2019, 567, 516–520. [Google Scholar] [CrossRef] [PubMed]
- Xiao, Q.Y.; Dong, Z.X.; Han, Y.; Hu, L.; Hu, D.N.; Zhu, B. Impact of soil thickness on productivity and nitrate leaching from sloping cropland in the upper Yangtze River Basin. Agric. Ecosyst. Environ. 2021, 311, 107266–107275. [Google Scholar] [CrossRef]
- Yang, S.H.; Wu, H.Y.; Dong, Y.; Zhao, X.R.; Song, X.D.; Yang, J.L.; Hallett, P.D.; Zhang, G.L. Deep Nitrate Accumulation in a Highly Weathered Subtropical Critical Zone Depends on the Regolith Structure and Planting Year. Environ. Sci. Technol. 2020, 54, 13739–13747. [Google Scholar] [CrossRef] [PubMed]
- Acutis, M.; Ducco, G.; Grignani, C. Stochastic use of the LEACHN model to forecast nitrate leaching in different maize cropping systems. Eur. J. Agron. 2000, 2, 191–206. [Google Scholar] [CrossRef]
- Zhang, Y.Y.; Zhao, W.Z.; Fu, L. Soil macropore characteristics following conversion of native desert soils to irrigated croplands in a desert-oasis ecotone, Northwest China. Soil Tillage Res. 2017, 168, 176–186. [Google Scholar] [CrossRef]
- Lu, J.; Bai, Z.H.; Velthof, G.L.; Wu, Z.G.; Chadwick, D.; Ma, L. Accumulation and leaching of nitrate in soils in wheat-maize production in China. Agric. Water Manag. 2019, 212, 407–415. [Google Scholar] [CrossRef]
- Xu, Z.W.; Zhang, X.Y.; Yu, G.R.; Sun, X.M.; Wen, X.F. Review of dual stable isotope technique for nitrate source identification in surface- and groundwater in China. Environ. Sci. 2014, 35, 3230–3238. (In Chinese) [Google Scholar]
- Perego, A.; Basile, A.; Bonfante, A.; De Mascellis, R.; Terribile, F.; Brenna, S.; Acutis, M. Nitrate leaching under maize cropping systems in Po Valley (Italy). Agric. Ecosyst. Environ. 2012, 147, 57–65. [Google Scholar] [CrossRef]
- Quemada, M.; Baranski, M.; Nobel-de Lange, M.N.J.; Vallejo, A.; Cooper, J.M. Meta-analysis of strategies to control nitrate leaching in irrigated agricultural systems and their effects on crop yield. Agric. Ecosyst. Environ. 2013, 174, 1–10. [Google Scholar] [CrossRef] [Green Version]
- Wang, Y.; Ying, H.; Yin, Y.; Zheng, H.F.; Cui, Z.L. Estimating soil nitrate leaching of nitrogen fertilizer from global meta-analysis. Sci. Total Environ. 2019, 657, 96–102. [Google Scholar] [CrossRef]
- Nyiraneza, J.; Zebarth, B.J.; Ziadi, N.; Sharifi, M.; Burton, D.L.; Drury, C.F.; Bittman, S.; Grant, C.A. Prediction of soil nitrogen supply in corn production using soil chemical and biological indices. Soil Sci. Soc. Am. J. 2012, 76, 925–935. [Google Scholar] [CrossRef]
- Chen, L.F.; He, Z.B.; Zhao, W.Z. Soil structure and nutrient supply drive changes in soil microbial communities during conversion of virgin desert soil to irrigated cropland. Eur. J. Soil Sci. 2020, 71, 768–781. [Google Scholar] [CrossRef]
- Su, Y.Z.; Yang, R.; Liu, W.J.; Wang, X.F. Evolution of Soil Structure and Fertility after Conversion of Native Sandy Desert Soil to Irrigated Cropland in Arid Region, China. Soil Sci. 2010, 175, 246–254. [Google Scholar] [CrossRef]
- Shareef, M.; Gui, D.W.; Zeng, F.J.; Waqas, M.; Ahmed, Z.; Zhang, B.; Iqbal, H.; Xue, J. Nitrogen leaching, recovery efficiency, and cotton productivity assessments on desert-sandy soil under various application methods. Agric. Water Manag. 2019, 223, 105716–105724. [Google Scholar] [CrossRef]
- Cambouris, A.N.; Ziadi, N.; Perron, I.; Alotaibi, K.D.; Luce, M.S.; Tremblay, N. Corn yield components response to nitrogen fertilizer as a function of soil texture. Can. J. Soil Sci. 2016, 96, 386–399. [Google Scholar] [CrossRef]
- Yang, R.; Su, Y.-Z.; Wang, T.; Yang, Q. Effect of chemical and organic fertilization on soil carbon and nitrogen accumulation in a newly cultivated farmland. J. Integr. Agric. 2016, 15, 658–666. [Google Scholar] [CrossRef] [Green Version]
- Wang, L.S.; He, Z.B.; Li, J. Assessing the land use type and environment factors affecting groundwater nitrogen in an arid oasis in northwestern China. Environ. Sci. Pollut. Res. 2020, 27, 40061–40074. [Google Scholar] [CrossRef]
- Mi, L.; Xiao, H.; Zhang, J.; Yin, Z.; Shen, Y. Evolution of the groundwater system under the impacts of human activities in middle reaches of Heihe River Basin (Northwest China) from 1985 to 2013. Appl. Hydrogeol. 2016, 24, 971–986. [Google Scholar] [CrossRef]
- Dong, Q.; Dang, T.H.; Guo, S.L.; Hao, M.D. Effect of different mulching measures on nitrate nitrogen leaching in spring maize planting system in south of Loess Plateau. Agric. Water Manag. 2019, 213, 654–658. [Google Scholar] [CrossRef]
- Abbas, M.S.; Akmal, M.; Khan, K.S. Zn Ferti-fortification of Wheat (Triticum aestivum, L.) Using Zinc Enriched Compost and Biochar in Rainfed Area. Commun. Soil Sci. Plant Anal. 2021, 4, 1–16. [Google Scholar] [CrossRef]
- Liang, J.; He, Z.; Shi, W. Cotton/mung bean intercropping improves crop productivity, water use efficiency, nitrogen uptake, and economic benefits in the arid area of Northwest China. Agric. Water Manag. 2020, 240, 106277. [Google Scholar] [CrossRef]
- Zhou, H.; Zhao, W.Z. Modeling soil water balance and irrigation strategies in a flood-irrigated wheat-maize rotation system. A case in dry climate, China. Agric. Water Manag. 2019, 221, 286–302. [Google Scholar] [CrossRef]
- Su, Y.Z.; Zhao, W.Z.; Su, P.X.; Zhang, Z.H.; Wang, T.; Ram, R. Ecological effects of desertification control and desertified land reclamation in an oasis–desert ecotone in an arid region: A case study in Hexi Corridor, northwest China. Ecol. Eng. 2007, 29, 117–124. [Google Scholar] [CrossRef]
- Allen, R.G.; Pereira, L.S.; Raes, D.; Smith, M. Crop Evapotranspiration—Guidelines for Computing Crop Water Requirements—FAO Irrigation and Drainage Paper 56; Food and Agriculture Organization of the United Nations: Rome, Italy, 1998. [Google Scholar]
- Ma, Q.; Tao, R.R.; Ding, Y.G. Can Split Application of Slow-Release Fertilizer Improve Wheat Yield, Nitrogen Efficiency and Their Stability in Different Ecological Regions? Agronomy 2022, 12, 407. [Google Scholar] [CrossRef]
- Cui, Z.; Zhang, F.; Chen, X.; Dou, Z.; Li, J. In-season nitrogen management strategy for winter wheat: Maximizing yields, minimizing environmental impact in an over-fertilization context. Field Crops Res. 2010, 116, 140–146. [Google Scholar] [CrossRef]
- Zheng, W.; Wan, Y.; Li, Y. Developing water and nitrogen budgets of a wheat-maize rotation system using auto-weighing lysimeters: Effects of blended application of controlled-release and un-coated urea. Environ. Pollut. 2020, 263, 114383–114393. [Google Scholar] [CrossRef]
- Zhao, G.Q.; Zhou, B.B.; Mu, Y.; Wang, Y.H.; Liu, Y.Q.; Wang, L. Irrigation with Activated Water Promotes Root Growth and Improves Water Use of Winter Wheat. Agronomy 2021, 11, 2459. [Google Scholar] [CrossRef]
- Arunadevi, K.; Singh, M.; Denny, F. Real Time Soil Moisture (RTSM) Based Irrigation Scheduling to Improve Yield and Water-Use Efficiency of Green Pea (Pisum sativum L.) Grown in North India. Agronomy 2022, 12, 278. [Google Scholar]
- Huang, J.; Hartemink, A.E. Soil and environmental issues in sandy soils. Earth Sci. Rev. 2020, 208, 103295–103316. [Google Scholar] [CrossRef]
- Vincent, A.; Benoit, P.; Pot, V.; Madrigal, I.; Delgado-Moreno, L.; Labat, C. Impact of different land uses on the migration of two herbicides in a silt loam soil: Unsaturated soil column displacement studies. Eur. J. Soil Sci. 2007, 31, 320–328. [Google Scholar] [CrossRef]
- Bruand, A.; Hartmann, C.; Lesturgez, G. Physical Properties of Tropical Sandy Soils: A Large Range of Behaviours. 2005. Available online: https://horizon.documentation.ird.fr/exl-doc/pleins_textes/divers16-03/010066536.pdf (accessed on 18 June 2022).
- Yi, J.; Zhao, Y.; Shao, M.A.; Li, H.J.; Jiang, R.; Hill, R.L.; Si, B.C. Hydrological processes and eco-hydrological effects of farmland-forest-desert transition zone in the middle reaches of Heihe River Basin, Gansu, China. J. Hydrol. 2015, 529, 1690–1700. [Google Scholar] [CrossRef]
- Fernandez-Illescas, C.P.; Porporato, A.; Laio, F.; Rodriguez-Iturbe, I. The ecohydrological role of soil texture in a water-limited ecosystem. Water Resour. Res. 2001, 37, 2863–2872. [Google Scholar] [CrossRef]
- Hu, H.Y.; Ning, T.Y.; Li, Z.J.; Han, H.F.; Zhang, Z.Z.; Qin, S.J.; Zheng, Y.H. Coupling effects of urea types and subsoiling on nitrogen-water use and yield of different varieties of maize in northern China. Field Crops Res. 2013, 142, 85–94. [Google Scholar] [CrossRef]
- Yang, X.L.; Lu, Y.L.; Tong, Y.A.; Yin, X.F. A 5-year lysimeter monitoring of nitrate leaching from wheat–maize rotation system: Comparison between optimum N fertilization and conventional farmer N fertilization. Agric. Ecosyst. Environ. 2014, 199, 34–42. [Google Scholar] [CrossRef]
- Brocca, L.; Morbidelli, R.; Melone, F.; Moramarco, T. Soil moisture spatial variability in experimental areas of central Italy. J. Hydrol. 2007, 2, 356–373. [Google Scholar] [CrossRef]
- Cordero, E.; Longchamps, L.; Khosla, R.; Sacco, D. Spatial management strategies for nitrogen in maize production based on soil and crop data. Sci. Total Environ. 2019, 697, 133854. [Google Scholar] [CrossRef]
- Li, C.; Xiong, Y.; Cui, Z.; Huang, Q.Z.; Xu, X.; Han, W.G.; Huang, G.H. Effect of irrigation and fertilization regimes on grain yield, water and nitrogen productivity of mulching cultivated maize (Zea mays L.) in the Hetao Irrigation District of China. Agric. Water Manag. 2020, 232, 106065. [Google Scholar] [CrossRef]
- Delgado, J.A.; Khosla, R.; Bausch, W.C.; Westfall, D.G.; Inman, D. Nitrogen fertilizer management zones reduce potential for nitrate leaching. J. Soil Water Conserv. 2005, 60, 402–410. [Google Scholar]
- Basso, B.; Ritchie, J.T.; Cammarano, D.; Sartori, L. A strategic and tactical management approach to select optimal N fertilizer rates for wheat in a spatially variable field. Eur. J. Agron. 2011, 35, 215–222. [Google Scholar] [CrossRef]
- Sadras, V.O. A quantitative top down view of interactions between stresss: Theory and analysis of nitrogen-water co-limitation in Mediterranean agroecosystems. Aust. J. Agric. Res. 2005, 56, 1151–1157. [Google Scholar] [CrossRef]
- Lal, R.; Shukla, M.K. Principles of Soil Physics; CRC Press: Boca Raton, FL, USA, 2004. [Google Scholar]
- Beusch, C.; Cierjacks, A.; Böhm, J.; Mertens, J.; Bischoff, W.A.; de Araújo Filho, J.C.; Kaupenjohann, M. Biochar vs. clay: Comparison of their effects on nutrient retention of a tropical Arenosol. Geoderma 2019, 337, 524–535. [Google Scholar] [CrossRef]

Publisher’s Note: MDPI stays neutral with regard to jurisdictional claims in published maps and institutional affiliations. |
© 2022 by the authors. Licensee MDPI, Basel, Switzerland. This article is an open access article distributed under the terms and conditions of the Creative Commons Attribution (CC BY) license (https://creativecommons.org/licenses/by/4.0/).