
Investigating Contribution Factors of Grain Input to Output Transformation for the Inner Mongolia Autonomous Region in China

Abstract
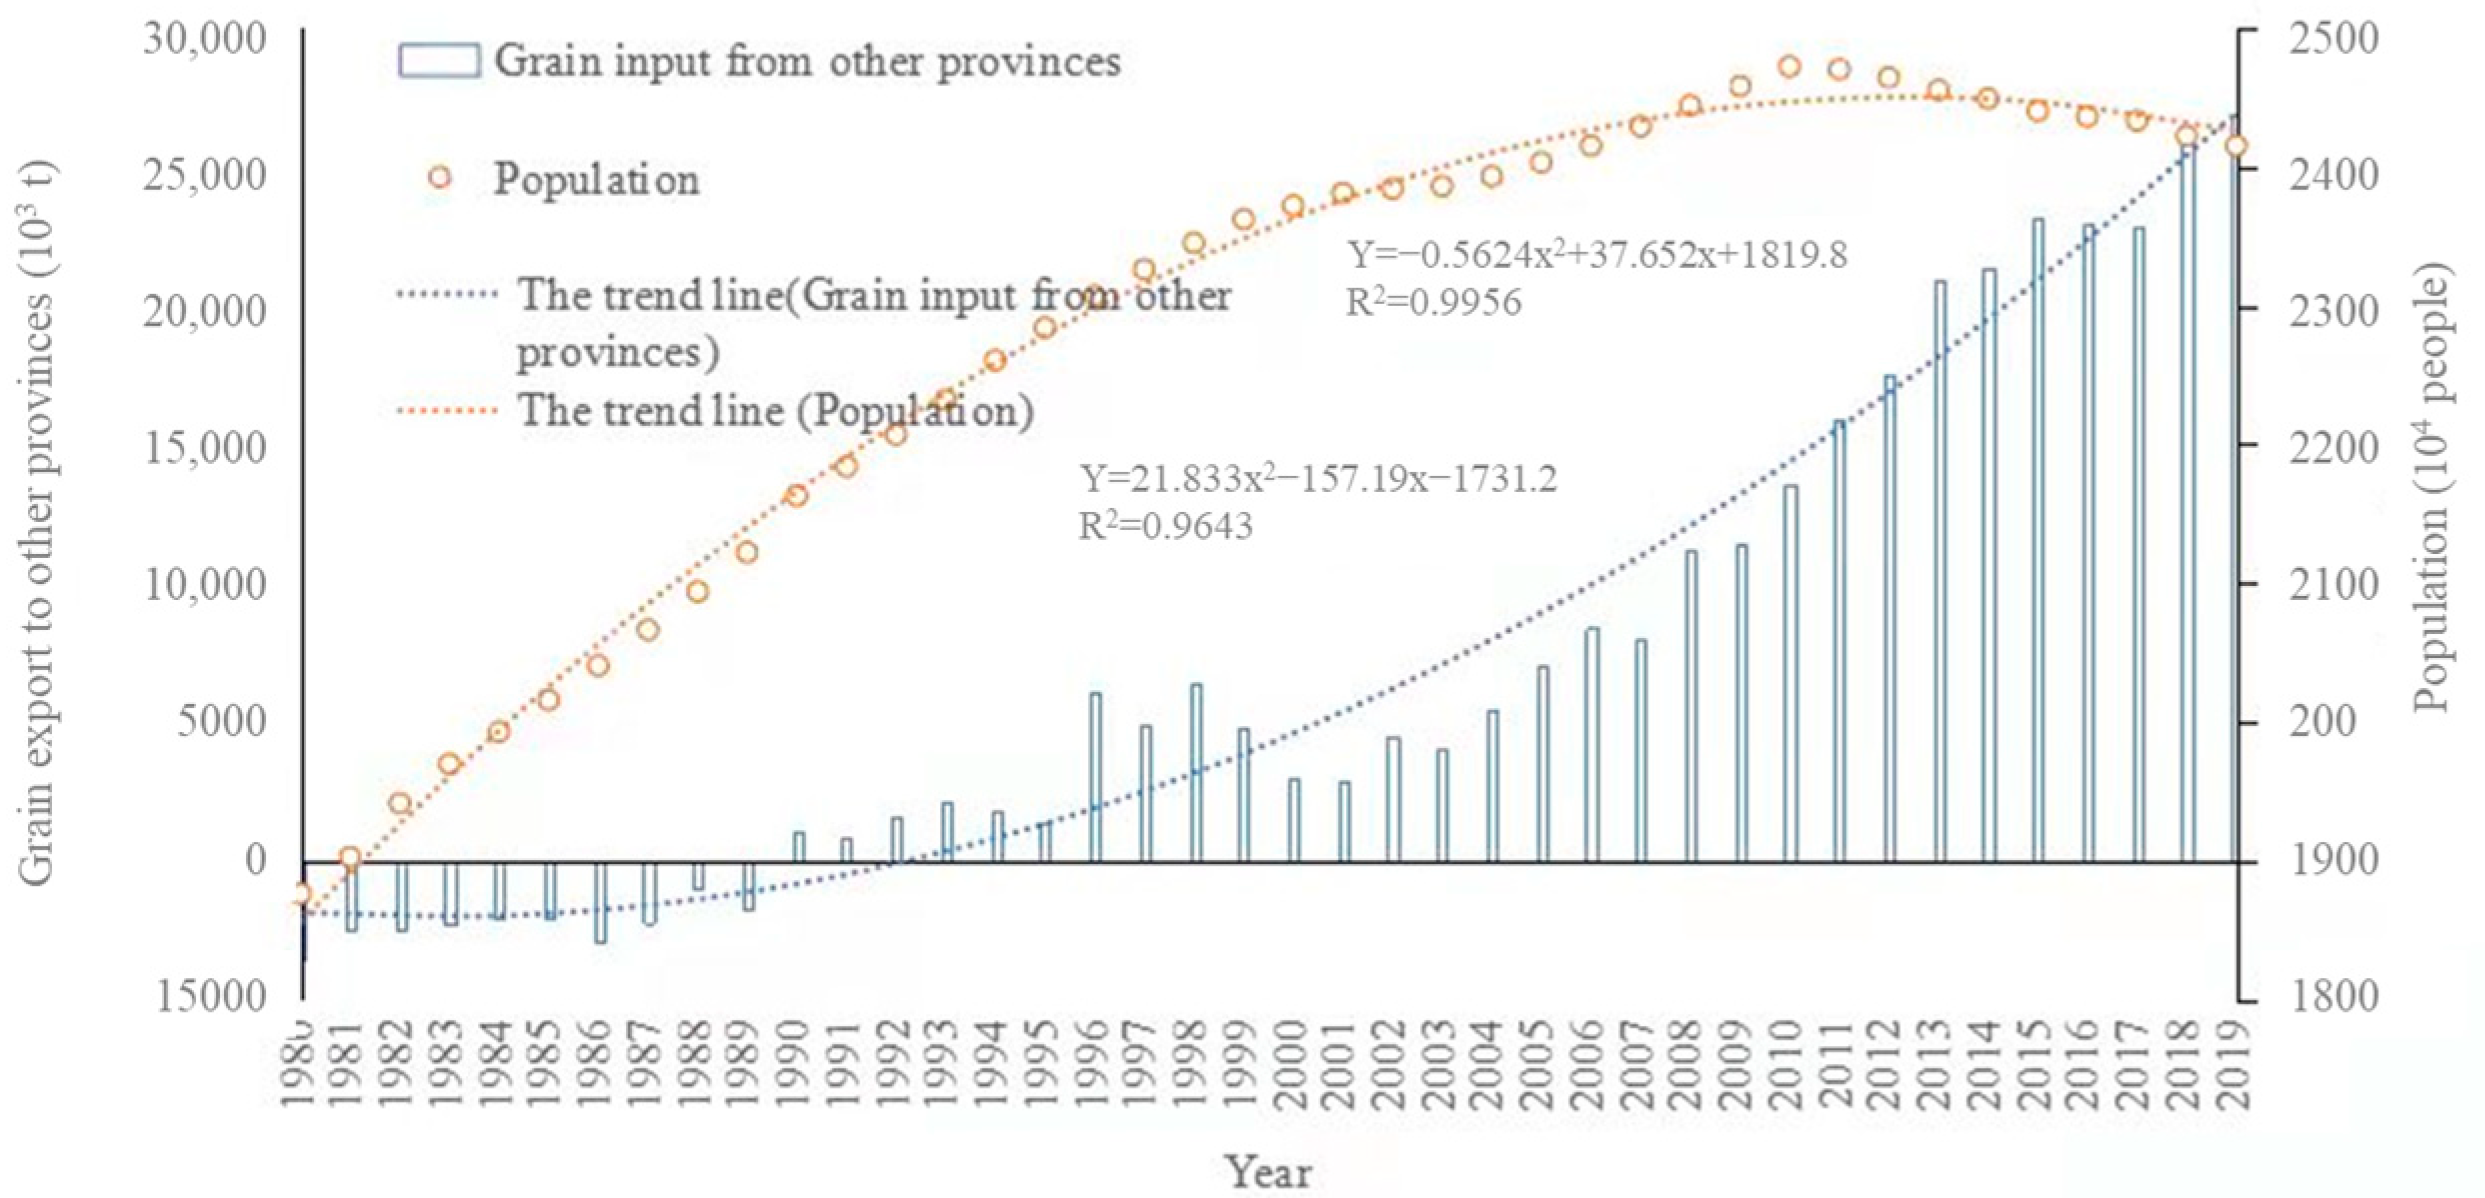
:1. Introduction
2. Materials and Methods
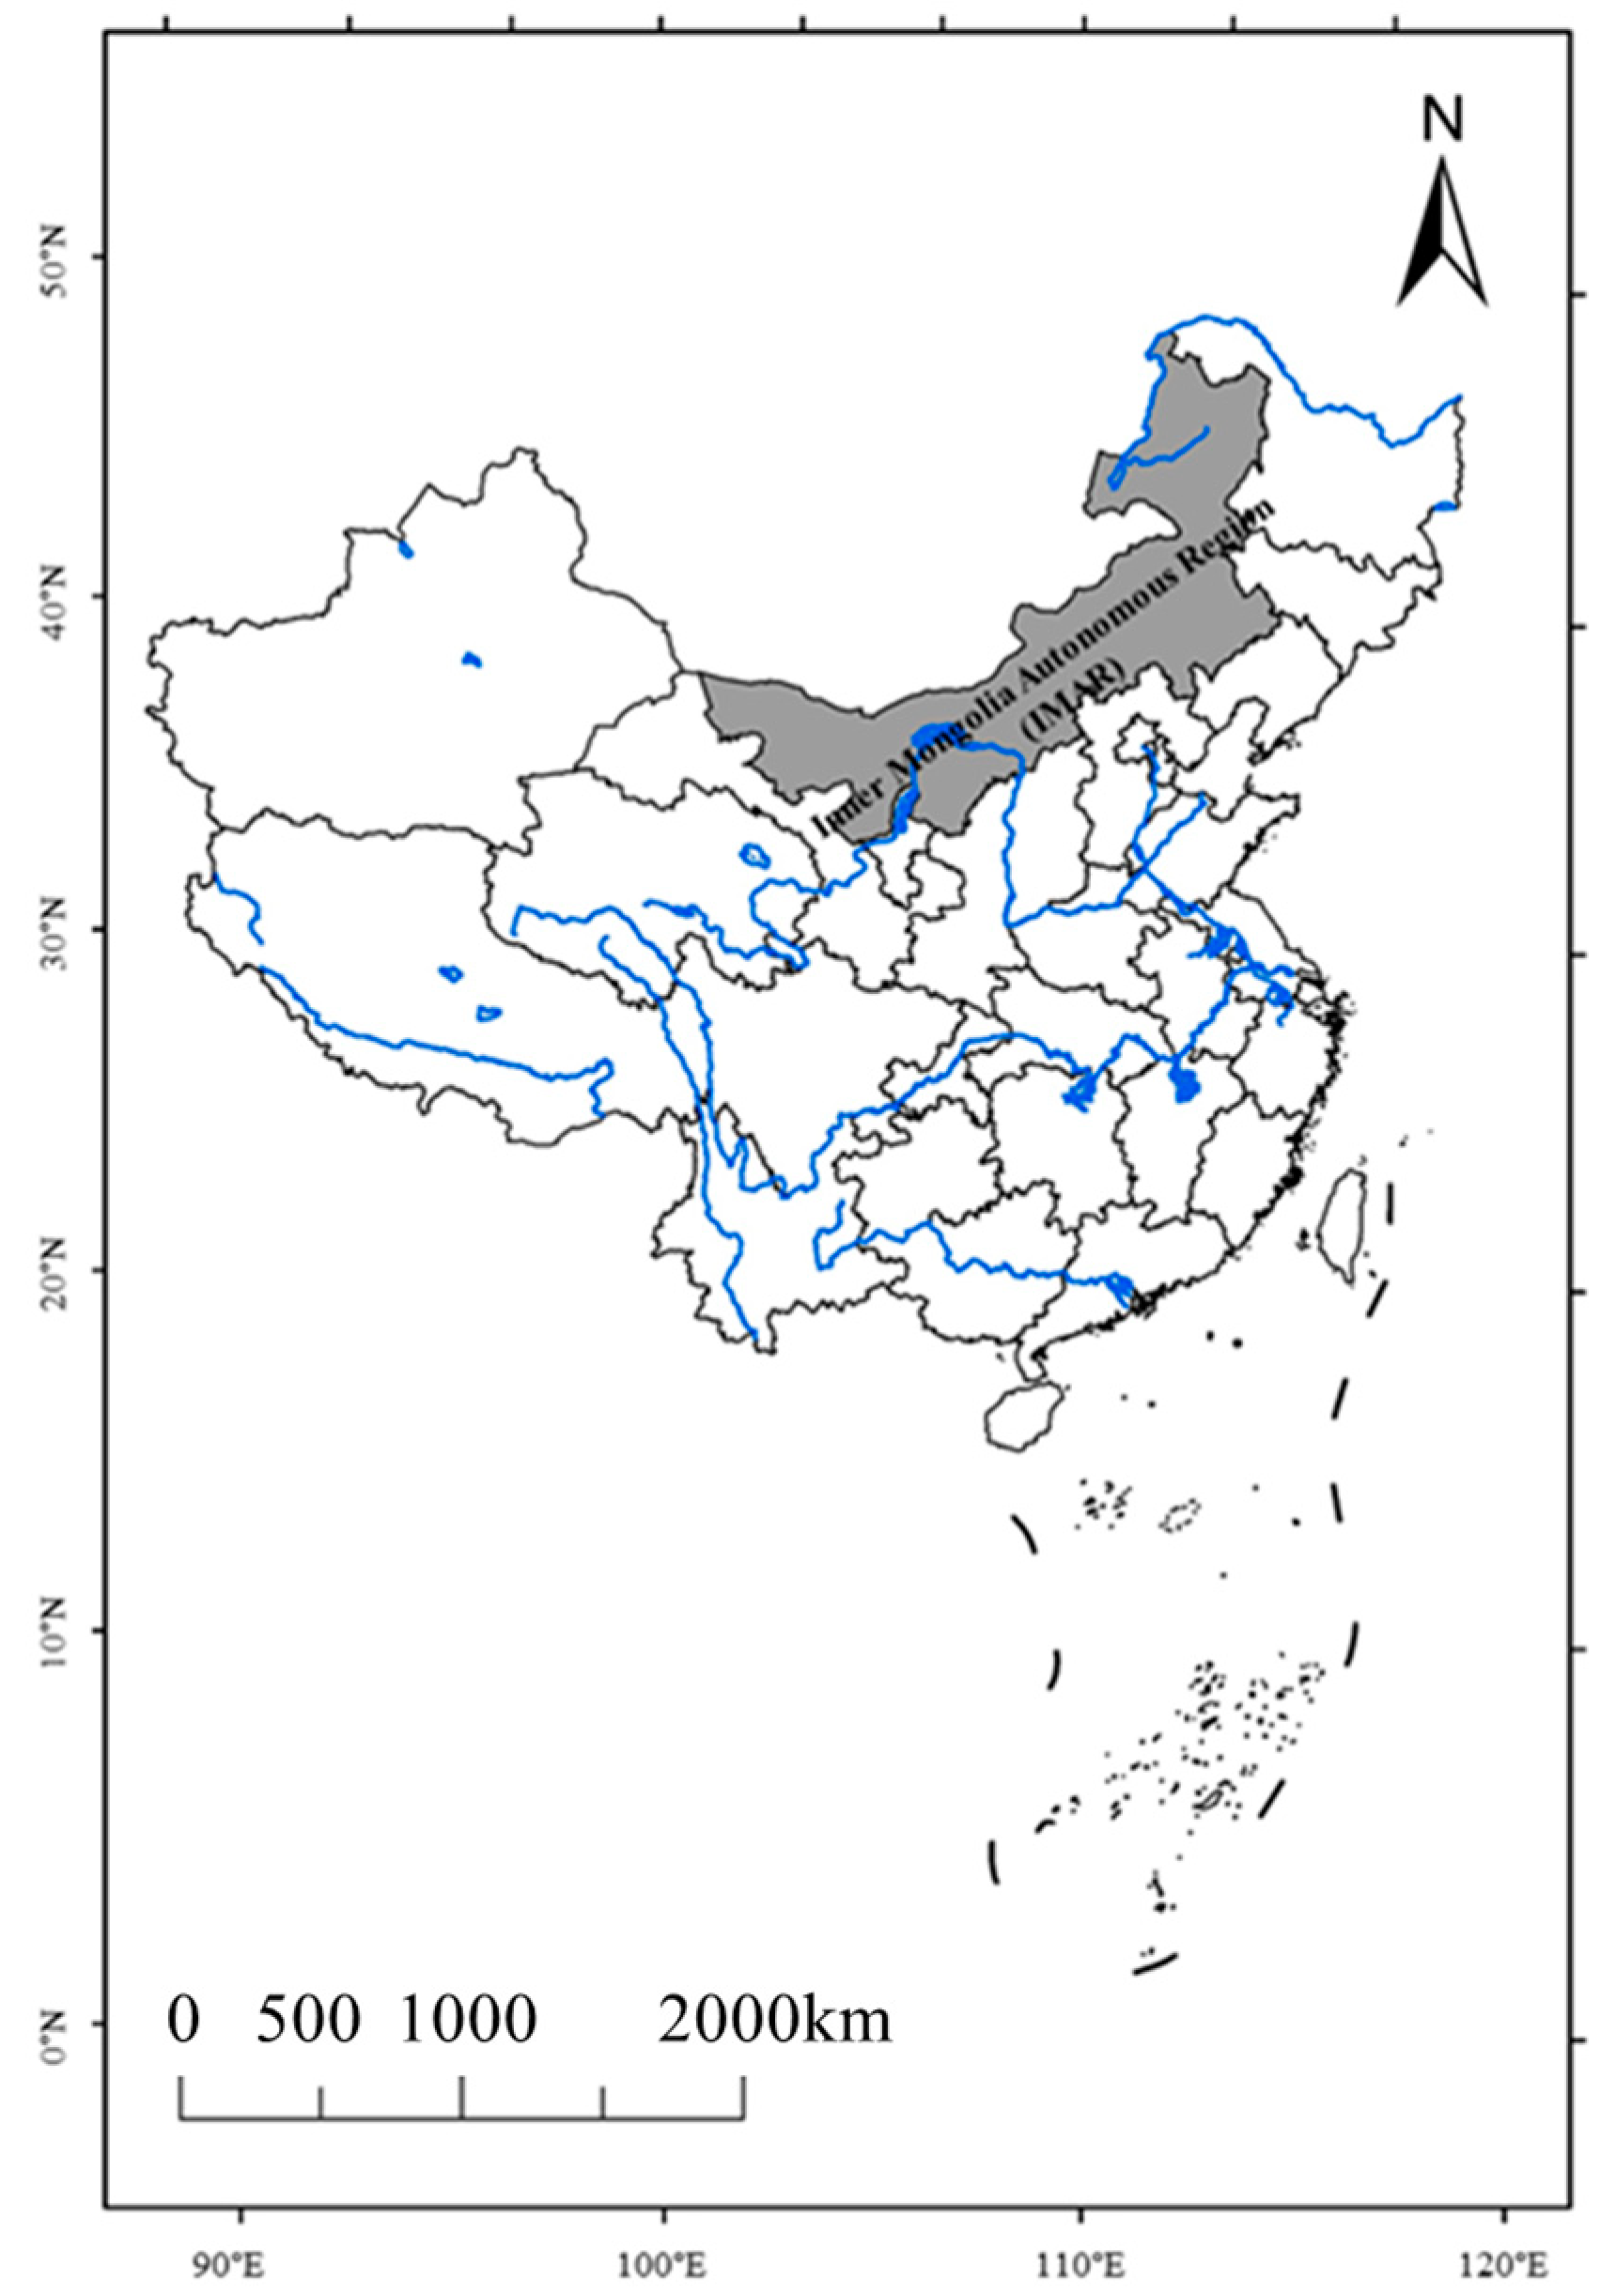
2.1. Study Area
2.2. Data
2.3. Methods
2.3.1. Contribution Rate of Grain Production Increase
2.3.2. Comprehensive Loss Rate of Agrometeorological Hazards
2.3.3. Cobb–Douglas Function
2.4. Statistical Analysis
3. Results
3.1. Change in Grain Production and Contributing Factors
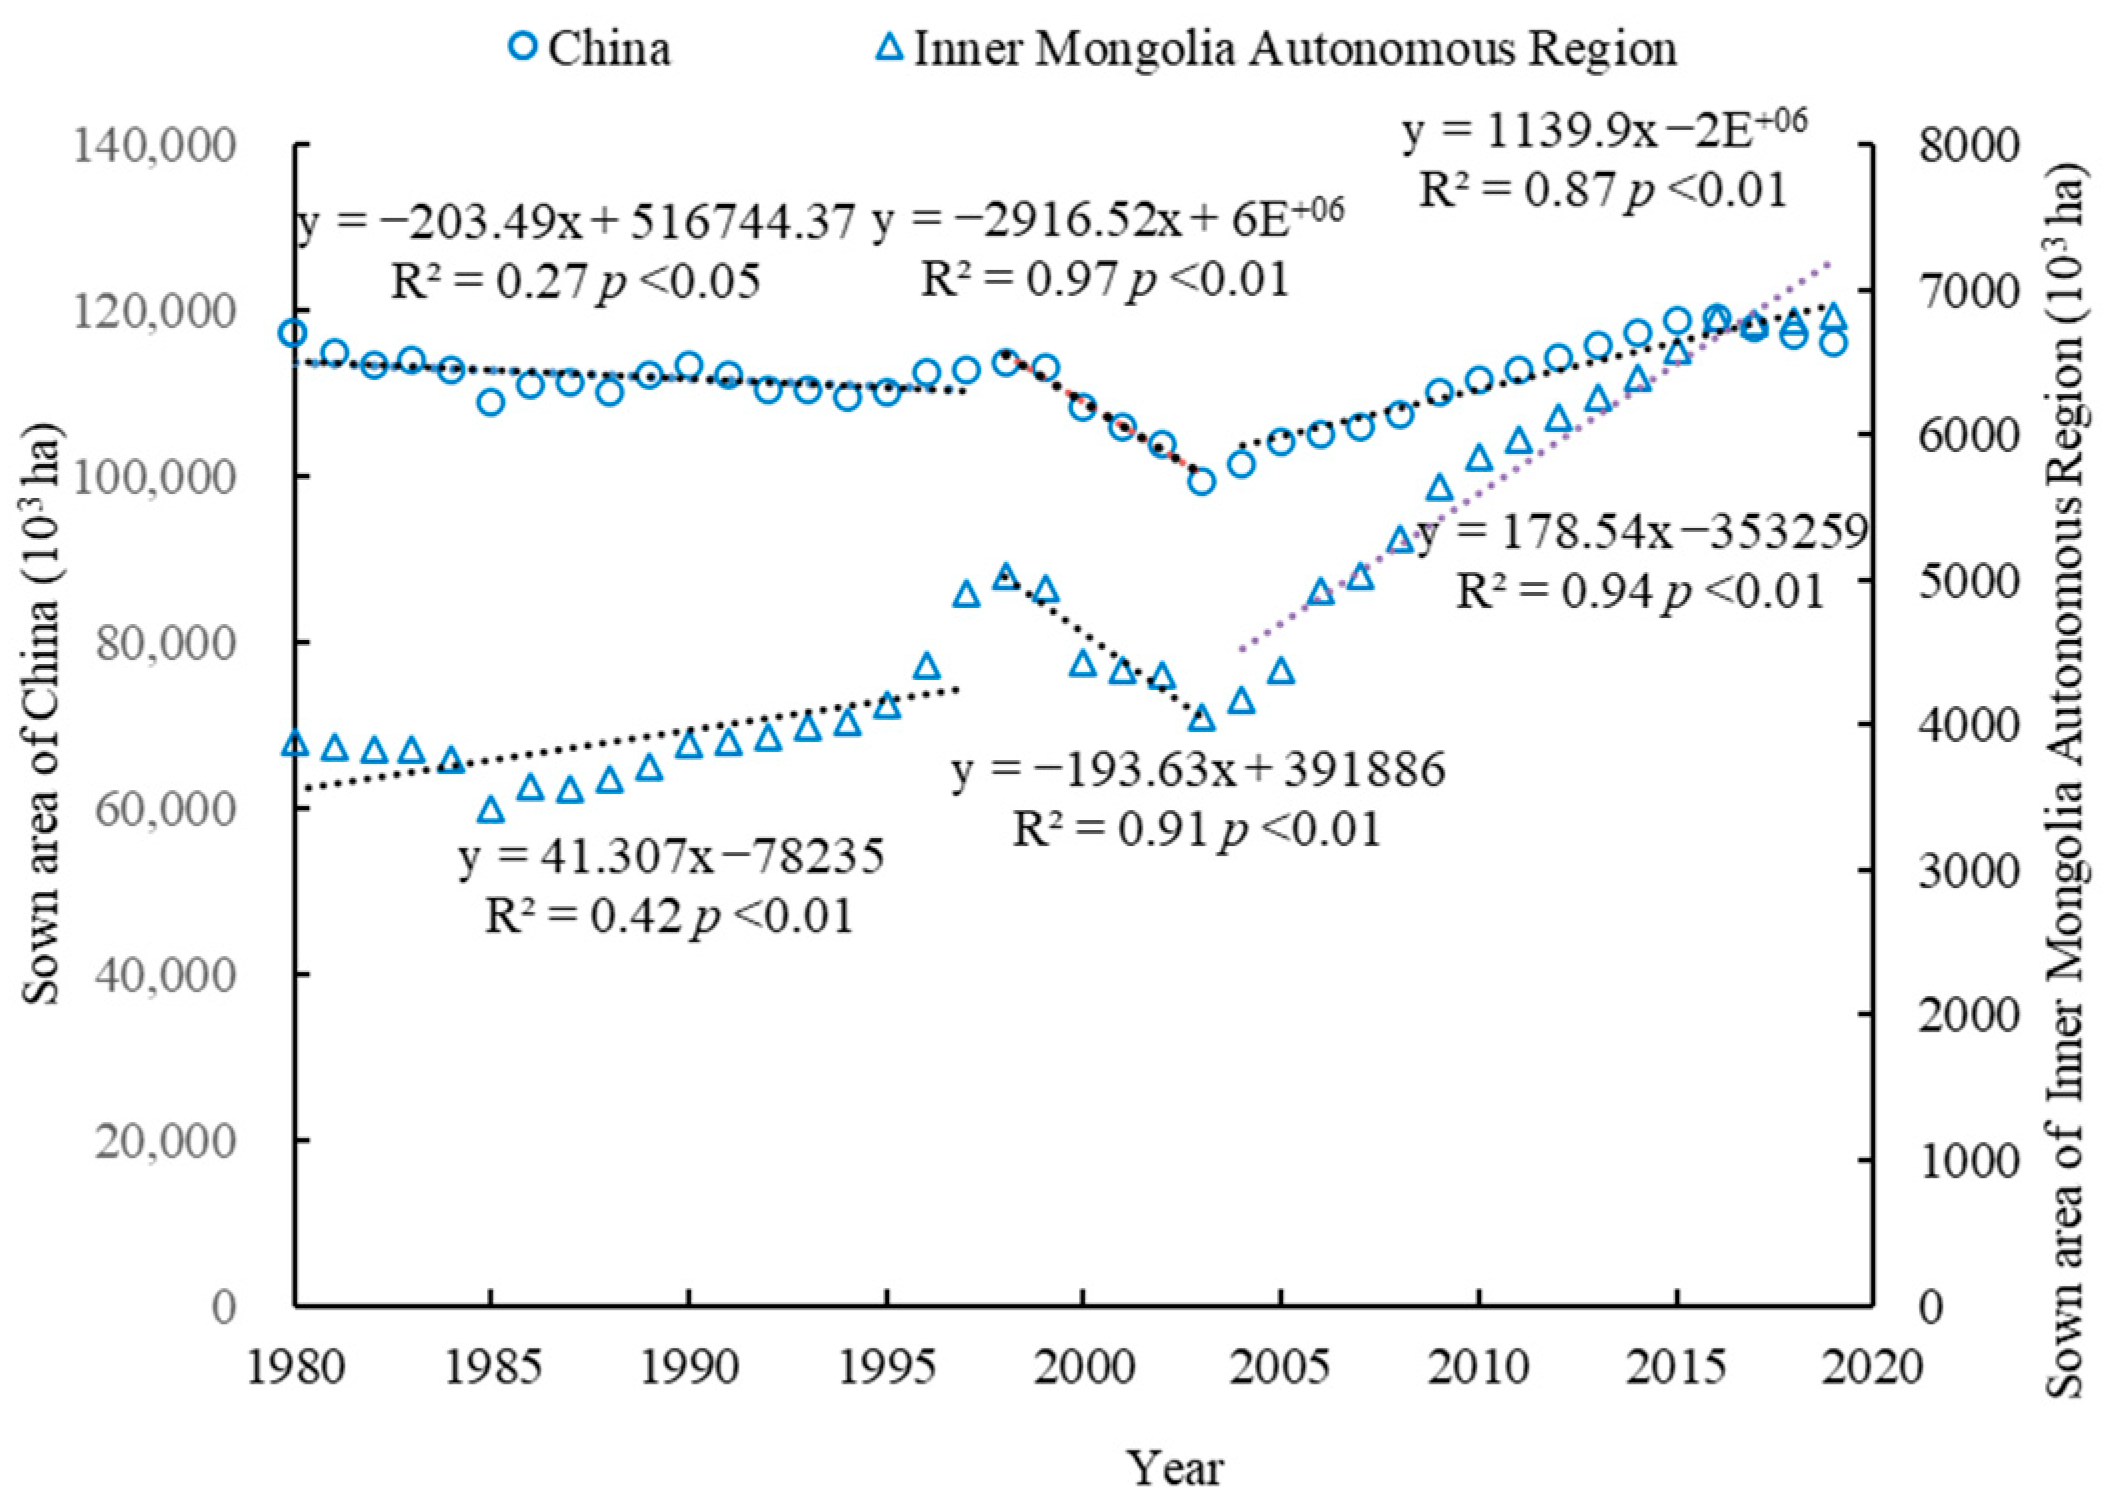
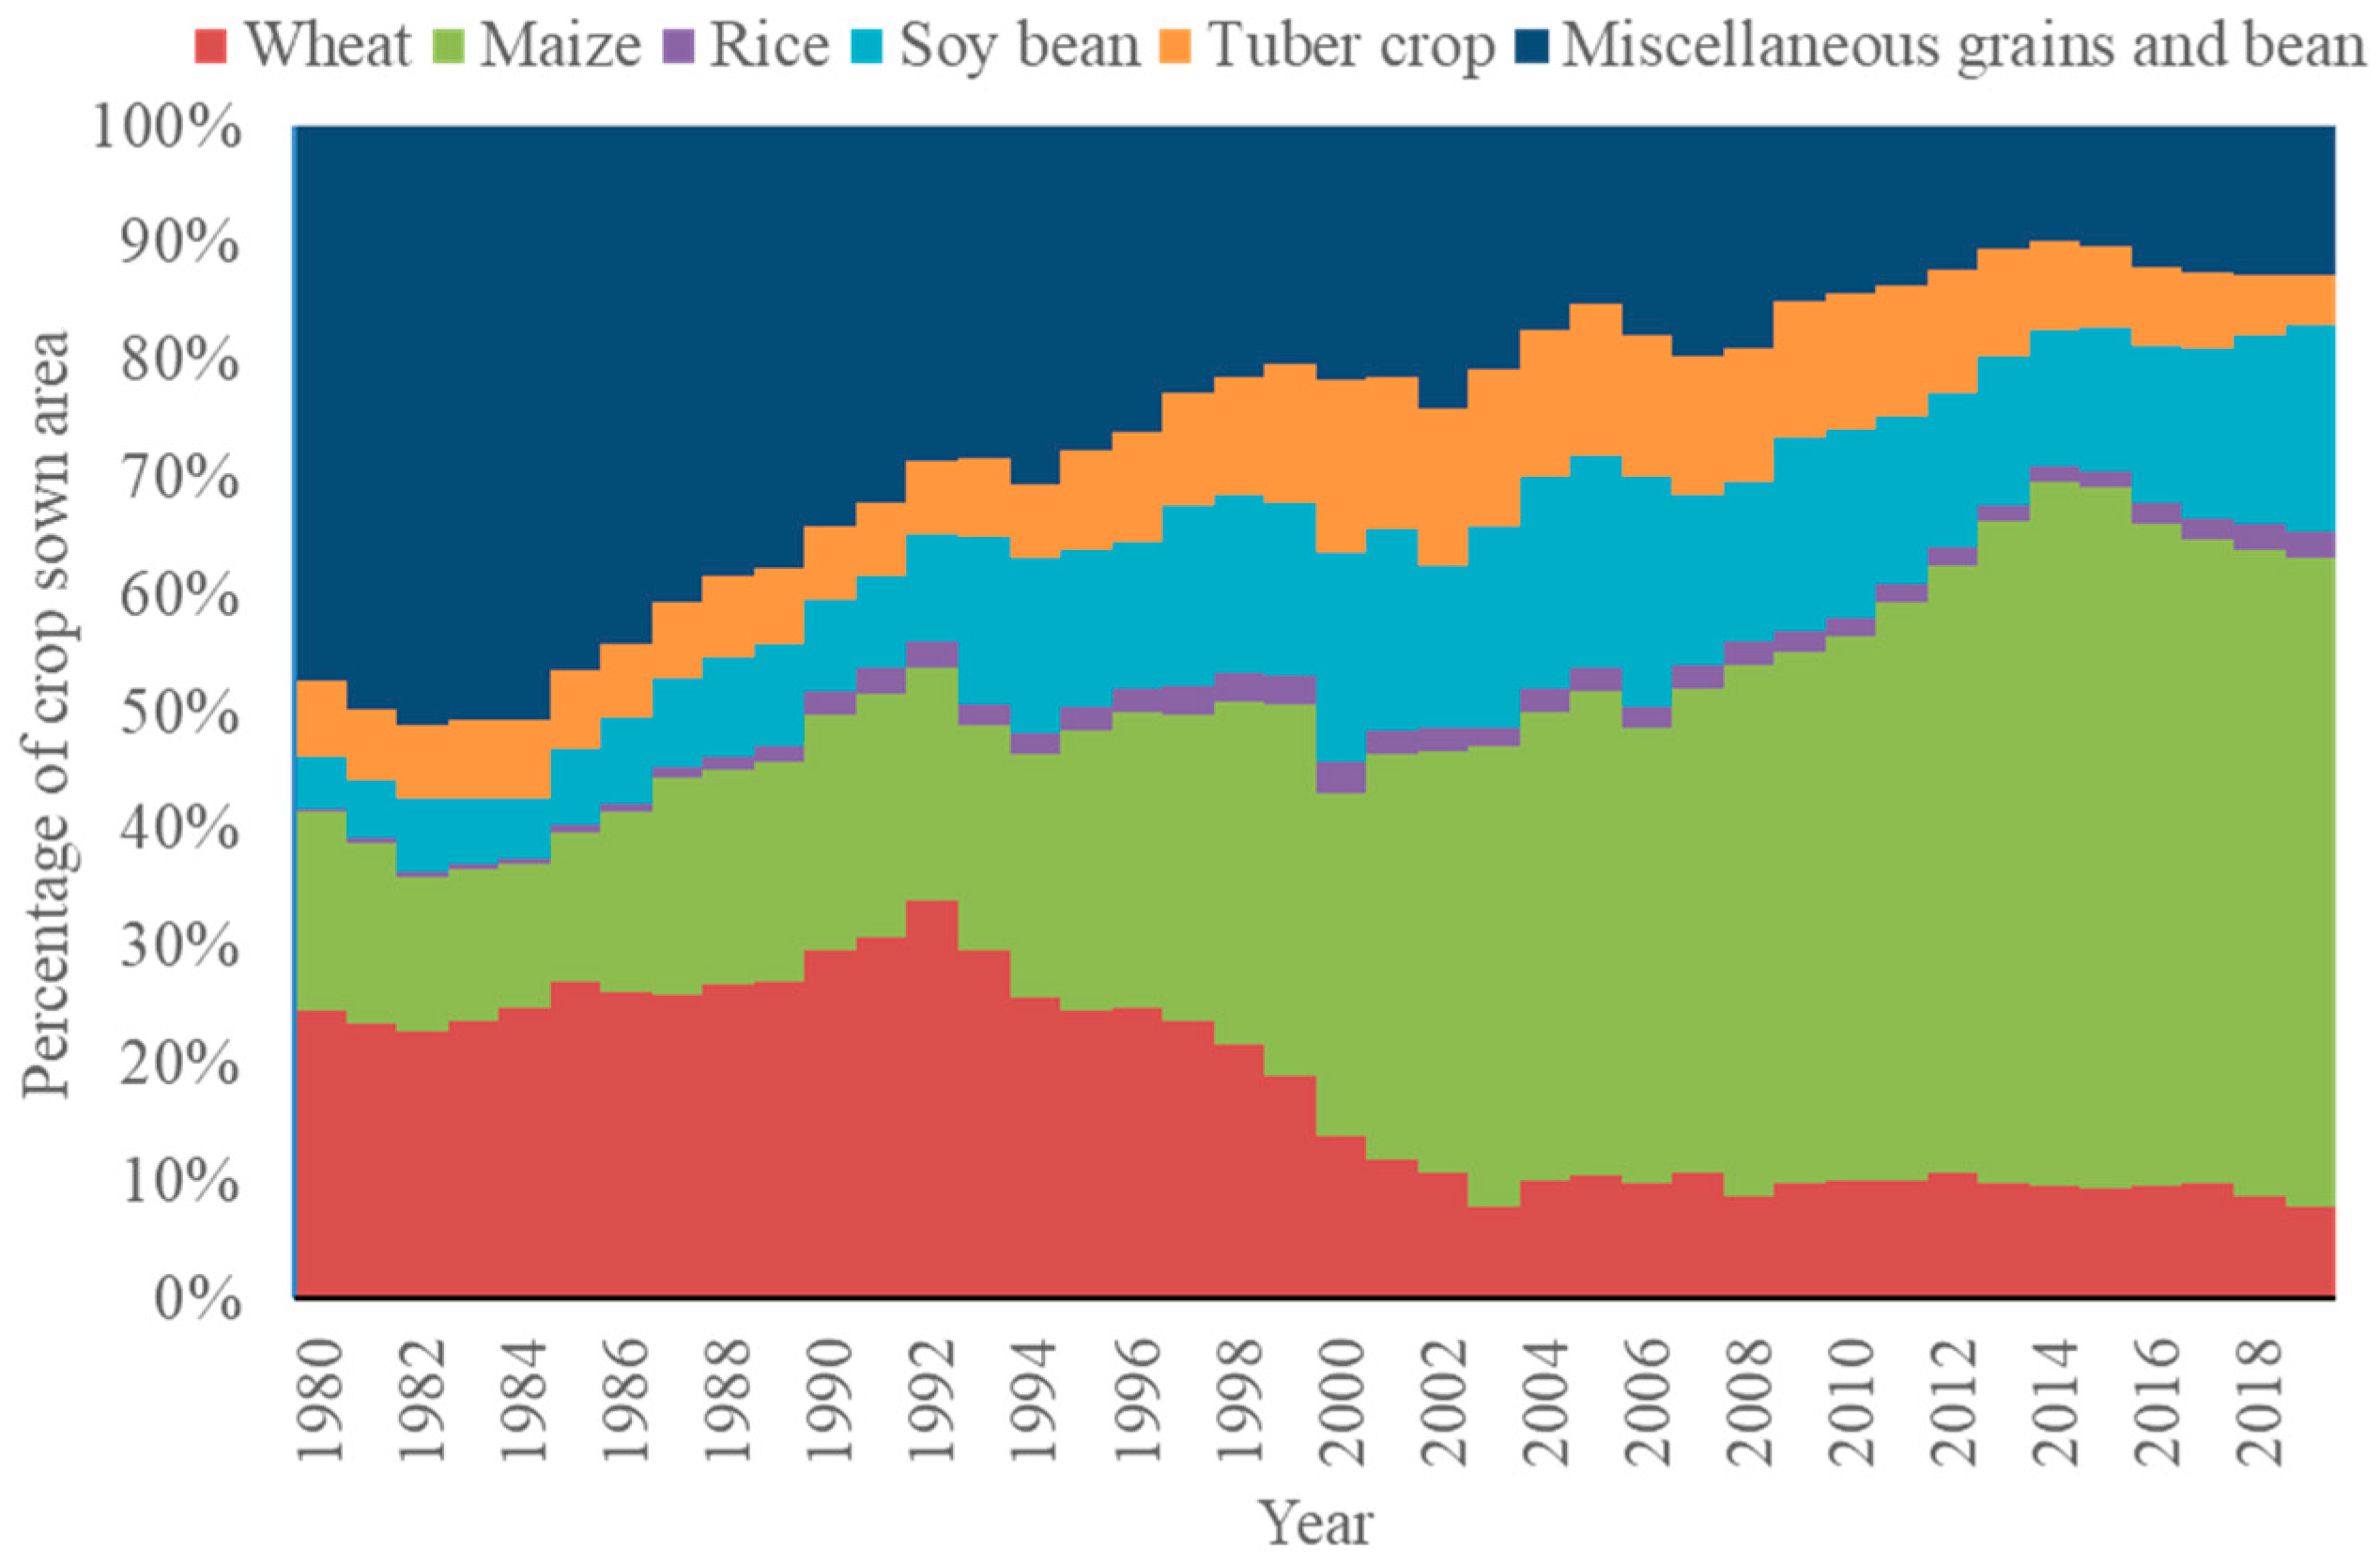
3.1.1. National and Regional Comparison of Change in Grain Crop Sown Area and Planting Structure
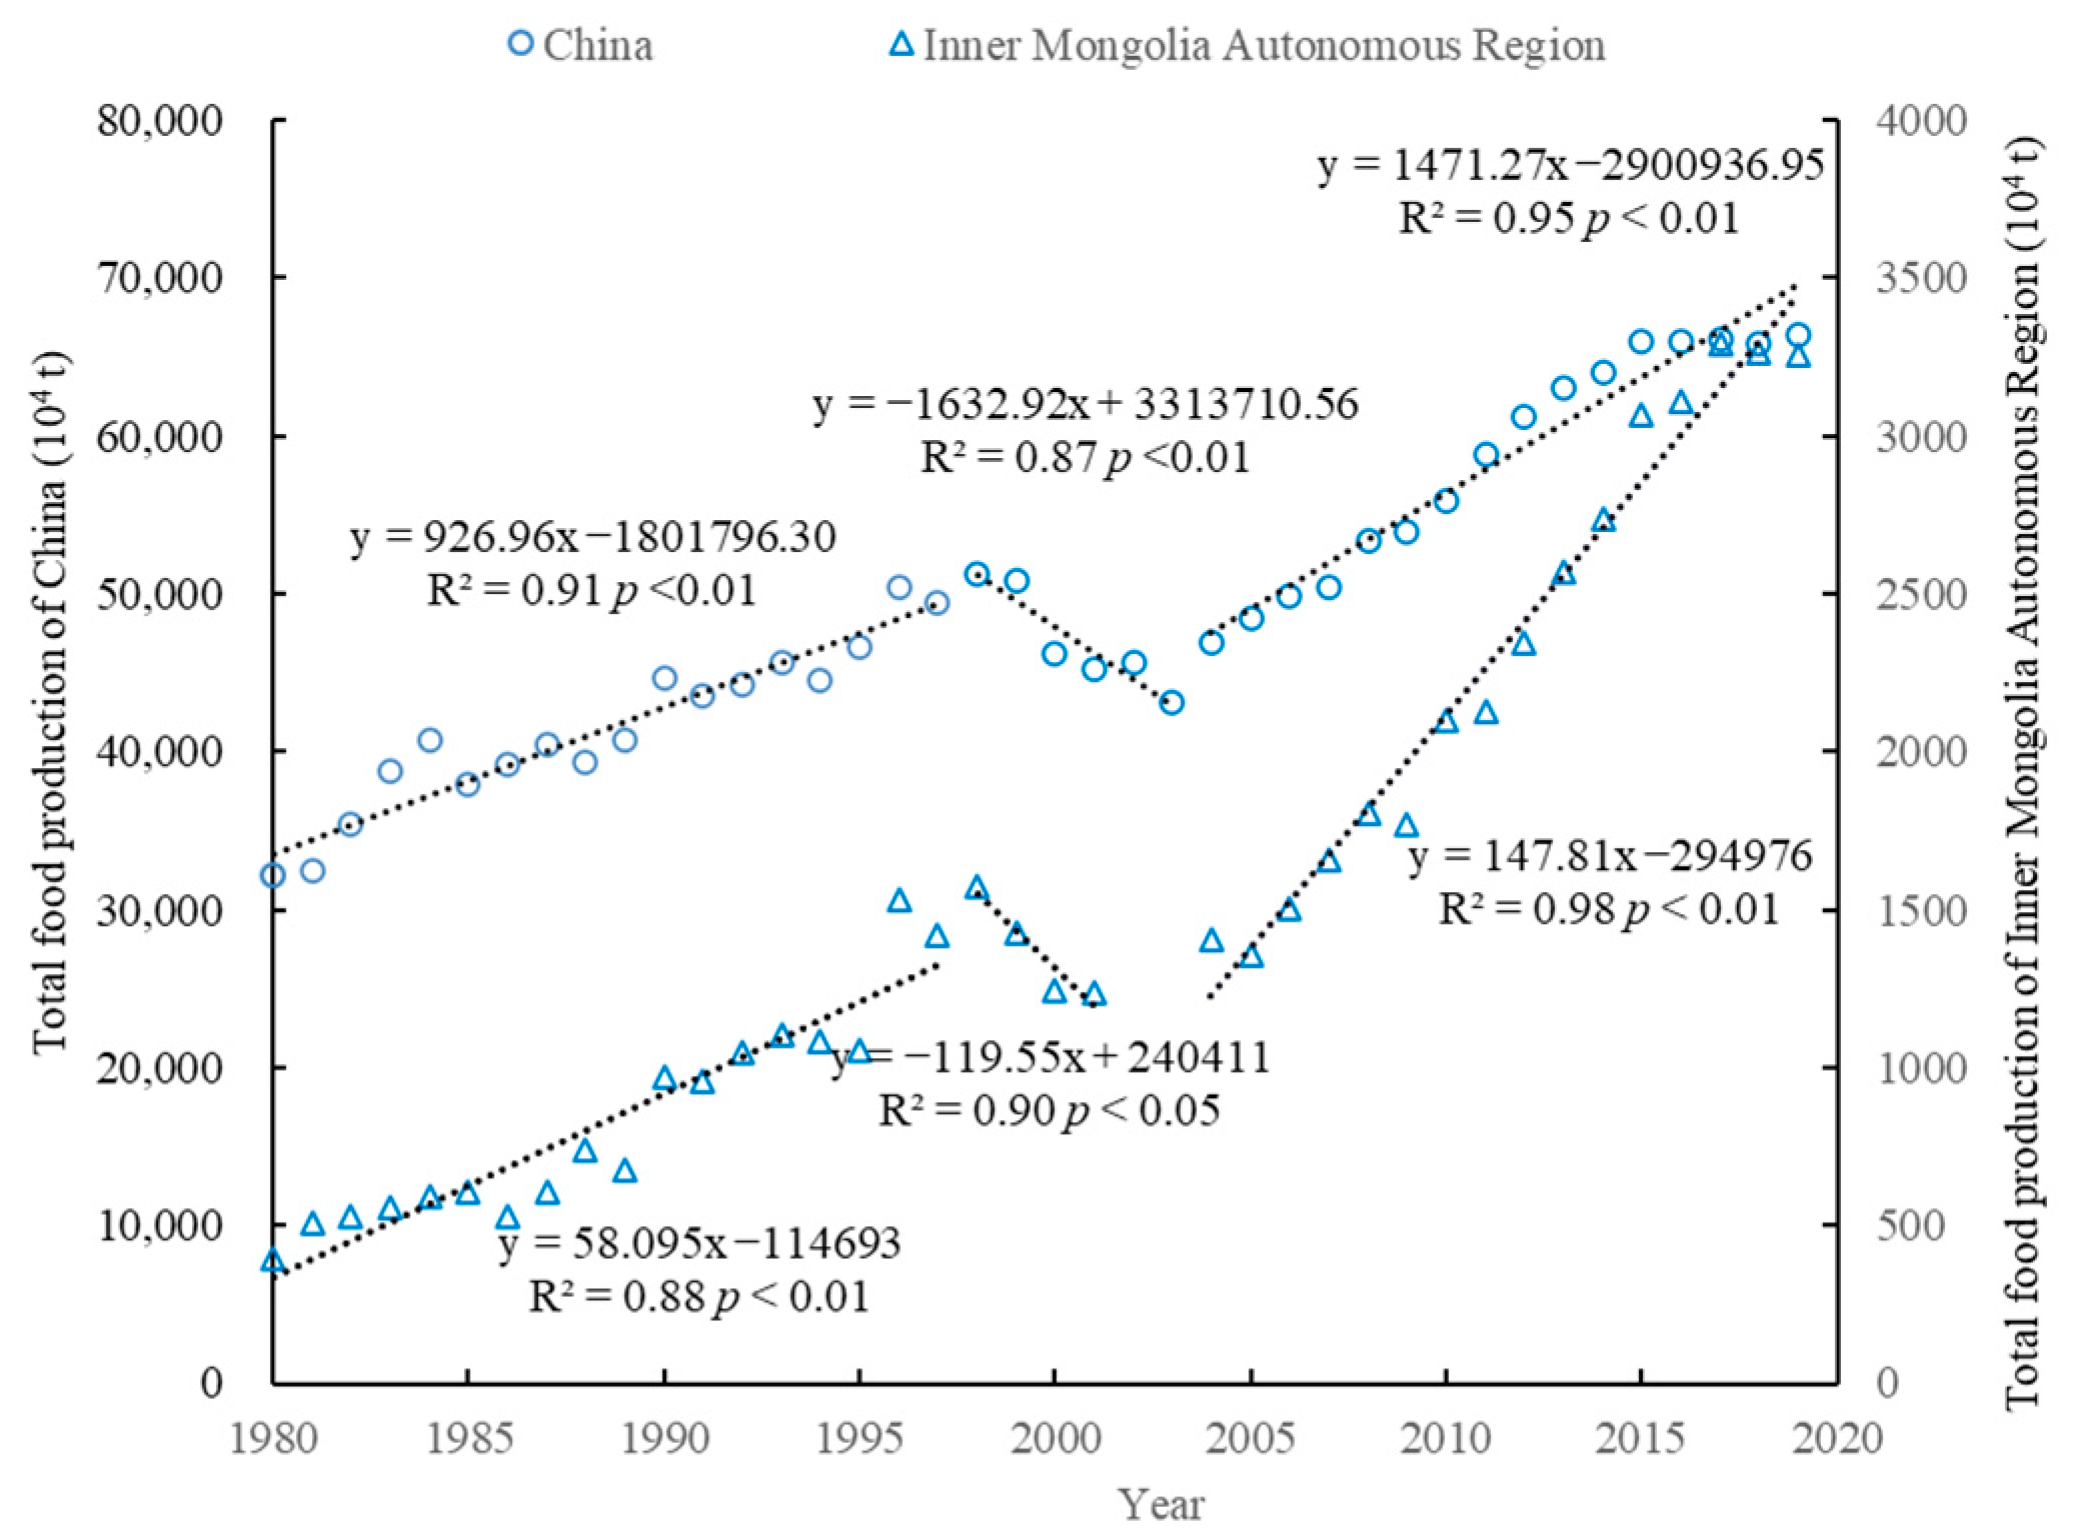
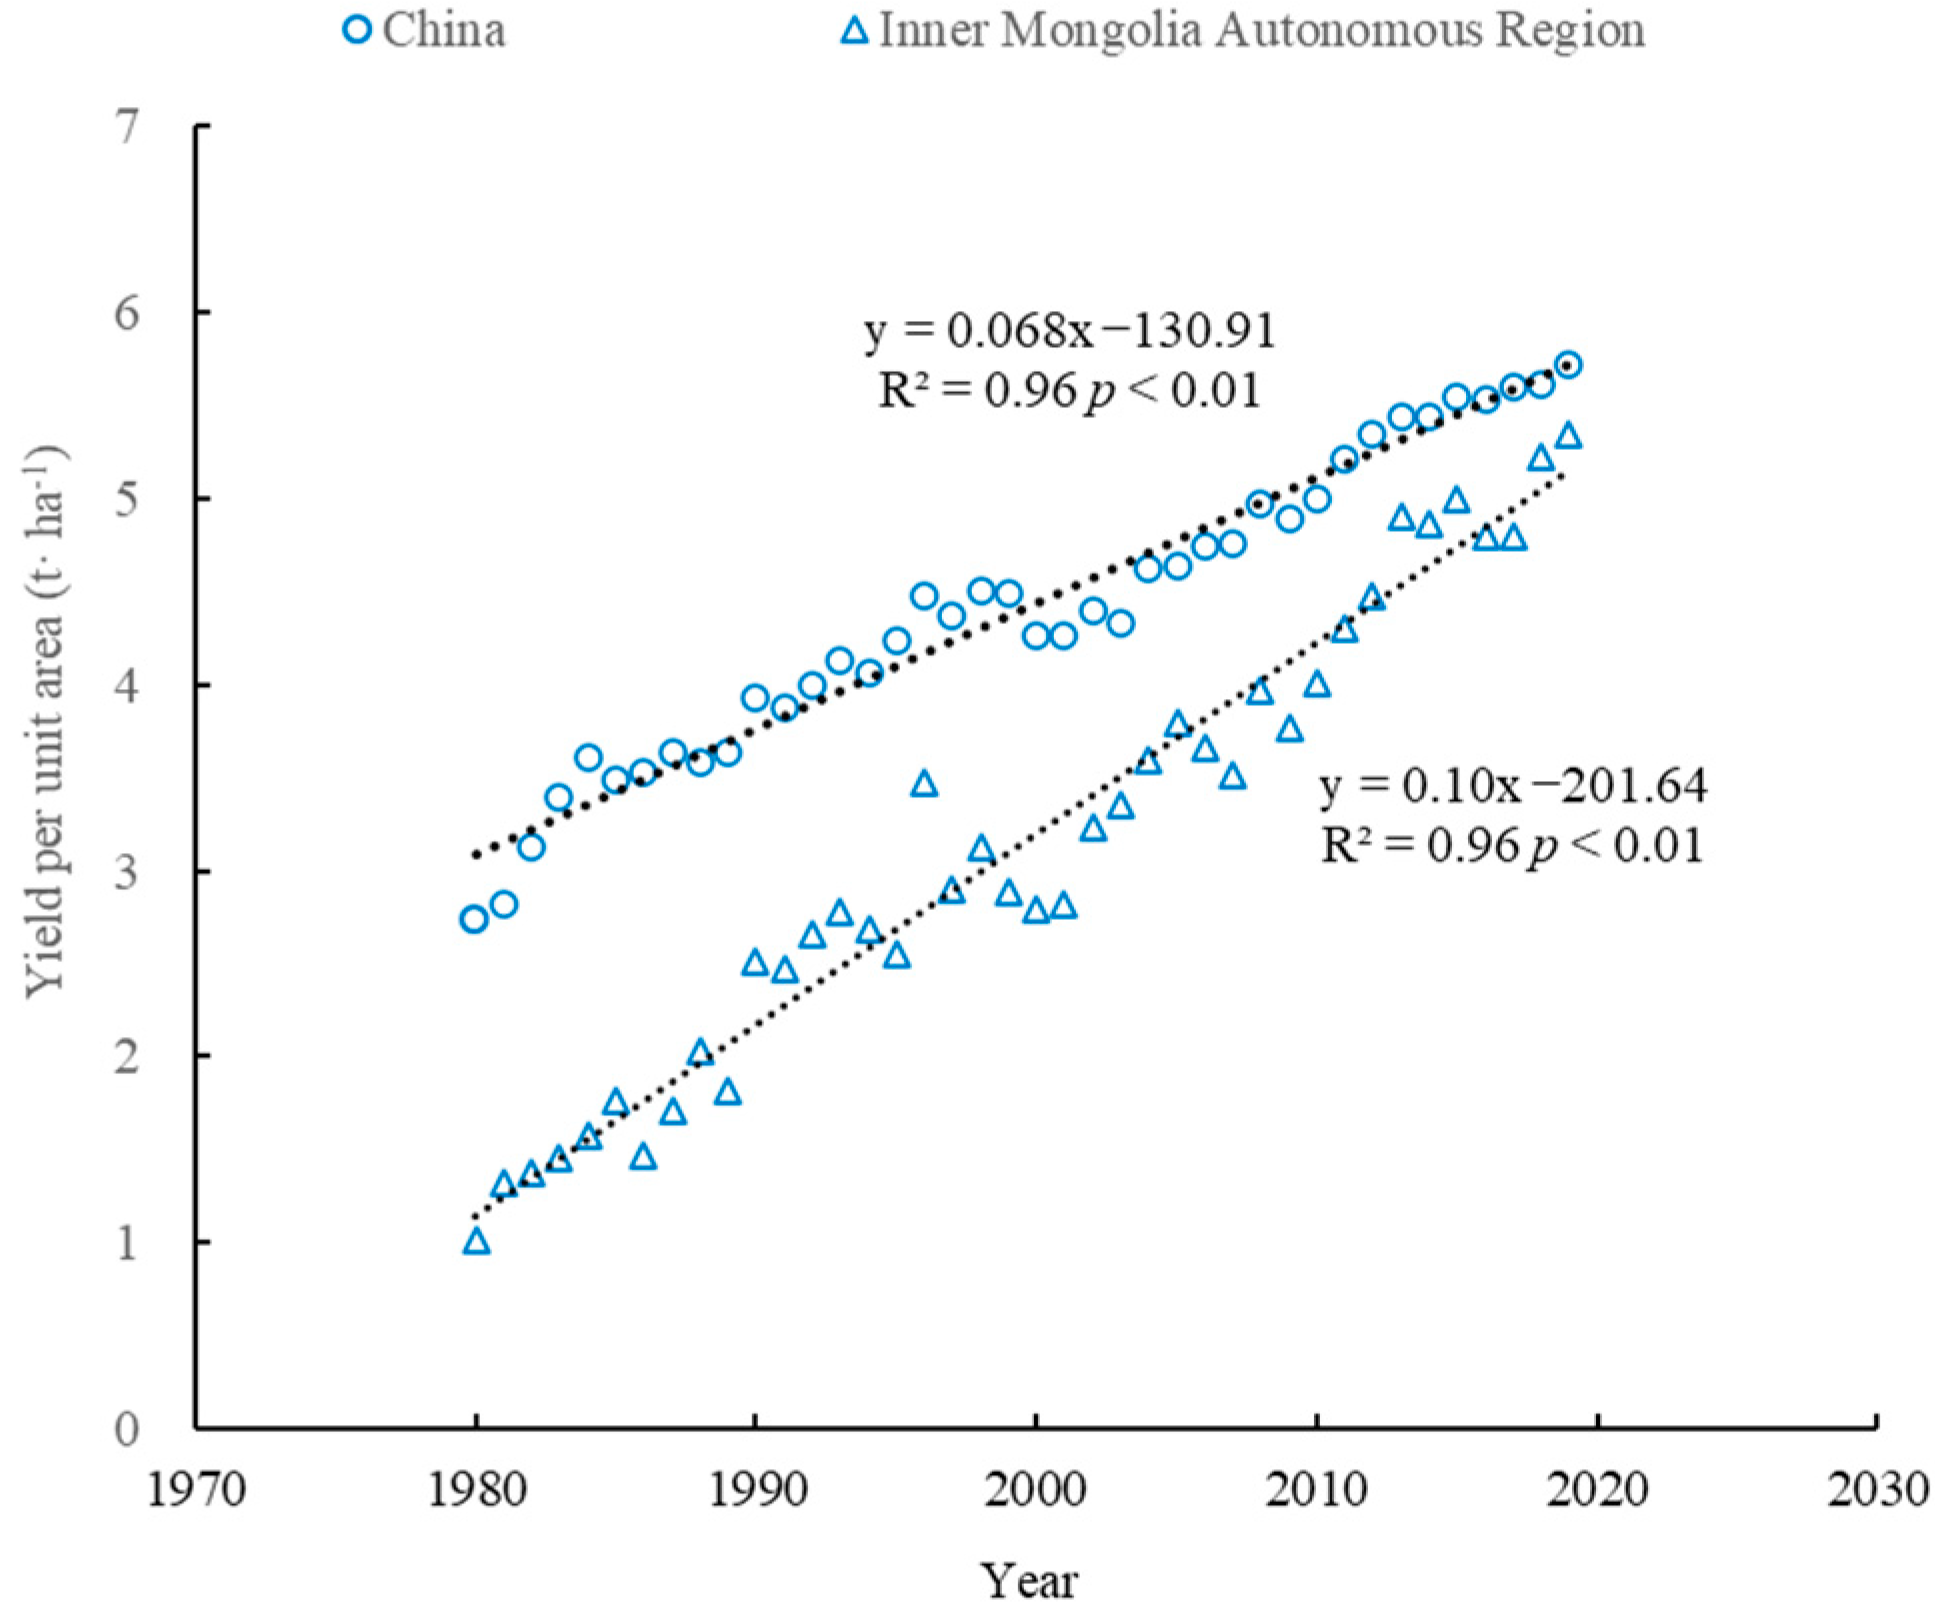
3.1.2. Grain Production and Yield
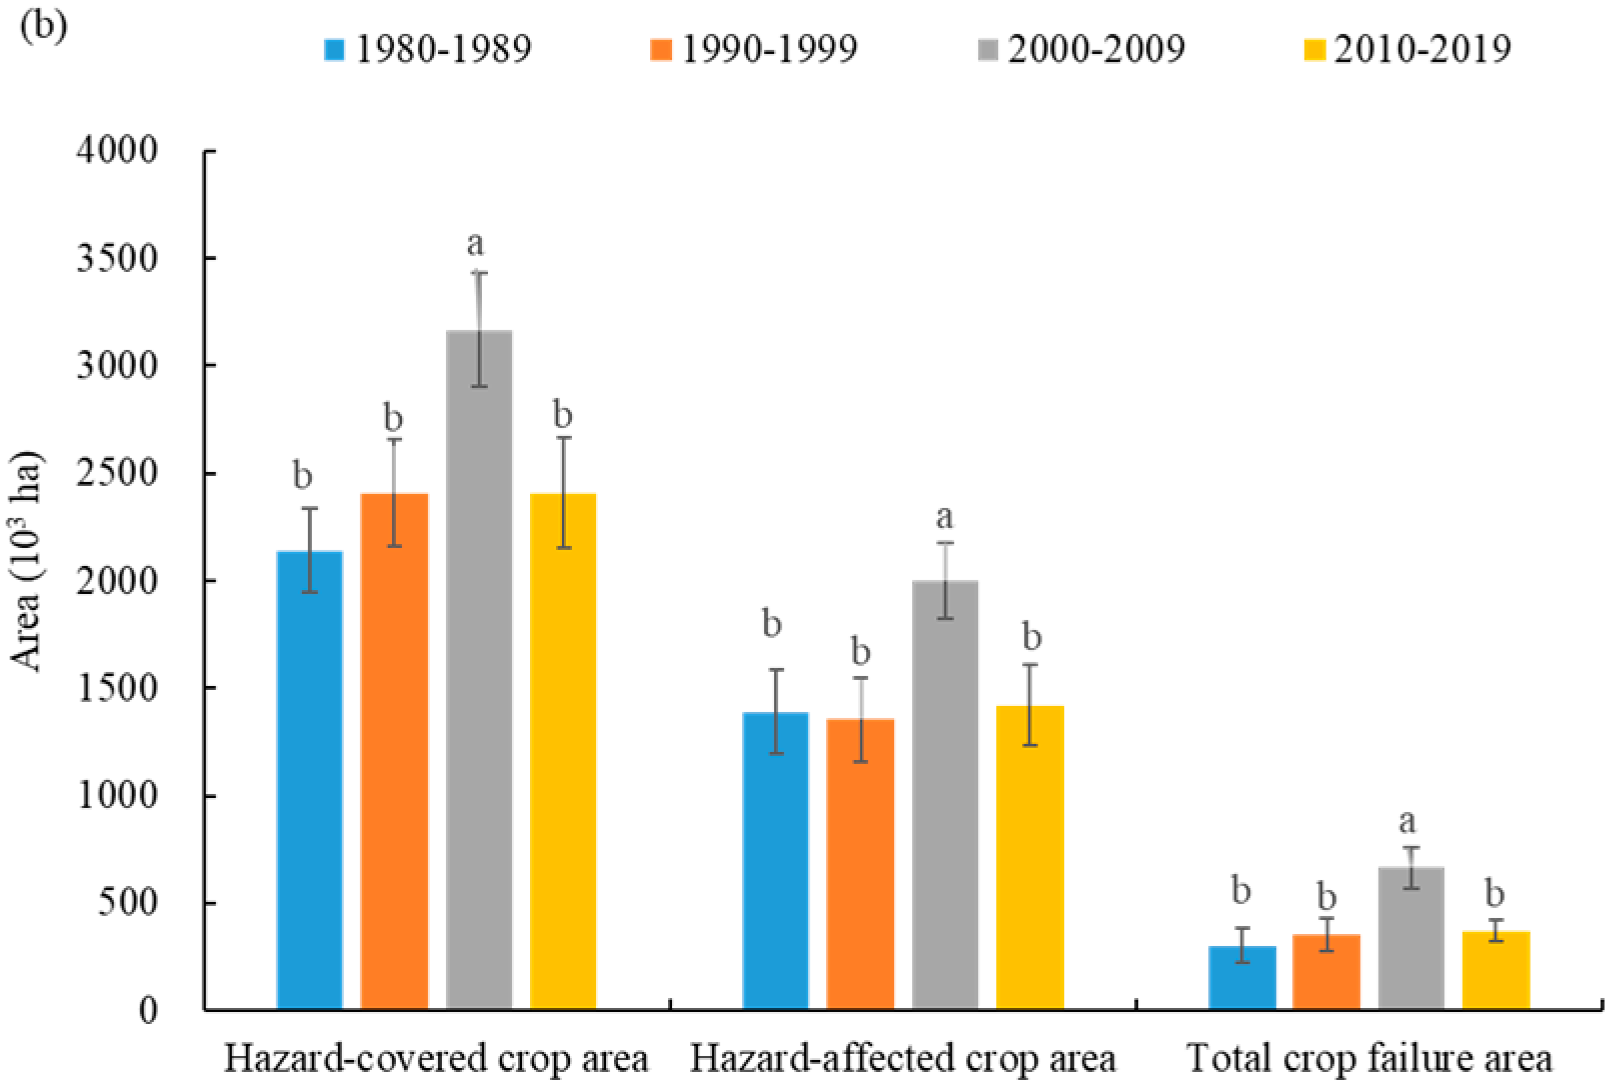
3.1.3. Agrometeorological Hazards
3.2. Contribution Rate of Different Factors Affecting the Grain Production of IMAR
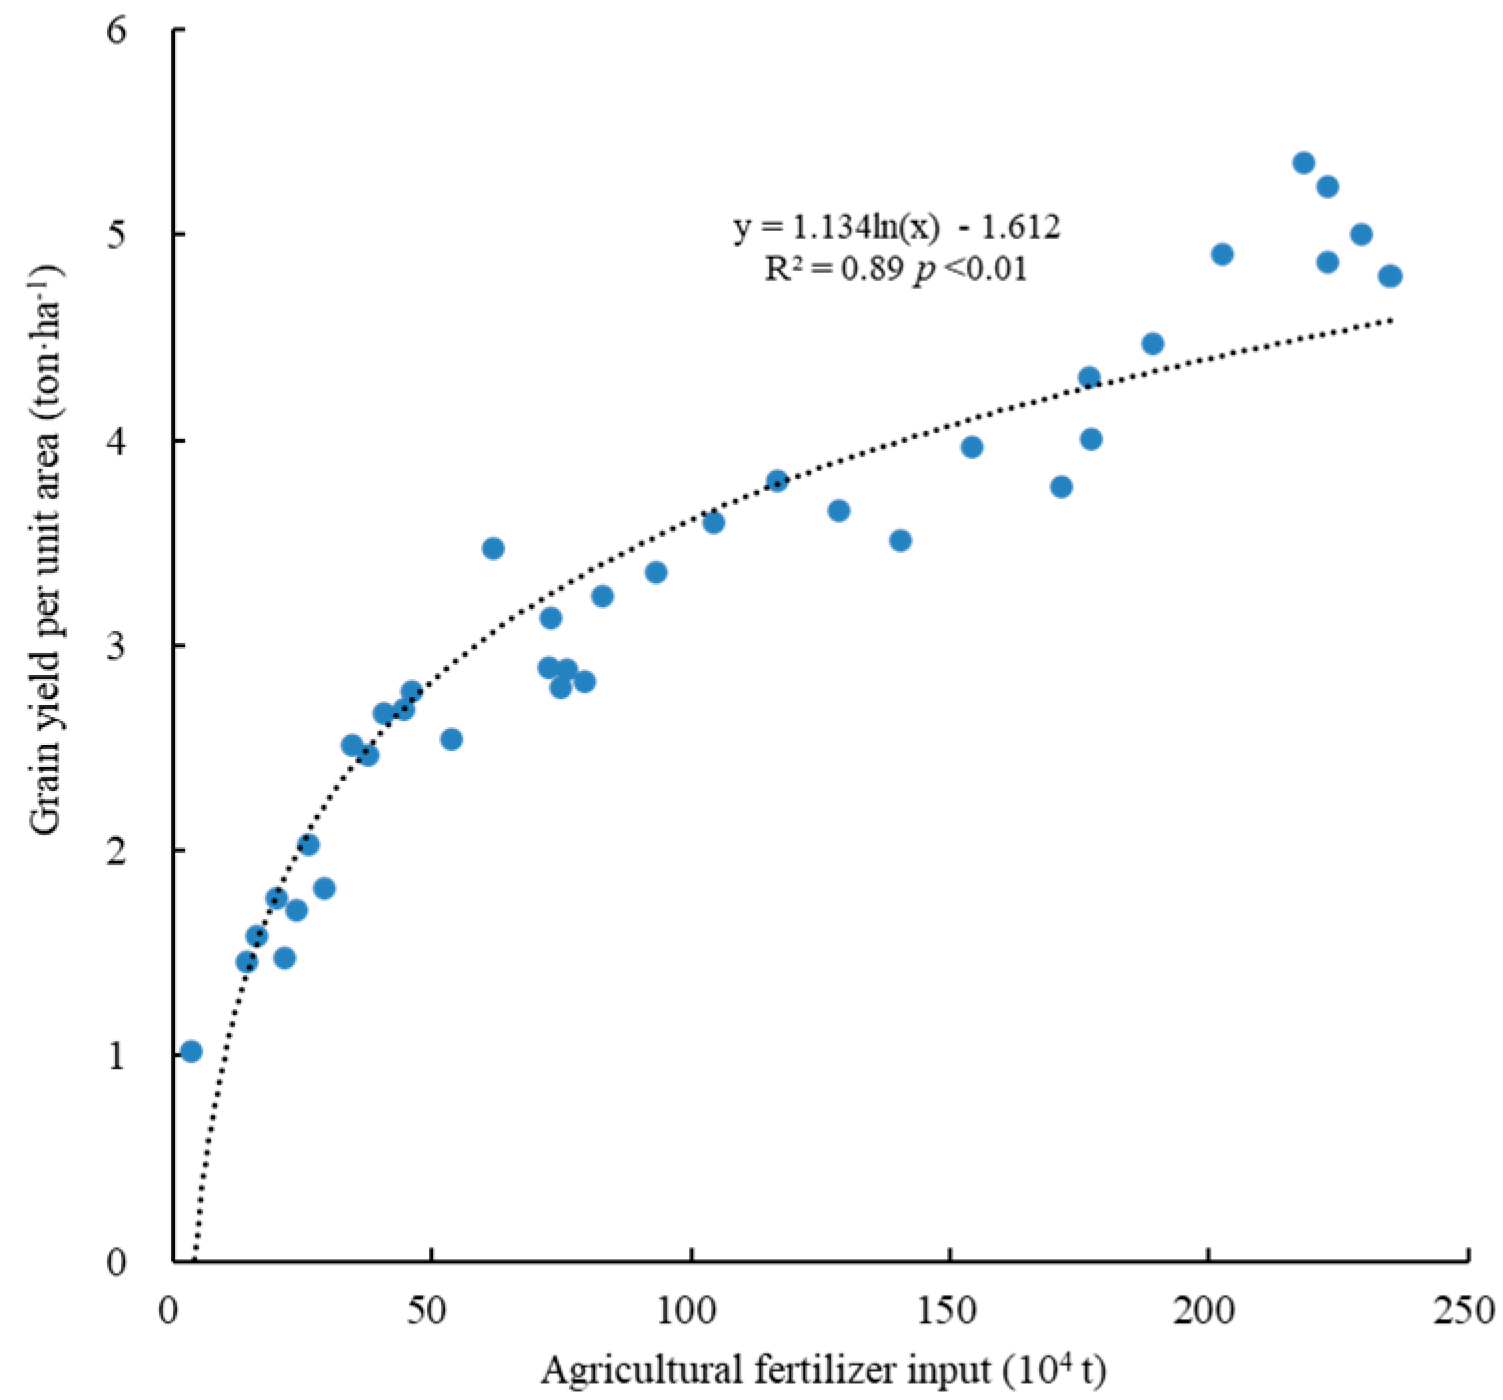
3.3. Influencing Factors of Main Staple Yield of IMAR
4. Discussion
4.1. Effect of Sown Area on the Change in Grain Production
4.2. Effect of Yield and Plantation Structure on the Change of Grain Production
4.3. Change of Yield and Influencing Factors
5. Sources of Uncertainties
6. Conclusions
Author Contributions
Funding
Conflicts of Interest
References
- Brandt, L.; Rawski, G.T. China’s Great Transformation; Cambridge University Press: Cambridge, UK, 2008. [Google Scholar]
- McMillan, J.; Whalley, J.; Zhu, L.J. The Impact of China’s economic reforms on agricultural productivity growth. J. Policy Econ. 1989, 97, 781–807. [Google Scholar] [CrossRef]
- Garnaut, R.; Song, L.G. China, Twenty Years of Economic Reform; Australian National University, National Centre for Development Studies: Canberra, ACT, Australia, 1999; p. 66. [Google Scholar]
- Yu, C.Q.; Huang, X.; Chen, H.; Huang, G.; Ni, S.Q.; Wright, S.J.; Hall, J.; Ciais, P.; Zhang, J.; Xiao, Y.C.; et al. Assessing the impacts of extreme agricultural droughts in China under climate and socioeconomic changes. Earth Future 2018, 6, 689–703. [Google Scholar] [CrossRef]
- Qi, Z.H.; Yu, H.W.; Wang, P.C.; Ran, C.Y.; Wang, R.D. Technical selection of rational farmers in grain production under immature factor market: A case study of rice varieties in Hubei Province. Econ. Rev. 2009, 6, 93–100, (In Chinese with English abstract). [Google Scholar]
- Liu, Z.; Huang, F.; Li, B.G. Investigating contribution factors to China’s grain output increase in period of 2003 to 2011. Trans. CSAE 2013, 29, 1–8, (In Chinese with English abstract). [Google Scholar]
- Deng, X.Z.; Huang, J.K.; Scott, R. Change of cultivated land and its impacts on agricultural bio productivity in China: Implications to national grain security. Chin. Soft Sci. 2005, 5, 65–70, (In Chinese with English abstract). [Google Scholar]
- Lu, W.C.; Mei, Y.; Li, Y.L. Regional change in China’s grain production: Effects of labor-land ratio off-farm employment opportunities and labor Compensation. Chin. J. Popul. Sci. 2008, 3, 20–28+95, (In Chinese with English abstract). [Google Scholar]
- Liu, Y.; Zhang, F.R.; Xie, Z.; Zhang, T.Z. Evolution of Spatial-temporal characteristics of grain production in China from the perspective of arable land use. J. Chin. Agric. Univ. 2019, 24, 173–182, (In Chinese with English abstract). [Google Scholar]
- Yang, D.; Xiong, W.; Xu, Y.L.; Feng, L.Z.; Zhang, M.T.; Liu, H. Analysis of reason for recent slowing maize yield increase under climate change in China. Trans. CSAE 2017, 33, 231–238, (In Chinese with English abstract). [Google Scholar]
- Liu, B.C.; Wang, S.L.; Zhuang, L.W.; Lu, Z.G.; Song, Y.J.; Shi, X.L. Study of low temperature damage prediction applications in northeast, China based on a scaling-up maize dynamic model. J. Appl. Meteorol. Sci. 2003, 14, 616–625, (In Chinese with English abstract). [Google Scholar]
- Xu, X.M.; Tang, Q.H. Spatiotemporal variations in damages to cropland from agrometeorological disasters in mainland China during 1978–2018. Sci. Total Environ. 2021, 785, 147247. [Google Scholar] [CrossRef]
- Debertin, D.L. Agricultural Production Economics, 2nd ed.; University of Kentucky: Lexington, KY, USA, 2012. [Google Scholar]
- Dhakal, C.; Lange, K. Crop yield response functions in nutrient application: A review. Agron. J. 2021, 113, 5222–5234. [Google Scholar] [CrossRef]
- Douglas, P.H. The Cobb-Douglas production function once again: Its history, its testing, and some new empirical values. J. Policy Econ. 1976, 84, 903–915. [Google Scholar] [CrossRef]
- Liu, Y.; Liu, B.C.; Yang, X.J.; Bai, W.; Wang, J. Relationships between drought disasters and crop production during ENSO episodes across the North China Plain. Reg. Environ. Chang. 2015, 15, 1689–1701. [Google Scholar] [CrossRef]
- Wang, J.; Liu, B.C.; Liu, Y.; Yang, X.J.; Bai, W. Grain yield estimation models and loss analysis based on agro-meteorological disaster exposure in Northeast China. Chin. J. Agro Meteorol. 2013, 34, 720–726, (In Chinese with English abstract). [Google Scholar]
- Zhang, Y.; Liu, B.C.; Yang, X.J.; Liu, Y.; Bai, W.; Dong, B.C. Grain Yield Loss Evaluation Based on Agro-meteorological Disaster Exposure in the Middle-Lower Yangtze Plain. Chin. J. Agro Meteorol. 2018, 39, 280–291, (In Chinese with English abstract). [Google Scholar]
- Zhang, Z.; Chen, Y.; Wang, P.; Zhuang, S.; Tao, F.L.; Liu, X.F. Spatial and temporal changes of agro-meteorological disasters affecting maize production in China since 1990. Nat. Hazards 2014, 71, 2087–2100. [Google Scholar] [CrossRef]
- Teller Report, 2021. Inner Mongolia Multi-Sectoral Efforts to Build an Important Ecological Security Barrier in Northern China. Available online: https://www.tellerreport.com/news/2021-09-01-correspondence--inner-mongolia-multi-sectoral-efforts-to-build-an-important-ecological-security-barrier-in-northern-china.SJIkmanbF.html (accessed on 20 June 2022).
- Chen, Y.; Li, Y.Q.; Wang, X.Y.; Yao, C.P.; Niu, Y.Y. Risk and countermeasures of global change in ecologically vulnerable regions of China. J. Desert Res. 2022, 42, 148–158, (In Chinese with English abstract). [Google Scholar]
- Han, Z.; Han, C.F. Inner Mongolia’s increasing grain production policy and its effectiveness. Agric. Outlook 2014, 10, 44–47. [Google Scholar]
- Song, X.D.; Li, Y.P.; Zhou, N.; Cheng, S.H.; Xue, Q.F.; Wang, J. Situation of the 5 Grain Export Provinces. Liaowang, 2019. (In Chinese). Available online: https://baijiahao.baidu.com/s?id=1652853267946844721&wfr=spider&for=pc (accessed on 26 January 2022).
- NBS (National Bureau of Statistics). National Data. 2022; (In Chinese). Available online: https://data.stats.gov.cn/search.htm (accessed on 2 June 2022).
- Yong, W. Inner Mongolia Launches Tree-Planting Campaign to Tame Desertification—People’s Daily. 2020. Available online: http://en.people.cn/n3/2020/0313/c90000-9667819.html (accessed on 26 January 2022).
- Tang, H.J.; Li, Z.M. Study on per capita grain demand based on Chinese reasonable dietary pattern. Sci. Agric. Sin. 2012, 45, 2315–2327, (In Chinese with English abstract). [Google Scholar]
- Li, Y.H. On grain production and ecological security barrier construction in Inner Mongolia. Ecol. Econ. 2017, 33, 115–119, (In Chinese with English abstract). [Google Scholar]
- Jin, S.Q.; Zhou, F. Zero growth of chemical fertilizer and pesticide use: China’s objectives, progress and challenges. J. Resour. Ecol. 2018, 9, 50–58. [Google Scholar]
- MARA (Ministry of Agriculture and Rural Affairs of the People’s Republic of China). Notice of the Ministry of Agriculture on the issuance of the “Zero Growth Action Plan for Chemical Fertilizer Use to 2020” and the “Zero Growth Action Plan for Pesticide Use to 2020”. 2015; (In Chinese). Available online: http://www.moa.gov.cn/nybgb/2015/san/201711/t20171129_5923401.htm (accessed on 26 January 2022).
- Qian, Z.N.; Song, M.H.; Li, W.Y.; Cai, Y. Global China-Mongolia arid and semiarid areas (CMASA) and the details of precipitation distribution in part region of CMASA. Plateau Meteorol. 2011, 30, 1–12, (In Chinese with English abstract). [Google Scholar]
- Cui, C.X.; Meng, F.H.; Luo, M.; Wang, Y.Y.; Sa, C.L.; Bao, Y.H. Spatio-Temporal Change Characteristics and Driving Factors of Cultivated Land Water Shortage in Inner Mongolia based on the Geographic Detector Model. Chin. J. Agric. Resour. Reg. Plann. (In Chinese with English abstract). Available online: https://kns.cnki.net/kcms/detail/11.3513.S.20220107.1731.052.html.
- Wang, B.; Li, Y.E.; Wan, Y.F.; Qin, X.B.; Liu, S.; Li, J.L. Modifying nitrogen fertilizer practices can reduce greenhouse gas emissions from a Chinese double rice cropping system. Agric. Ecosyst. Environ. 2016, 215, 100–109. [Google Scholar] [CrossRef]
- Wang, H.X.; Liu, X.N.; Guo, J.; Ren, Z.C.; Wang, F.P.; Pan, D.R. Improvement of AMMRR interpolation and application in CSCS classification of Inner Mongolia grassland. Chin. J. Ecol. Agric. 2013, 21, 904–912, (In Chinese with English abstract). [Google Scholar] [CrossRef]
- Peng, J.; Wu, W.H.; Liu, Y.X.; Hu, Y.N. Soil conservation service zoning in the Inner Mongolia Autonomous Region based on PSR framework. Acta Ecol. Sin. 2017, 37, 3849–3861, (In Chinese with English abstract). [Google Scholar]
- Zheng, J.Y.; Bian, J.J.; Ge, Q.S.; Hao, Z.X.; Yin, Y.H.; Liao, Y.M. The climate regionalization in China for 1981–2010. Chin. Sci. Bull. 2013, 58, 3088–3099, (In Chinese with English abstract). [Google Scholar]
- Zhang, L.X.; Yang, Z.F.; Chen, G.Q. Energy analysis of cropping–grazing system in Inner Mongolia Autonomous Region, China. Energy Policy 2007, 35, 3843–3855. [Google Scholar] [CrossRef]
- IMAR (Inner Mongolia Autonomous Region). The Inner Mongolia Autonomous Region added Four New High-Efficiency Water-Saving Irrigation Schemes of 10 Million mu (2016–2020). (In Chinese). Available online: https://www.nmg.gov.cn/zwgk/zfxxgk/zfxxgkml/zzqzfjbgtwj/202012/t20201208_315049.html (accessed on 26 January 2022).
- Wang, N.; Yang, G.; Han, X.Y.; Jia, G.P.; Liu, F.; Li, T.; Jia, N. Land use change and ecosystem service value in Inner Mongolia from 1990 to 2018. J. Soil Water Conserv. 2020, 34, 244–250, (In Chinese with English abstract). [Google Scholar]
- Shi, Z.Z. Agricultural regional policy of Inner Mongolia Autonomous Region. J. Inner Mongol. Univ. 1994, 3, 56–62, (In Chinese with English abstract). [Google Scholar]
- IMARBS (Inner Mongolia Autonomous Region Bureau of Statistics). Inner Mongolia Statistical Yearbook; China Statistics Press: Beijing, China, 2021. (In Chinese)
- NDRC (National Development and Reform Commission). National Agricultural Product Cost and Income Data Compilation (1981–2020); China Statistics Press: Beijing, China, 2020. (In Chinese)
- IAED (Institute of Agricultural Economics and Development, Chinese Academy of Agricultural Sciences). Research Report of National Food Safety Risk Management and Control System; IAED (Institute of Agricultural Economics and Development, Chinese Academy of Agricultural Sciences): Beijing, China, 2021. (In Chinese) [Google Scholar]
- Xu, L.; Zhang, Q. Assessment approach for agricultural catastrophic risk in China. Sci. Agric. Sin. 2011, 44, 1945–1952, (In Chinese with English abstract). [Google Scholar]
- Ma, W.Q.; Li, J.H.; Ma, L.; Wang, F.H.; Sisák, I.; Cushman, G.; Zhang, F.S. Nitrogen flow and use efficiency in production and utilization of wheat, rice, and maize in China. Agric. Syst. 2009, 99, 53–63. [Google Scholar] [CrossRef]
- Wu, X.L.; Hao, R.M. Analysis on driving Force of cultivated land area change in Inner Mongolia Autonomous region. Territory & natural resources study. Chin. Rural Econ. 2019, 6, 48–50, (In Chinese with English abstract). [Google Scholar]
- P.R. China. Outline of national Land Planning (2016–2030). 2017; (In Chinese). Available online: http://www.gov.cn/zhengce/content/2017-02/04/content_5165309.htm (accessed on 26 January 2022).
- NFGA (National Forestry and Grassland Administration). Remarkable Progress Has Been Made in Grain for Green Program in Inner Mongolia. 2019; (In Chinese). Available online: http://www.forestry.gov.cn/main/435/20191129/094339647144564.html (accessed on 26 January 2022).
- Yu, Z.G.; Hu, X.P. Research on the relation of food security and cultivated land’s quantity and quality in China. Geogr. Geo Inform. Sci. 2003, 19, 45–49, (In Chinese with English abstract). [Google Scholar]
- Chen, Y.J.; Yi, X.Y.; Fang, L.N.; Yang, R.Z. Analysis of cultivated land and grain production potential in China. Sci. Agric. Si. 2016, 49, 1117–1131, (In Chinese with English abstract). [Google Scholar]
- Fan, M.S.; Shen, J.B.; Yuan, L.X.; Jiang, R.F.; Chen, X.P.; Davies, W.J.; Zhang, F.S. Improving crop productivity and resource use efficiency to ensure food security and environmental quality in China. J. Exp. Bot. 2012, 63, 13–24. [Google Scholar] [CrossRef] [PubMed]
- Zhang, H.Q.; Ma, F.C.; Yin, L.C. Analysis on farmers’ willingness to grow grain and its influence factors in major grain-producing areas-Based on the investigation of rural households in Heilongjiang province. Guangdong Agric. Sci. 2014, 41, 211–215, (In Chinese with English abstract). [Google Scholar]
- He, Q.J.; Zhou, G.S. Climate-associated distribution of summer maize in China from 1961 to 2010. Agric. Ecosyst. Environ. 2016, 232, 326–335. [Google Scholar] [CrossRef]
- MARA (Ministry of Agriculture and Rural Affairs of the People’s Republic of China). Guidance on Corn Structure Adjustment in Sickle Bend Area. 2015; (In Chinese). Available online: http://www.moa.gov.cn/nybgb/2015/shiyiqi/201712/t20171219_6103893.htm (accessed on 26 January 2022).
- MARA (Ministry of Agriculture and Rural Affairs of the People’s Republic of China). The Guiding Opinions on the Adjustment of Agricultural Structure in the Ecotone of Agriculture and Animal Husbandry in North China. 2016; (In Chinese). Available online: http://www.moa.gov.cn/nybgb/2016/shierqi/201711/t20171125_5919525.htm (accessed on 26 January 2022).
- Zhang, P. Trends and Prospect of Basic Research on Root and Tuber Crops in China. Biotech. Bull. 2015, 1, 65–71, (In Chinese with English abstract). [Google Scholar]
- Zhang, X.; Wang, L.X.; Chai, Y.; Liao, Y.C. Sustainable development of minor food crops in China. Sci. Agric. Sin. 2003, 36, 1595–1598, (In Chinese with English abstract). [Google Scholar]
- Qiao, Y.; Yang, H.; Luo, J.L.; Wang, S.X.; Liang, L.Y.; Chen, X.P.; Zhang, W.S. Inputs and ecological environment risks assessment of maize production in Northwest China. Sci. Agric. Sin. 2022, 55, 962–976, (In Chinese with English abstract). [Google Scholar]
- Liang, S. Analysis of the agricultural supply-side reform in Liandaowan Region take the corn structure adjustment in Inner Mongolia as an example. Econ. Res. Guide 2020, 34, 17–18+27. (In Chinese) [Google Scholar]
- Li, C.H.; Wang, D.; Yao, X.D.; Wang, H.Y.; Zhao, M.Z.; Wu, J.J.; Song, S.H.; Xie, F.D. Demonstrate research of maize-soybean belt compound planting in Liaoning Province. Soybean Sci. 2017, 36, 219–225, (In Chinese with English abstract). [Google Scholar]
- Alivelu, K.; Srivastava, S.; Subba Rao, A.; Singh, K.N.; Selvakumari, G.; Raju, N.S. Comparison of modified Mitscherlich and response plateau models for calibrating soil test based nitrogen recommendations for rice on Typic Ustropept. Commun. Soil Sci. Plant Anal. 2003, 34, 2633–2643. [Google Scholar] [CrossRef]
- Dhakal, C.; Lange, K.; Parajulee, M.N.; Segarra, E. Dynamic optimization of nitrogen in plateau cotton yield functions with nitrogen carryover considerations. J. Agric. Appl. Econ. 2019, 51, 385–401. [Google Scholar] [CrossRef] [Green Version]
- Harmon, X.; Boyer, C.N.; Lambert, D.M.; Larson, J.A. Temporal frequency of soil test information effects on returns to potassium fertilization in cotton production. J. Agric. Appl. Econ. 2017, 49, 251–272. [Google Scholar] [CrossRef] [Green Version]
- Tumusiime, E.; Brorsen, B.W.; Mosali, J.; Johnson, J.; Locke, J.; Biermacher, J.T. Determining optimal levels of nitrogen fertilizer using random parameter models. J. Agric. Appl. Econ. 2011, 43, 541–552. [Google Scholar] [CrossRef] [Green Version]
- Blake, L.; Goulding, K.; Mott, C.; Johnston, A. Changes in soil chemistry accompanying acidification over more than 100years under woodland and grass at Rothamsted Experimental Station, UK. Eur. J. Soil Sci. 2010, 50, 401–412. [Google Scholar] [CrossRef]
- Huang, X.D.; Li, C.; Huang, Y. Study on Regional Differences of Pesticide and Fertilizer Application in China Based on Provincial Data. Ecol. Econ. 2019, 35, 118–124, (In Chinese with English abstract). [Google Scholar]
- Wu, J.Q.; Fang, S.L.; Li, G.C.; Xu, G.T. The Spillover Effect of Agricultural Mechanization on Grain Output in China: From the Perspective of Cross-regional Mechanization Service. Chin. Rural Econ. 2017, 6, 44–57, (In Chinese with English abstract). [Google Scholar]
- Wang, F.Y. Analysis of the impact about agricultural modernization related factors on grain yield–based on the data of 22 years in Hubei province. Reform Strategy 2016, 32, 111–115, (In Chinese with English abstract). [Google Scholar]
- Bi, J.Y.; Wang, X.F.; Zhu, D.L. Effect of plastic-film mulch on crop yield. Trans. CSAE 2008, 24, 172–175, (In Chinese with English abstract). [Google Scholar]
- Liu, S.S.; Ni, H.Z.; Zhang, C.L.; Chen, G.F. Analysis and thoughts to currently agricultural water price reform in Ningxia Yellow River irrigation. Water Sav. Irrig. 2016, 9, 158–162, (In Chinese with English abstract). [Google Scholar]
- Li, J.; Wang, Y.Q.; Qu, Z.Y.; Ma, L.Z. Characteristics of temporal and spatial distribution of drought occurrence in Inner Mongolia Autonomous Region. Agric. Res. Arid Areas 2010, 28, 266–272, (In Chinese with English abstract). [Google Scholar]
- Zhou, J.B.; Wang, C.Y.; Zhang, H.; Dong, F.; Zheng, X.F.; Gale, W.; Li, S.X. Effect of water saving management practices and nitrogen fertilizer rate on crop yield and water use efficiency in a winter wheat–summer maize cropping system. Field Crops Res. 2011, 122, 157–163. [Google Scholar] [CrossRef]


| Time Period | Average Sown Area of Different Crop Varieties (103 ha) | |||||
|---|---|---|---|---|---|---|
| Wheat | Maize | Rice | Soy Bean | Tuber Crop | Miscellaneous Grains and Beans | |
| 1980–1989 | 934.80 ± 11.76 a | 571.50 ± 30.06 a | 24.90 ± 3.76 b | 240.30 ± 15.95 b | 240.80 ± 3.61 a | 1697.10 ± 75.46 a |
| 1990–1999 | 1121.00 ± 35.19 b | 1039.00 ± 96.92 b | 92.80 ± 6.23 a | 551.10 ± 56.97 b | 356.90 ± 39.55 b | 1154.00 ± 28.69 b |
| 2000–2009 | 484.10 ± 25.89 c | 1840.40 ± 127.32 c | 92.60 ± 4.61 a | 775.50 ± 34.57 a | 586.70 ± 13.44 c | 888.50 ± 39.28 c |
| 2010–2019 | 617.00 ± 12.68 d | 3522.10 ± 134.19 d | 108.50 ± 8.68 a | 913.90 ± 45.39 a | 501.90 ± 41.27 d | 773.90 ± 28.82 c |
| 1980–2019 | 789.23 ± 41.90 | 1743.25 ± 186.80 | 79.70 ± 5.95 | 620.20 ± 45.31 | 421.58 ± 25.57 | 1128.38 ± 61.36 |
| Time Period | Contributing Factors | ||
|---|---|---|---|
| Structure Adjustment | Sown Area | Yield | |
| 1980–1989 | 20.37% | −11.88% | 91.51% |
| 1990–1999 | 16.02% | 77.37% | 6.61% |
| 2000–2009 | 6.87% | 73.00% | 20.13% |
| 2010–2019 | 5.73% | 46.92% | 47.35% |
| 1980–2019 | 12.63% | 54.06% | 33.31% |
| Time Period | Contribution to Grain Production Increase of IMAR (%) * | |||||
|---|---|---|---|---|---|---|
| Wheat | Maize | Rice | Soybean | Tuber Crop | Miscellaneous Grains and Bean | |
| 1980–1989 | 37.24% | 51.85% | 5.37% | 8.71% | 4.44% | −7.60% |
| 1990–1999 | 2.50% | 83.05% | 8.28% | 7.64% | 10.85% | −12.32% |
| 2000–2009 | 0.74% | 96.85% | −0.74% | 4.36% | −3.18% | 1.96% |
| 2010–2019 | 0.64% | 82.44% | 5.26% | 5.85% | −3.70% | 9.50% |
| 1980–2019 | 3.07% | 79.33% | 4.06% | 6.56% | 3.35% | 3.63% |
| Items | Driving Factors | |||
|---|---|---|---|---|
| Fertilizer (RMB ha−1) | Irrigation (RMB ha−1) | Other Inputs (RMB ha−1) | Comprehensive Loss Rate of Agrometeorological Hazards (%) | |
| Initial value (1981) | 72.43 | 30.25 | 97.61 | 15.51 |
| End value (2019) | 334.75 | 108.80 | 493.47 | 6.16 |
| Change rate from 1981 to 2019 (%) | 362.16 | 259.66 | 405.55 | −60.30 |
| Contribution to yield (%) | 160.44 | 15.06 | 53.13 | 7.78 |
Publisher’s Note: MDPI stays neutral with regard to jurisdictional claims in published maps and institutional affiliations. |
© 2022 by the authors. Licensee MDPI, Basel, Switzerland. This article is an open access article distributed under the terms and conditions of the Creative Commons Attribution (CC BY) license (https://creativecommons.org/licenses/by/4.0/).
Share and Cite
Zhu, Y.; Liu, B.; Liu, Y.; Shirazi, S.Z.; Cui, C.; He, J.; Liu, S.; Yang, F.; Zhang, X. Investigating Contribution Factors of Grain Input to Output Transformation for the Inner Mongolia Autonomous Region in China. Agronomy 2022, 12, 1537. https://doi.org/10.3390/agronomy12071537
Zhu Y, Liu B, Liu Y, Shirazi SZ, Cui C, He J, Liu S, Yang F, Zhang X. Investigating Contribution Factors of Grain Input to Output Transformation for the Inner Mongolia Autonomous Region in China. Agronomy. 2022; 12(7):1537. https://doi.org/10.3390/agronomy12071537
Chicago/Turabian StyleZhu, Yongchang, Buchun Liu, Yuan Liu, Sana Zeeshan Shirazi, Cheng Cui, Jinna He, Shanshan Liu, Fan Yang, and Xiaonan Zhang. 2022. "Investigating Contribution Factors of Grain Input to Output Transformation for the Inner Mongolia Autonomous Region in China" Agronomy 12, no. 7: 1537. https://doi.org/10.3390/agronomy12071537