Article

Coordinating High Yield and Superior Eating Quality of Rice: A Case Study of Hybrid Varieties Derived from Longke638S and Jing4155S

1
National Key Laboratory of Crop Genetic Improvement, MARA Key Laboratory of Crop Ecophysiology and Farming System in the Middle Reaches of the Yangtze River, College of Plant Science and Technology, Huazhong Agricultural University, Wuhan 430070, China
2
Key Laboratory of Southern Rice Innovation & Improvement, Ministry of Agriculture and Rural Affairs, Hunan Engineering Laboratory of Disease and Pest Resistant Rice Breeding, Yuan Longping High-Tech Agriculture Co., Ltd., Changsha 410128, China
*
Authors to whom correspondence should be addressed.
These authors contributed equally to this work.
Agronomy 2022, 12(7), 1628; https://doi.org/10.3390/agronomy12071628
Submission received: 15 June 2022 / Revised: 5 July 2022 / Accepted: 6 July 2022 / Published: 7 July 2022

Abstract

:
The planting area of hybrid rice (Oryza sativa L.) has continuously decreased in recent years partially because of the low eating quality. Longke638S and Jing4155S are two elite male sterile lines, which are used for developing many hybrid varieties with large planting areas in China. Here, 21 hybrid rice varieties of an incomplete diallel cross population with Longke638S and Jing4155S as female parents were planted under field conditions for two consecutive years, aiming to investigate the physiological and transcriptomic characteristics that is required for coordinating high yield and superior eating quality. As a result, grain yield ranged from 7.15 to 9.23 t ha−1 in 2019 and from 7.49 to 9.23 t ha−1 in 2020, and a negative relationship was identified between yield and quality-related traits. Hybrid varieties with Longke638S as the female parent (LLY) had higher yield but lower eating quality than those with Jing4155S as the female parent (JLY). The higher yield of LLY over JLY was due to higher biomass production and N uptake as well as higher yield stability across planting years, while their lower grain quality can be mainly ascribed to lower amylose content and alkali spreading value. Male parents significantly affected yield-related traits of LLY and eating quality-related traits of JLY. Candidate genes involved in grain starch biosynthesis were differentially expressed between LLYHZ, JLYHZ, and JLY1212, such as Wx and ALK. Overall, this study examined the relationship between grain yield and eating quality and identified the physiological and molecular traits that limited grain yield or eating quality of LLY and JLY hybrid varieties.

1. Introduction

In addition to the first Green Revolution, heterosis has been utilized to significantly improve the yield potential of various crops, which has contributed greatly to food security worldwide [1]. The grain yield of hybrid rice (Oryza sativa L.) is higher than that of inbred rice by approximately 20% in China and by nearly 9% in tropical irrigated lowlands [2,3]. Development of super hybrid rice by combining intersubspecific heterosis and the ideotype approach further increases the yield potential to more than 15 t ha−1 [4]. From 1976 to 2014, hybrid rice accounted for 50–60% of the total rice planting area in China, and increased rice production by 500 billion kg in total based on a 15% higher grain yield of hybrid rice over inbred rice on average [5]. However, despite the advantage of hybrid rice in yield, the planting area of hybrid rice has been continuously decreasing in recent years, which may be partially ascribed to its relatively lower grain quality [5]. Therefore, it is essential to coordinate the grain yield and quality for the sustainable development of hybrid rice in the future.
Several strategies have been proposed for the development of rice varieties with both high yield and superior quality, such as the Green Super Rice [6] and the Rational Design Strategy [7]. However, improvement of rice grain quality remains a great challenge, as most of the traits related to grain quality are controlled by quantitative loci (QTLs) and affected by various environmental factors [8,9]. In contrast to its heterosis in yield, hybrid rice tends to have poorer performance in quality-related traits compared with the parents [10,11]. The negative relationship between yield and quality further increases the difficulty in quality improvement of hybrid rice [7]. After the great efforts of scientists and breeders, the newly released rice varieties in 2019, which meet the national standards of high-quality rice, cover about 56.1% and 60.9% of hybrid and inbred indica rice in China, respectively [12]. Extensive comparative studies have been conducted between rice varieties released in different ages [13], or (super) hybrid and inbred indica rice [14], or inbred japonica super rice and inter-sub-specific hybrid super rice [15]. The morphological and physiological mechanisms underlying the increase in yield potential have also been elucidated, such as larger sink size, optimized plant type and increases in radiation use efficiency, nitrogen uptake and utilization efficiency, and root size and activity [4]. However, there has been no such study in high-yield and high-quality hybrid rice varieties to the best of our knowledge, so it is meaningful to examine the physiological and molecular traits that can facilitate the coordination of high yield and superior eating quality in hybrid breeding.
Generally, rice grain quality is divided into four categories, including: milling quality, appearance quality, cooking and eating quality, and nutrition and hygiene quality [9]. Extensive progress has been made in the research on the biological pathway and molecular regulatory network that determine grain quality [7,9,16,17,18]. Recently, improvement in cooking and eating quality is the primary concern in hybrid rice breeding and cultivation, which is mainly determined by the amylose content, gel consistency, and gelatinization temperature [9,19]. These three parameters are mutually related, because the starch synthesis-related genes regulating these traits form a fine network [18]. Besides starch property, protein content and composition also have significant impacts on the cooking and eating quality, and a lower protein content is generally preferred for premium palatability [20]. Consumers have highly diverse preferences for rice quality among different regions, countries, cities, and urbanization levels. For example, long slender grains with low chalkiness and a moderate amylose content are usually preferred in Southern China. Hence, evaluation of the eating quality is commonly conducted in a descriptive way depending on local preferences [8]. Although significant progress has been made in identifying the genes regulating starch biosynthesis, protein content and composition, grain oil synthesis, and aroma, achieving premium quality rice in a high-yielding background is still a great challenge for rice breeding [19].
Longke638S and Jing4255s are two elite male sterile (MS) lines that are developed by Longping High-Tech Agriculture Co., (Changsha, China) and both of them have high blast resistance, superior quality, and high combining ability [21,22]. Until now, 73 and 38 hybrid varieties derived from Longke638S and Jing4255S, respectively, have been officially released with six super hybrid varieties, and the corresponding planting areas of these hybrids are 2.07 and 1.93 million ha totally from 2016 to 2019. In the last two years, four of the top five hybrid varieties with largest planting areas in China are derived from these two MS lines [21,22]. Moreover, Longliangyouhuazhan and Jingliangyouhuazhan were certified as Green Super Rice because of their high yield and NUE at a medium N fertilizer condition (100 kg N ha−1) [23]. Recently, progresses have been made in theoretical study on balancing yield with quality, blast resistance with quality, or yield with blast resistance through the utilization of elite alleles so as to break the deleterious linkage between these traits [24,25,26]. However, the status of coordination between yield and eating quality for these widely planted hybrid varieties (including super hybrid varieties) in actual production is still obscure. Therefore, in the present study, a set of 21 hybrid varieties of an incomplete diallel cross population with Longke638S and Jing4155S as female parents were planted at a medium N fertilizer condition for two consecutive years. This study aims to (1) determine the differences in grain yield and eating quality of these elite hybrid varieties across two planting years, and (2) explore the physiological and molecular attributes that can be used for tailoring rice varieties coordinating high grain yield and superior quality.

2. Materials and Methods

2.1. Site Description

The experiments were conducted in farmers’ fields at Maoshi Township, Jianli County, Hubei Province, China (29°51′ N, 115°53′ E) during the rice growing season (May to October) in 2019–2020. This area is located in a subtropical monsoon humid climate region. Every year, the daily meteorological data were collected during the rice growing period between transplanting and maturity (based on the test variety with the longest duration) from a weather station (AWS 800, Campbell Scientific, Inc., Logan, UT, USA) located near the experimental site. The seasonal average daily mean temperature, average daily solar radiation, and total precipitation were 27.8 °C, 16.3 MJ m−2, and 214.4 mm in 2019, respectively, and were 25.7 °C, 11.9 MJ m−2, and 629.1 mm in 2020, respectively. In general, 2019 was a hotter year than 2020 (Figure S1). The soil properties before the experiment in 2019 were as follows: pH 7.27, 21.72 g kg−1 organic matter, 1.63 g kg−1 total N, 7.34 mg kg−1 Olsen P, 100.61 mg kg−1 exchangeable K. The soil was sampled at a depth of 20 cm from the surface before the application of basal fertilizer.

2.2. Experimental Design and Crop Management

The experiments were conducted in a randomized block design with three replications and a plot size of 20.0 m2. Pre-germinated seeds were sown into seedbeds on the 15th and 16th May in 2019 and 2020, respectively. Transplanting was performed at a density of 25 hills m−2 and a hill spacing of 13.3 × 30.0 cm with two seedlings per hill on 16 and 17 June in 2019 and 2020, respectively. In the two years, a total N rate of 100 kg ha−1 was applied as basal, at tillering (10 days after transplanting (DAT)) and panicle initiation (PI) stage at a ratio of 4:2:4. All N fertilizer was applied in the form of urea. The N rate in the present study was around 45% lower than the average N rate of 180 kg N ha−1 in central China to reduce the environmental impact and increase grain quality while maintaining a high grain yield [27]. Phosphorus (40 kg P ha−1 as calcium superphosphate) was applied in all plots one day before transplanting. Potassium (100 kg K ha−1 as potassium chloride) was split equally and applied in all plots at basal and PI. The field was flooded after transplanting, and a floodwater depth of 3–5 cm was maintained until a week before maturity except for water draining at the maximum tillering stage to reduce unproductive tillers. Weeds, pests, and diseases were intensively controlled to avoid yield loss.
The tested varieties were from an incomplete diallel cross population. The female parents were Longke638s and Jing4155S, and the male parents were 12 restorer lines (Table S1). In 2019, 21 hybrid varieties and Fengliangyou4 (FLY4) were planted, while in 2020, 12 restorer lines and Huanghuazhan (HHZ) were added to the experiment. Fengliangyou4 was used as the control variety as it is commonly used as the control in official variety certification in the Middle and Lower Reaches of Yangtze River. HHZ is a widely planted inbred variety in this area. Among these varieties, LLYHZ, LLY1377, LLY1988, LLY1212, JLYHZ, and JLY1212 are designated as super hybrid rice by the Ministry of Agriculture and Rural Affairs (MARA). JLY1212 has superior grain quality (especially taste quality), which meets the standards (NY/T593-2013) of level 2 high-quality rice when planted in this region (China Rice Data Center, https://www.ricedata.cn/, 1 March 2022) [28]. LLYHZ and JLYHZ rank top 5, and JLY1212 ranks top 10 in planting area among all the hybrid varieties of China in recent years.

2.3. Plant Sampling and Measurement

Twelve hills were sampled from each plot at the heading (HD) and maturity (MA) stage. The plant samples were then separated into leaves, stems (culm plus sheath), and panicles (when present). The dry biomass at each stage was determined after oven drying at 80 °C to a constant weight. At MA, the panicles were hand threshed after recording the panicle number, and then filled spikelets were separated from unfilled ones by submerging in tap water. Empty spikelets were separated from partially filled spikelets by winnowing. Three subsamples of filled spikelets (30 g for each subsample), three subsamples of empty spikelets (2 g for each subsample), and all partially filled spikelets were considered when recording the number of spikelets. The dry biomass of the rachis, the filled, partially filled, and empty spikelets were measured after oven drying at 80 °C to a constant weight. The dry biomass of the above tissues was added with that of leaves and stems to calculate the total aboveground dry biomass at MA. The number of spikelets per panicle (spikelets m−2/panicles m−2), grain filling percentage (100 × filled spikelets m−2/spikelets m−2), and harvest index (HI) (100 × filled spikelet weight/total dry biomass) were calculated. The grain yield was determined from a 5-m2 area in the center of each plot at 14% moisture content as determined by a digital moisture tester (DMC-700, Seedburo, Chicago, IL, USA).
The N concentration in each plant part at all growth stages was measured by Elementar vario MAX CNS/CN (Elementar Trading Co., Ltd., Langenselbold, Germany). The N content in each organ was calculated as the product of N concentration and dry biomass. The nitrogen uptake at each growth stage was calculated as the sum of N contents in each organ. The grain protein content was determined by multiplying the N concentration with 5.95 [29]. The nitrogen harvest index (NHI) was calculated as the ratio of N accumulation in grain over the total aboveground N uptake. The nitrogen use efficiency for grain production (NUEg) was the ratio of grain yield over the total aboveground N uptake. The nitrogen use efficiency for biomass production (NUEb) was the ratio of total aboveground biomass over the total aboveground N uptake.

2.4. Determination of Grain Quality

2.4.1. Milling and Appearance Grain Quality

Rice grain quality was assessed after 3 months of storage in a sample drying room, where the temperature was approximately 20 °C and the humidity was approximately 20% for stabilizing the physical and chemical properties of the samples. The milling quality of rice grains was determined according to the national standards of quality evaluation GB/T17891-2017, the People’s Republic of China, including the brown rice, milled rice, and head rice rate.
The scanned images of head rice were obtained by the Rice Appearance Quality Scanner (Epson Expressing 1680 Professional, Epson America, Lnc., Los Alamitos, CA, USA). Then, an image analysis software (Image J, the National Institutes of Health, Bethesda, MD, USA) was used to analyze the scanned images based on color to identify the number and area of chalky parts of rice grains and the length and width of head rice. After that, the chalky grain rate and chalkiness were calculated.

2.4.2. Determination of Amylose Content

The amylose content (AC) was measured according to the GB/T 17891–2017.

2.4.3. Determination of Gel Consistency

Gel consistency (GC) was determined according to the GB/T 17891–2017. Briefly, test tubes (13 mm × 100 mm) were filled with 0.01 g of sample rice flour in duplicate, followed by the addition of 0.2 mL 0.025% thymol blue solution. The tubes were then gently shaken and added with 2.0 mL 0.2 mol L−1 potassium hydroxide solution, and then shaken again. Then, the test tube was covered with a glass marble, put in a boiling water bath, and heated for 8 min. The rice glue solution surface in the test tube was controlled at one-half to two-thirds of the height of the test tube during the heating process. The tubes were then taken out, and after the removal of the glass marbles, the tubes were allowed to cool for 5 min and then put in an ice water bath at about 0 °C to cool for 20 min. Subsequently, the tubes were immediately taken out and placed horizontally on an operating table covered with coordinate paper, and let to stand at room temperature (25 ± 2 °C) for 1 h. The length of the rice glue flowing in the test tube (mm) was measured. When the difference between double test results did not exceed 7 mm, the average value was taken as the test result.

2.4.4. Determination of Gelatinization Temperature

The gelatinization temperature was determined indirectly by measuring the alkali spreading value (ASV). Six head rice grains were evenly placed in a covered square box, and 1.7% KOH solution was added. For better dispersion, enough spacing was set between the head rice grains. After capping, the head rice grains were placed at 30 ± 2 °C incubator. After 23 h, the gelatinization state of the rice grains was recorded one by one according to the 7-level classification of alkali spreading value, and the average value was taken as the test result.

2.5. RNA Sequencing

Panicles at the flowering stage were sampled and frozen in liquid nitrogen immediately, and then stored at –80 °C in a refrigerator. The total RNA was isolated from the spikelets using a Quick RNA Isolation Kit (Huayueyang, Beijing, China) according to the manufacturer’s instructions. The stranded RNA libraries were constructed using the Hieff NGS Ultima Dual-mode mRNA Library Prep Kit for MGI (Yeasen, Shanghai, China) following the manufacturer’s recommendations. After library preparation, quality control (QC) and pooling, pair-end sequencing was performed on the MGISEQ-2000RS (MGI, Shenzhen, China) at the Sequencing Platform of the National Key Laboratory of Crop Genetic Improvement in Huazhong Agricultural University (Wuhan, China). The sequence quality of RNA-Seq libraries was evaluated using FastQC, and the adapter sequences and low-quality reads were filtered using Fastp (v0.20.0). Clean reads were aligned against the Oryza sativa Nipponbare reference genome using HISAT2 (v2.2.1) with default parameters [30,31]. Gene expression was quantified using StringTie (v2.1.4) [32]. Differentially expressed genes (DEGs) were identified with the DESeq2 package in R with an adjusted p value < 0.05 and log10 fold-change > 1 [33]. Annotation of DEGs was based on the information from funRiceGenes and MsuNote (MSU v7).

2.6. Statistical Analysis

The statistical analysis was performed using analysis of variance (Statistix 9.0, Analytical software, Tallahassee, FL, USA). When significant, the mean values were compared based on the least significant difference (LSD) test at the 0.05 probability level. The Partial Least Squares-Discriminant Analysis (PLS-DA) was performed using the plsr function provided by R pls package [34]. The classification and cross-validation were performed using the corresponding wrapper function offered by the caret package [35]. Figures were generated by Sigmaplot 12.5 (SPSS Inc., Point Richmond, CA, USA).

3. Results

3.1. Grain Yield, Grain Quality and Nitrogen Use Efficiency of Hybrid Varieties

The PLS-DA of traits related with grain yield, grain quality, and NUE indicated that the varieties with Longke638S as the female parent (LLY), those with Jingke4155S as the female parent (JLY), and the control variety (FLY4) were separated along with component 1 (Figure S2). The detail differences among LLY, JLY, and FLY4 are shown in Figure 1 and Table 1, Table 2 and Table 3. In terms of average value across the 2 years, LLY exhibited higher (by 5.77%) grain yields than JLY. The higher grain yield of LLY over JLY was mainly due to the higher total dry weight and total nitrogen uptake (Table 3, Tables S2 and S3; Figure 1). Generally, the test hybrid varieties had higher head rice rate and lower chalkiness, ASV, and AC than the control FLY4, while LLY had lower ASV and AC but higher GC than JLY (Figure 1; Table 2). The hybrid varieties with significantly higher yield than FLY4 maintained a high NUEg when N uptake increased. Moreover, higher total N uptake contributed to the higher grain yield of LLY compared with JLY (Figure 1; Table 3).
For all the varieties, grain yield ranged from 7.15 to 9.23 t ha−1 in 2019, and from 7.49 to 9.23 t ha−1 in 2020 (Table 1). LLYHZ exhibited stably high grain yields across the 2 years with a coefficient of variance (CV) of 0.85%, while the yield of JLY1212 had the highest CV (11.72%). JLYHZ had the highest grain yield among JLY hybrids, which was comparable to that of LLYHZ in 2020 but significantly lower than that of LLYHZ in 2021. Three parameters related to cooking and eating quality exhibited significant variations among these hybrid varieties (Table 2). LLYHZ had relatively lower ASV and AC but higher protein content. JLYHZ and JLY1212 had the highest ASV and AC among the test hybrids except for FLY4, and JLY1212 also had the lower chalkiness degree and protein content in 2021. Overall, LLYHZ had the highest yield potential and yield stability, JLYHZ had medium yield and quality, while JLY1212 had the best eating quality but lower yield.
N uptake at maturity ranged from 118.6 kg ha−1 to 159.3 kg ha−1 in 2019 and from 118.2 kg ha−1 to 148.5 kg ha−1 in 2020. Most of the LLY hybrid varieties had higher N uptake than the control variety FLY4. Averaged across 2 years, LLYHZ had the highest TN, while LLY8612 had the highest NUEg. Among JLY hybrid varieties, JLYHZ had the highest TN and JLY1206 had the highest NUEg (Table 3).

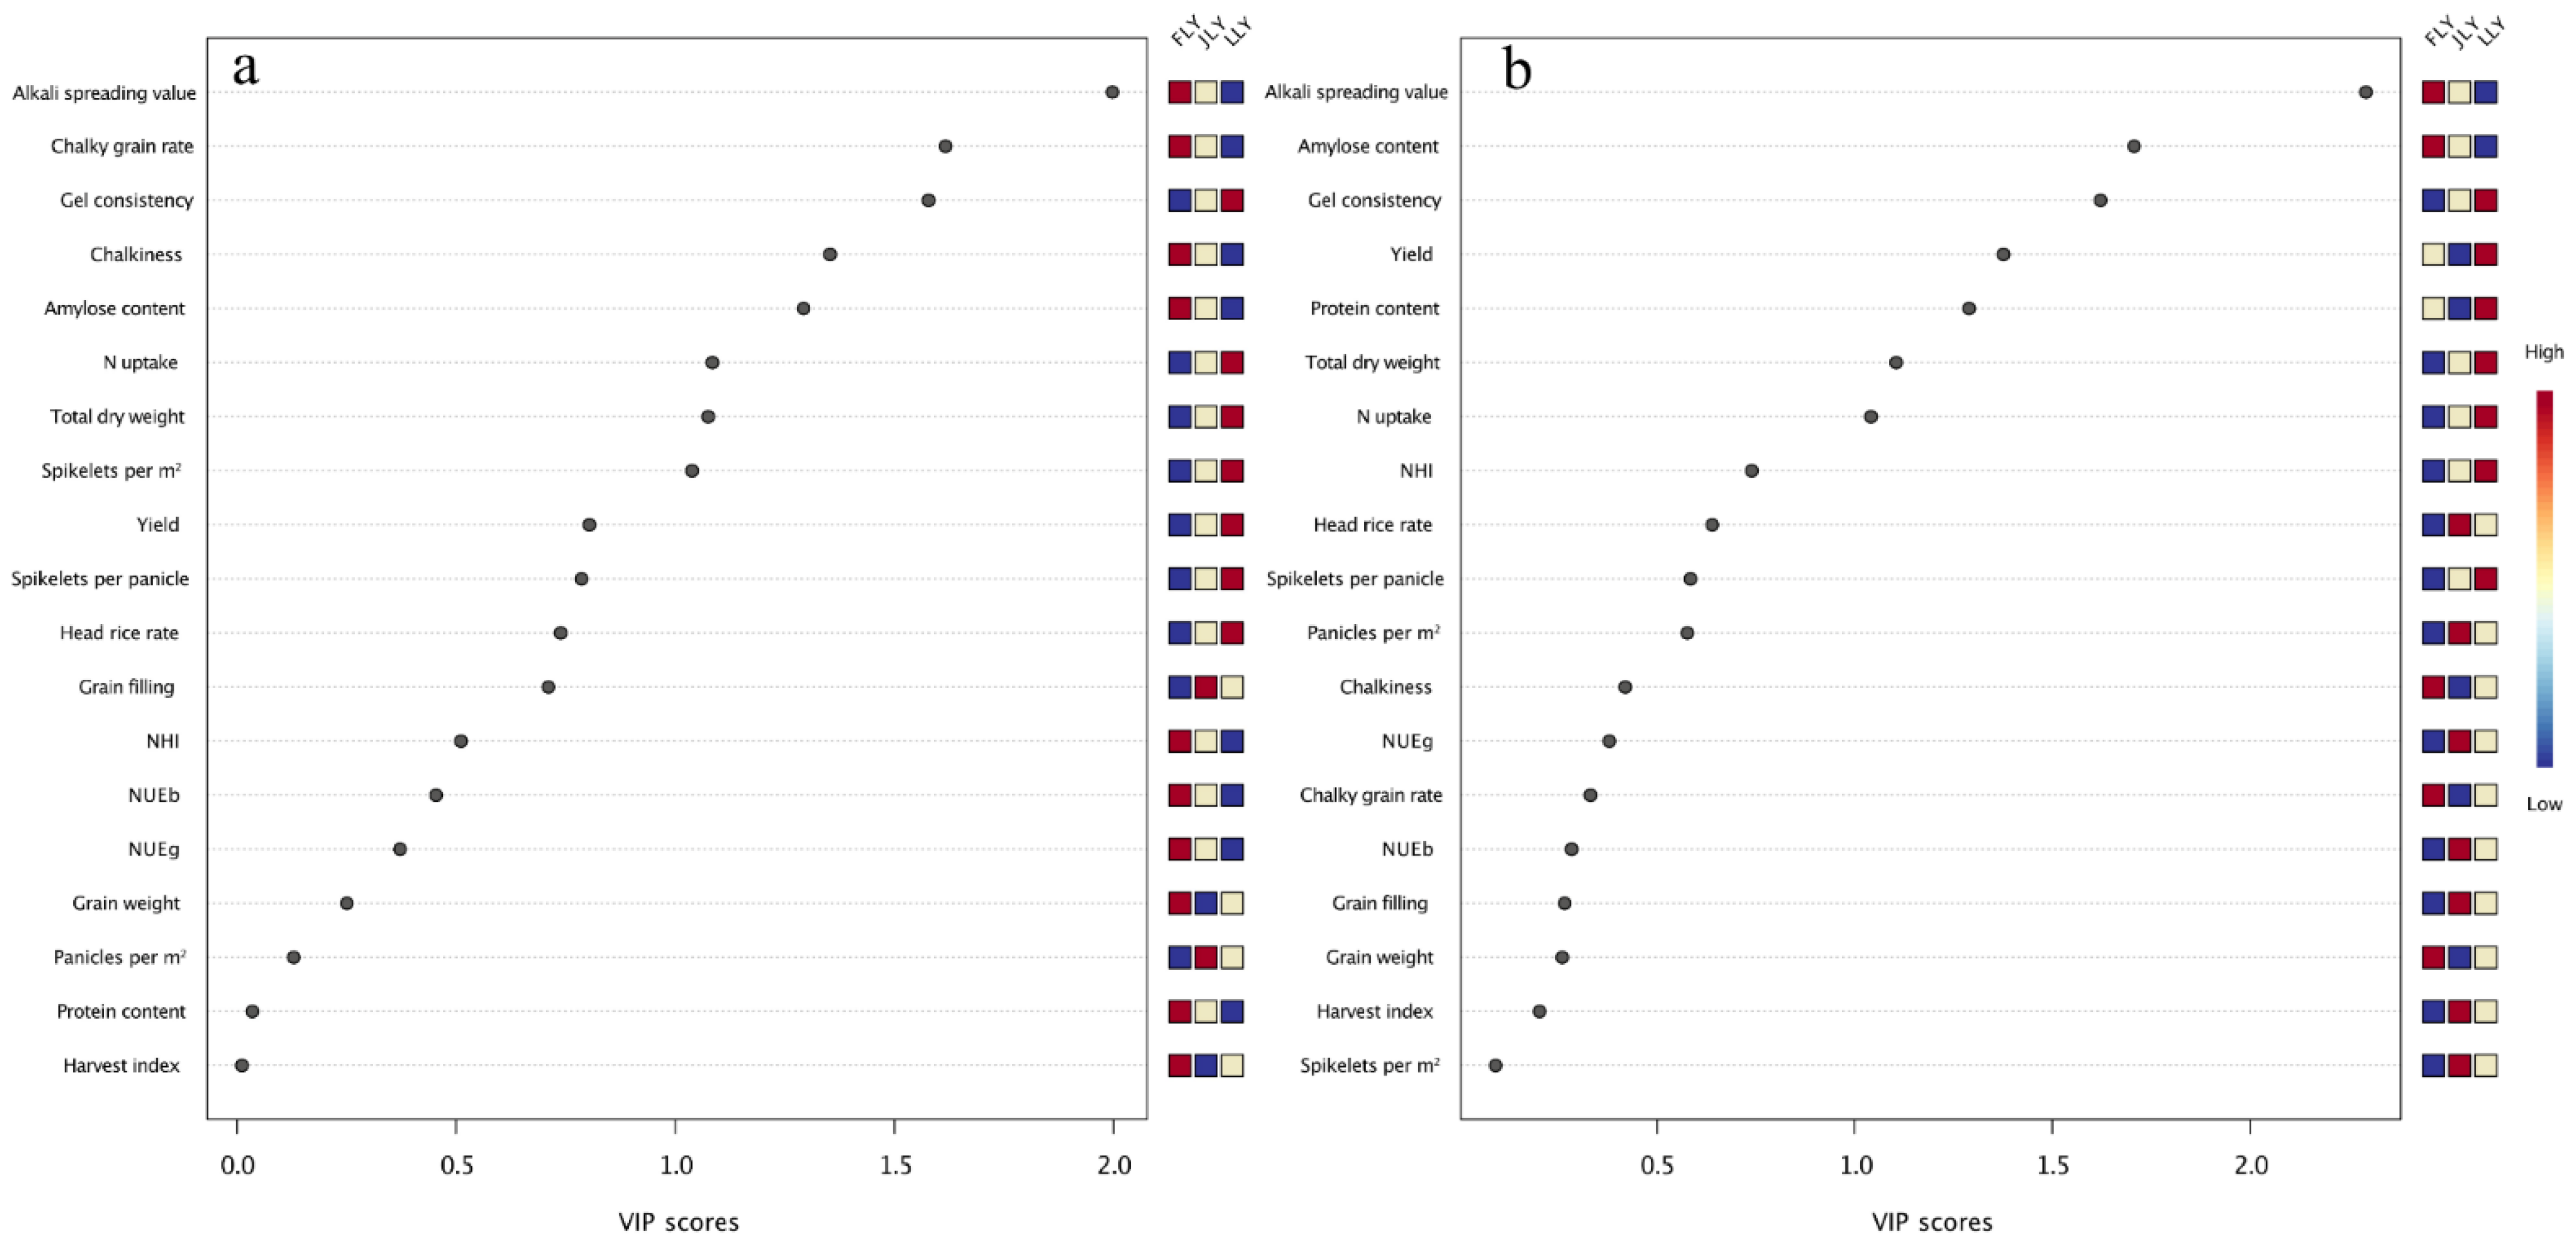
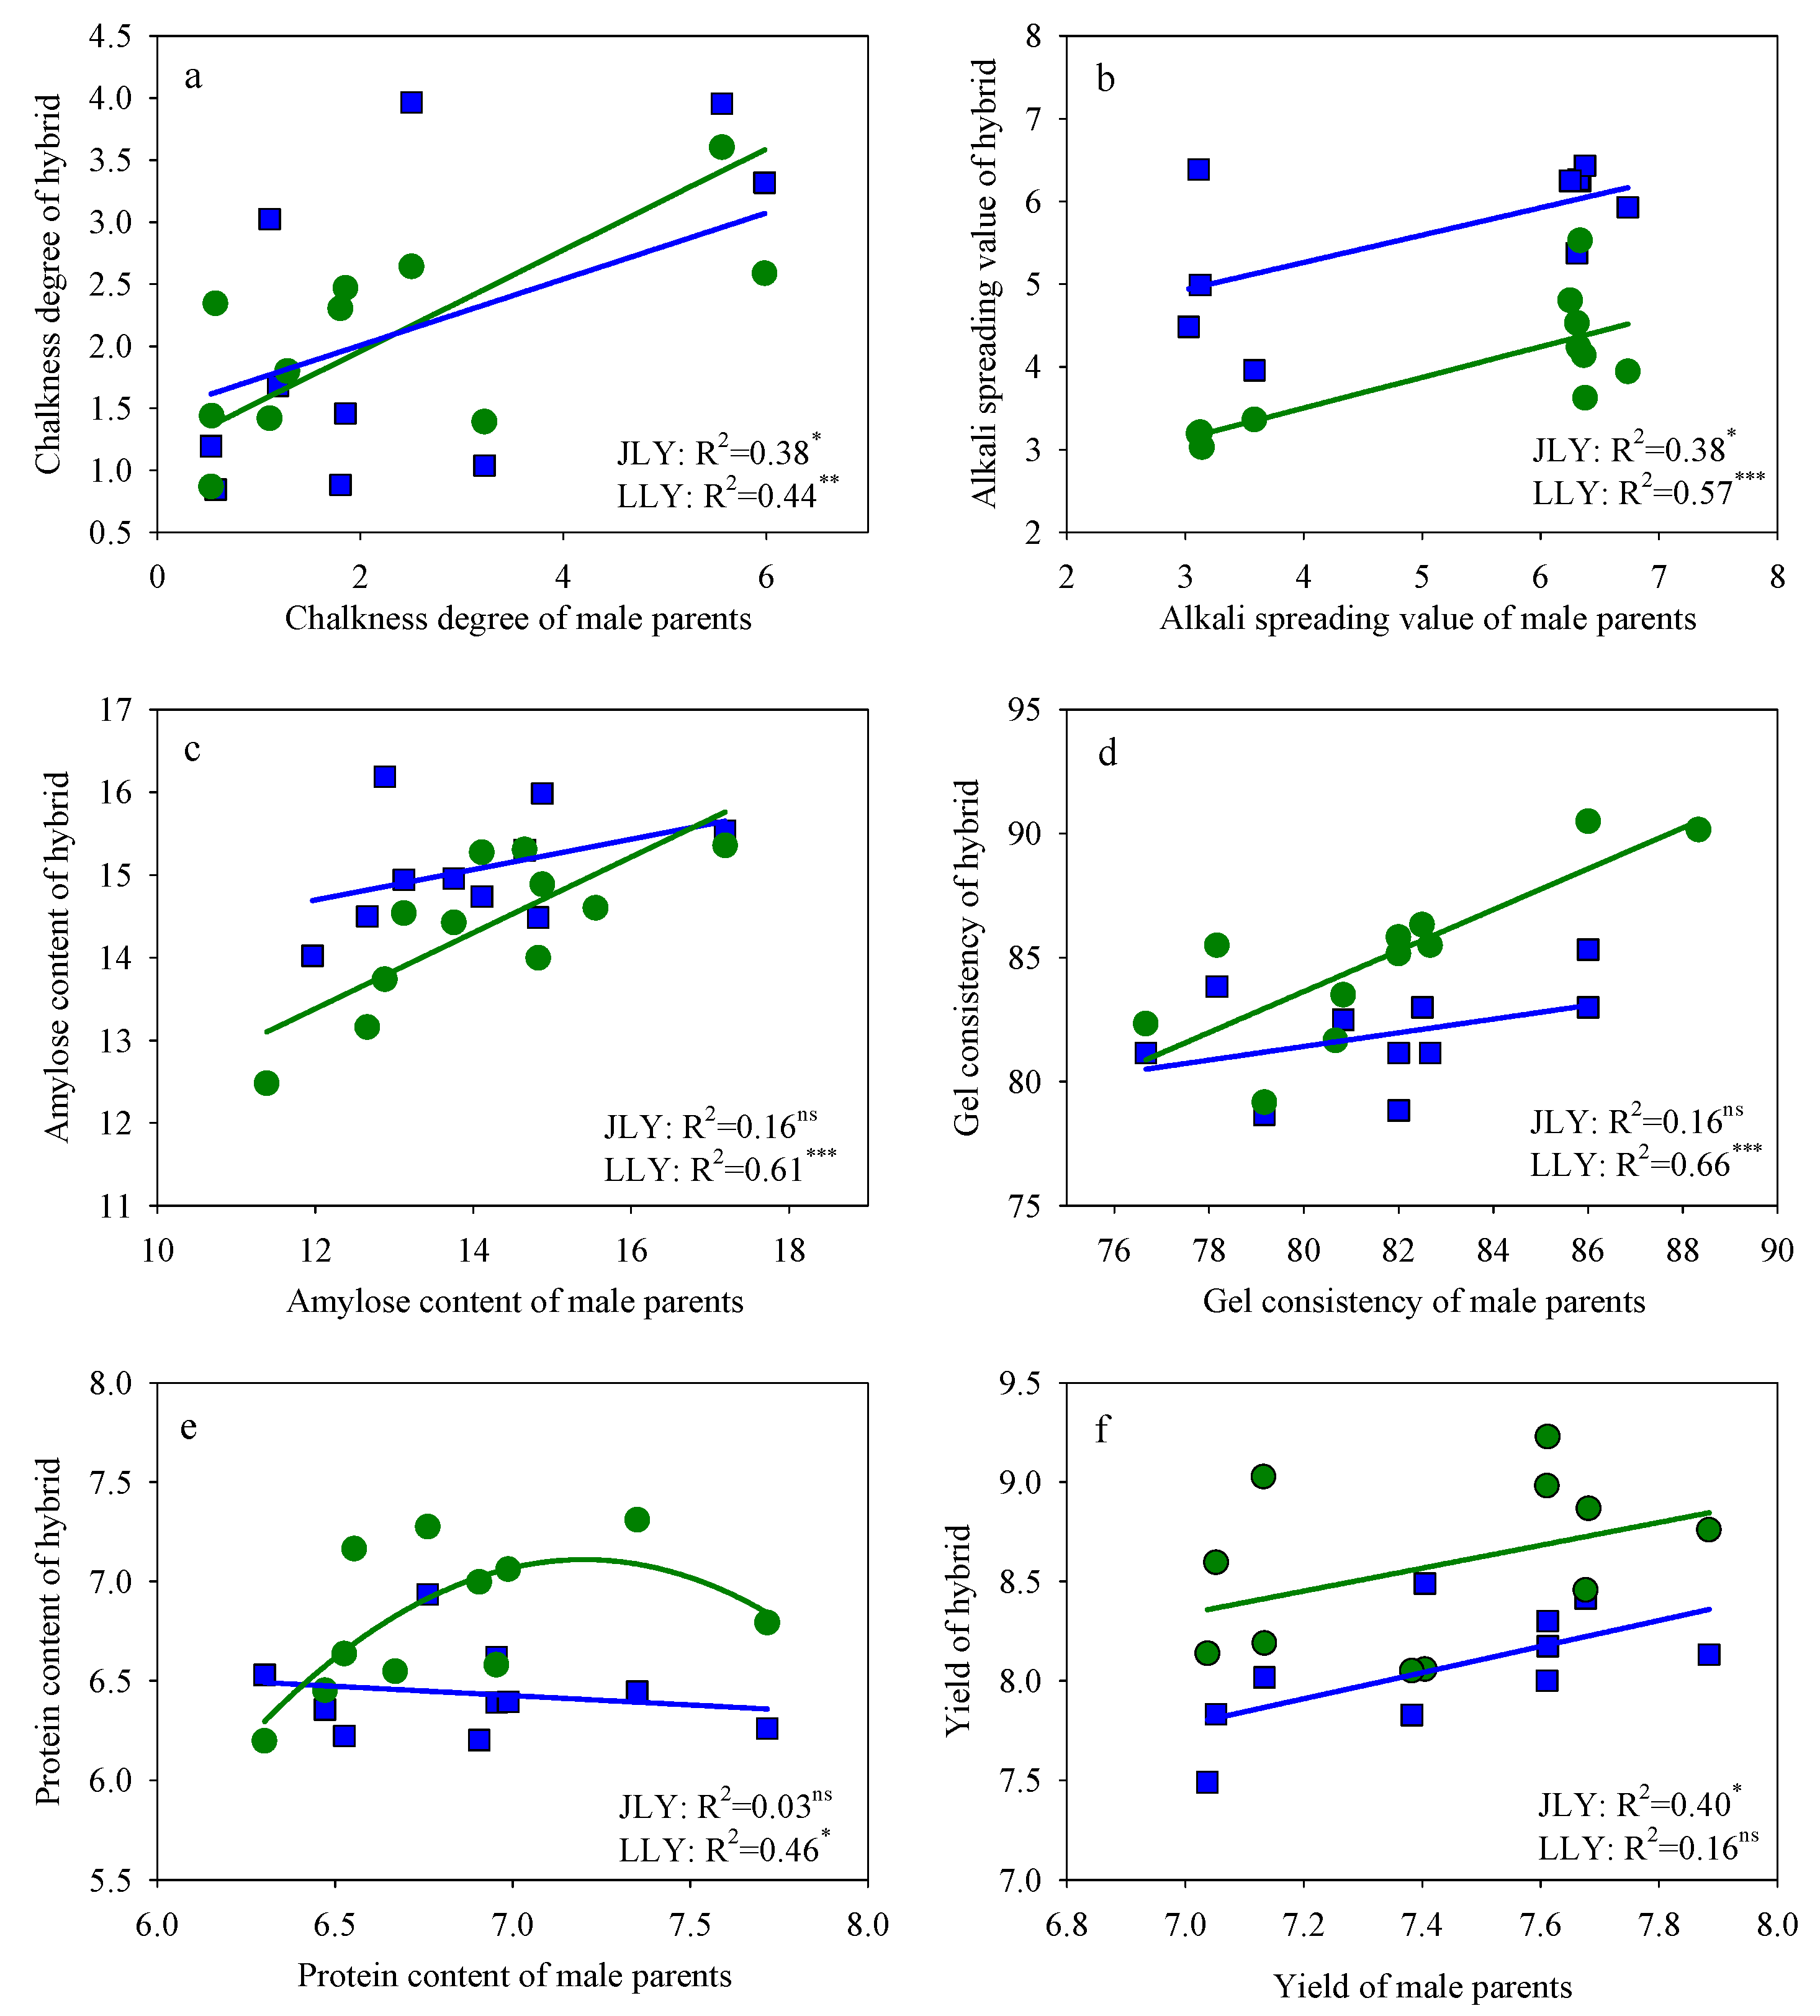
3.2. Correlation between Yield and Quality-Related Traits for Hybrid Varieties

There were significant correlations between yield, NUE, and quality-related parameters (Figure 2). Grain yield negatively correlated with ASV at p < 0.01 but positively correlated with biomass, HI, TN, NHI, and GC at p < 0.05. For yield components, grain weight positively correlated with chalkiness but negatively correlated with ASV; grain filling percentage positively correlated with NHI, spikelets m−2 and spikelets per panicle positively correlated with NUEg but negatively correlated with protein content and chalkiness degree; and panicle No. positively correlated with ASV but negatively correlated with GC and chalkiness degree. Total N uptake negatively correlated with AC and ASV at p < 0.01, while NUEg positively correlated with AC at p < 0.01. Protein content negatively correlated with AC at p < 0.01.

3.3. Grain Yield, Grain Quality, and Nitrogen Use Efficiency of the Male Parents

There were significant differences in parameters related with grain yield, quality, and NUE among the male parents in 2020 (Table 4). There was no significant difference in grain yield between the male parents and HHZ except for R1125, R1377, R3189, and R149. The difference in grain yield of these male parents was mainly due to variation in the total dry weight. Both N uptake and NUEg contributed to the variation in grain yield among the male parents, for example R1206 had the highest N uptake of 139.0 kg ha−1, while HZ had the highest NUEg of 57.8 kg kg−1. R1212 had medium N uptake and lower NUEg.
The test hybrid varieties had significantly lower AC than the control inbred variety HHZ except for R3189. R1199, R1988, R8612, R149, and HZ had lower ASV than the other varieties (Table 4). Correlations between male parents and hybrids in yield and quality related parameters were different depending on the female parent (Figure 3). Quality-related parameters for LLY hybrid varieties were more related with that of the male parents (Figure 3a–e). However, the male parents had larger effects on yield variation in JLY hybrid varieties (R2 = 0.40; Figure 3f).

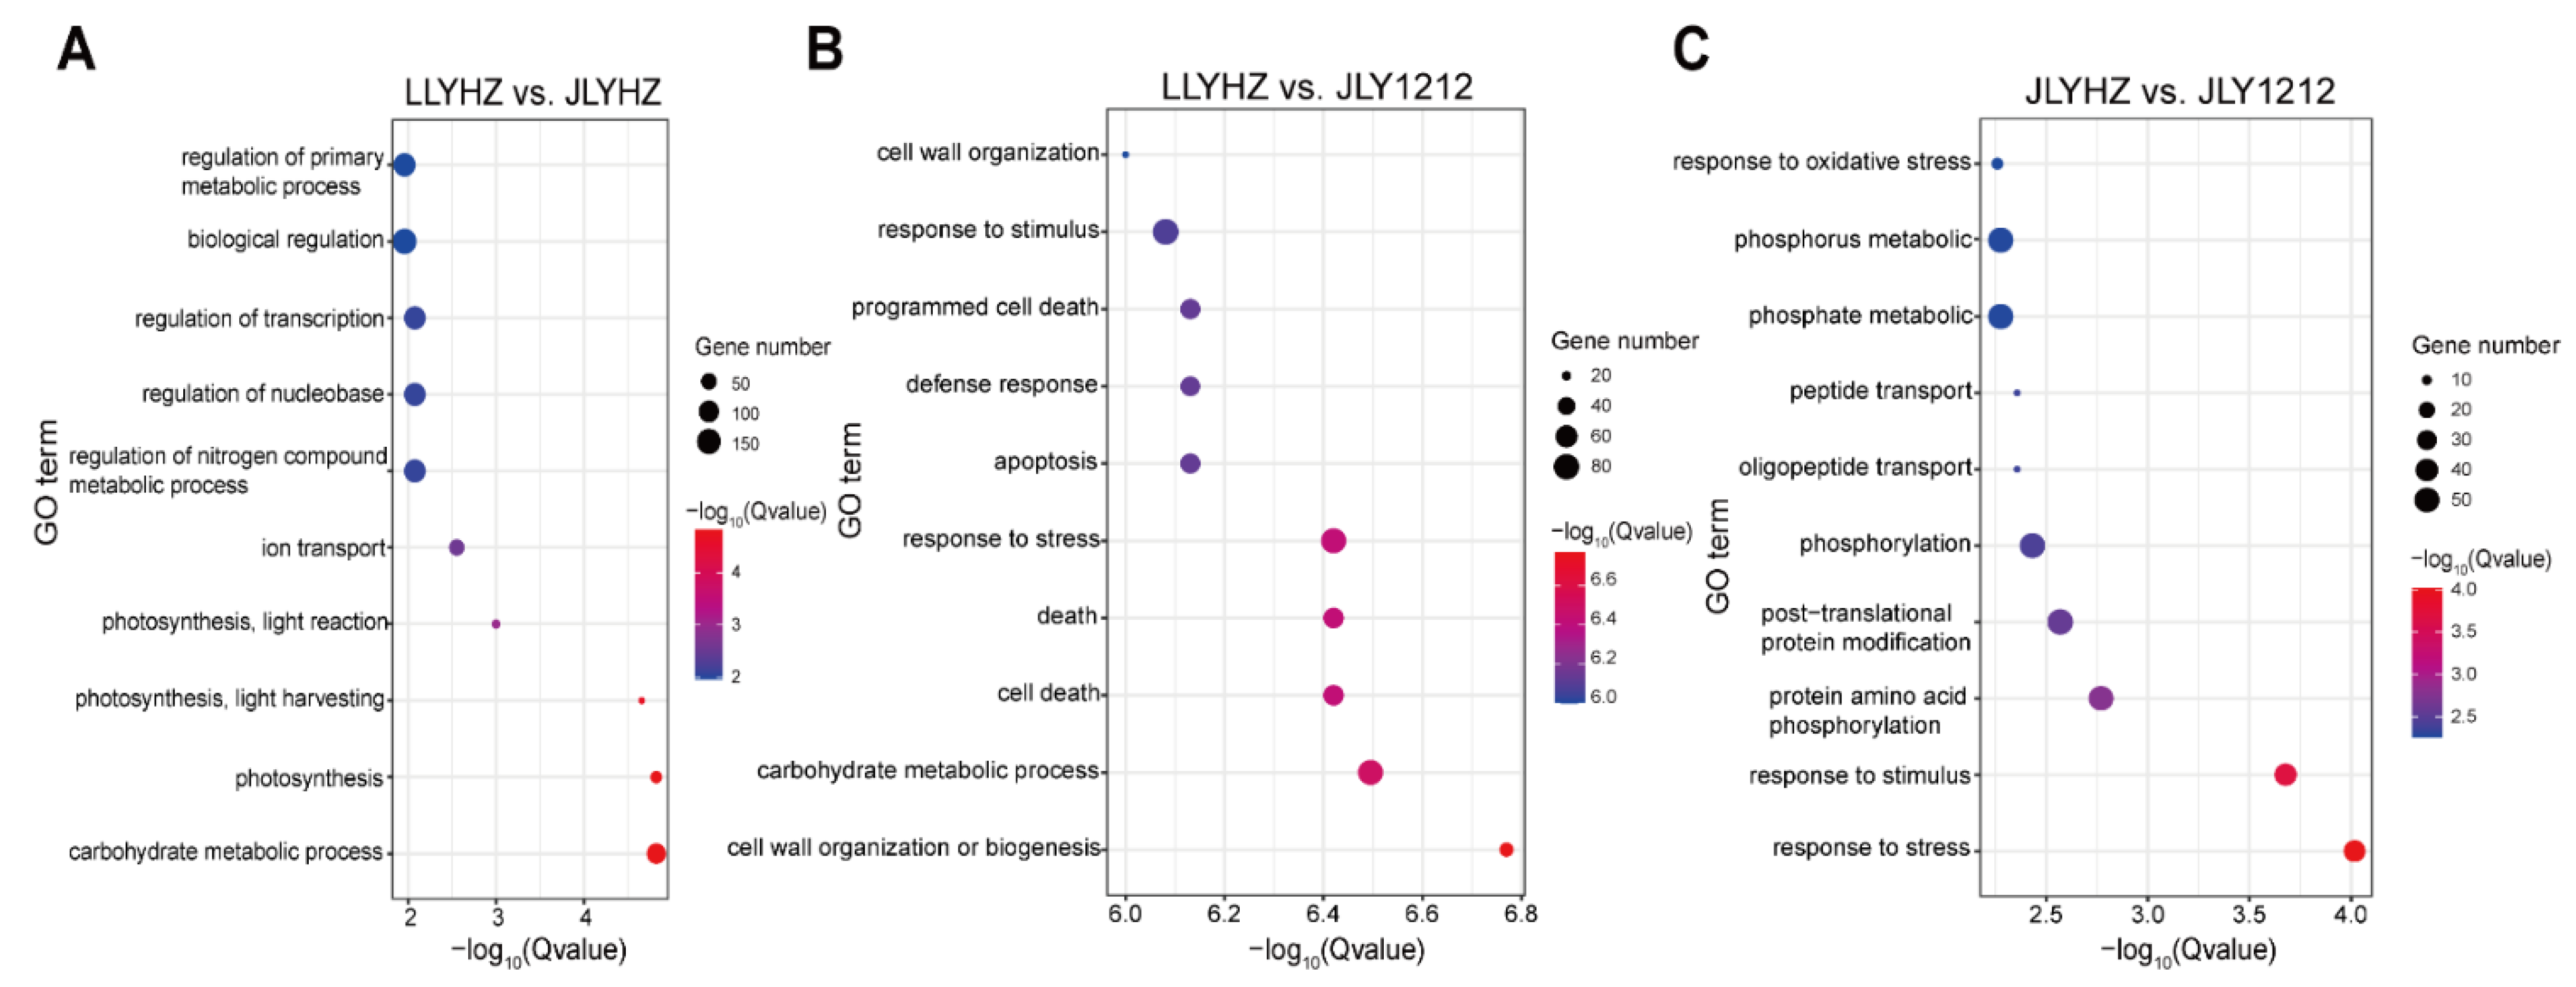
3.4. Transcriptomic Analysis of LLYHZ, JLYHZ and JLY1212

Based on the results of yield, NUE, and quality, LLYHZ with high and stable yield, JLYHZ with medium yield and eating quality, and JLY1212 with premium eating quality were selected for RNA sequencing (RNA-Seq) to investigate the molecular mechanisms underlying the differences in grain yield and quality (Tables S4 and S5; Figure 4, Figures S3 and S4). The up-regulated DEGs of LLYHZ relative to JLYHZ were mostly related to carbohydrate metabolic process, photosynthesis (especially light reaction), and ion transport (Figure 4A), while those relative to JLY1212 were associated with cell wall organization or biogenesis, carbohydrate metabolic process, cell death and stress response (Figure 4B). Most of the up-regulated genes in JLYHZ compared with JLY1212 were involved in response to stress and stimulus (Figure 4C).
The DEGs with known functions and particularly associations with yield and eating quality were screened out, and the overlapping DEGs between LLYHZ and JLYHZ or JLY1212 are shown in Table S5. The DEGs related to growth and yield were involved in root growth, plant height, nitrogen assimilation, plant type (tiller and leaf angle), and panicle formation (Table S5). The sixteen DEGs related to panicle development can be divided into two categories, namely grain quality and yield components. Most of the DEGs related to grain quality including Wx and ALK were down-regulated, while those related to spikelet number and grain size were mostly up-regulated in LLYHZ (Table 5).

4. Discussion

4.1. Physiological and Molecular Traits Limiting the Grain Yield of Hybrid Varieties Derived from Jing4155S

In the present study, grain yield and quality were negatively related to each other, and generally, varieties with Longke638S as the female parent had higher yield but lower eating quality compared with those with Jing4155S as the female parent (Table 1 and Table 2; Figure 1 and Figure 2). The higher yield resulted from higher dry matter accumulation and higher N uptake (Figure 1 and Figure 2). These results are consistent with the previous finding that genetic improvement in yield potential of rice is associated with concomitant improvement of dry matter accumulation, radiation use efficiency, and N use efficiency [13,36]. Through transcriptomic analysis of three representative super hybrid varieties, namely LLYHZ, JLYHZ, and JLY1212 (Table 5 and Table S5), it was found that the larger panicle size of LLYHZ was possibly related to the down-regulated expression of OsHAP3E, which is a negative regulator of panicle and spikelet development [37], and up-regulated expression of positive regulators such as OsFOR1 [38], OsYABBY5 [39], OsEBS [40], and OsJAR1 [41]. Crop yield is largely dependent on N uptake and utilization, which are significantly affected by root architecture and morphology [42]. Here, we found differences in the expression of several genes related to root elongation between LLYHZ and JLYHZ or JLY1212 (Table S5). Moreover, OsNiR, which promotes N uptake and signaling, was also up-regulated in LLYHZ (Table S5). Moreover, DEGs related to photosynthesis, especially the light reaction, were up-regulated in LLYHZ compared with JLYHZ (Figure 4A), which might be related with the higher biomass of LLYHZ.
Yield stability across different planting years is another important factor limiting the yield of hybrid varieties derived from Jing4155S. For example, JLYHZ had the highest yield stability while JLY1212 had the lowest yield stability across years (Table 1). Previous studies have demonstrated that variations in grain yield across different planting years are mainly associated with the variations in temperature in central China [29]. In this study, OsHSBP2, a negative regulator of heat shock response [43], was down-regulated in LLYHZ compared with JLYHZ and JLY1212 (Table S5). Moreover, many other genes related to drought, salinity, and blast resistance were also differentially expressed between LLYHZ and JLYHZ or JLY1212 (Figure 4; Table S5). These molecular characteristics may be utilized to improve the yield stability of high-quality varieties across different environmental and management conditions.

4.2. Physiological and Molecular Traits for Improving Grain Quality of Hybrid Varieties Derived from Longke638S

In the present study, compared with FLY4, most of the varieties had higher head rice rate and lower chalkiness, demonstrating genetic improvement in milling and appearance quality (Table 2). Hybrid varieties derived from Jing4155S had higher ASV and AC, but lower GC than that derived from Longke638S (Figure 1; Table 2), which resulted from the change in gene expression involved in starch biosynthesis [17,18]. Wx and ALK are the major genes determining AC and ASV, respectively, and they both had minor effects on GC [18,44]. Both of the two genes were down-regulated in LLYHZ compared with JLYHZ and JLY1212 (Table 5). Mutation of OsPPDKB also resulted in down-regulation of Wx expression, and then reduced the AC [45]. Some other genes involved in starch biosynthesis, including Pho1, OsAGPL2, OsSSIIIa, and OsISA1 were also down-regulated in LLYHZ (Table 5) [17,46]. These traits may serve as potential breeding targets for further improving the eating quality of hybrid varieties derived from Longke638S. For example, Huang et al. [47] found that coordinated regulation of amylose and amylopectin synthesis via manipulation of SSII-2, SSII-3, and Wx expression in endosperm can improve rice eating and cooking quality. Eating quality-related traits of hybrid varieties with Longke638S as the female parent were affected by the male parent significantly (Figure 3); therefore, selecting a male parent with superior eating quality is essential in hybrid breeding using Longke638S.

4.3. Coordination of High Yield and Superior Quality

Balancing grain yield, quality, and stress (abiotic or biotic) tolerance is a great challenge for rice sustainable production in a continuously changing climate scenario. In the present study, LLYHZ, JLYHZ, JLY1212, and several other hybrids are all super hybrid varieties designated by MARA; moreover, JLY1212 had superior eating quality (level 2 in Cooking Rice Variety Quality, NY/T 593-2013). However, it was found that hybrids derived from Longke638S including LLYHZ had high yield potential and stability, but lower grain quality mainly due to the lower AC and ASV. Moreover, ASV was negatively related with yield and yield components such as grain weight, spikelets per panicle, total dry weight and N uptake, and AC negatively correlated with total N uptake and protein content (Figure 2). Wx and ALK are the major genes determining AC and ASV, respectively; however, the effects of natural allelic variation in Wx and ALK on grain yield and the physiological mechanisms deserve further investigation. Although JLY1212 and JLYHZ were super hybrid varieties with high yield potential, both of them had lower grain yield stability. This was mainly due to the lower N uptake and biomass production at a low N fertilizer rate in present study (Table 3 and Table S3). Therefore, it is important to improve N uptake capacity of Jing4155S or select restorer lines with high N uptake and biomass production for hybrid breeding with Jing4155S.
The frequently observed negative relationships among grain yield, quality, and stress tolerance are ascribable to the competition in resource allocation and deleterious genetic linkage, since each of the three complex traits is controlled by a number of quantitative genes, some of which exhibit pleiotropic effects [26,48]. In this study, some DEGs between high-yield and high-quality varieties were also found to have pleiotropic effects on several traits related to growth or stress tolerance (Table 5 and Table S5). By taking advantage of the allelic variation in qGW7 (a QTL for rice grain quality), Wang et al. [24] realized the improvement of rice yield and quality simultaneously. Xiao et al. [26] also broke the deleterious linkage between yield, taste quality, and blast resistance through the identification of several superior alleles for these traits. Therefore, more studies are required to identify and pyramiding the superior alleles for eating quality-related traits, such as Wx and ALK [19].

5. Conclusions

Elucidation of the physiological and molecular traits related to high yield and superior quality will facilitate the improvement of the widely planted hybrid rice varieties. In the present study, these traits were investigated using an incomplete diallel cross population with Longke638S and Jing4155S as female parents. The results suggest that for rice hybrid varieties with superior grain quality derived from Jing4155S, sink size (panicle and grain size), biomass production (N uptake and optimized plant type), and yield stability across planting years are essential physiological traits that may serve as the targets to improve their yields; while for high yield hybrid varieties derived from Longke638S, grain quality improvement may be achieved by optimizing the amylose content, ASV, and protein content. These physiological targets can be tailored simultaneously through the pyramiding of superior genes for these traits, which still require more extensive studies with more germplasm resources.

Supplementary Materials

The following supporting information can be downloaded at: https://www.mdpi.com/article/10.3390/agronomy12071628/s1. Table S1: Information about tested rice varieties used in the experiment. Table S2: Yield components of tested hybrid rice varieties in 2019 and 2020. Table S3: Dry matter accumulation and harvest index of tested hybrid rice varieties in 2019 and 2020. Table S4: Number of differentially expressed genes between LLYHZ, JLYHZ, and JLY1212 in spikelets at flowering stage in 2020. Table S5: The overlapping genes differentially expressed between LLYHZ and JLYHZ and between LLYHZ and JLY1212 in panicle at flowering stage. Figure S1: Climate conditions during rice growing period in 2019 and 2020. Figure S2: Scores plots of hybrid varieties with Longke638S as the female parent (LLY), those with Jingke4155S as the female parent (JLY) and the control variety (Fengliangyou4, FLY) based on traits related with grain yield, quality and nitrogen use efficiency in 2019 (a) and 2020 (b). Figure S3: GO analysis of the molecular function of up-regulated genes in spikelets at flowering stage of LLYHZ compared with JLYHZ (A), LLYHZ, compared with JLY1212 (B), and JLYHZ compared with JLY1212 (C). Figure S4: GO analysis of the cellular component of up-regulated genes in spikelets at flowering stage of LLYHZ compared with JLYHZ (A), LLYHZ compared with JLY1212 (B).

Author Contributions

S.X., W.Y. and K.W. were responsible for the experimental work, and took joint responsibility with F.W. for writing the manuscript and drawing the figures. Y.F. and T.D. were responsible for determining the grain quality. Y.Y. and F.W. was responsible for the experimental design, analyzing the data, writing the manuscript and drawing the figures with W.Y. All authors have read and agreed to the published version of the manuscript.

Funding

This work was supported by the National Natural Science Foundation of China (No.32071948) and the Fundamental Research Funds for the Central Universities (2662020ZKPY015), and Guangxi Natural Science Foundation (2022GXNSFAA035488).

Institutional Review Board Statement

Not applicable.

Informed Consent Statement

Not applicable.

Conflicts of Interest

The authors declare no conflict of interest.

References

  1. Khush, G.S. Green revolution: The way forward. Nat. Rev. Genet. 2001, 2, 815–822. [Google Scholar] [CrossRef] [PubMed]
  2. Yuan, L. Strategy of hybrid rice breeding. Hybrid Rice 1987, 1, 1–3. [Google Scholar]
  3. Peng, S.B.; Cassman, K.G.; Virmani, S.S.; Sheehy, J.; Khush, G.S. Yield potential trends of tropical rice since the release of IR8 and the challenge of increasing rice yield potential. Crop Sci. 1999, 39, 1552–1559. [Google Scholar] [CrossRef] [Green Version]
  4. Wang, F.; Peng, S.B. Yield potential and nitrogen use efficiency of China’s super rice. J. Integr. Agric. 2017, 16, 1000–1008. [Google Scholar] [CrossRef] [Green Version]
  5. Peng, S.B. Dilemma and way-out of hybrid rice during the transition period in China. Acta Agron. Sin. 2016, 42, 313–319. [Google Scholar] [CrossRef]
  6. Zhang, Q.F. Strategies for developing green super rice. Proc. Natl. Acad. Sci. USA 2007, 104, 16402–16409. [Google Scholar] [CrossRef] [PubMed] [Green Version]
  7. Zeng, D.; Tian, Z.; Rao, Y.; Dong, G.; Yang, Y.; Huang, L.; Leng, Y.; Xu, J.; Sun, C.; Zhang, G.; et al. Rational design of high-yield and superior-quality rice. Nat. Plants 2017, 3, 17031. [Google Scholar] [CrossRef] [PubMed]
  8. Custodio, M.C.; Cuevas, R.P.; Ynion, J.; Laborte, A.G.; Velasco, M.L.; Demont, M. Rice quality: How is it defined by consumers, industry, food scientists, and geneticists? Trends Food Sci. Technol. 2019, 92, 122–137. [Google Scholar] [CrossRef]
  9. Zhou, H.; Xia, D.; He, Y. Rice grain quality-traditional traits for high quality rice and health-plus substances. Mol. Breed. 2019, 40, 1. [Google Scholar] [CrossRef]
  10. Ma, Y.; Li, S.; Wang, Y.; Li, H.; Gao, K. Preliminary study on quality traits of indica hybrid rice. Southest Chnia J. Agric. Sci. 2002, 15, 28–31. [Google Scholar]
  11. Liao, F.; Zhou, K.; Yang, H.; Xu, Q. Comparison of grain quality between F1 hybrids and their parents in indica hybrid rice. Chin. J. Rice Sci. 2003, 17, 134–140. [Google Scholar]
  12. Lin, H.; Wang, Z.; Li, H.; Pang, Q. Analysis on characteristics of rice varieties registered in China in 2019. Chnia Rice 2020, 26, 16–22. [Google Scholar]
  13. Zhu, G.; Peng, S.; Huang, J.; Cui, K.; Nie, L.; Wang, F. Genetic improvements in rice yield and concomitant increases in radiation- and nitrogen-use efficiency in middle reaches of Yangtze River. Sci. Rep. 2016, 6, 21049. [Google Scholar] [CrossRef] [PubMed] [Green Version]
  14. Huang, L.; Sun, F.; Yuan, S.; Peng, S.; Wang, F. Different mechanisms underlying the yield advantage of ordinary hybrid and super hybrid rice over inbred rice under low and moderate N input conditions. Field Crops Res. 2018, 216, 150–157. [Google Scholar] [CrossRef]
  15. Wei, H.Y.; Zhang, H.C.; Blumwald, E.; Li, H.L.; Cheng, J.Q.; Dai, Q.G.; Huo, Z.Y.; Xu, M.; Guo, B.W. Different characteristics of high yield formation between inbred japonica super rice and inter-sub-specific hybrid super rice. Field Crops Res. 2016, 198, 179–187. [Google Scholar] [CrossRef]
  16. Nakamura, Y. Towards a better understanding of the metabolic system for amylopectin biosynthesis in plants: Rice endosperm as a model tissue. Plant Cell Physiol. 2002, 43, 718–725. [Google Scholar] [CrossRef]
  17. Ohdan, T.; Francisco, P.B.; Sawada, T.; Hirose, T.; Terao, T.; Satoh, H.; Nakamura, Y. Expression profiling of genes involved in starch synthesis in sink and source organs of rice. J. Exp. Bot. 2005, 56, 3229–3244. [Google Scholar] [CrossRef] [Green Version]
  18. Tian, Z.; Qian, Q.; Liu, Q.; Yan, M.; Liu, X.; Yan, C.; Liu, G.; Gao, Z.; Tang, S.; Zeng, D.; et al. Allelic diversities in rice starch biosynthesis lead to a diverse array of rice eating and cooking qualities. Proc. Natl. Acad. Sci. USA 2009, 106, 21760–21765. [Google Scholar] [CrossRef] [Green Version]
  19. Sreenivasulu, N.; Zhang, C.; Tiozon, R.N.; Liu, Q. Post-genomics revolution in the design of premium quality rice in a high-yielding background to meet consumer demands in the 21st century. Plant Commun. 2022, 3, 100271. [Google Scholar] [CrossRef]
  20. Kashiwagi, T. Effects of rice grain protein QTL, TGP12, on grain composition, yield components, and eating quality with different nitrogen applications. Field Crops Res. 2021, 263, 108051. [Google Scholar] [CrossRef]
  21. Fu, C.; Hu, X.; Fu, X.; Qin, P.; Wang, K.; Li, C.; Wu, T.; Liu, S.; Yang, Y. Breeding and application of TGMS line Longke 638S with blast-resistance, good-quality and high combining-ability in middle-season indica rice. Chnia Rice 2021, 27, 61–66. [Google Scholar]
  22. Fu, C.; Hu, X.; Qin, P.; Fu, X.; Sun, Z.; Yang, G.; Wang, K.; Yang, Y. Breeding and application of medium indica TGMS line Jing 4155S with blast resistance, good grain quality and high combining ability in rice. Chnia Rice 2021, 36, 18–24. [Google Scholar]
  23. Yu, S.B.; Ali, J.; Zhou, S.C.; Ren, G.J.; Xie, H.A.; Xu, J.L.; Yu, X.Q.; Zhou, F.S.; Peng, S.B.; Ma, L.Y.; et al. From Green Super Rice to green agriculture: Reaping the promise of functional genomics research. Mol. Plant 2022, 15, 9–26. [Google Scholar] [CrossRef]
  24. Wang, S.; Li, S.; Liu, Q.; Wu, K.; Zhang, J.; Wang, S.; Wang, Y.; Chen, X.; Zhang, Y.; Gao, C.; et al. The OsSPL16-GW7 regulatory module determines grain shape and simultaneously improves rice yield and grain quality. Nat. Genet. 2015, 47, 949–954. [Google Scholar] [CrossRef] [PubMed]
  25. Gao, M.; He, Y.; Yin, X.; Zhong, X.; Yan, B.; Wu, Y.; Chen, J.; Li, X.; Zhai, K.; Huang, Y.; et al. Ca(2+) sensor-mediated ROS scavenging suppresses rice immunity and is exploited by a fungal effector. Cell 2021, 184, 5391–5404. [Google Scholar] [CrossRef] [PubMed]
  26. Xiao, N.; Pan, C.; Li, Y.; Wu, Y.; Cai, Y.; Lu, Y.; Wang, R.; Yu, L.; Shi, W.; Kang, H.; et al. Genomic insight into balancing high yield, good quality, and blast resistance of japonica rice. Genome Biol. 2021, 22, 283. [Google Scholar] [CrossRef]
  27. Wu, L.L.; Yuan, S.; Huang, L.Y.; Sun, F.; Zhu, G.L.; Li, G.H.; Fahad, S.; Peng, S.B.; Wang, F. Physiological mechanisms underlying the high-grain yield and high-nitrogen use efficiency of elite rice varieties under a low rate of nitrogen application in China. Front. Plant Sci. 2016, 7, 1024. [Google Scholar] [CrossRef] [Green Version]
  28. Shi, Y.; Dai, W.; Yang, J.; Tang, S.; Huang, Y.; Ma, J.; Wang, Z.; He, C.; Zhang, L. Popularization and application innovation of new rice varieties taking Jingliangyou 1212 as a case. China Rice 2020, 26, 85–87. [Google Scholar]
  29. Li, X.X.; Huang, L.Y.; Peng, S.B.; Wang, F. Inter-annual climate variability constrains rice genetic improvement in China. Food Energy Secur. 2021, 11, e299. [Google Scholar] [CrossRef]
  30. Kawahara, Y.; de la Bastide, M.; Hamilton, J.P.; Kanamori, H.; McCombie, W.R.; Ouyang, S.; Schwartz, D.C.; Tanaka, T.; Wu, J.Z.; Zhou, S.G.; et al. Improvement of the Oryza sativa Nipponbare reference genome using next generation sequence and optical map data. Rice 2013, 6, 10. [Google Scholar] [CrossRef] [Green Version]
  31. Kim, D.; Paggi, J.M.; Park, C.; Bennett, C.; Salzberg, S.L. Graph-based genome alignment and genotyping with HISAT2 and HISAT-genotype. Nat. Biotechnol. 2019, 37, 907–915. [Google Scholar] [CrossRef] [PubMed]
  32. Pertea, M.; Pertea, G.M.; Antonescu, C.M.; Chang, T.C.; Mendell, J.T.; Salzberg, S.L. StringTie enables improved reconstruction of a transcriptome from RNA-seq reads. Nat. Biotechnol. 2015, 33, 290–295. [Google Scholar] [CrossRef] [PubMed] [Green Version]
  33. Love, M.I.; Huber, W.; Anders, S. Moderated estimation of fold change and dispersion for RNA-seq data with DESeq2. Genome Biol. 2014, 15, 38. [Google Scholar] [CrossRef] [PubMed] [Green Version]
  34. Mevik, B.H.; Wehrens, R. The pls package: Principal component and partial least squares regression in R. J. Stat. Softw. 2007, 18, 1–23. [Google Scholar] [CrossRef] [Green Version]
  35. Kuhn, M. Contributions from Jed Wing and Steve Weston and Andre Williams. Caret Classif. Regres. Train. 2008, 3, 40–45. [Google Scholar]
  36. Huang, L.; Yang, D.; Li, X.; Peng, S.; Wang, F. Coordination of high grain yield and high nitrogen use efficiency through large sink size and high post-heading source capacity in rice. Field Crops Res. 2019, 233, 49–58. [Google Scholar] [CrossRef]
  37. Zhang, J.J.; Xue, H.W. OsLEC1/OsHAP3E participates in the determination of meristem identity in both vegetative and reproductive developments of rice. J. Integr. Plant Biol. 2013, 55, 232–249. [Google Scholar] [CrossRef] [PubMed]
  38. Jang, S.H.; Lee, B.; Kim, C.; Kim, S.J.; Yim, J.; Han, J.J.; Lee, S.; Kim, S.R.; An, G. The OsFOR1 gene encodes a polygalacturonase-inhibiting protein (PGIP) that regulates floral organ number in rice. Plant Mol. Biol. 2003, 53, 357–369. [Google Scholar] [CrossRef]
  39. Tanaka, W.; Toriba, T.; Ohmori, Y.; Yoshida, A.; Kawai, A.; Mayama-Tsuchida, T.; Ichikawa, H.; Mitsuda, N.; Ohme-Takagi, M.; Hirano, H.Y. The YABBY gene TONGARI-BOUSHI1 is involved in lateral organ development and maintenance of meristem organization in the rice spikelet. Plant Cell 2012, 24, 80–95. [Google Scholar] [CrossRef] [Green Version]
  40. Dong, X.; Wang, X.; Zhang, L.; Yang, Z.; Xin, X.; Wu, S.; Sun, C.; Liu, J.; Yang, J.; Luo, X. Identification and characterization of OsEBS, a gene involved in enhanced plant biomass and spikelet number in rice. Plant Biotechnol. J. 2013, 11, 1044–1057. [Google Scholar] [CrossRef]
  41. Xiao, Y.; Chen, Y.; Charnikhova, T.; Mulder, P.P.; Heijmans, J.; Hoogenboom, A.; Agalou, A.; Michel, C.; Morel, J.B.; Dreni, L.; et al. OsJAR1 is required for JA-regulated floret opening and anther dehiscence in rice. Plant Mol. Biol. 2014, 86, 19–33. [Google Scholar] [CrossRef] [PubMed]
  42. Xu, G.; Fan, X.; Miller, A.J. Plant nitrogen assimilation and use efficiency. Annu. Rev. Plant Biol. 2012, 63, 153–182. [Google Scholar] [CrossRef] [PubMed] [Green Version]
  43. Rana, R.M.; Dong, S.; Tang, H.; Ahmad, F.; Zhang, H. Functional analysis of OsHSBP1 and OsHSBP2 revealed their involvement in the heat shock response in rice (Oryza sativa L.). J. Exp. Bot. 2012, 63, 6003–6016. [Google Scholar] [CrossRef] [PubMed] [Green Version]
  44. Gao, Z.; Zeng, D.; Cheng, F.; Tian, Z.; Guo, L.; Su, Y.; Yan, M.; Jiang, H.; Dong, G.; Huang, Y.; et al. ALK, the key gene for gelatinization temperature, is a modifier gene for gel consistency in rice. J. Integr. Plant Biol. 2011, 53, 756–765. [Google Scholar]
  45. Zhang, L.; Zhao, L.; Lin, L.; Zhao, L.; Liu, Q.; Wei, C. A Novel Mutation of OsPPDKB, Encoding Pyruvate Orthophosphate Dikinase, Affects Metabolism and Structure of Starch in the Rice Endosperm. Int. J. Mol. Sci. 2018, 19, 2268. [Google Scholar] [CrossRef] [Green Version]
  46. Nakamura, Y.; Ono, M.; Utsumi, C.; Steup, M. Functional interaction between plastidial starch phosphorylase and starch branching enzymes from rice during the synthesis of branched maltodextrins. Plant Cell Physiol. 2012, 53, 869–878. [Google Scholar] [CrossRef] [Green Version]
  47. Huang, L.; Gu, Z.; Chen, Z.; Yu, J.; Chu, R.; Tan, H.; Zhao, D.; Fan, X.; Zhang, C.; Li, Q.; et al. Improving rice eating and cooking quality by coordinated expression of the major starch synthesis-related genes, SSII and Wx, in endosperm. Plant Mol. Biol. 2021, 106, 419–432. [Google Scholar] [CrossRef]
  48. Zhao, K.; Tung, C.W.; Eizenga, G.C.; Wright, M.H.; Ali, M.L.; Price, A.H.; Norton, G.J.; Islam, M.R.; Reynolds, A.; Mezey, J.; et al. Genome-wide association mapping reveals a rich genetic architecture of complex traits in Oryza sativa. Nat. Commun. 2011, 2, 467. [Google Scholar] [CrossRef]
Figure 1. Differences between hybrid varieties derived from 4155S (JLY), hybrid varieties derived from longke638S (LLY) and the control variety Fengliangyou4 (FLY) in parameters related with grain yield, grain quality, and nitrogen use efficiency in 2019 (a) and 2020 (b). Variable Importance in Projection (VIP) is a weighted sum of squares of the Partial Least Squares (PLS)loadings taking into account the amount of explained Y-variation in each dimension shown in Figure S2.
Agronomy 12 01628 g001
Figure 2. Correlations between parameters related with grain yield, grain quality, and nitrogen use efficiency. * and ** represent significance at p < 0.05 and p < 0.01, respectively. GF: grain filling percentage; GW: grain weight; GY: grain yield; HI: harvest index; TN: Total N uptake; NUEg: nitrogen use efficiency for grain production; NUEb: nitrogen use efficiency for biomass production; ASV: alkali spreading value; GC: gel consistency; AC: amylose content; PC: protein content.
Agronomy 12 01628 g002
Figure 3. Correlations of chalkiness degree (a), alkali spreading value (b), amylose content (c), gel consistency (d), protein content (e) and yield (f) between hybrids and their male parents in 2020. ns: non significance; *, **, and *** represent significance at p < 0.1, p < 0.05, and p < 0.01, respectively. LLY (the green circle) and JLY (the blue square) represent hybrids derived from Longke638S and Jing4155S, respectively.
Agronomy 12 01628 g003
Figure 4. Gene ontology (GO) analysis of the biological process of up-regulated genes in spikelets at flowering stage between LLYHZ and JLYHZ (A), between LLYHZ and JLY1212 (B), and between JLYHZ and JLY1212 (C).
Agronomy 12 01628 g004
Table 1. The yield of tested hybrid rice varieties in 2019 and 2020.
VarietyYield in 2019
(t ha−1)
Yield in 2020
(t ha−1)
Average Yield
(t ha−1)
Coefficient of Variation (%)
LLYHZ9.129.239.180.85
LLY5349.238.879.052.81
LLY12069.238.768.993.69
LLY86128.898.988.940.71
LLY1498.449.038.734.78
LLY13778.788.608.691.46
JLYHZ8.938.178.556.29
JLY12068.738.138.435.03
JLY19888.438.418.420.17
LLY19888.358.468.400.93
LLYHLZ8.718.058.385.57
LLY31898.448.198.322.13
JLYHLZ8.657.838.247.04
JLY86128.188.008.091.57
JLY13778.187.838.003.09
JLY31897.908.027.961.07
LLY11257.628.147.884.67
JLY12127.198.497.8411.72
JLY11258.007.497.744.66
JLY11997.158.307.7210.53
LLY12127.318.067.686.90
FLY47.998.308.142.69
LSD (0.05)0.840.60
Note: Critical values based on LSD test (0.05) were used for comparison of different varieties.
Table 2. The rice quality of tested hybrid rice varieties in 2019 and 2020.
VarietyHR (%)CGR (%)CD
(%)
ASVGC
(mm)
AC (%)PC
(%)
HR (%)CGR (%)CD
(%)
ASVGC
(mm)
AC (%)PC (%)
20192020
LLYHZ63.25.71.33.383.79.47.566.87.71.43.285.813.77.3
LLY53466.16.31.24.083.311.57.267.09.91.84.181.714.66.5
LLY120659.65.71.05.080.09.57.065.35.40.94.286.313.26.8
LLY861257.47.32.13.086.010.06.761.814.72.63.485.514.06.2
LLY14941.45.71.23.086.08.87.158.47.41.43.090.212.57.2
LLY137758.99.72.05.083.311.46.964.612.22.34.879.215.37.1
JLYHZ63.19.02.35.082.310.46.766.015.63.06.481.216.26.9
JLY120664.210.31.66.079.011.27.066.36.31.26.383.014.56.3
JLY198860.017.04.44.783.010.47.564.415.74.05.083.014.96.2
LLY198858.010.02.33.087.79.47.863.711.92.63.290.514.56.6
LLYHLZ64.411.72.94.385.711.27.265.112.22.54.582.315.36.5
LLY318958.416.34.44.384.311.47.363.316.73.63.985.215.47.0
JLYHLZ45.78.71.96.080.711.67.166.97.31.55.481.214.76.4
JLY861252.119.05.85.084.010.96.763.314.93.34.083.814.56.5
JLY137758.310.02.06.079.311.57.166.95.60.96.378.715.36.4
JLY318961.417.33.96.080.311.57.364.518.94.05.978.815.56.2
LLY112543.012.02.55.081.310.47.265.47.71.45.585.514.46.6
JLY121245.811.02.46.080.311.37.666.74.90.86.482.516.06.4
JLY112559.813.32.56.080.711.27.566.17.11.06.381.215.06.4
JLY119954.28.72.05.381.79.67.363.48.01.74.585.314.06.6
LLY121259.33.30.84.382.711.67.564.012.02.33.683.514.97.3
FLY442.224.35.26.080.312.57.363.718.54.16.379.016.86.5
LSD (0.05)3.33.71.10.62.50.40.72.04.91.30.84.00.70.5
Critical values based on LSD test (0.05) were used for comparison of different varieties. HR: heading rice rate; CGR: chalky grain rate; CD: chalkiness degree; ASV: alkali spreading value; GC; gel consistency; AC: amylose content; PC: protein content.
Table 3. Nitrogen use efficiency of tested hybrid rice varieties in 2019 and 2020.
VarietyN Uptake
(kg ha−1)
NHI
(%)
NUEg
(kg kg−1)
NUEb
(kg kg−1)
N Uptake
(kg ha−1)
NHI
(%)
NUEg
(kg kg−1)
NUEb
(kg kg−1)
20192020
LLYHZ150.168.554.3110.8142.668.156.0108.3
LLY534142.065.854.8115.1130.570.163.8120.5
LLY1206156.362.853.7108.4136.070.061.4116.8
LLY8612133.865.958.7123.1134.567.965.2121.7
LLY149136.865.254.7113.7145.574.061.8115.3
LLY1377133.966.357.5120.9148.563.553.5116.3
JLYHZ135.264.657.2117.8138.465.856.6111.1
JLY1206131.566.056.4120.8118.271.067.5124.6
JLY1988137.471.756.6117.5135.860.758.2117.0
LLY1988156.363.248.4107.3124.563.857.5119.7
LLYHLZ159.365.153.8117.3129.560.055.3123.2
LLY3189150.764.652.5112.3130.669.559.3115.3
JLYHLZ126.966.455.8115.2133.068.964.5120.8
JLY8612118.664.656.9128.3127.462.556.9114.5
JLY1377135.366.956.5117.7126.367.562.8122.2
JLY3189140.567.454.9114.7127.965.262.5119.6
LLY1125129.562.852.3109.4139.266.960.7114.6
JLY1212131.666.252.3110.4125.369.163.8119.7
JLY1125149.059.847.8104.1120.966.962.3123.9
JLY1199137.558.847.9116.8138.662.656.4113.1
LLY1212148.762.249.1113.5138.265.953.7115.8
FLY4127.369.856.9117.1126.762.456.7116.8
LSD (0.05)25.16.16.812.116.05.06.1510.0
Critical values based on LSD test (0.05) were used for comparison of different varieties.
Table 4. Traits related with grain yield, nitrogen use efficiency and grain quality for the male parent materials in 2020.
VarietyYield
(t ha−1)
Biomass
(g m−2)
HI
(%)
N Uptake (kg ha−1)NUEg (kg kg−1)HR (%)CGR (%)CD
(%)
ASVGC
(mm)
AC
(%)
PC
(%)
R11257.041420.048.5129.253.160.013.83.213.882.76.37.0
R11997.611485.748.1131.054.755.17.01.212.086.03.07.0
R12067.881511.846.3139.050.660.14.50.512.782.56.37.7
R12127.401398.147.9127.852.565.34.10.614.980.86.47.4
R13777.051394.845.3117.553.963.912.51.814.779.26.37.0
R19887.681398.645.2118.553.560.312.52.513.186.03.16.5
R31897.131489.243.9126.552.253.724.75.617.282.06.76.9
R5347.681526.348.8129.957.466.37.11.315.580.76.46.7
R86127.611371.046.0114.655.243.427.86.014.878.23.66.3
R1497.131356.447.8112.257.857.83.10.511.488.33.16.6
HZ7.611386.146.9112.557.861.36.81.112.982.03.16.8
HSLZ7.381333.249.3115.057.164.39.81.914.176.76.36.5
HHZ7.761477.949.2125.458.164.95.10.716.778.36.66.6
LSD (0.05)0.60185.83.320.45.12.63.61.10.64.00.40.6
Critical values based on LSD test (0.05) were used for comparison of different varieties. HR: heading rice rate; CGR: chalky grain rate; CD: chalkiness degree; ASV: alkali spreading value; GC: gel consistency; AC: amylose content; PC: protein content.
Table 5. The overlapping genes differentially expressed of LLYHZ compared with JLYHZ, and LLYHZ compared with JLY1212 in spikelets at flowering stage.
LocusGroup Locus NameGene Function
LOC_Os06g04200downWxEating quality; seed amylose content.
LOC_Os01g44220downOsAPL2|osagpl2-3|OsAGPL2|GIF2Eating quality; starch biosynthesis
LOC_Os05g33570downFLO4|OsPPDKB|OsC4PPDKEating quality; seed protein and lipid content
LOC_Os08g09230downOsSSIIIa|Flo5Eating quality; seed starch content
LOC_Os08g40930downOsISA1|OsPHS8Eating quality; seed starch content
LOC_Os06g12450downALK|SSIIaEating quality; gelatinization temperature; gel consistency
LOC_Os03g55090downPho1Seed; seed starch content; grain maturation
LOC_Os03g61120downOASA1Sterility; trp level in grain; fertility; germination ability
LOC_Os02g49370downOsHAP3EPanicle flower; dwarfism; leaf angle; floral organ formation
LOC_Os07g38130upOsFOR1|PGIPPanicle flower; regulation of floral organ number
LOC_Os04g45330upOsYABBY5|OsYAB3|TOB1Panicle flower; spikelets morphology
LOC_Os05g39990upNAFlowering; dwarfism; cell wall extensibility; flowering time
LOC_Os05g51360upOsEBSPanicle flower; plant height; leaf size; grain number
LOC_Os05g50890upOsJar1|OsGH3.5|OsGH3-5Sterility; seed development
LOC_Os05g03040upRSR1Seed; seed amylose content; grain size
LOC_Os06g12210upBU1|OsbHLH174Seed; leaf angle; grain size; brassinosteroid sensitivity
Up or down indicates that the genes were up- or down-regulated in LLYHZ compared with JLYHZ and JLY1212.
Publisher’s Note: MDPI stays neutral with regard to jurisdictional claims in published maps and institutional affiliations.

