Article

Hydraulic Trait Variation with Tree Height Affects Fruit Quality of Walnut Trees under Drought Stress

1
State Key Laboratory of Desert and Oasis Ecology, Xinjiang Institute of Ecology and Geography, Chinese Academy of Sciences, Urumqi 830011, China
2
Fukang Station of Desert Ecology, Chinese Academy of Sciences, Fukang 831505, China
3
University of Chinese Academy of Sciences, Beijing 100049, China
4
College of Forestry and Landscape Architecture, Xinjiang Agricultural University, Urumqi 830052, China
5
Xinjiang Academy of Forestry Sciences, Urumqi 830011, China
6
Long-Term National Research Base of Jiamu Fruit Tree Science in Xinjiang, Aksu 652901, China
*
Author to whom correspondence should be addressed.
Agronomy 2022, 12(7), 1647; https://doi.org/10.3390/agronomy12071647
Submission received: 18 June 2022 / Revised: 7 July 2022 / Accepted: 7 July 2022 / Published: 9 July 2022
(This article belongs to the Section Horticultural and Floricultural Crops)

Abstract

:
Persian or common walnut (Juglans regia L.) is a fruit tree of significant agricultural importance and is considered highly drought-resistant. However, the effects of different irrigation treatments and tree height on the physiology, growth and fruit quality of the walnut tree remain largely elusive. In the presently study, we selected ‘Wen 185’, one of the main walnut cultivars, as the target plant species. We established three irrigation treatments (deficit (DI), conventional (CI) and excess irrigation (EI)) from April to September of 2020 and measured leaf hydraulic traits, photosynthetic characteristics, soluble sugar (SS) content, leaf area, branch growth, fruit morphology and the no and deflated kernel (NDK) rate of walnut trees in each treatment. Our results showed that: (1) midday leaf water potential (Ψmd) decreased significantly under the DI treatment and declined significantly with increasing tree height; upper canopy Ψmd in the DI group decreased by 18.40% compared to the lower canopy; (2) the light compensation point, light saturation point, maximum net photosynthetic rate, maximum photochemical efficiency and chlorophyll SPAD values of trees in the DI group decreased slightly but did not differ significantly from the CI and EI treatments; (3) reduced irrigation did not significantly affect the soluble sugar content of leaves (LSs) and fine roots (RSs), but the soluble sugar content of walnut kernels (FSs) was significantly higher in the DI treatment than under the CI and EI treatments and also increased with tree height; the average soluble sugar content across heights was 6.61% in the EI group, 7.19% in the CI group and 9.52% in the DI group; (4) branch terminal leaf area (LA) was significantly reduced at the end of new branches, and Huber values (HV) were significantly higher under the DI treatment; compared to the EI group, LA was reduced by 52.30% in the DI group and 32.50% in the CI group; HV increased by 79.00% in the DI group and 15.70% in the CI group; (5) reduced irrigation did not significantly affect fruit morphology but did increase the NDK rate of walnuts, which also increased with tree height; the average NDK rate across all heights was 4.63% in the EI group, 5.04% in the CI group, and 8.70% in the DI group; the NDK rate was 41.75% higher in the upper part of the canopy compared to the lower part in the DI group. Our results indicate that walnut trees suffer greater water stress in the upper canopy than in the middle and low parts of the canopy. By increasing HV, walnut trees maintained relatively stable photosynthetic capacity under drought. However, water deficit had a significant effect on NDK rates, particularly at greater tree heights.

1. Introduction

For cultivated fruit trees, increasing the quality and production of fruits has been one of the main objectives of plant breeding [1,2]. Consequently, modern cultivars invest more photosynthesized carbohydrates into fruit production, which can lead to reduced vegetative growth of shoots and roots, and, in extreme cases, causing branch dieback [3,4,5]. To resolve this imbalance, agronomic practices have attempted to better balance fruit production and vegetative growth either by manually or chemically thinning fruit or by increasing vegetative growth through fertilization, irrigation or pruning [6,7,8]. However, research on how to increase fruit yield and quality and constrain excessive vegetative growth of branches and roots, especially under poor environmental conditions, remains insufficient [9,10]. Existing studies have focused on how to implement regulated deficit irrigation (DI) to maintain fruit productivity in some arid regions [10,11,12,13,14]. DI has been demonstrated to balance the vegetative and reproductive growth of some fruit trees and thus constrain their overgrowth, thereby achieving the purpose of water saving and quality improvement [15,16]. It remains unclear how such agronomic practices influence photoassimilation distribution, the dynamics of corresponding carbohydrates and their role in balancing fruit production and vegetative growth [3,17]. Exploring the dynamics of nonstructural carbohydrates (NSCs) among source and sink organs under different irrigation regimes may help us to understand the mechanisms driving fruit yield and quality [18,19,20].
Arid environments are characterized by an overall moisture deficit, often expressed as low and variable precipitation company with the relative high evaporation due to excessive heat and soil with very low water holding capacity and poor fertility [9,21]. Water is often one of the critical limiting factors affecting fruit crop growth and productivity [22,23]. Irrigation deficits combined with climate change-induced shifts in temperature, rainfall and other climatic factors drastically reduce the performance of many horticultural crops [24,25]. Tree photosynthesis is very sensitive to water deficit [26,27], which directly affects fruit development and final yield [13,28]. To reduce water loss during periods of drought, plants often first down-regulate stomatal conductance (gs) and then may increase osmotic adjustments to facilitate water absorption in drier soils [29,30,31,32,33]. For example, studies on pear-jujube (Zizyphus jujuba M. cv. Lizao) and olive trees (Olea europaea L. cv. Chemlali) showed that water deficit decreased leaf net photosynthetic rate (Pn) slightly but significantly reduced the transpiration rate (Tr), thus resulting in significant improvements in leaf water use efficiency and indicating that fruit trees can adapt to a certain degree of water stress by controlling stomatal aperture [13,34,35]. Prolonged drought has significant negative impacts on the uptake, transport and metabolism of various nutrients, minimizing leaf area, altering the partitioning of assimilates among different plant organs and reducing yield [29,36]. However, the extent to which fruit trees can adjust and acclimate to drought, increasing water use efficiency to save water and maintain steady yield, varies with species. It is therefore necessary to further investigate the drought tolerance of different fruit trees.
Water deficits are amplified in tall trees due to the increased xylem tension required to draw water from the soil to the canopy [37,38,39]. Drought tolerance (resistance, recovery, and resilience) thus decreases with increasing tree height, which is strongly correlated with exposure to higher solar radiation and evaporative demand [40,41]. Increased tension in xylem conduits in tall trees may induce embolism and hydraulic dysfunction, leading to increased water deficits, decreased stomatal conductance (gs) and photosynthesis, lower growth rates and adjustments in carbon allocation [37,42,43]. Currently, the influence of variation in hydraulic architecture with increasing tree height on fruit quality within the canopy is poorly understood, especially under drought stress.
The Persian or common walnut (Juglans regia L.) is a long-lived, drought-resistant, large perennial deciduous tree and is an important commercial species for its wood and nuts [44,45]. Juglans regia L. is native to the mountain ranges of southeastern Europe (Carpathian Mountains) and west–central Asia [46,47]. Currently, walnut is cultivated commercially throughout southern Europe, northern Africa, eastern Asia, the USA and western South America, and China is the world’s leading producer of walnuts [48]. Xinjiang Province produces more than half of China’s walnuts, and the province’s main walnut orchards lie around the Tarim Basin in southern Xinjiang. In the basin’s main production area, water is a limiting factor. Inadequate water supply often leads to no kernel or deflated kernels (NDK) of the walnut in some walnut orchards, thus limiting walnut production. It is imperative to assess the effect of different irrigation amounts on walnut quality and yield in such areas. At present, there are few systematic studies on the effects of different water irrigation levels on physiological parameters, growth and fruit development, as well as the transfer of photosynthetic products to different organs of walnut tree. In this context, our study sought to answer the following questions. (1) How do walnut trees respond and adapt to changes in soil moisture conditions? (2) What changes occur in non-structural carbon in different source and sink organs? (3) Does tree height influence the effects of drought or fruit quality within the canopy?

2. Materials and Methods

2.1. Experimental Site

The experiment was conducted in the orchard at Jiamu Experimental Station of Xinjiang Forestry Academy (E80°31′58″, N41°15′22″), using the ‘Wen 185’ walnut tree as the target species. The orchard is located in Wensu County, Aksu City, Xinjiang, at the southern foothills of the western Tianshan Mountains. The soil type is loamy or sandy and mainly composed of fine sand and powder with 26.72–93.78% sand, 5.03–62.07% loam and 1.1–15.3% clay. The salt content ranges from 0.679% to 1.854%. The soil organic content is between 0.52% and 0.96%. The soil available nitrogen, available phosphorus and available potassium contents are 19.95 mg kg−1, 30.60 mg kg−1 and 93.33 mg kg−1, respectively [49]. The region has a temperate arid climate, with hot dry summers and cold winters. The mean annual temperature is 10.2 °C, and the mean annual precipitation is 63 mm. We selected walnut trees that were 20 years old, with basal diameters ranging from 12 to 16 cm. Tree heights were 5–6 m, with canopy width between 4.45 and 6.55 m. Plants and rows were spaced 5 m apart.

2.2. Walnut Cultivar and Water Treatment

The experiment was conducted between April and September 2020. The walnut orchard was irrigated by flood surface irrigation down small tranches. We selected 15 walnut trees of a similar size and height and divided them into three groups that received three different irrigation treatments: deficit irrigation (DI) (i.e., no water irrigation), conventional irrigation (CI) (i.e., the amount of irrigation typically used by the farmer) and excess irrigation (EI) (i.e., double the amount of irrigation typically used by the farmer). The DI treatment had 6 individual trees of the ‘Wen 185′ cultivar. The DI group had irrigation halted at the beginning of the trial; the CI group was irrigated three times during the growing season, each time with 1800 m3/hm2; and the EI was irrigated six times during the trial, each time with 1800 m3/hm2. In addition, spring irrigation and winter irrigation were conducted on March 10th and November 8th for the CI and EI groups.

2.3. Measurement Protocols

2.3.1. Soil and Plant Water Status

We measured soil water potential at 0–30, 30–60 and 60–90 cm depths in early July using a WP4C dew point water potential meter (GQT1-WP4C, Decagon, CA, USA). We measured leaf water potential on the same day. From 12:30 to 14:00, we cut three twigs with healthy leaves from the lower (1.0–1.5 m), middle (3.0–3.5 m) and upper (5.0–5.5 m) parts of walnut trees in each treatment and placed the twigs in an insulated ice box with wet paper balls for transport to the laboratory. We immediately measured midday water potential (Ψmd) at the terminal leaves of the twigs with a pressure chamber (Model 1000, PMS Instrument Company, AB, USA). At the same time, we selected 3 to 4 leaves from the middle of the twigs and weighed them with a digital balance (0.0001 g resolution) for their fresh weight (FW). We then placed these leaves in distilled water for 5 h to achieve saturation water absorption and measure fully turgid weight (TW), after which we dried the leaves in an oven at 75 °C to constant dry weight (DW). The relative water content (RWC) of the leaves was calculated as follows:
RWC (%) = (FW − DW)/(TW − DW) × 100

2.3.2. Physiological Traits

We selected three healthy walnut trees from each irrigation treatment group, and for each tree, we measured at least three leaf light response curves using a LI-6400 portable photosynthesis measurement system (Li-Cor, Lincoln, NE, USA) from 10:00 to 13:00 on clear and windless days in early July. During the photosynthesis measurement period, the flow rate was set to 500 μmol-mol−1, and the photosynthetically active radiation gradient was set to 2000, 1800, 1400, 1000, 800, 600, 400, 200, 100, 50, 20 and 0 μmol·m−2·s−1. Light response curves were fitted using a photosynthesis work bench (LI-COR Inc., Lincoln, NE, USA) to obtain the light compensation point (LCP), light saturation point (LSP), maximum net photosynthetic rate (Pmax) and apparent quantum efficiency (AQE) [50]. We determined chlorophyll SPAD values using a SPAD-502 chlorophyll content meter (Konica Minolta, Tokyo, Japan). We measured stomatal conductance (gs) on three to four mature healthy leaves within each irrigation group with a leaf porometer on clear days between 08:00 and 10:00 h local time (Model SC-1, Decagon, Pullman, WA, USA). Maximum photochemical efficiency (Fv/Fm) was measured using a Pocket PEA plant efficiency analyzer (Pocket PEA, PE 32 1JL, Hansatech Instruments Ltd., King′s Lynn Norfolk, UK). Leaves were dark-adapted with clamps for 20 min before measurement, after which we measured initial fluorescence (F0) under a weak pulse of modulated light above 0.8 s. Maximum fluorescence (Fm) was induced by a saturating light pulse (8000 μmol·m−2·s−1) applied on 0.8 s. Fv was calculated from the difference between Fm and F0.

2.3.3. Morphological Traits

We selected three walnut trees from each treatment and marked the one-year newborn twigs in the middle part of the canopy. We photographed the compound leaves at the end of the twigs using a 6 × 108 pixel digital camera (EOS550D, Canon Inc., Tikyo, Japan) at 10-day intervals from the beginning to the end of the experimental period. We calculated leaf area (LA) at the end of the current year branches using Image J (US National Institutes of Health, Bethesda, MD, USA). Vernier calipers were used to determine the cross-sectional area of the upper part of the newborn branches (we ignored heartwood for one-year newborn twigs), and we calculated the Huber value (HV) as the ratio of sapwood area to leaf area. We measured the increased length of one-year newborn branches with a ruler to reflect branch growth (BG) from 13 April to 18 May 2020.
In September 2020, we selected three walnut plants from each sample plot and collected 10 walnut fruits from the lower, middle and upper parts of the walnut trees, measuring the fruits’ cross diameter (CD) and vertical diameter (VD) with a vernier caliper and the fruit fresh weight (FW) with a digital balance (0.01 g resolution). In late September, one walnut tree was taken from each treatment group, and all the fruits from the lower, middle and upper parts of the walnut trees were collected and brought back to the laboratory to count the number of walnuts with no kernel or deflated kernels (NDK) (shells were manually broken). In the DI group, there were 192, 318 and 284 fruits in the upper, middle and lower parts of the canopy, respectively. The CI group had 386, 500 and 488 fruits in each part of the canopy, and the EI group had 462, 730 and 435 fruits in each part of the canopy. The NDK rate was determined by expressing NDK as a percentage of the total number of fruits in each part of the canopy for each water treatment group.

2.3.4. Nonstructural Carbohydrates

Nonstructural carbohydrates (NSCs) include free, low-molecular-weight sugars (glucose, fructose and sucrose) and starch. To avoid the influence of phenological phases, such as leaf and shoot growth, on NSC fluctuation, we collected samples in late September 2020. Leaves and mature walnuts in the lower, middle and upper parts of the canopy and fine roots under different irrigation levels were sampled and brought back to the laboratory, where we dried samples to a constant weight in an oven at 75 °C. The dry samples were subsequently ground into powder using a ball mill (MM400, Retsch, Düsseldorf, Germany) and stored in sealed bags within a drying refrigerator at −40 °C. The NSC extraction procedure followed Anderegg et al. and their cited references [51]. After soluble sucrose (Ss) and starch (St) digestion, the sugar concentrations of the samples were determined colorimetrically using the phenol–sulfuric acid method and a UV-2401PC spectrophotometer (Shimadzu Corporation, UV-2401PC, Kyoto, Japan). Soluble sugars of leaves (LSs), fruits (FSs) and fine roots (RSs) were determined using a modified phenol-sulfuric acid colorimetric method.

2.4. Data Analysis

We computed the means and standard errors of each data set using descriptive statistical methods. We tested for significant differences in soil and leaf water potential, leaf relative water content, the light compensation point (LCP), light saturation point (LSP), maximum net photosynthetic rate (Pmax), apparent quantum efficiency (AQE), stomatal conductance (gs), maximum photochemical efficiency of photosystem II, NSCs concentrations, morphological traits and fruit shape parameters among different irrigation treatments and tree heights with one-way analysis of variance (ANOVA) using the statistical software SPSS 16.0 (SPSS Inc., Chicago, IL, USA). We used Origin 9.0 software to process relevant charts (Origin Lab Corp., Northampton, MA, USA). We performed correlation analysis between physiological traits and morphological and fruit shape parameters at different irrigation levels using the ‘Hmisc’, and ‘corrplot’ packages in R Version 3.6.3 (R Development Core Team, Vienna, Austria). We further performed Gray correlation analysis to ascertain the relationships between the NDK rate of walnuts and physiological and morphological traits and fruit parameters [52].

3. Results

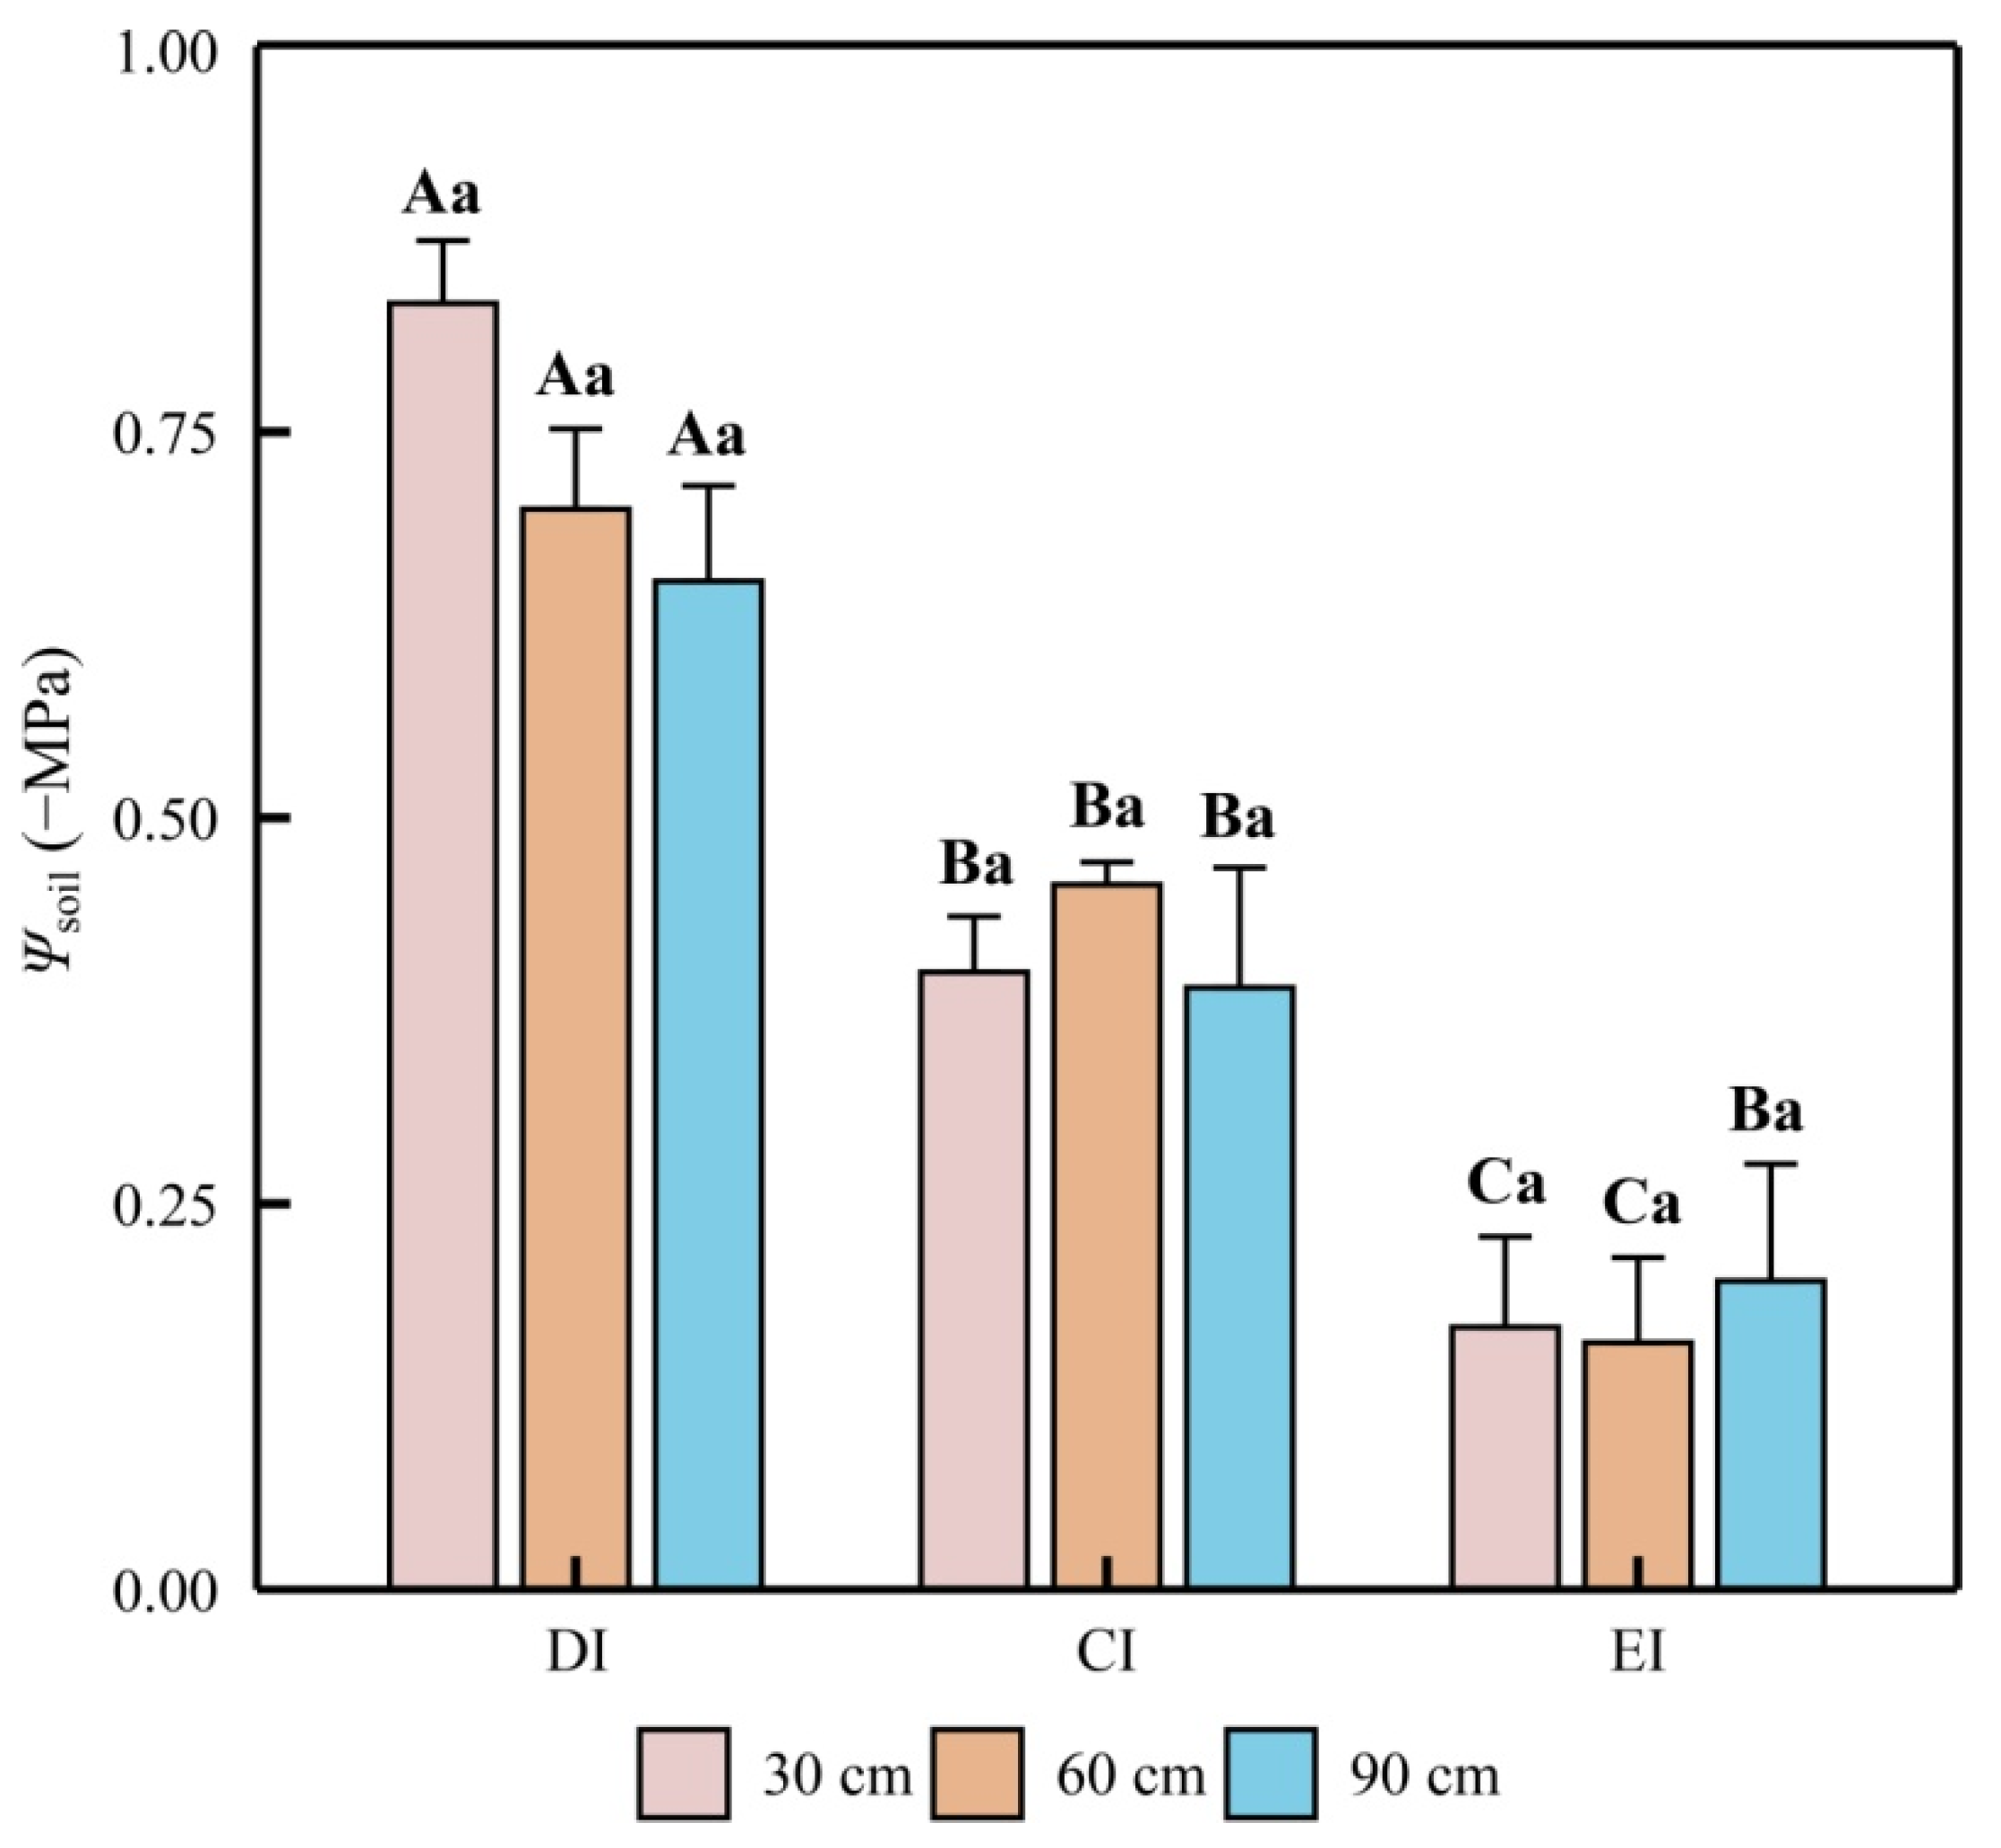
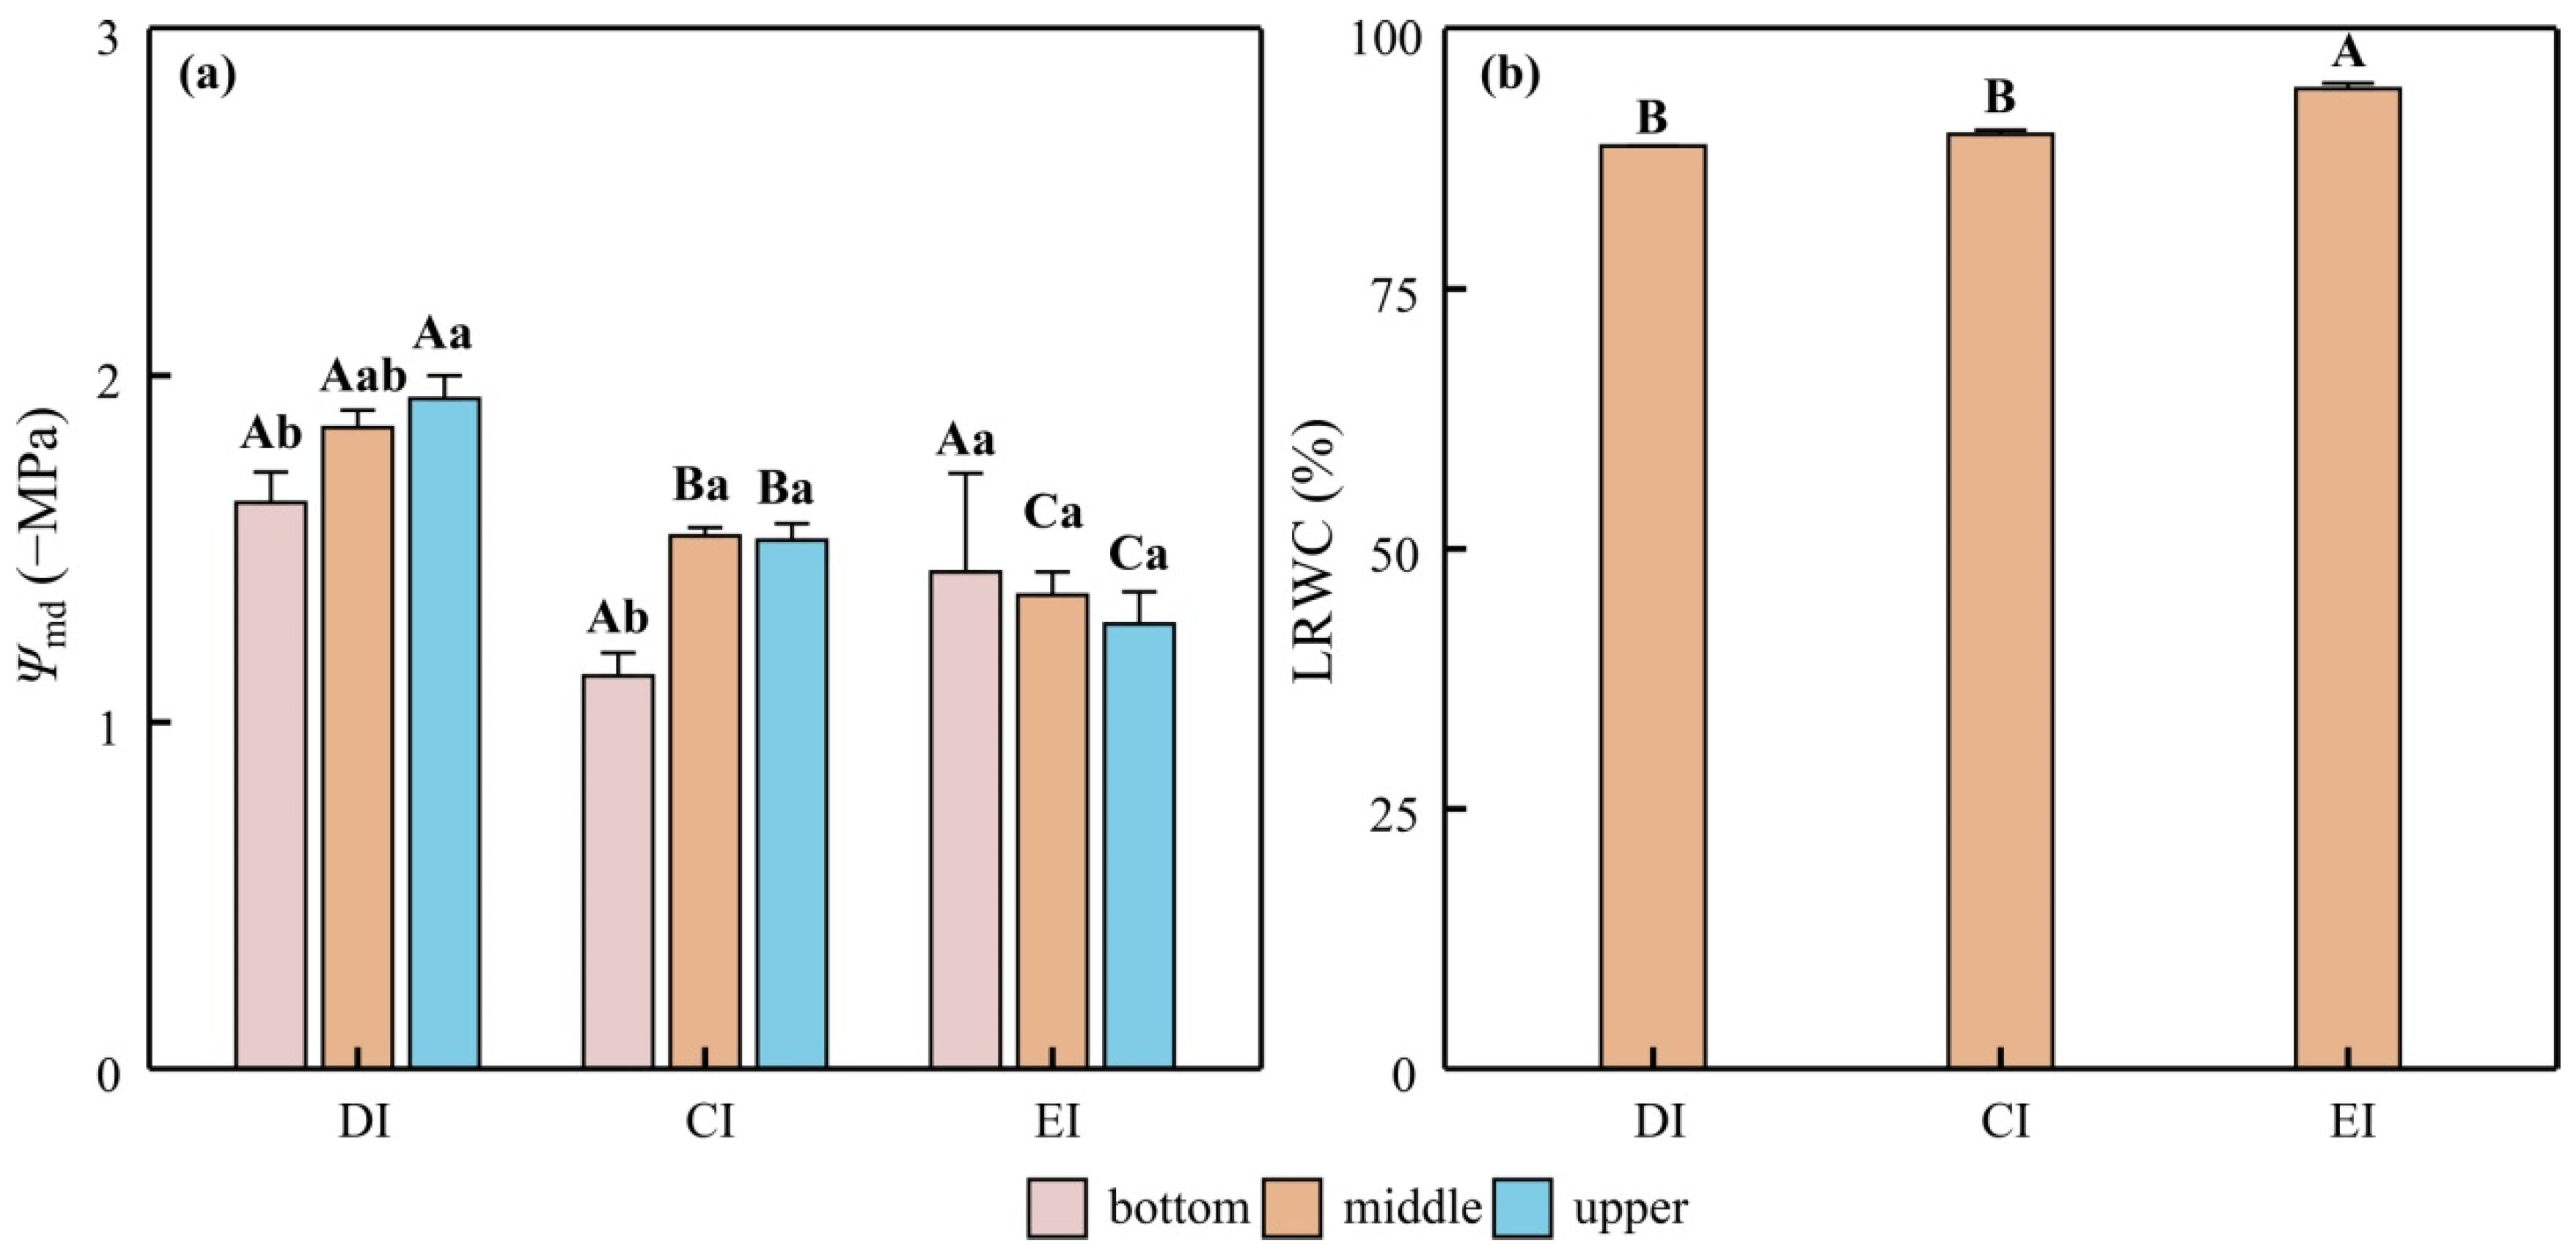
3.1. Soil and Plant Water Potential

Soil water potential (Ψsoil) was affected by irrigation (Figure 1). Water potential at each soil depth increased significantly with irrigation. The average soil water potential at 0–90 cm was −0.73 MPa in the DI group, −0.42 MPa in the CI group and −0.18 MPa in the EI group. Overall, soil water conditions were best in the EI group, second best in the CI group and worst in the DI group.
Mean midday leaf water potential (Ψmd) was −1.36 MPa in the EI group, −1.42 MPa in the CI group and −1.81 MPa in the DI group, and the Ψmd in the DI and CI groups decreased significantly with increasing tree height. Upper canopy Ψmd in the DI group decreased by 18.40% compared to the lower canopy (Figure 2a), while lower canopy Ψmd in the CI group decreased by 34.60% compared to the upper canopy, but we found no relationship between leaf relative water content (LRWC) and tree height in the EI group. In addition, LRWC decreased gradually with decreasing irrigation, and the LRWC of the DI group was significantly lower than that of the EI group (Figure 2b).

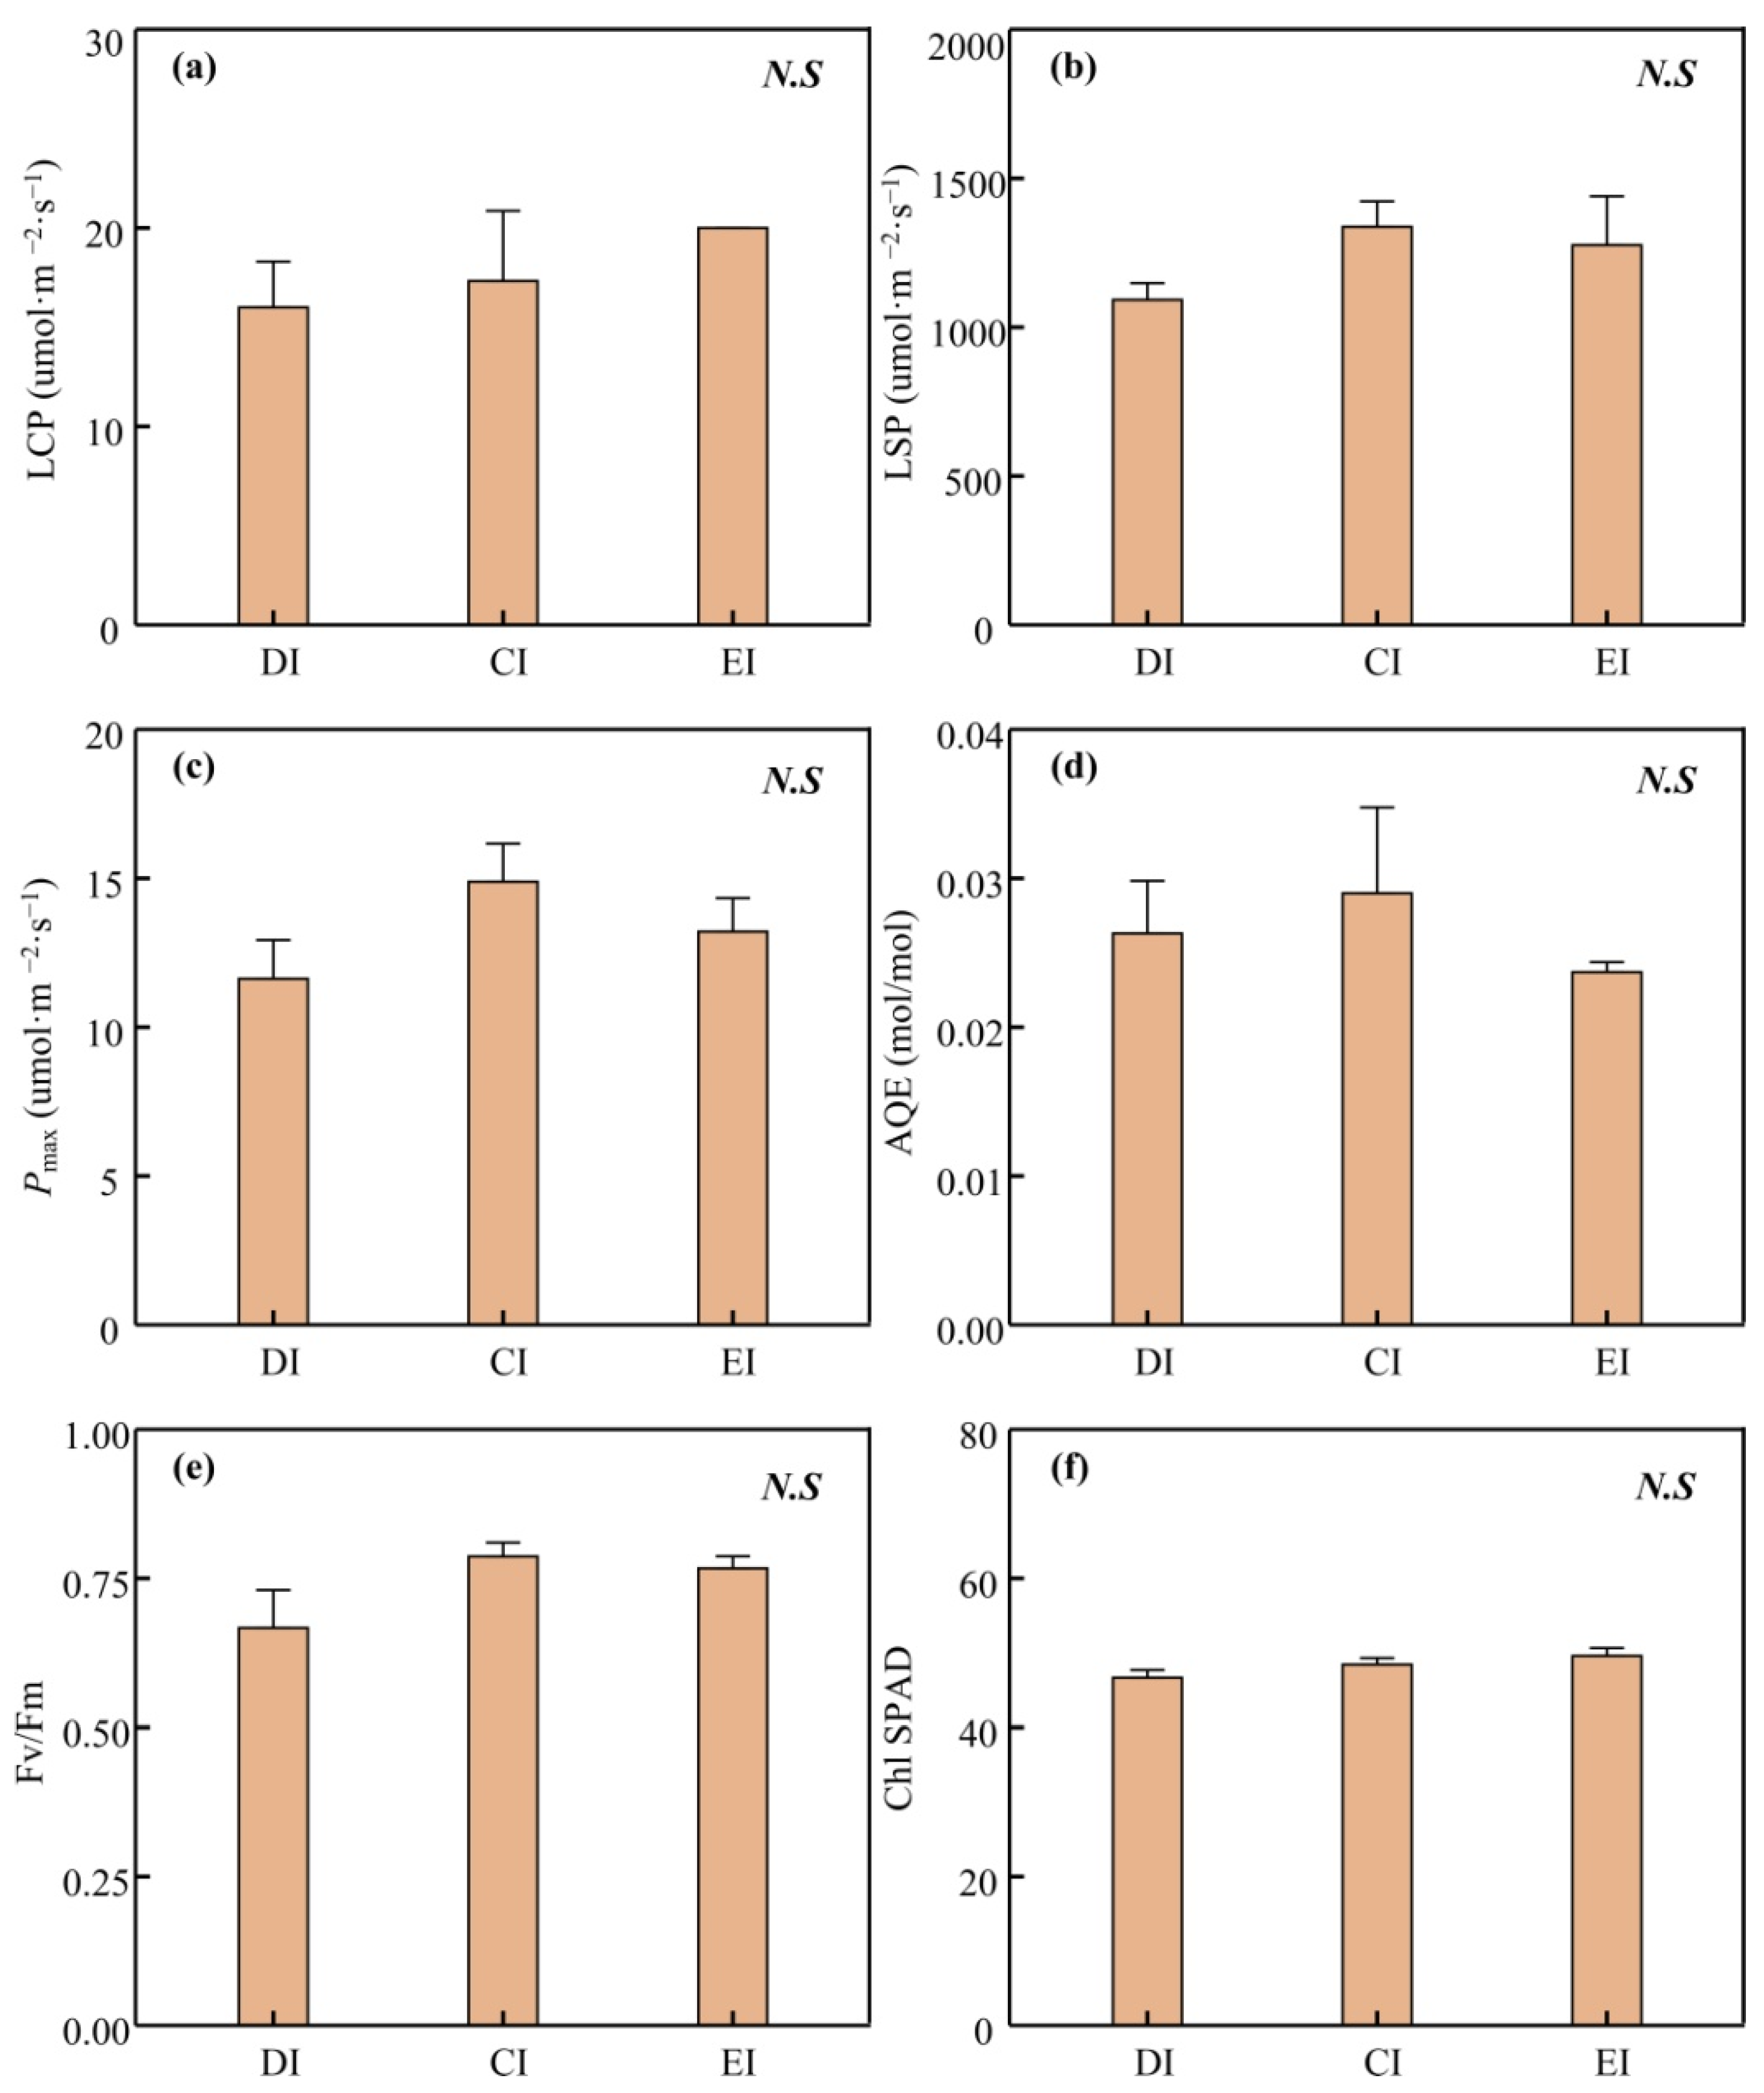
3.2. Physiological Trait Performance and Nonstructural Carbohydrate Variation

Lower irrigation did not significantly affect the light compensation point (LCP), light saturation point (LSP), maximum net photosynthetic rate (Pmax), apparent quantum efficiency (AQE), chlorophyll SPAD (Chl SPAD) or maximum photochemical efficiency (Fv/Fm) (Figure 3). However, LCP, LSP, Pmax, AQE and Chl SPAD values in the DI group decreased by 19.20%, 14.40%, 11.99%, 13.04% and 5.90%, respectively, compared with the EI group. In addition, the Fv/Fm of the DI group ranged from 0.56 to 0.78, while the Fv/Fm of the CI and EI groups were 0.73–0.83.
Soluble sugar content varied among irrigation levels, tree heights and organs (Figure 4). For leaves, the mean soluble sugar content of the three height categories was 8.56% for the EI group, 7.39% for the CI group and 8.07% for the DI group (Figure 4a). In addition, leaf soluble sugar content did not covary with tree height in the DI and EI groups, while leaf soluble sugar content was significantly higher in the upper part of the tree in the CI group (Figure 4a). For the walnut kernels, the average soluble sugar content across heights was 6.61% in the EI group, 7.19% in the CI group and 9.52% in the DI group (Figure 4b). In addition, the soluble sugar content of walnut kernels covaried with tree height in the DI group, but there was no such pattern in the CI and EI groups. For fine roots, there was no significant difference in soluble sugar content between irrigation levels (Figure 4c). In general, the reduction in irrigation did not affect walnut leaves and roots much but increased the soluble sugar content of seed kernels to some extent.

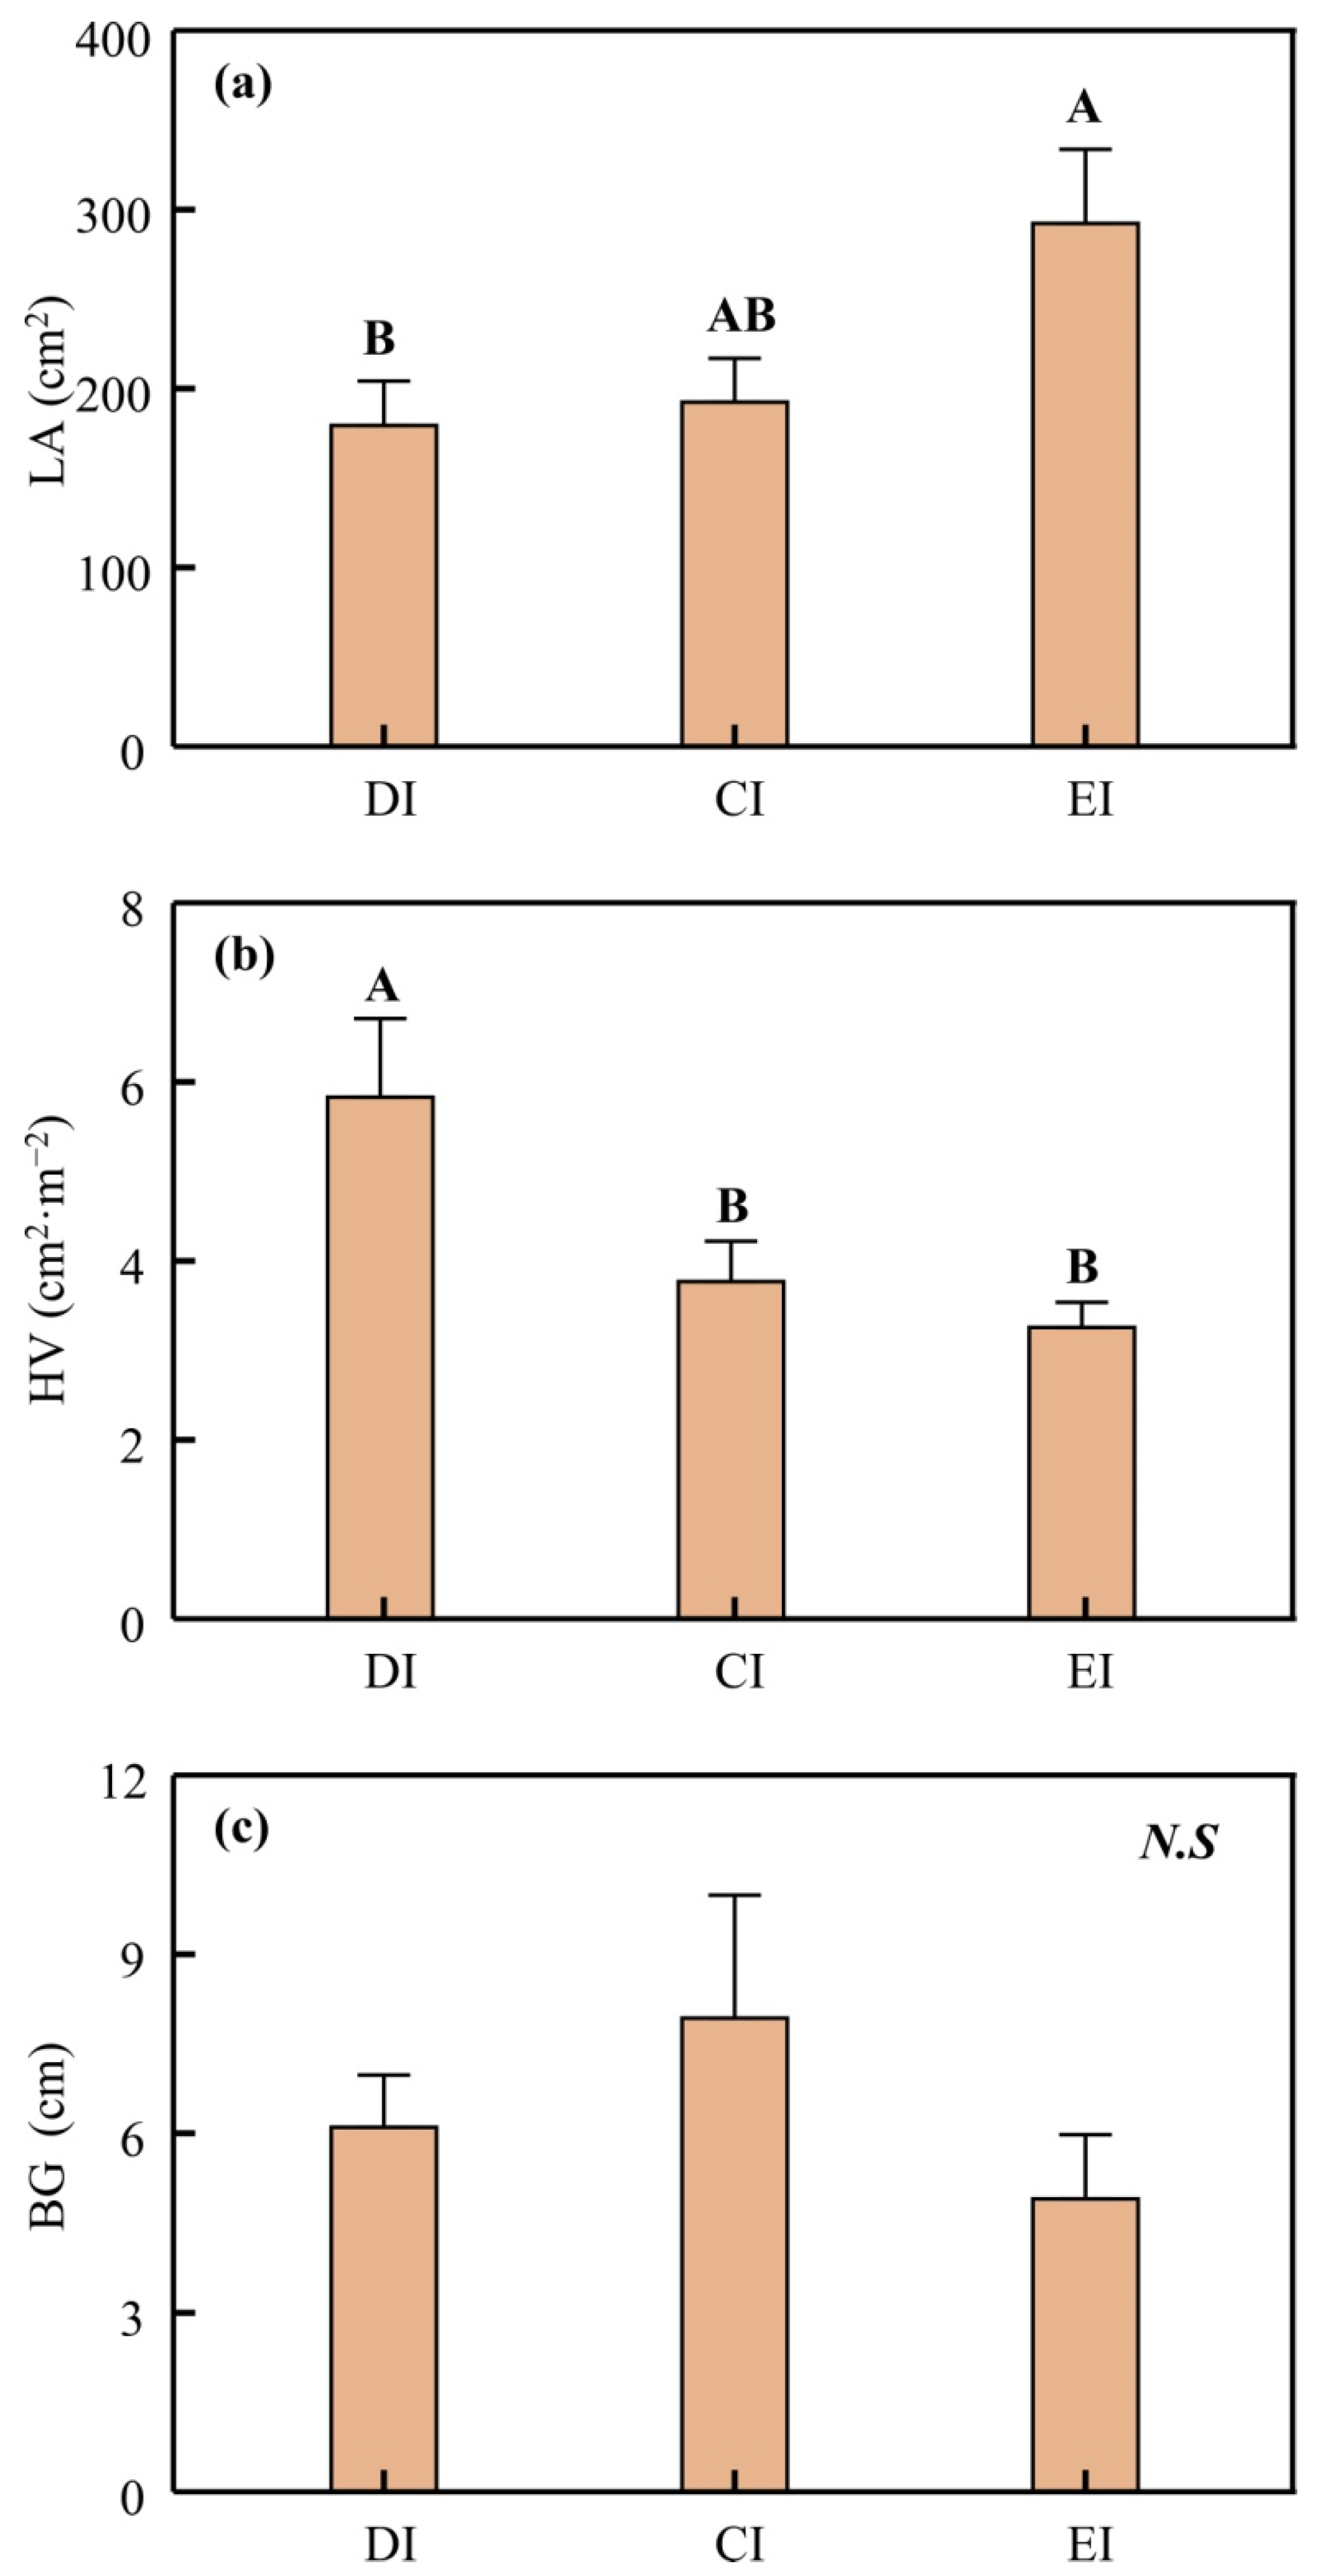
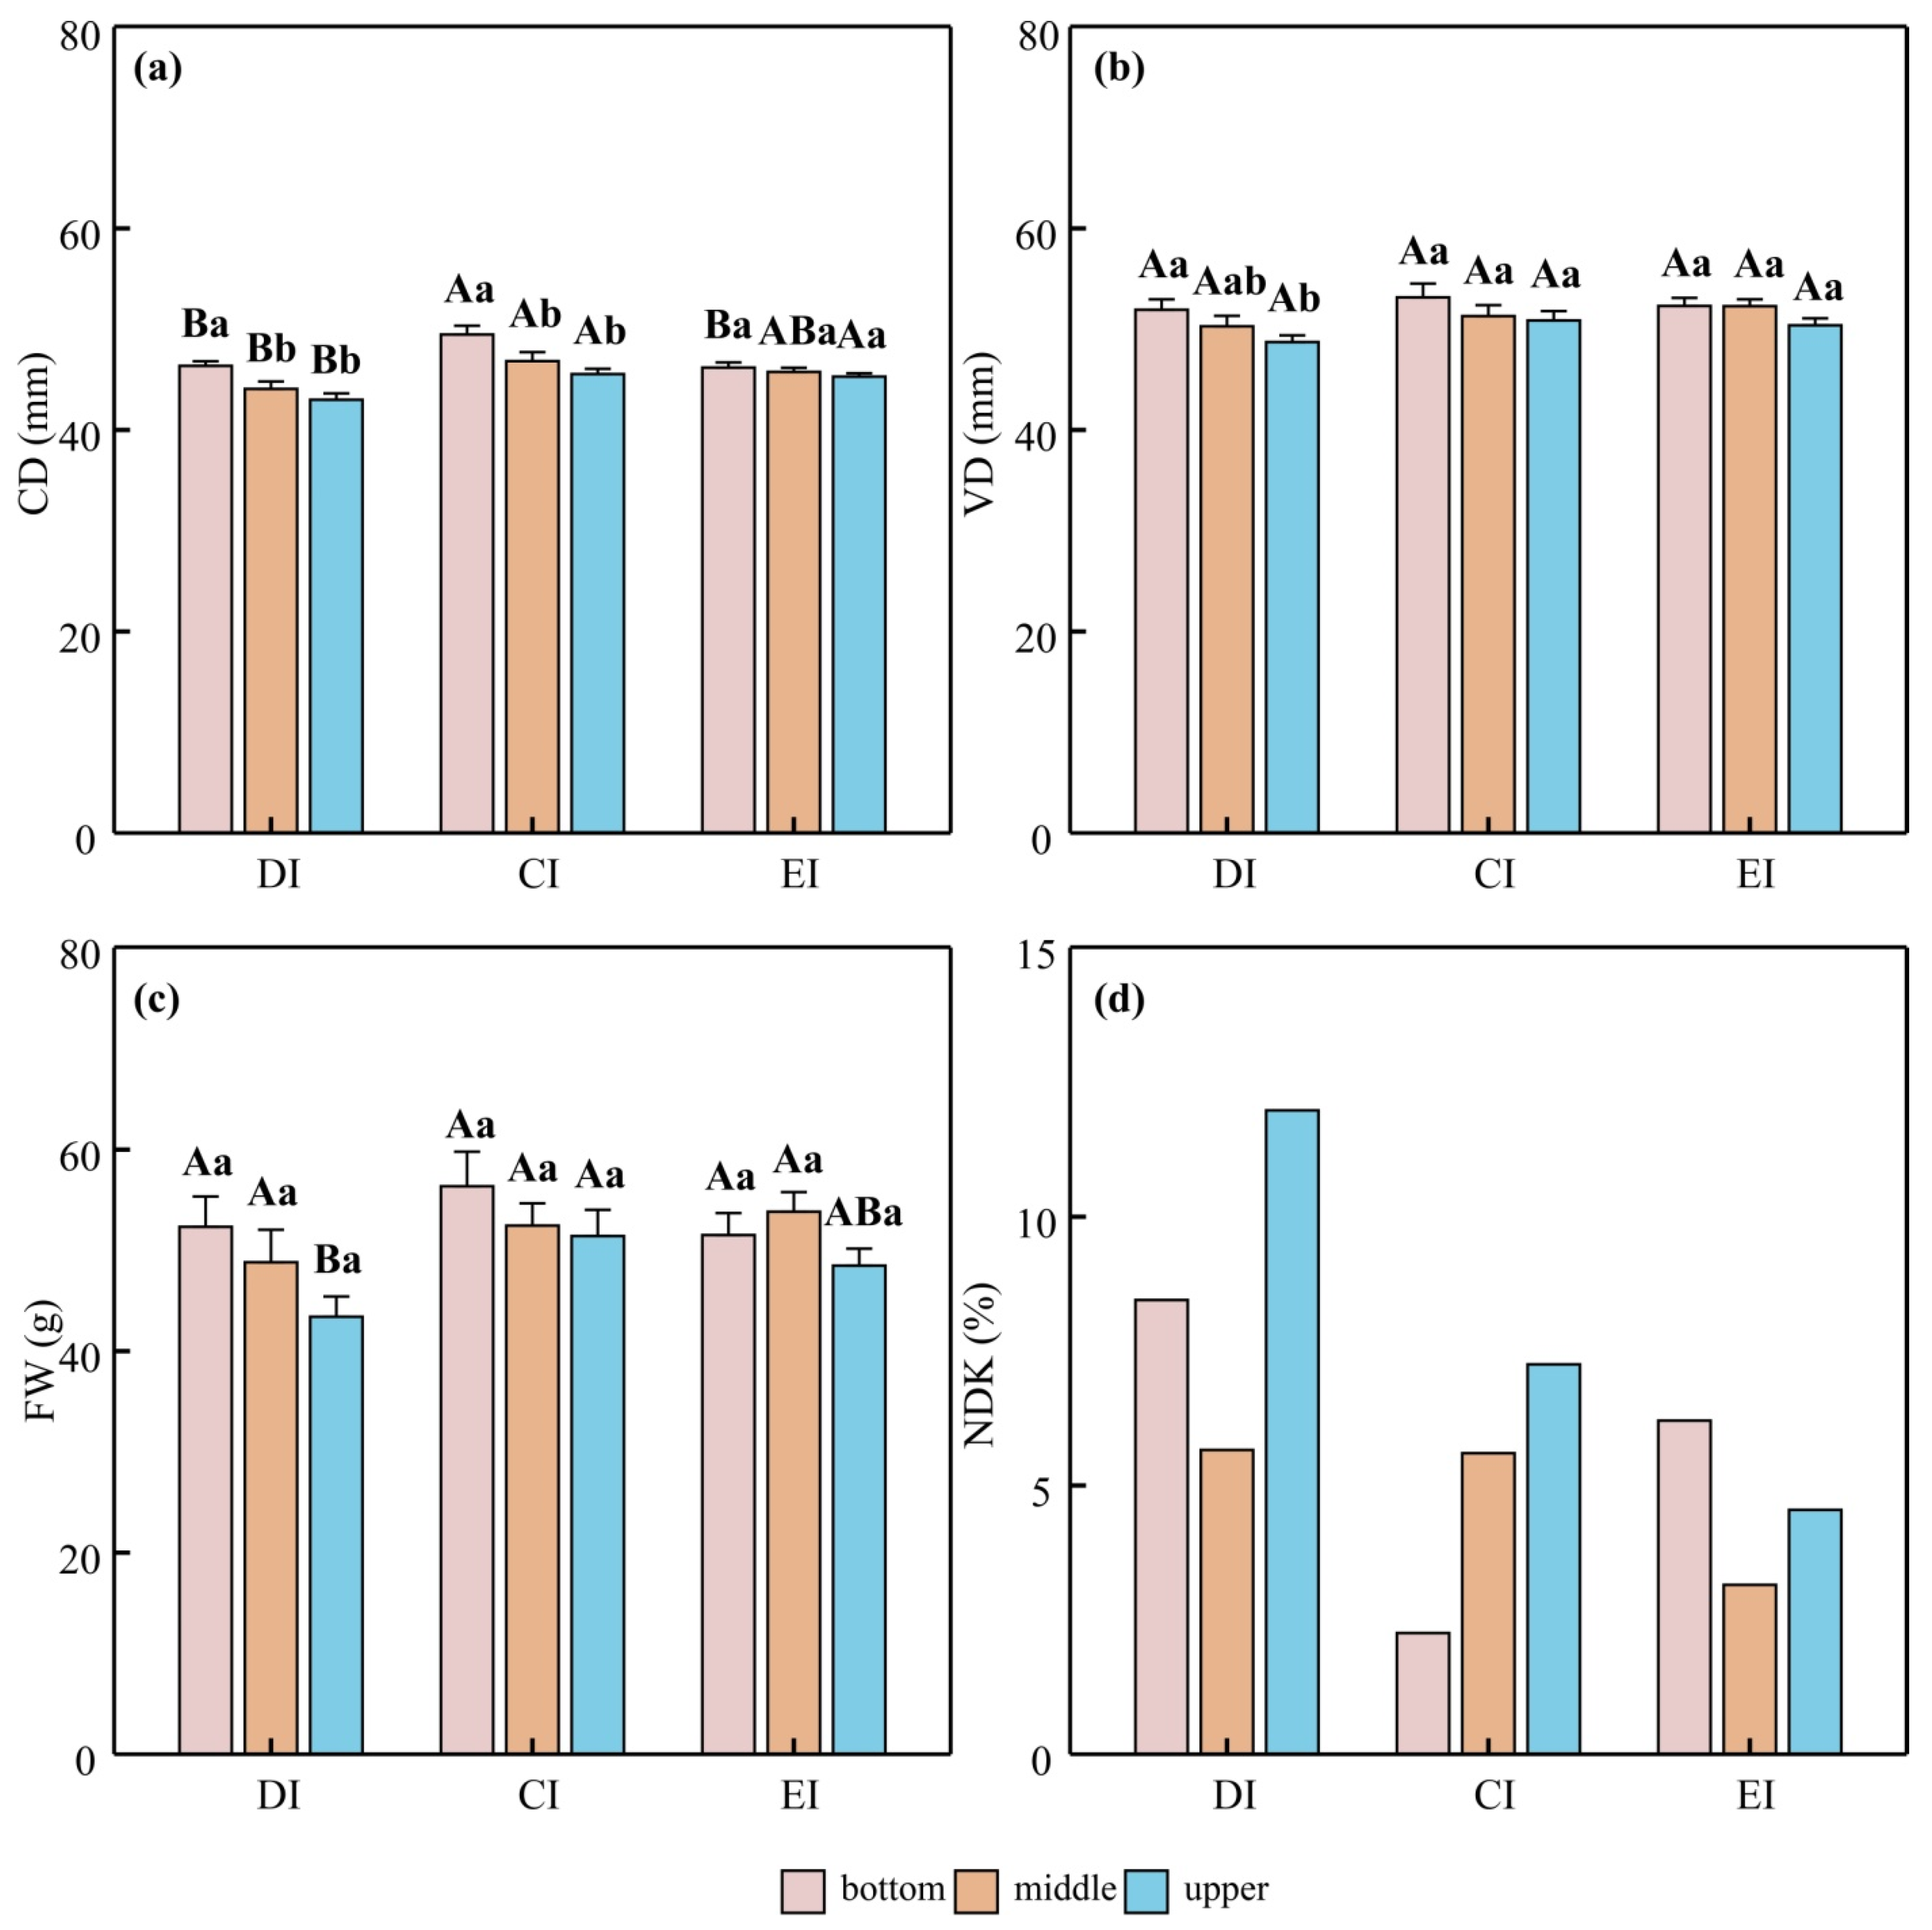
3.3. Morphological Adjustments and Fruit Quality

Reduced irrigation significantly reduced the leaf area at the end of branches (Figure 5a) and significantly increased the Huber value (Figure 5b) but had no significant effect on the amount of branch growth (Figure 5c). Compared to branch growth in the EI group, branch terminal leaf area was reduced by 52.30% in the DI group and 32.50% in the CI group (Figure 5a). In addition, deficit irrigation significantly increased the Huber value, which increased by 79.00% in the DI group and 15.70% in the CI group compared to the EI group (Figure 5b). At the same time, branch growth increased by 24.60% in the DI group and by 61.90% in the CI group (Figure 5c).
Reduced irrigation had limited effects on fruit cross and vertical diameters and weight, but dramatically increased the NDK rate (Figure 6). In addition, fruit cross diameter (CD) decreased with increasing height in the DI and CI groups (Figure 6a). Fruit vertical diameter (VD) decreased with increasing height in the DI group (Figure 6b). The mean fruit vertical diameter across all heights was 51.65 mm in the EI group, 51.77 mm in the CI group and 50.43 mm in the DI group. The fruit vertical diameter (VD) of walnuts showed no significant variation with increasing tree height in CI and EI groups (Figure 6b). For fruit weight, the average fruit weight across heights was 51.28 g in the EI group, 53.41 g in the CI group, and 48.72 g in the DI group, and there was no significant difference in fruit weight among the three height categories in any water treatment group (Figure 6c).
Lower irrigation increased the NDK rate of walnuts to some degree (Figure 6d). The average NDK rate across all heights was 4.63% in the EI group, 5.04% in the CI group and 8.70% in the DI group. In addition, the NDK rate was 41.75% higher in the upper part of the canopy than in the lower part in the DI group and 221.80% higher in the upper part of the canopy compared to the lower part in the CI group, but there was no such pattern in the EI group.

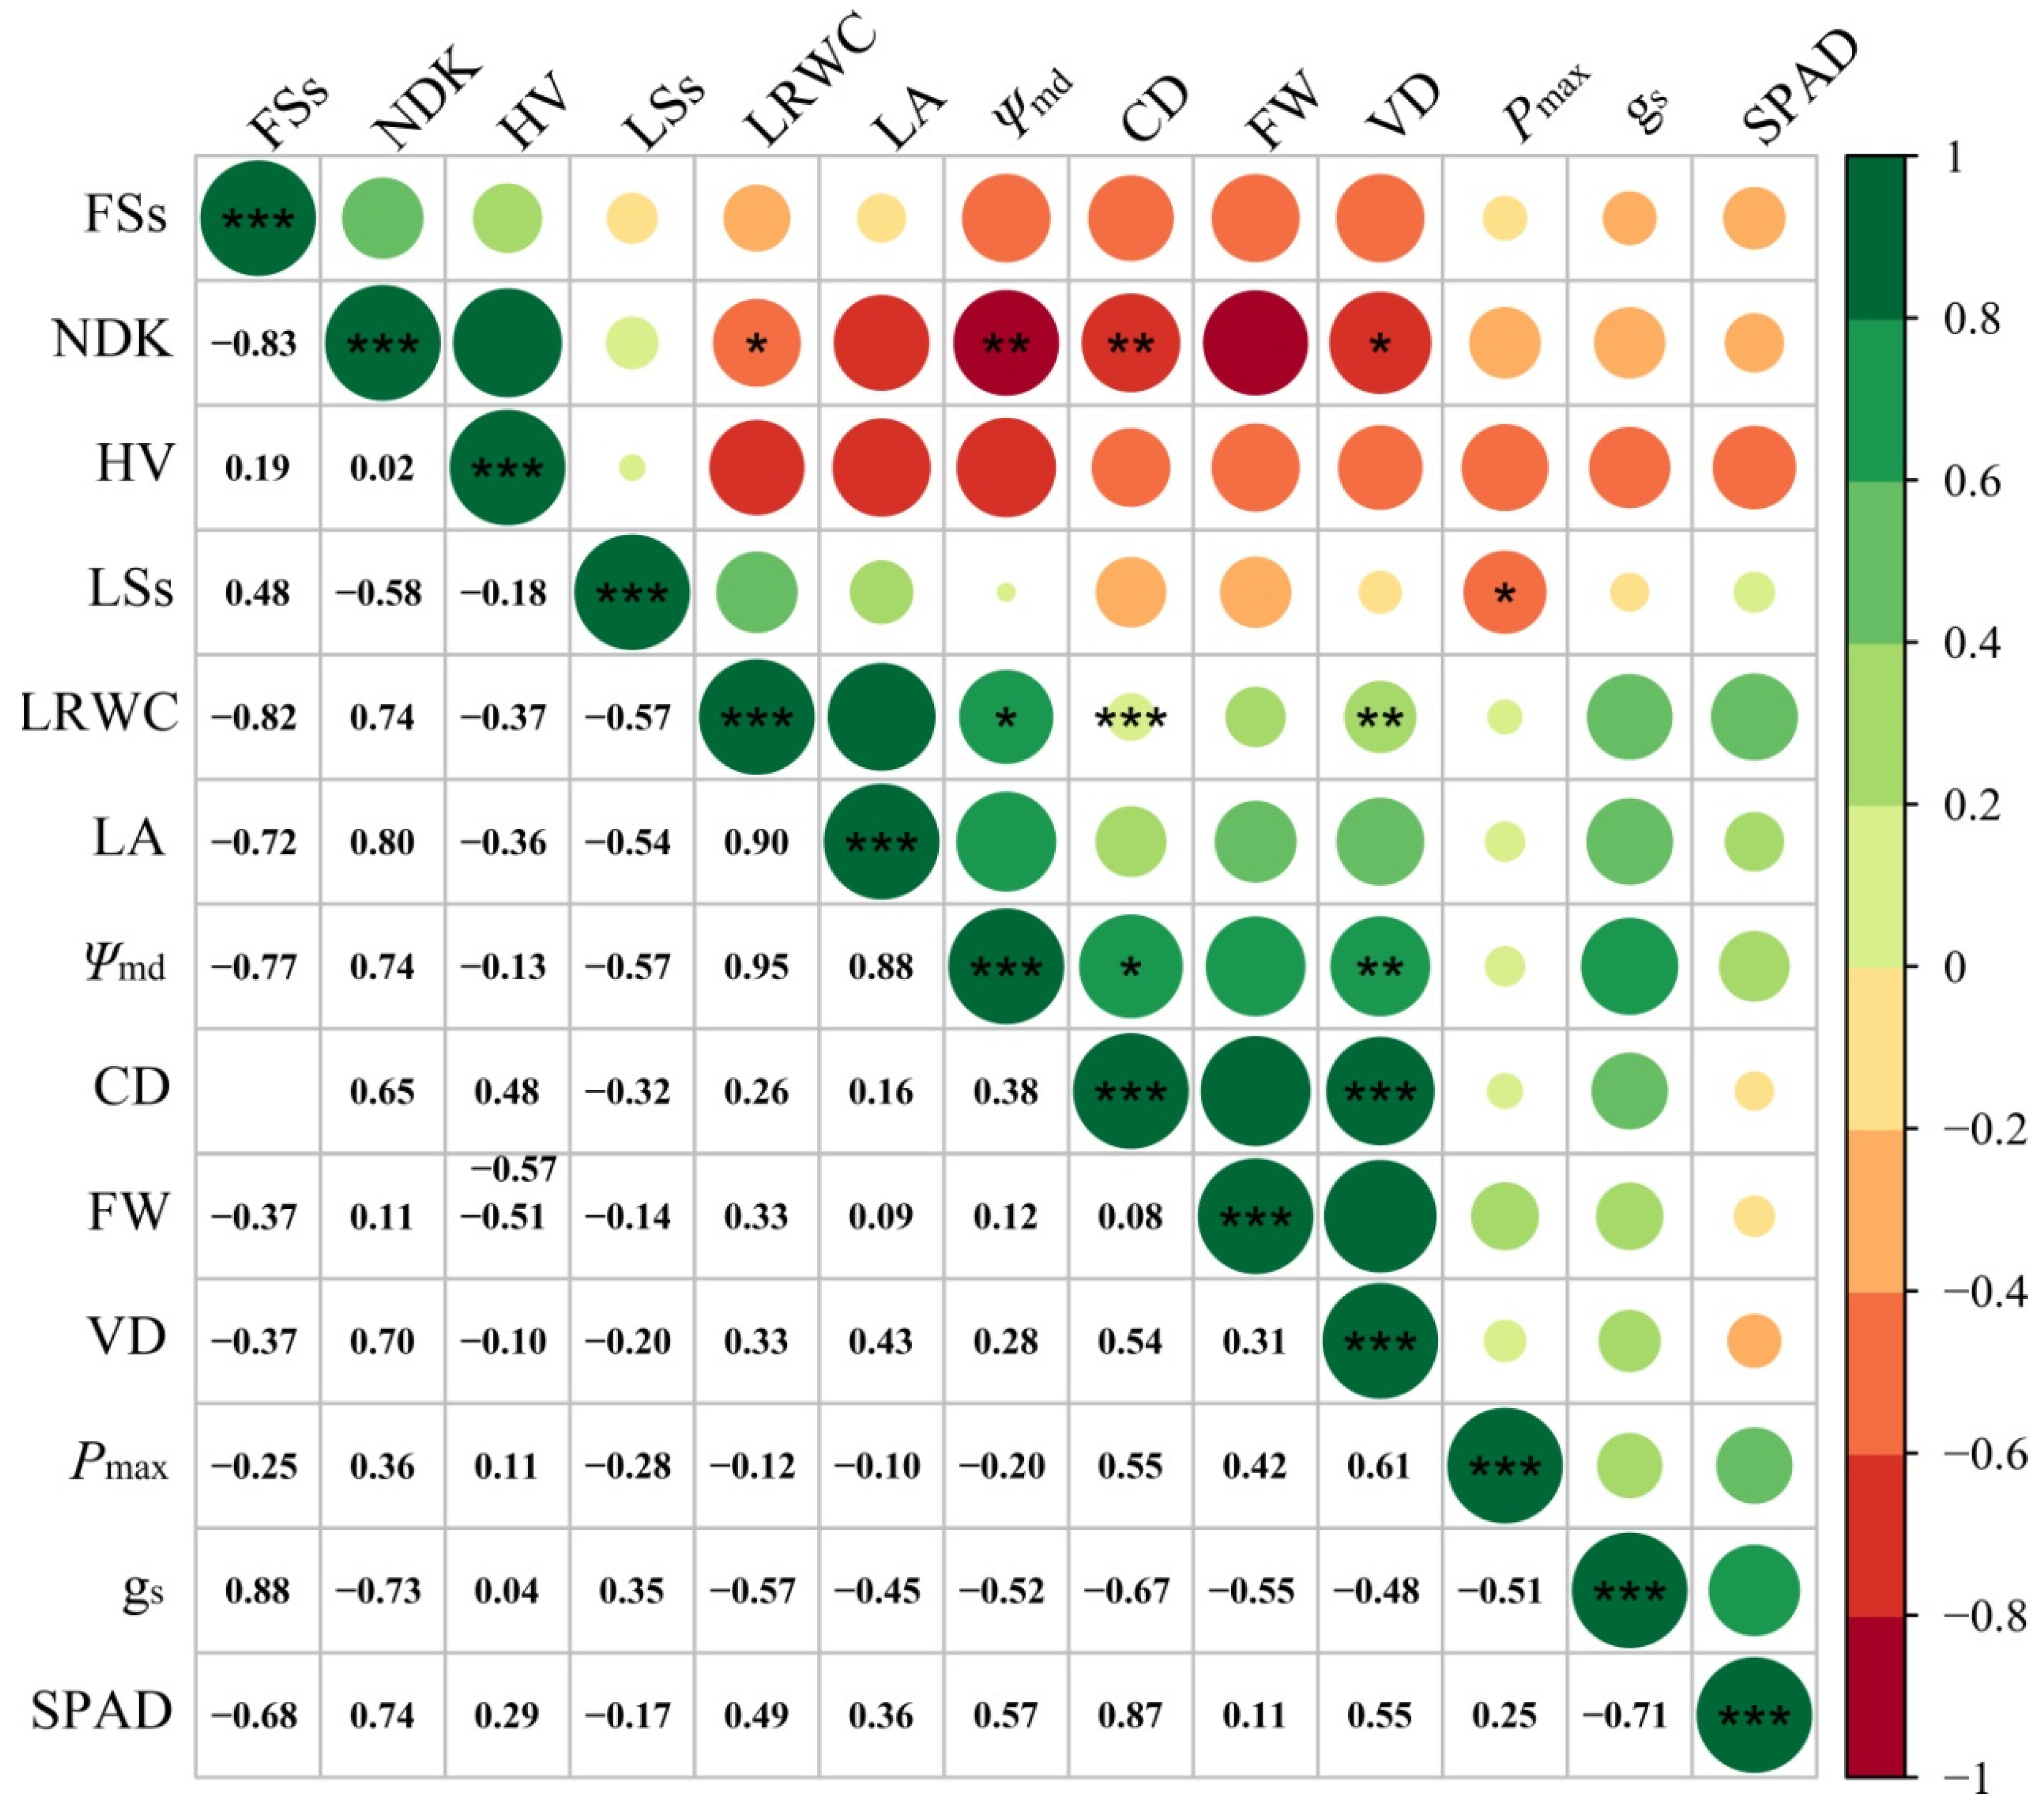
3.4. Correlation among Different Traits

Correlation analysis showed that the NDK rate of walnuts was significantly correlated with water status and fruit shape (Figure 7). Fruit shape, HV and gs were significantly correlated with the water status of the walnut tree. Specifically, Ψmd, fruit cross diameter, vertical diameter and weight were significantly negatively correlated with walnut fruit NDK rate (p < 0.05); Ψmd was significantly positively correlated with fruit cross diameter, vertical diameter and weight (p < 0.05); leaf relative water content was significantly negatively correlated with Huber value (p < 0.05), and gs was significantly positively correlated with Ψmd (p < 0.05).
Gray correlation analysis showed that the top three correlations with walnut fruit NDK rate were Ψmd, walnut kernel soluble sugar, and fruit weight, where the correlation of Ψmd with NDK rate was greater than 0.8 and the correlation of walnut kernel soluble sugar with NDK rate was greater than 0.7 (Table 1).

4. Discussion

4.1. Physiological Responses and Morphological Adjustments to Drought

Plants have developed coherent physiological and morphological strategies to cope with water limitations [53,54]. Leaf hydraulic traits are important for plant functions such as growth, water transport, gas exchange and drought adaptability [55,56]. Among them, leaf water potential and leaf relative water content can directly characterize the water status of plants and are closely related to soil moisture [57,58]; the lower the leaf water potential, the stronger the water absorption capacity, and lowering leaf water potential is thus a strategy plants can use to actively adapt to adversity [59,60]. In this study, Ψmd and leaf relative water content (LRWC) of walnut leaves decreased with reduced irrigation. Previous research has shown that most (90.52%) of the root biomass of walnut trees is concentrated in the 0–60 cm soil layer [61]. Thus, insufficient moisture at 0–60 cm soil layers was the main driver of water stress in walnuts (Figure 1). In addition, leaf midday water potential in the upper part of the walnut canopy was significantly lower than that in the lower part of the canopy in the DI and CI groups, which is consistent with Fang et al.’s findings on small Populus tree (Populus pseudo-simonii) [41]. Since increasing tree height increases the gravitational force on water and its friction with the conduit [38], a water potential gradient of 0.01 MPa·m−1 is formed in the xylem under gravity [62], and reduced irrigation may have exacerbated this hydraulic limitation to some extent, resulting in less water being transported to the upper part of the tree (Figure 2).
Photosynthetic processes are among the most sensitive physiological features of plants to environmental changes [27,63]. Light response curves are an important way to determine the extent to which plant photosynthetic efficiency is affected by stress [27,64]. Usually, LSP, Pmax, AQE and chlorophyll SPAD (Chl SPAD) values will continue to decrease with increasing drought stress, while the LCP will increase [65]. However, we found that light compensation point (LCP), light saturation point (LSP), maximum net photosynthetic rate (Pmax), apparent photometric efficiency (AQE) and Chl SPAD values did not decrease significantly with reduced irrigation (Figure 3). This may be due to the fact that walnut is a more drought-tolerant species compared to other economic forest species [66], its photosynthetic system has a stronger self-regulatory capacity under drought stress and can tolerate a certain degree of water deficit [67]. In addition, to cope with drought, walnut tree significantly increased its Huber value, increased the water supply from branches to leaves and reduced damage to the photosynthetic system, thus reducing differences in photosynthetic physiological characteristics of walnuts under different irrigation treatments (Figure 5b). Maximum photochemical efficiency (Fv/Fm) is considered an important indicator of leaf photosynthetic efficiency and characterizes the structural integrity of PS II [68]. In general, Fv/Fm values range between 0.75 and 0.85 [69]. Prolonged drought can cause energy excess as excitation energy rises simultaneously. As a result, the balance between the production and scavenging of reactive oxygen in the plant can be disrupted, leading to increased membrane lipid peroxidation and decreased Fv/Fm [70,71]. In our study, the Fv/Fm of the DI group ranged from 0.56–0.78, while the Fv/Fm of the CI and EI groups ranged from 0.73 to 0.83 (Figure 3e). Although PSII was damaged by reduced irrigation, Chl SPAD values remained stable during the drought (Figure 3f), which enabled the PSII reaction center to recover quickly to normal levels after damage.
The leaf area of walnut trees significantly decreased with reduced irrigation (Figure 5a), demonstrating walnut’s acclimation strategy to drought. Reduced irrigation also significantly increased Huber values, which facilitate the supply of water from branches to leaves (Figure 5b), indicating that walnut trees undergo morphological adjustments to adapt to drought, as previous studies have found [72,73].

4.2. The Influence of Drought on Nonstructural Carbohydrate Variation and Fruit Quality

In this study, fruit soluble sugar content increased in the DI group compared to the CI group and significantly increased with tree height. This result is consistent with previous findings, showing that drought influences growth more than photosynthesis [74], and may exhibit greater effects with increasing tree height [41]. However, these results may also be due to the fact that reduced irrigation hinders the conversion of NSCs to fat during walnut fruit development [75], and walnuts accumulate soluble sugars to maintain the osmotic pressure of cells for normal physiological activities [76,77]. However, in this study, there was no significant difference in root soluble sugar (RSs) content under different irrigation regimes (Figure 4c), which suggests that walnuts may not depend on increasing belowground carbon investment to obtain more water and instead reduce leaf area (LA) and increase Huber values (HV) to maintain normal physiological function (Figure 5a,b).
Reduced water availability has a substantial impact on fruit quality, influencing the size, quality, juice yield and flavor of fruit [22,27,28,78]. However, reduced irrigation did not significantly affect walnut morphology and weight in our study (Figure 6), which is consistent with similar research on lemon trees [79]. The number of walnut fruits per tree did decrease with reduced irrigation in our study. Logistical feasibility precluded our ability to investigate more trees, and further study is needed to ascertain whether fruit yield truly decreased with the reduction in irrigation. In our study, deficit irrigation and increased tree height significantly increased the NDK rate of walnuts, which is closely related to moisture status of walnut tree. Correlation analysis showed that the NDK rate of walnuts was significantly negatively correlated with fruit morphology and midday leaf water potential (Ψmd), while fruit morphology was significantly positively correlated with Ψmd (Figure 7), indicating that walnut fruit yield and quality were strongly influenced by water status. Gray correlation analysis further revealed that walnut fruit NDK rates were more correlated with Ψmd (Table 1), indicating that drought should increase fruit NDK rates. At the same time, the reduction in water in the upper part of the tree caused by hydraulic limitation should also lead to an increase in the rate of NDK, especially under drought stress.

5. Conclusions

The drought response and adaptation in walnut trees was successfully monitored. The results can contribute to a more systematic understanding of the effects of drought and tree height on walnut yield and quality. Deficit irrigation exposed walnut trees to greater water stress, and the stress increased with tree height. Walnut trees maintained normal photosynthetic capacity by regulating the HV value. Leaves’ soluble sugar content remained high under different irrigation levels, but soluble sugar content in walnut kernels increased under deficit irrigation and accumulated with increasing tree height. Deficit irrigation led to an increase in the rate of no and deflated kernels (NDK), and this value also increased with tree height. Our results thus provide an important reference for crown reduction pruning and high-density planting of dwarf walnut cultivars.

Author Contributions

Conceptualization, G.X.; data curation, T.C. and J.L.; formal analysis, T.C. and G.X.; funding acquisition, G.X. and H.H.; investigation, G.X., T.C. and J.L.; resources, H.H.; supervision, G.X.; writing—original draft, G.X. and T.C.; writing—review and editing, G.X. All authors have read and agreed to the published version of the manuscript.

Funding

This work was funded by the Major science and technology projects of Xinjiang Uygur Autonomous Region (2021a02002-2); Xinjiang Uygur Autonomous Region public welfare research institutes’ basic scientific research business funds (ky2020030). The funders had no role in study design, data collection and analysis, decision to publish, or preparation of the manuscript.

Data Availability Statement

All data used during the study are available from the author Tuqiang Chen by request (e-mail: [email protected]).

Acknowledgments

We thank Jiazheng Chen and Ping Ma for the assistants in the field experiment.

Conflicts of Interest

The authors declare no conflict of interest.

References

  1. Corelligrappadelli, L.; Coston, D.C. Thinning pattern and light environment in peach-tree canopies influence fruit-quality. Hortscience 1991, 26, 1464–1466. [Google Scholar] [CrossRef]
  2. Girardi, E.A.; Ayres, A.J.; Girotto, L.F.; Pena, L. Tree Growth and Production of Rainfed Valencia Sweet Orange Grafted onto Trifoliate Orange Hybrid Rootstocks under Aw Climate. Agronomy 2021, 11, 2533. [Google Scholar] [CrossRef]
  3. Genard, M.; Dauzat, J.; Franck, N.; Lescourret, F.; Moitrier, N.; Vaast, P.; Vercambre, G. Carbon allocation in fruit trees: From theory to modelling. Trees-Struct. Funct. 2008, 22, 269–282. [Google Scholar] [CrossRef]
  4. Vaast, P.; Angrand, J.; Franck, N.; Dauzat, J.; Genard, M. Fruit load and branch ring-barking affect carbon allocation and photosynthesis of leaf and fruit of Coffea arabica in the field. Tree Physiol. 2005, 25, 753–760. [Google Scholar] [CrossRef] [PubMed] [Green Version]
  5. Lemos de Carvalho, H.W.; de Carvalho, L.M.; Teodoro, A.V.; de Barros, I.; Girardi, E.A.; Soares Filho, W.d.S.; Passos, O.S. Yield, fruit quality, and survival of ‘Pera’ sweet orange on eight rootstocks in tropical cohesive soils. Pesqui. Agropecu. Bras. 2021, 56, E021151. [Google Scholar] [CrossRef]
  6. Albarracín, V.; Hall, A.J.; Searles, P.S.; Rousseaux, M.C. Responses of vegetative growth and fruit yield to winter and summer mechanical pruning in olive trees. Sci. Hortic. 2017, 225, 185–194. [Google Scholar] [CrossRef]
  7. Fernández, F.J.; Ladux, J.L.; Searles, P.S. Dynamics of shoot and fruit growth following fruit thinning in olive trees: Same season and subsequent season responses. Sci. Hortic. 2015, 192, 320–330. [Google Scholar] [CrossRef]
  8. Almeida, W.L.; Avila, R.T.; Perez-Molina, J.P.; Barbosa, M.L.; Marcal, D.M.S.; de Souza, R.P.B.; Martino, P.B.; Cardoso, A.A.; Martins, S.C.V.; DaMatta, F.M. The interplay between irrigation and fruiting on branch growth and mortality, gas exchange and water relations of coffee trees. Tree Physiol. 2021, 41, 35–49. [Google Scholar] [CrossRef]
  9. Rao, N.K.S. Arid Zone Fruit Crops. In Abiotic Stress Physiology of Horticultural Crops; Rao, N.K.S., Shivashankara, K.S., Laxman, R.H., Eds.; Springer India: New Delhi, India, 2016; pp. 223–234. [Google Scholar]
  10. Ezzat, A.; Salama, A.-M.; Szabo, S.; Yaseen, A.A.; Molnar, B.; Holb, I.J. Deficit Irrigation Strategies on Tree Physiological and Chemical Properties: Treatment Effects, Prediction Based Model Analyses and Inter-Correlations. Agronomy 2021, 11, 1361. [Google Scholar] [CrossRef]
  11. Nagaz, K.; El Mokh, F.; Ben Hassen, N.; Masmoudi, M.M.; Ben Mechlia, N.; Baba Sy, M.O.; Belkheiri, O.; Ghiglieri, G. Impact of Deficit Irrigation on Yield and Fruit Quality of Orange Trees (Citrus Sinensis, L. Osbeck, CV. Meski Maltaise) in Southern Tunisia. Irrig. Drain. 2020, 69, 186–193. [Google Scholar] [CrossRef] [Green Version]
  12. Faghih, S.; Zamani, Z.; Fatahi, R.; Liaghat, A. Effects of deficit irrigation and kaolin application on vegetative growth and fruit traits of two early ripening apple cultivars. Biol. Res. 2019, 52, 43. [Google Scholar] [CrossRef] [Green Version]
  13. Cui, N.; Du, T.; Li, F.; Tong, L.; Kang, S.; Wang, M.; Liu, X.; Li, Z. Response of vegetative growth and fruit development to regulated deficit irrigation at different growth stages of pear-jujube tree. Agric. Water Manag. 2009, 96, 1237–1246. [Google Scholar] [CrossRef]
  14. Rahmati, M.; Davarynejad, G.H.; Genard, M.; Bannayan, M.; Azizi, M.; Vercambre, G. Peach Water Relations, Gas Exchange, Growth and Shoot Mortality under Water Deficit in Semi-Arid Weather Conditions. PLoS ONE 2015, 10, e0120246. [Google Scholar] [CrossRef] [Green Version]
  15. Vélez-Sánchez, J.E.; Molina-Ochoa, M.J.; Rodríguez-Hernández, P. Effect of regulated deficit irrigation (RDI) on the vegetative growth of pear variety Triunfo de Viena (Pyrus communis L.). Rev. UDCA Actual. Divulg. Científica 2021, 24, e2007. [Google Scholar] [CrossRef]
  16. Chen, F.; Cui, N.; Jiang, S.; Li, H.; Wang, Y.; Gong, D.; Hu, X.; Zhao, L.; Liu, C.; Qiu, R. Effects of water deficit at different growth stages under drip irrigation on fruit quality of citrus in the humid areas of South China. Agric. Water Manag. 2022, 262, 107407. [Google Scholar] [CrossRef]
  17. Miras-Avalos, J.M.; Egea, G.; Nicolas, E.; Genard, M.; Vercambre, G.; Moitrier, N.; Valsesia, P.; Gonzalez-Real, M.M.; Bussi, C.; Lescourret, F. QualiTree, a virtual fruit tree to study the management of fruit quality. II. Parameterisation for peach, analysis of growth-related processes and agronomic scenarios. Trees-Struct. Funct. 2011, 25, 785–799. [Google Scholar] [CrossRef]
  18. Catalan, P.; Delgado, J.A.; Jimenez, M.D.; Balaguer, L. Sink strength manipulation in branches of a Mediterranean woody plant suggests sink-driven allocation of biomass in fruits but not of nutrients in seeds. Acta Physiol. Plant. 2016, 38, 1–6. [Google Scholar] [CrossRef]
  19. Marsal, J.; Basile, B.; Solari, L.; DeJong, T.M. Influence of branch autonomy on fruit, scaffold, trunk and root growth during Stage III of peach fruit development. Tree Physiol. 2003, 23, 313–323. [Google Scholar] [CrossRef] [PubMed] [Green Version]
  20. Richardson, A.D.; Carbone, M.S.; Keenan, T.F.; Czimczik, C.I.; Hollinger, D.Y.; Murakami, P.; Schaberg, P.G.; Xu, X. Seasonal dynamics and age of stemwood nonstructural carbohydrates in temperate forest trees. New Phytol. 2013, 197, 850–861. [Google Scholar] [CrossRef] [Green Version]
  21. Thomas, D.S.G. Arid Environments: Their Nature and Extent. In Arid Zone Geomorphology; Wiley: Hoboken, NJ, USA, 2011; pp. 1–16. [Google Scholar]
  22. Alae-Carew, C.; Nicoleau, S.; Bird, F.A.; Hawkins, P.; Tuomisto, H.L.; Haines, A.; Dangour, A.D.; Scheelbeek, P.F.D. The impact of environmental changes on the yield and nutritional quality of fruits, nuts and seeds: A systematic review. Environ. Res. Lett. 2020, 15, 023002. [Google Scholar] [CrossRef]
  23. Touil, S.; Richa, A.; Fizir, M.; Argente Garcia, J.E.; Skarmeta Gomez, A.F. A review on smart irrigation management strategies and their effect on water savings and crop yield. Irrig. Drain. 2022, 1–21. [Google Scholar] [CrossRef]
  24. Conesa, M.R.; de la Rosa, J.M.; Pablo Fernandez-Trujillo, J.; Domingo, R.; Perez-Pastor, A. Deficit irrigation in commercial mandarin trees: Water relations, yield and quality responses at harvest and after cold storage. Span. J. Agric. Res. 2018, 16, e1201. [Google Scholar] [CrossRef] [Green Version]
  25. Desoky, E.-S.M.; Mansour, E.; Yasin, M.A.T.; El-Sobky, E.-S.E.A.; Rady, M.M. Improvement of drought tolerance in five different cultivars of Vicia faba with foliar application of ascorbic acid or silicon. Span. J. Agric. Res. 2020, 18, e0802. [Google Scholar] [CrossRef]
  26. Xu, H.-J.; Wang, X.-P.; Zhao, C.-Y. Drought sensitivity of vegetation photosynthesis along the aridity gradient in northern China. Int. J. Appl. Earth Obs. Geoinf. 2021, 102, 102418. [Google Scholar] [CrossRef]
  27. Guizani, M.; Dabbou, S.; Maatallah, S.; Montevecchi, G.; Hajlaoui, H.; Rezig, M.; Helal, A.N.; Kilani-Jaziri, S. Physiological responses and fruit quality of four peach cultivars under sustained and cyclic deficit irrigation in center-west of Tunisia. Agric. Water Manag. 2019, 217, 81–97. [Google Scholar] [CrossRef]
  28. Toumi, I.; Ghrab, M.; Nagaz, K. Vegetative growth, yield, and water productivity of an early maturing peach cultivar under deficit irrigation strategies in a warm and arid area MOTS CLES. Irrig. Drain. 2022, 1–10. [Google Scholar] [CrossRef]
  29. Bandurska, H. Drought Stress Responses: Coping Strategy and Resistance. Plants 2022, 11, 922. [Google Scholar] [CrossRef]
  30. Bartlett, M.K.; Klein, T.; Jansen, S.; Choat, B.; Sack, L. The correlations and sequence of plant stomatal, hydraulic, and wilting responses to drought. Proc. Natl. Acad. Sci. USA 2016, 113, 13098–13103. [Google Scholar] [CrossRef] [Green Version]
  31. Mitchell, P.J.; Veneklaas, E.J.; Lambers, H.; Burgess, S.S. Leaf water relations during summer water deficit: Differential responses in turgor maintenance and variation in leaf structure among different plant communities in south-western Australia. Plant Cell Environ. 2008, 31, 1791–1802. [Google Scholar] [CrossRef]
  32. Hsiao, T.C.; Acevedo, E.; Fereres, E.; Henderson, D.W. Water Stress, Growth, and Osmotic Adjustment. Philos. Trans. R. Soc. London. Ser. B Biol. Sci. 1976, 273, 479–500. [Google Scholar]
  33. Salmon, Y.; Lintunen, A.; Dayet, A.; Chan, T.; Dewar, R.; Vesala, T.; Holtta, T. Leaf carbon and water status control stomatal and nonstomatal limitations of photosynthesis in trees. New Phytol. 2020, 226, 690–703. [Google Scholar] [CrossRef] [PubMed]
  34. Ma, F.; Kang, S.; Wang, M.; Pang, X.; Wang, J.; Li, Z. Effect of regulated deficit irrigation on water use efficiency and fruit quality of pear-jujube tree in greenhouse. Trans. Chin. Soc. Agric. Eng. 2006, 22, 37–43. [Google Scholar]
  35. Ben Ahmed, C.; Ben Rouina, B.; Boukhris, M. Effects of water deficit on olive trees cv. Chemlali under field conditions in arid region in Tunisia. Sci. Hortic. 2007, 113, 267–277. [Google Scholar] [CrossRef]
  36. Mullet, J.E.; Whitsitt, M.S. Plant cellular responses to water deficit. Plant Growth Regul. 1996, 20, 119–124. [Google Scholar] [CrossRef]
  37. Zhang, Y.-J.; Meinzer, F.C.; Hao, G.-Y.; Scholz, F.G.; Bucci, S.J.; Takahashi, F.S.C.; Villalobos-Vega, R.; Giraldo, J.P.; Cao, K.-F.; Hoffmann, W.A.; et al. Size-dependent mortality in a Neotropical savanna tree: The role of height-related adjustments in hydraulic architecture and carbon allocation. Plant Cell Environ. 2009, 32, 1456–1466. [Google Scholar] [CrossRef]
  38. Ryan, M.G.; Phillips, N.; Bond, B.J. The hydraulic limitation hypothesis revisited. Plant Cell Environ. 2006, 29, 367–381. [Google Scholar] [CrossRef]
  39. Koch, G.W.; Sillett, S.C.; Jennings, G.M.; Davis, S.D. The limits to tree height. Nature 2004, 428, 851–854. [Google Scholar] [CrossRef]
  40. McGregor, I.R.; Helcoski, R.; Kunert, N.; Tepley, A.J.; Gonzalez-Akre, E.B.; Herrmann, V.; Zailaa, J.; Stovall, A.E.L.; Bourg, N.A.; McShea, W.J.; et al. Tree height and leaf drought tolerance traits shape growth responses across droughts in a temperate broadleaf forest. New Phytol. 2021, 231, 601–616. [Google Scholar] [CrossRef]
  41. Fang, L.-D.; Ning, Q.-R.; Guo, J.-J.; Gong, X.-W.; Zhu, J.-J.; Hao, G.-Y. Hydraulic limitation underlies the dieback of Populus pseudo-simonii trees in water-limited areas of northern China. For. Ecol. Manag. 2020, 483, 118764. [Google Scholar] [CrossRef]
  42. Ambrose, A.R.; Sillett, S.C.; Dawson, T.E. Effects of tree height on branch hydraulics, leaf structure and gas exchange in California redwoods. Plant Cell Environ. 2009, 32, 743–757. [Google Scholar] [CrossRef]
  43. Burgess, S.S.O.; Pittermann, J.; Dawson, T.E. Hydraulic efficiency and safety of branch xylem increases with height in Sequoia sempervirens (D. Don) crowns. Plant Cell Environ. 2006, 29, 229–239. [Google Scholar] [CrossRef] [PubMed] [Green Version]
  44. McGranahan, G.; Leslie, C. Walnut. In Fruit Breeding; Badenes, M.L., Byrne, D.H., Eds.; Springer US: Boston, MA, USA, 2012; pp. 827–846. [Google Scholar]
  45. Liu, B.; Liang, J.; Zhao, D.; Wang, K.; Jia, M.; Wang, J. Morphological and Compositional Analysis of Two Walnut (Juglans regia L.) Cultivars Growing in China. Plant Foods Hum. Nutr. 2020, 75, 116–123. [Google Scholar] [CrossRef] [PubMed]
  46. Pollegioni, P.; Woeste, K.E.; Chiocchini, F.; Olimpieri, I.; Tortolano, V.; Clark, J.; Hemery, G.E.; Mapelli, S.; Malvolti, M.E. Landscape genetics of Persian walnut (Juglans regia L.) across its Asian range. Tree Genet. Genomes 2014, 10, 1027–1043. [Google Scholar] [CrossRef]
  47. Beer, R.; Kaiser, F.; Schmidt, K.; Ammann, B.; Carraro, G.; Grisa, E.; Tinner, W. Vegetation history of the walnut forests in Kyrgyzstan (Central Asia): Natural or anthropogenic origin? Quat. Sci. Rev. 2008, 27, 621–632. [Google Scholar] [CrossRef]
  48. Martínez, M.L.; Labuckas, D.O.; Lamarque, A.L.; Maestri, D.M. Walnut (Juglans regia L.): Genetic resources, chemistry, by-products. J. Sci. Food Agric. 2010, 90, 1959–1967. [Google Scholar] [CrossRef]
  49. Huang, M.; Zhang, Q.; Wang, G.; Ning, W. Effect of Soil Texture and Age on Soil Exchangeable Calcium and Magnesium in the Early Bearing Walnut Orchard. J. Agric. Sci. Technol. 2017, 19, 132–137. [Google Scholar]
  50. Shen, H.; Xu, S.-J.; Hong, L.; Wang, Z.-M.; Ye, W.-H. Growth but Not Photosynthesis Response of a Host Plant to Infection by a Holoparasitic Plant Depends on Nitrogen Supply. PLoS ONE 2013, 8, e75555. [Google Scholar] [CrossRef]
  51. Anderegg, W.R.L.; Berry, J.A.; Smith, D.D.; Sperry, J.S.; Anderegg, L.D.L.; Field, C.B. The roles of hydraulic and carbon stress in a widespread climate-induced forest die-off. Proc. Natl. Acad. Sci. USA 2012, 109, 233–237. [Google Scholar] [CrossRef] [Green Version]
  52. Xie, H.; Li, M.; Chen, Y.; Zhou, Q.; Liu, W.; Liang, G.; Jia, Z. Important Physiological Changes Due to Drought Stress on Oat. Front. Ecol. Evol. 2021, 9, 644726. [Google Scholar] [CrossRef]
  53. Lambers, H.; Chapin, F.S.; Pons, T.L. Plant Water Relations. In Plant Physiological Ecology; Lambers, H., Chapin, F.S., Pons, T.L., Eds.; Springer New York: New York, NY, USA, 2008; pp. 163–223. [Google Scholar]
  54. Ackerly, D. Functional strategies of chaparral shrubs in relation to seasonal water deficit and disturbance. Ecol. Monogr. 2004, 74, 25–44. [Google Scholar] [CrossRef]
  55. Sack, L.; Holbrook, N.M. Leaf hydraulics. Annu. Rev. Plant Biol. 2006, 57, 361–381. [Google Scholar] [CrossRef] [PubMed] [Green Version]
  56. Sack, L.; Tyree, M.T. 5-Leaf Hydraulics and Its Implications in Plant Structure and Function. In Vascular Transport in Plants; Holbrook, N.M., Zwieniecki, M.A., Eds.; Academic Press: Burlington, NJ, USA, 2005; pp. 93–114. [Google Scholar]
  57. Soltys-Kalina, D.; Plich, J.; Strzelczyk-Żyta, D.; Śliwka, J.; Marczewski, W. The effect of drought stress on the leaf relative water content and tuber yield of a half-sib family of ‘Katahdin’-derived potato cultivars. Breed. Sci. 2016, 66, 328–331. [Google Scholar] [CrossRef] [Green Version]
  58. Ishida, A.; Yamamura, Y.; Hori, Y. Roles of leaf water potential and soil-to-leaf hydraulic conductance in water use by understorey woody plants. Ecol. Res. 1992, 7, 213–223. [Google Scholar] [CrossRef]
  59. Lin, T.; Zheng, X.; Zheng, H. Seasonal variations in leaf and branch trace elements and the influence of a 3-yr 100% rainfall exclusion on Pinus massoniana Lamb. Peerj 2020, 8, e9935. [Google Scholar] [CrossRef] [PubMed]
  60. Bhaskar, R.; Ackerly, D.D. Ecological relevance of minimum seasonal water potentials. Physiol. Plant. 2006, 127, 353–359. [Google Scholar] [CrossRef]
  61. Yun, L.; Bi, H.; Ma, W.; Tian, X.; Cui, Z. Spatial distribution characteristics of root system of walnut trees in the walnut-peanut intercropping system in the loess region of western shanxi. J. Northeast For. Univ. 2010, 38, 67–70. [Google Scholar]
  62. Scholander, P.F.; Hammel, H.T.; Bradstreet, E.D.; Hemmingsen, E.A. Sap pressure in vascular plants- ngegative hydrostatic pressure can be measured in plants. Science 1965, 148, 339–346. [Google Scholar] [CrossRef] [PubMed]
  63. Berry, J.A. Adaptation of photosynthetic processes to stress. Science 1975, 188, 644–650. [Google Scholar] [CrossRef] [PubMed]
  64. Herrmann, H.A.; Schwartz, J.M.; Johnson, G.N. From empirical to theoretical models of light response curves-linking photosynthetic and metabolic acclimation. Photosynth. Res. 2020, 145, 5–14. [Google Scholar] [CrossRef] [Green Version]
  65. Lambers, H.; Chapin, F.S.; Pons, T.L. Photosynthesis. In Plant Physiological Ecology; Lambers, H., Chapin, F.S., Pons, T.L., Eds.; Springer: New York, NY, USA, 2008; pp. 11–99. [Google Scholar]
  66. Bernard, A.; Lheureux, F.; Dirlewanger, E. Walnut: Past and future of genetic improvement. Tree Genet. Genomes 2018, 14, 1–28. [Google Scholar] [CrossRef] [Green Version]
  67. Wang, Z.; Li, G.; Sun, H.; Ma, L.; Guo, Y.; Zhao, Z.; Gao, H.; Mei, L. Effects of drought stress on photosynthesis and photosynthetic electron transport chain in young apple tree leaves. Biol. Open 2018, 7, bio035279. [Google Scholar] [CrossRef] [PubMed] [Green Version]
  68. Matos Guimaraes, Z.T.; Hardt Ferreira dos Santos, V.A.; Ferreira, M.J. Chlorophyll a fluorescence parameters are related to the leaf economics spectrum of tropical tree species in a mixed plantation. Trees-Struct. Funct. 2022, 36, 763–775. [Google Scholar] [CrossRef]
  69. Maxwell, K.; Johnson, G.N. Chlorophyll fluorescence—A practical guide. J. Exp. Bot. 2000, 51, 659–668. [Google Scholar] [CrossRef]
  70. Zheng, X.-J.; Xu, G.-Q.; Li, Y.; Wu, X. Deepening Rooting Depths Improve Plant Water and Carbon Status of a Xeric Tree during Summer Drought. Forests 2019, 10, 592. [Google Scholar] [CrossRef] [Green Version]
  71. Cruz de Carvalho, M.H. Drought stress and reactive oxygen species: Production, scavenging and signaling. Plant Signal. Behav. 2008, 3, 156–165. [Google Scholar] [CrossRef] [Green Version]
  72. Carter, J.L.; White, D.A. Plasticity in the Huber value contributes to homeostasis in leaf water relations of a mallee Eucalypt with variation to groundwater depth. Tree Physiol. 2009, 29, 1407–1418. [Google Scholar] [CrossRef] [Green Version]
  73. Xu, G.-Q.; Mi, X.-J.; Ma, J.; Ma, J.; Tang, L.-S. Impact of groundwater depth on hydraulic performance and growth of Haloxylon ammodendron in a desert region of central Asia. Ecohydrology 2021, e2394. [Google Scholar] [CrossRef]
  74. Tsuji, C.; Dannoura, M.; Desalme, D.; Angeli, N.; Takanashi, S.; Kominami, Y.; Epron, D. Drought affects the fate of non-structural carbohydrates in hynoki cypress. Tree Physiol. 2022, 42, 784–796. [Google Scholar] [CrossRef]
  75. Nogales-Bueno, J.; Feliz, L.; Baca-Bocanegra, B.; Hernández-Hierro, J.M.; Heredia, F.J.; Barroso, J.M.; Rato, A.E. Comparative study on the use of three different near infrared spectroscopy recording methodologies for varietal discrimination of walnuts. Talanta 2020, 206, 120189. [Google Scholar] [CrossRef]
  76. Estiarte, M.; Reixach, J.P.i. Excess carbon: The relationship with phenotypical plasticity in storage and defense functions of plants. Orsis Org. I Sist. 1999, 14, 159–203. [Google Scholar]
  77. Durán-Soria, S.; Pott, D.M.; Osorio, S.; Vallarino, J.G. Sugar Signaling During Fruit Ripening. Front. Plant Sci. 2020, 11, 564917. [Google Scholar] [CrossRef] [PubMed]
  78. Silveira, L.K.; Pavao, G.C.; dos Santos Dias, C.T.; Quaggio, J.A.; de Matos Pires, R.C. Deficit irrigation effect on fruit yield, quality and water use efficiency: A long-term study on Pera-IAC sweet orange. Agric. Water Manag. 2020, 231, 106019. [Google Scholar] [CrossRef]
  79. Wagner, Y.; Pozner, E.; Bar-On, P.; Ramon, U.; Raveh, E.; Neuhaus, E.; Cohen, S.; Grünzweig, J.; Klein, T. Rapid stomatal response in lemon saves trees and their fruit yields under summer desiccation, but fails under recurring droughts. Agric. For. Meteorol. 2021, 307, 108487. [Google Scholar] [CrossRef]
Figure 1. Soil water potential (Ψsoil) at different soil depths. Different lowercase letters indicate significant differences (p < 0.05) between different soil depths for the same treatment; Different capital letters indicate significant differences (p < 0.05) between different treatments for the same soil depth (mean ± standard error, n = 3).
Agronomy 12 01647 g001
Figure 2. Midday leaf water potential (Ψmd, (a)) and leaf relative water content (LRWC, (b)) of ‘Win 185’ walnuts under different irrigation levels. Different lowercase letters indicate significant differences between different tree heights under the same treatment; Different capital letters indicate significant differences between different treatments at the same tree height (p < 0.05, mean ± standard error, n = 3~4).
Agronomy 12 01647 g002
Figure 3. Characteristic parameters of photosynthetic response curves (ad), maximum photochemical efficiency (e) and chlorophyll SPAD values (f) of walnuts under different irrigation treatments. N.S indicates no significant difference between treatments (p < 0.05, mean ± standard error, n = 3).
Agronomy 12 01647 g003
Figure 4. Soluble sugar content of leaves (LSs, (a)), fruit kernels (FSs, (b)) and fine roots (RSs, (c)) at different irrigation levels and tree heights. Different lowercase letters indicate significant differences between different tree heights under the same treatment; Different capital letters indicate significant differences between different treatments at the same tree height; N.S indicates no significant difference between treatments (p < 0.05, mean ± standard error, n = 3–4).
Agronomy 12 01647 g004
Figure 5. Branch end leaf area (LA, (a)), Huber value (HV, (b)) and Branch growth (BG, (c)) at different irrigation levels. Different capital letters indicate significant differences between different treatments at the same tree height; N.S indicates no significant difference between treatments (p < 0.05, mean ± standard error, n = 3~4).
Agronomy 12 01647 g005
Figure 6. Morphological parameters of fruits (a,b), fruits weight (FW, (c)) and no kernel or deflated kernel (NDK) rates (d) for different irrigation treatments and tree heights. Different lowercase letters indicate significant differences between different tree heights under the same treatment; Different capital letters indicate significant differences between different treatments at the same tree height (p < 0.05, mean ± standard error, n = 3~4). The total number of investigated walnut fruits were 794, 1374 and 1627 for the DI, CI and EI groups, respectively.
Agronomy 12 01647 g006
Figure 7. Correlation analyses between indicators at different irrigation levels. p < 0.05 denotes a significant correlation. p < 0.05 for *; p < 0.01 for **; p < 0.001 for ***. FSs: seed kernel soluble sugars; RED: empty deflated shell rate; HV: Huber value; lSs: leaf soluble sugars; RWC: relative leaf water content; LA: compound leaf area; Ψmd: midday leaf water potential; CD: fruit transverse diameter; FW: fruit weight; LD: fruit vertical diameter; Pmax: maximum net photosynthetic rate; gs: stomatal conductance; SPAD: chlorophyll SPAD value.
Agronomy 12 01647 g007
Table 1. Gray correlation analysis.
Indexes123456789Correlation DegreeCorrelation
Order
LSs0.820.980.530.870.580.760.580.700.540.714
FSs0.570.760.900.600.840.810.700.600.880.742
Ψmd0.860.590.840.930.900.860.850.840.850.841
FW0.840.850.340.430.780.850.950.540.960.733
FCD0.810.730.370.380.740.770.940.680.900.706
FVD0.890.810.350.430.900.700.730.540.980.705
LWC0.940.520.390.760.810.850.500.730.560.677
gs0.570.380.530.490.790.780.800.630.570.618
Note, 1–9 indicate the sample number.
Publisher’s Note: MDPI stays neutral with regard to jurisdictional claims in published maps and institutional affiliations.

