Abstract
Soil compaction is a severe threat to agricultural productivity, as it can lead to yield losses ranging from 5% to 40%. Quantification of the state of compaction can help farmers and land managers to determine the optimal management to avoid these losses. Bulk density is often used as an indicator for compaction. It is a costly and time-consuming measurement, making it less suitable for farmers and land managers. Alternatively, measurements of penetration resistance can be used. These measurements are cheaper and quicker but are prone to uncertainty due to the existence of a wide array of thresholds. Classifications using either measurement may provide different outcomes when used in the same location, as they approximate soil compaction using different mechanisms. In this research, we assessed the level of agreement between soil compaction classifications using bulk density and penetration resistance for an agricultural field in Flevoland, the Netherlands. Additionally, we assessed the possible financial implications of misclassification. Balanced accuracy results indicate that most thresholds from the literature show around 70% agreement between both methods, with a maximum level of agreement of 76% at 1.8 and 1.9 MPa. The expected cost of misclassification shows a dip between 1.0 and 3.0 MPa, with an effect of crop value on the shape of the cost function. Although these results are specific to our study area, we believe they show that there is a substantial effect of the choice of measurement on the outcome of soil compaction studies.
1. Introduction
Soil compaction is internationally recognised as a threat to agricultural soil quality and productivity [1,2,3]. It is characterised by a reduction in pore space, increase in soil strength and a disruption of pore continuity [4]. The process of compaction can occur naturally during the ripening of the soil or through vertical movement of soil particles in vertisols [5,6]. In agricultural soils, it is often created by the exertion of an external force on the soil, which happens during the tillage or wheeling of the soil when the soil moisture content is too high and by using heavy machinery [5,7]. The term “soil compaction” is often also used to describe the state of soil degradation, rather than the process itself. Soil compaction can lead to reductions in permeability, pore connectivity, water retention, root growth and nutrient uptake [4,8,9,10,11,12]. Estimated yield losses due to compaction and its effects can reach as high as 40% of the potential yield [13], with more conservative estimates at 5% to 10% [14].
For the Netherlands, studies have indicated that 43% of the Dutch subsoils may be compacted below the annual plough layer [15], and large parts of the country are likely susceptible and vulnerable to soil compaction [16]. This is partially a result of the inherent properties of Dutch soils, many of which are naturally susceptible [16]. Additionally, the machines used in the Netherlands have become heavier [17], and field operations more often take place under less suitable conditions such as late autumn. This vulnerability makes it crucial for farmers and other land managers to take action to prevent, alleviate or remediate the negative effects of soil compaction.
Taking action requires insight into the current state of compaction in the soil on a scale which is relevant to farmers, including the field and sub-field scales. A method to gain this insight, which is also used in scientific research [4,18,19,20,21], is measuring the dry bulk density of the soil (BDd). As soil compaction leads to the densification of the soil, it logically results in an increase of BDd. The measured density can be compared to a threshold value which is representative for the value above which the soil is considered “too compacted”. Texture-specific BDd thresholds have been determined and are generally accepted in both the scientific literature [15,22,23,24] and (inter)national quality standards [25,26].
Using BDd to find and classify soil compaction seems suitable in principle, but the measurements and analysis are expensive and laborious. Sampling usually takes place in an excavated soil pit, rather than directly from the surface. It can take considerable time to take a core sample properly, as it needs to be extracted from the soil and cut to size without disturbing the sample. Multiple samples are often needed per location, and the analysis needs to occur in a laboratory [25,26]. This can become time-consuming and costly if many locations need to be sampled to capture spatial variation. The Dutch national soil information database (BIS) [27] does include measurements of BDd, but these data can be outdated, and measurement locations are too sparse to provide field-specific information which Dutch farmers and land managers may require.
Soil compaction can also be assessed using penetrologgers that measure the penetration resistance (PR) of the soil. This soil property is linked to the resistance plant roots experience whilst growing through the soil [28,29]. It is a therefore a measure of soil strength rather than the density. In compacted soils, the densely packed soil material makes it more difficult for roots to penetrate into the soil due to the increase in soil strength. This results in shallow root growth, raising the vulnerability to drought and decreasing the effective depth over which nutrients are plant-available [4]. PR can be measured from the soil surface using a hand-driven cone penetrologger, requiring neither soil excavation nor laboratory analyses. It can be compared to threshold values from literature in order to evaluate the state of compaction (Table 1). Above these thresholds, the measured PR is linked to detrimental effects on plant growth.

Table 1.
The use of soil penetration resistance thresholds in existing literature, along with any sources cited in each study.
Using PR as a measure of the state of soil compaction is not without challenges. Measurements are sensitive to soil moisture conditions [63,64] and operator error [65], besides bulk density and soil texture [66,67]. The measured PR typically decreases with an increase in soil moisture content, meaning PR will be higher if the soil is dry and lower if it is wet. Operator errors can occur if the device is not pushed straight into the soil at a constant and moderate pace, resulting in improper depth assessment and unreliable measurements.
These challenges can be partly overcome by sampling under set conditions, taking multiple measurements to average out irregularities, proper instructions for the surveyor or using an automated hydraulic system [65]. However, the method remains sensitive to errors. Table 1 shows a large number of studies in which PR was used to capture compaction, using threshold values to determine the point where detrimental effects occur. Multiple different thresholds exist in the range of 2.0 to 4.2 MPa, most of which were determined for specific crops [48]. This is in contrast to the characterisation of compaction using BDd, where a single crop-independent threshold is used after correction for clay content.
BDd and PR are two measurements that can both be used to characterise soil compaction, but they inherently measure different soil properties (i.e., density and soil strength, respectively). Previous studies have shown that the correlation between these two measurements is far from perfect [66,67,68,69], and they did not investigate the effects of using a threshold value for classification. It is possible that a straightforward classification of the state of soil compaction with BDd does not provide the same result as classification using PR, leading to misclassifications. If farmers and land managers use these measurements to support management choices and reduce the detrimental impact of soil compaction, this can potentially result in a situation where management would be different if another measurement tool were used. It is therefore crucial to determine both the level of agreement between both methods and its (financial) implications when used in a straightforward classification of the state of soil compaction.
Farmers and land managers will likely prefer the use of PR over BDd due to its simplicity, ease-of-use and relatively low cost per measurement location. However, multiple thresholds are proposed in the literature, and there are no clear guidelines on which threshold is suitable in which situation (Table 1). This issue does not affect BDd classification as much, as only a single standardised threshold exists for each soil. It is therefore useful to assess the performance of PR over a wide range of thresholds, compared to BDd classification. The objective of this research was to assess the level of agreement between the classification of the state of soil compaction using BDd and PR, where BDd is used as the reference. We used a case study in Flevoland, the Netherlands, to illustrate the level of agreement between both methods in a realistic situation where either method could have been used by the farmer. The aim was to provide a clear indication of the performance of various PR thresholds, as these are the most likely measurements to be used by farmers and land managers. We also aimed to illustrate the possible financial implications from misclassification, if these measurements were to be used to steer management. Our research also functions as a general reflection on the wide array of thresholds proposed in literature and their effects when used in the field.
2. Methods and Materials
2.1. Study Area
Data for this study were collected on an agricultural field in the province of Flevoland, the Netherlands (Figure 1). The region consists of a former seabed that was reclaimed in the 1940s and has since been in use mainly as agricultural land [70]. Crop rotations are based around potatoes, sugar beets, onions and grains. Soils in Flevoland are relatively young and consist mostly of fluvisols and cambisols, using the World Reference Base for Soil Resources [71]. Topsoils in Flevoland range from loamy to clayey, with subsoils of sandy or peaty materials. The topography is linked to its history as a former seabed, being mostly flat with minor natural undulations due to a former coastal system of creeks and tidal channels. The study area is located in the eastern parts of Flevoland, in the Noordoostpolder.
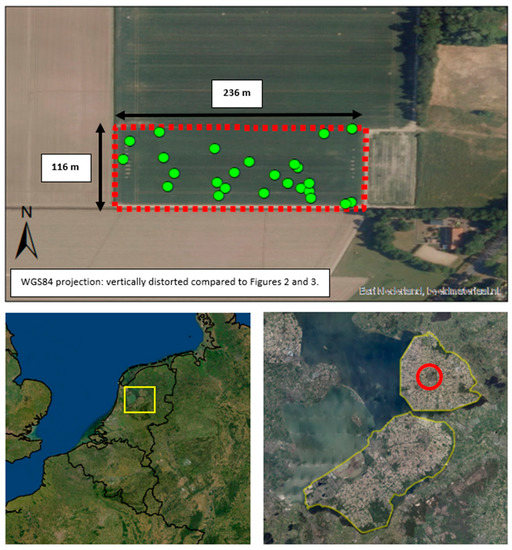
Figure 1.
Location of the study area (red dashed line, top) and the 25 measurement locations (green dots, top). The location of the province of Flevoland within The Netherlands is depicted using a yellow outline (bottom left and right). The locations of the town of Emmeloord and our study area are provided using a red circle (bottom right).
The study site is located at the edge of the town of Emmeloord. In 2017, the study site was used for a large public event on potato cultivation technologies. This event included demonstrations of, e.g., harvesting equipment, tractors, and other heavy machinery. These demonstrations were conducted under rainy conditions and in moist soils, showing visual compaction signs such as the deep rutting and smearing of the soil. Satellite images from 2018 showed within-field heterogeneity, visible as slowly drying wet spots within the field (Figure 2). In 2021, two years after field sampling for this study took place, some of these patterns were still visible (Figure 3). We selected this study site because of its expected heterogeneity in degree of compaction due the heavy compaction event in 2017.
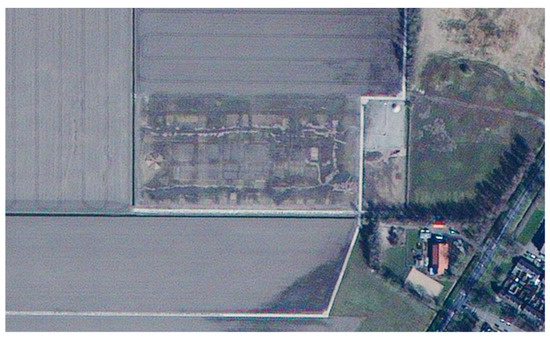
Figure 2.
Satellite image of the study area on 20 March 2018 (source: https://www.satellietdataportaal.nl/, accessed on 10 December 2021).
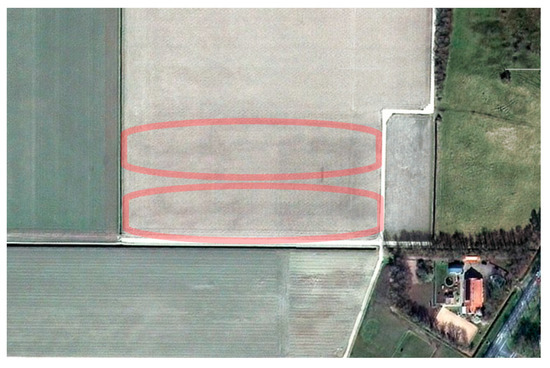
Figure 3.
Satellite image of the study area on 24 March 2021 (source: https://www.satellietdataportaal.nl/, accessed on 10 December 2021). Two of the main tracks used during the event were still visible as dark spots on the satellite image (circled in red).
2.2. Data Collection and Pre-Processing
Fieldwork for data collection took place in the autumn of 2018, after maize harvest when the soil moisture was approximately at field capacity. The fieldwork was spread over multiple weeks and was dependent on weather conditions. Sampling was suspended for two days if it rained, allowing the topsoil to dry out enough to avoid sampling errors. The farmer left the soil bare and unploughed before sampling. However, in some places, the topsoil was loosened to a depth of 20 cm using a shallow subsoiler. In order to avoid unwanted influence by this shallow loosening, samples were not taken in loosened soil. The local soil profiles consisted of a loamy topsoil of 30 to 50 cm deep, followed by a subsoil of loamy sand (Figure 4). Visual and tactile observations indicated little vertical or horizontal heterogeneity.
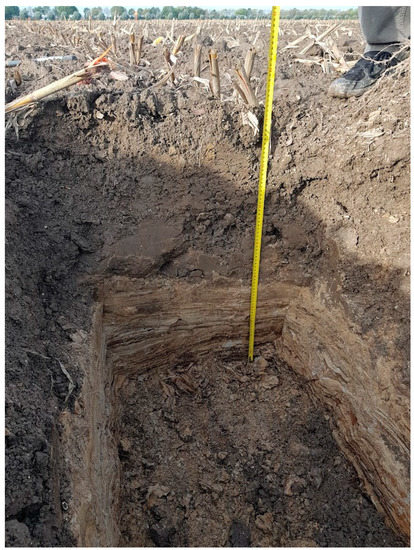
Figure 4.
An example of the soil profile found at the study location. It is comprised of approximately 30 cm of loamy topsoil, followed by sandy subsoil. The diagonal line in the topsoil is a shadow.
Data collection during fieldwork included measurements of BDd, volumetric soil moisture and a general description of the soil texture at 5, 15, 25, 35, 45 and 55 cm depth. PR measurements were also available from 0 until 80 cm depth, in increments of 1 cm. These data were gathered at 50 sample locations, but only a subset of 83 samples from 25 locations was suitable for this research due to laboratory handling error-related data loss. This subset included only samples in the loamy topsoil, as previous experience in this field showed that compaction was mostly present in this topsoil layer.
The original 50 sample locations were determined using the conditioned Latin hypercube sample (cLHS) method as used by Minasny and McBratney [72]. Geophysical data with a resolution of 1 m × 1 m from ground penetrating radar (GPR), electromagnetic inductance (EMI) and gamma ray detection were used as covariates in this cLHS. Additionally, the study site was stratified into 50 equal areas using k-means [73]. These strata were also added to the cLHS as a covariate, to allow for a geographic spread of the sample locations. Due to the use of a subset as a result of data-loss, the data used in this research can be considered a convenience sample based on data quality and availability rather than a cLHS.
2.3. Penetration Resistance (PR)
PR measurements were conducted from the surface using a Penetrologger [74], a cone penetrometer with data logging capabilities. In accordance with the field sampling protocol, these measurements were taken before the soil around the sample location was disturbed or trampled. This was done to avoid unwanted influence on the measurements.
PR was measured six times at each measurement location, allowing us to filter out short-distance variation and reduce measurement uncertainty during data processing. All measurements were taken within 1–2 m of the pit centre, where soil samples for measurements of bulk density were collected (Figure 5). We used a cone with a surface area of 1 cm2 and an angle of 60 degrees to measure to 80 cm depth. The penetration speed was manually kept at approximately 2 cm s−1. The Penetrologger measured with a vertical resolution of 1 cm and provided PR at a resolution of 0.01 MPa.
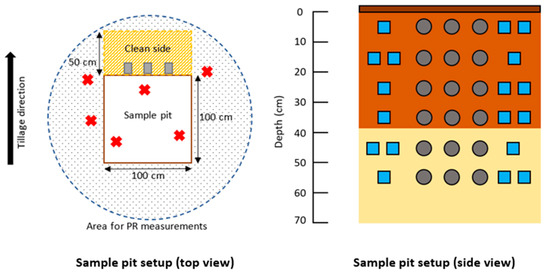
Figure 5.
Diagrams of the sample pit setup. (Left) top-down view. PR measurements were conducted prior to digging at the red crosses. Bulk density cores are depicted by grey rectangles in the clean side of the pit. (Right) side-view of the clean side. Bulk density samples (grey discs) were taken in the centre of the pit face, with soil moisture measurements (blue boxes) at the sides.
2.4. Dry Bulk Density (BDd)
Soil pits with a surface area of 100 by 100 cm and a depth of 70 cm were excavated (Figure 5 and Figure 6). Although samples were not collected deeper than 55 cm, the extra depth was required as manoeuvring space for sampling equipment. One side of the pit was chosen as the “clean” side for soil sampling. We did not stand or lean on this side of the pit to avoid unwanted compaction or disruption of the soil during the sampling process. Samples for BDd were taken following Dutch guidelines [26], which are identical to international guidelines [75]. We sampled the soil at 5, 15, 25, 35, 45 and 55 cm depth (Figure 5) using Kopecky cores with an internal volume of 100 cm3 and a diameter of approximately 5 cm. These cores were taken horizontally in the clean side of the pit, using a hammer to gently tap them into the soil. We took three cores at each depth in order to reduce the effect of short-distance spatial variation.
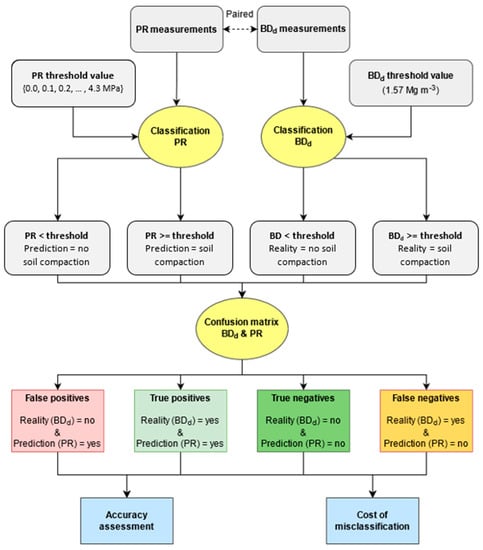
Figure 6.
Flowchart of the analysis, including the confusion matrix, accuracy indicators and misclassification cost. This workflow was repeated for all 44 candidate PR thresholds.
The undisturbed samples were capped to avoid losing soil, taken to the laboratory and dried in an oven for 48 h at 105 °C following the international guidelines [26,75]. The oven-dry samples were weighed using a scale with a resolution of 0.1 g. The arithmetic mean of the triplets of soil samples was determined for each depth, providing the measured BDd at 0.001 Mg m−3 resolution. As previously stated, only samples from the loamy topsoil were used for further analysis in this research. The boundary between the topsoil and subsoil was clearly visible in the field (Figure 4), and it was noted down which samples were taken in the topsoil. This allowed for easy selection of topsoil samples for analysis.
2.5. Soil Moisture and Clay Content Estimation
Volumetric soil moisture content (θv) was measured three times at each sampling depth (Figure 5), using a TDR-based W.E.T. sensor [76]. The arithmetic mean of these three measurements was used to assess the soil moisture conditions at the time of sampling.
We estimated the topsoil clay content for all samples using a single existing auger location from the Dutch national database BIS [27]. These auger locations can be found throughout the Netherlands and include a full soil profile description, including an estimation of the clay content for all soil horizons. In our study, the BIS auger location was approximately 600 m removed from the study site, and it was measured in 2017. This is at a considerable distance from the study site, and it is not the most reliable estimate, as it provides no data on short-distance variation. We decided to still use these data because it is a realistic data source for farmers and other land managers, and the purpose of this research is to evaluate the use of BDd and PR under realistic conditions. Taking samples for laboratory soil texture analysis at every soil pit would almost certainly have provided more reliable estimates for clay content. However, these detailed analyses would be unlikely to occur in practice due to the high cost.
2.6. Data Pre-Processing
Data pre-processing for BDd samples and θv was done in Microsoft Excel. The arithmetic mean was calculated for all 83 suitable topsoil samples, using the triplets of BDd cores and θv measurements at each sampling depth. Soil moisture conditions are known to have an effect on PR measurements, as moist soils have lower PR values than dry soils [77]. Samples that were taken in either too moist or dry conditions were therefore excluded from the analysis in order to avoid unwanted effects on PR. We determined the mean moisture content of all samples, which was roughly 24%. All samples and measurements that were obtained at soil moisture levels under 19% or over 29% were excluded from further analysis. Using this method, we removed 14 BDd and PR measurements, leaving a total of 69 measurements for further analysis. The soil moisture data were approximately normally distributed, and removed samples were located at both tails of this distribution.
All PR data were analysed using the R programming language [78]. The mean PR profile from 0 to 80 cm in depth was calculated at each of the 25 sample locations, by taking a measurement depth-based weighted average of the six local replica measurements. This was done to reduce the effects of outliers and short-distance variation. This weighted mean profile was calculated using local polynomial kernel smoothing, available in the R-Package KernSmooth [79,80]. We used a Gaussian kernel with a bandwidth of 1.5. This value was chosen to align the vertical support of the BDd sample cores with that of the averaged PR measurements, as it meant that the Gaussian function had a width that roughly equalled the soil core diameter (5 cm). This means that the pre-processed measurements of BDd and PR are both representative for a 5 cm depth interval, centred around the measurement depth.
The BDd measurements were obtained at specific depths, divided over the 25 sample locations. In order to match the correct PR value to each of the 69 BDd measurements, we extracted the values at the corresponding depths from the averaged PR profiles. This resulted in 69 paired BDd and PR measurements.
2.7. State of Soil Compaction Using BDd and PR
The main analysis involved a comparison of the state of soil compaction estimated from the 69 paired BDd and PR measurements (Figure 6). Within this context, it was assumed that the BDd measurements could function as the reference that best approximated the “true” state of compaction.
Each measured BDd value was converted to a comprehensive classification with two states: (1) compacted or (2) not compacted, using Equation (1) [25,26]. This equation uses the clay content to provide a BDd threshold above which compaction is deemed harmful to plants. We estimated the topsoil clay content at 20%, using the available BIS data [27]. After applying Equation (1), the BDd threshold for soil compaction was set at 1.57 Mg m−3. Any BDd values equal to or greater than 1.57 Mg m−3 were classified as compacted, whereas samples below the threshold were considered not compacted.
Soil compaction was classified for PR using a similar approach, where all 69 measured PR values were classified as either compacted or not compacted. Rather than using a single threshold, as was done for BDd, multiple candidate thresholds were investigated in order to determine their performance. All values from 0.0 MPa to 4.3 MPa, in increments of 0.1 MPa, were considered as candidates. The classification using PR was therefore run 44 times—once using each candidate threshold. We purposely chose to include more candidates than given in the list of thresholds from the literature (Table 1) as this reduced the risk of missing the true optimum. The upper limit of 4.3 MPa was chosen because it was the highest PR value found in the dataset. It is theoretically possible to measure up to roughly 8.0 MPa using a hand-driven Penetrologger, but such high values were not found in the dataset.
2.8. Confusion Matrices
In order to determine the level of agreement between BDd and PR soil compaction classifications, all paired classifications were compared to each other using BDd as the “true” reference. As there are 44 different sets of classifications for the candidate PR thresholds, the comparison to the reference BDd classification was done 44 times. The results were summarised in 44 separate confusion matrices, which assigned measurement pairs to one of four categories: (1) true positive, (2) true negative, (3) false positive and (4) false negative (Figure 5). This method allows for a straightforward assessment of the performance of each candidate PR threshold.
The first two “true” categories contain all pairs for which both methods are in agreement, with true positives containing compacted pairs and true negatives containing not-compacted pairs. In essence, this represents the instances for which PR provided the same classification as BDd. The latter two “false” categories contain pairs for which PR did not provide the same classification. The category of false positives corresponds to the statistical type I error. This occurs when PR classification indicated soil compaction was present, but the BDd reference states there is none. The false negatives correspond to the type II error, where the PR classification wrongly concludes the opposite—that there is no soil compaction.
2.9. Accuracy Metrics
The overall performance of each candidate PR threshold was also obtained from the confusion matrices through the use of accuracy metrics. For this research, we calculated the accuracy, sensitivity, specificity and balanced accuracy for all candidate PR thresholds (defined in Table 2). This metric is also used under the assumption that BDd can be used as a true reference. The accuracy provides a direct indication of the overall “correctness” of PR as a measure to classify soil compaction, compared to the reference classification using BDd. It is calculated by taking the ratio of true positives and true negatives to the total number of sample pairs (Table 2).
Table 2.
Accuracy measures used to evaluate the performance of PR thresholds. NTP = number of cases of true positives, NTN = number of cases of true negatives, NFP = number of cases of false positives and NFN = number of cases of false negatives.
The sensitivity and specificity provide more in-depth insights. They were calculated using the corresponding formulas from Table 2. Within the context of this research, sensitivity provides the success rate for correctly classifying compacted samples. In essence, it determines how well PR performs at finding the soils which are compacted from all measurement pairs. Specificity does the opposite, as it provides the success rate for samples that are not compacted. The added benefit of calculating the sensitivity and specificity is that it allows for an assessment of bias.
Although the accuracy is a straightforward metric, it is sensitive to data imbalance. This is especially the case in datasets where one class or classification is more abundant than another. We therefore also calculated the balanced accuracy, which is the arithmetic mean of the sensitivity and specificity (Table 2). This metric is unaffected by data imbalance. A more elaborate discussion on the use of accuracy metrics and their use given data balance is given by Tharwat [81].
2.10. Misclassification Costs: Formula
Expected misclassification costs were calculated in order to show the trends in financial effects of misclassification, which could be directly experienced by farmers. These include costs related to yield losses as a result of false negatives and tillage costs as a result of false positives. The key concept of misclassification cost is that measurements such as PR are used to inform choices regarding land management. Misclassification can then lead to unnecessary costs that would not have occurred if the measurements were perfect.
The expected misclassification costs were determined under the previously used assumption that BDd can be used as a reference of the true state of compaction. There were three further main assumptions: (1) exceeding the BDd threshold always leads to yield losses due to (over)compaction, (2) there are no yield losses due to soil compaction when the BDd threshold is not exceeded, and (3) alleviating soil compaction has an associated cost. Thus, the misclassification cost of a false negative is equal to the expected yield loss. False positives result in unneeded alleviation, which results in associated costs without yield gain.
A straightforward method was used to calculate the expected misclassification costs for each candidate PR threshold value. The total expected cost was dependent on the probability of misclassification and the expected cost per misclassification (Equation (2)). The probabilities for false negatives (PFN) and false positives (PFP) were calculated from the 44 confusion matrices by taking the ratios of false negatives and false positives to the total number of sample pairs.
2.11. False Negative Costs
False negative costs (CostFN) were estimated from data on Dutch agricultural yields and estimated percentual revenue loss due to soil compaction. Crop yields and prices for seed potatoes, onions, sugar beets and wheat were obtained in the from the Dutch BINternet-database [82]. From this, the mean national crop revenues (€ ha−1 y−1) over the period from 2010 to 2019 were calculated (Table 3). The used crops were chosen because they are prevalent in the region of the study area. Additionally, they cover a wide range of revenues, allowing us to evaluate the trends for low, medium and high-value crops.
Table 3.
Estimated revenue and revenue loss for four crops that are commonly grown in the study area (calculated using data from: Wageningen Economic Research [82]).
The percentual yield loss was estimated from the literature. Yield losses can range from of 5% to 40% [13,14], depending on the severity of the compaction. Therefore, we estimate that a reasonable yield loss is 10%. This is high enough that farmers will experience effects but low enough that it might not be evident without measurements. It also represents a situation where soil compaction might already be present long-term and alleviation is required. The false negative cost was therefore set at 10% of the mean crop revenue (Table 4). The cost for yield loss was kept the same for all crops.
Table 4.
Yearly false positive and false negative cost, per occurrence of a misclassification.
2.12. False Positive Costs
The costs for a false positive are mainly driven by the costs for alleviation. These costs are difficult to assess accurately, as they depend on the type of alleviation and market dynamics (e.g., cost of fuel, cost of labour, availability of machinery). We focused on the general costs of subsoiling tillage, such as ripping and ploughing, as these are commonly used in the Netherlands. For the Netherlands, we estimated the cost of subsoiling at roughly 105 EUR/ha−1. This value is an average of the estimated costs for ripping and ploughing from De Wolf et al. [83].
Although subsoiling tillage is meant to alleviate soil compaction and its effects, it also leaves the loose soil vulnerable to re-compaction. Studies show that the positive effects of subsoiling in compacted soils are negated after 2–2.5 years [84,85]. This means that it is likely that subsoiling due to a false positive measurement will actually result in soil compaction, provided the soil is used intensively. This re-emergence of soil compaction will likely lead to the re-introduction of yield losses in the years following alleviation. A common approach is to subsoil periodically in order to alleviate re-emerging soil compaction.
The yearly estimated false positive costs were therefore calculated as a combination of the subsoiling tillage costs and the yield losses due to the re-emergence of soil compaction. We assumed that subsoiling would be required every three years, meaning the yearly costs for the subsoiling itself amounted to 35 EUR/ha−1. For the re-emergence of soil compaction, we assumed a linear trend over the course of three years up to the full 10% of yield loss just before periodic subsoiling. This results in a mean expected yearly yield loss of 3.33% as a result of “unnecessary subsoiling”. The total yearly false positive misclassification cost therefore amounted to the subsoiling costs of 35 EUR/ha−1, plus a yearly yield loss of 3.33% of the potential mean crop revenue (Table 4). For example, for seed potatoes, this amounts to 35 + 0.0333 × 10,355 = 380 EUR/ha−1 y−1.
3. Results
3.1. Confusion Matrices
Figure 7 shows the results of the comparison between soil compaction classification using PR and BDd. Whereas a confusion matrix is usually visualised using a table with four quadrants, this figure represents all 44 confusion matrices using a stacked bar plot.

Figure 7.
Visualisation of the confusion matrices for all 44 tested PR threshold values (0.0. to 4.3 MPa). The size of the coloured bars corresponds to the proportion of the samples belonging to the respective category (true positive, true negative, false positive or false negative).
The confusion matrices show a clear difference between different threshold values. At low thresholds, the matrices are dominated by true positives and false negatives. There is a slow decline of true positive cases from 0.4 MPa until 4.2 MPa and a corresponding increase in false negatives. This implies soil compaction was present at PR values ranging from 0.4 MPa to 4.2 MPa, following the comparison to the BDd measurements.
The true negative cases show a similar trend, as they increase in number between 0.5 MPa and 4.1 MPa. False positives decrease in number over this range. However, we see that the rate of change is much higher between 0.5 MPa and 2.0 MPa. This implies that a large proportion of the not-compacted samples have a PR value below 2.0 MPa, with a smaller proportion having higher PR values.
Overall, these data show a logical pattern. As the PR threshold increases, more uncompacted sites are correctly classified (true negatives) at the cost of an increase in misclassified compacted sites (false negatives). There is some data imbalance at the extremes, with close to 20% true positives at 0.0 MPa and over 80% true negatives at 4.3 MPa.
3.2. Accuracy Metrics
Accuracy metrics for all 44 confusion matrices are provided in Figure 7 and Figure 8, and the optima from these figures are summarised in Table 5. The maximum accuracy is 84.1%, which occurs at 3.0 MPa. The accuracy is lowest at low PR thresholds and rises quickly between 0.5 and 1.0 MPa. We see a continued increase from 1.0 to 2.6 MPa, albeit at a slower rate. The peak at 3.0 MPa is part of a relative plateau in accuracy, showing similar performance from 2.6 all the way to 4.3 MPa. At 4.3 MPa, the classification using PR considers all samples to be not compacted.
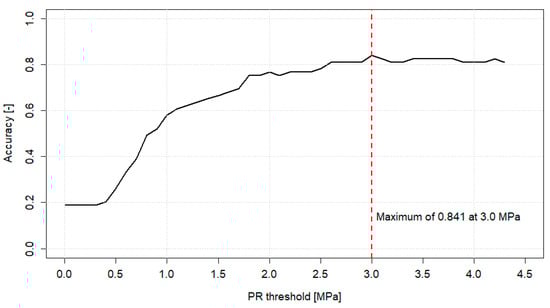
Figure 8.
Accuracy plot, providing the range of candidate thresholds on the x-axis and the accuracy on the y-axis. The red dashed line indicates the location of the maximum attained accuracy.
Table 5.
Summary of the accuracy metrics from Figure 8, showing optima and the corresponding (range of) PR threshold values.
Sensitivity and specificity confirm the observations from the previous paragraph. Sensitivity always decreaseswith higher PR thresholds, whereas specificity always increases. Setting the threshold at zero classifies all samples as compacted, whereas a threshold at 4.3 MPa results in only not-compacted classifications. Sensitivity shows a jagged decrease from 0.5 MPa up to 4.3 MPa, indicating that there are compacted samples in that range. This jagged behaviour is likely due to the small sample size. Specificity rises quickly between 0.4 MPa and 1.0 MPa and continues to rise at a slower rate until 4.2 MPa.
The balanced accuracy provides the optimal point where trade-offs between sensitivity and specificity result in the highest mean accuracy. In Figure 9, the balanced accuracy shows a plateau roughly between 1.0 and 3.0 MPa at around 70% accuracy. The highest balanced accuracy is found at 1.8 and 1.9 MPa, at 76.0%. Sensitivity and specificity are at approximately similar levels, namely 76.9% and 75.0% respectively (Table 5). These results show that there is a relatively wide range in which balanced accuracy is relatively close to the optimum, although the ratio of sensitivity to specificity changes depends on the threshold. The optimum at 1.8 and 1.9 MPa seems to be an unbiased optimum, since both sensitivity and specificity are at similar levels. This is lower than the biased optimum using the unbalanced accuracy. Figure 10 shows a scatter plot of the raw BDd and PR data, classified according to the confusion matrix using the PR threshold of 1.9 MPa.
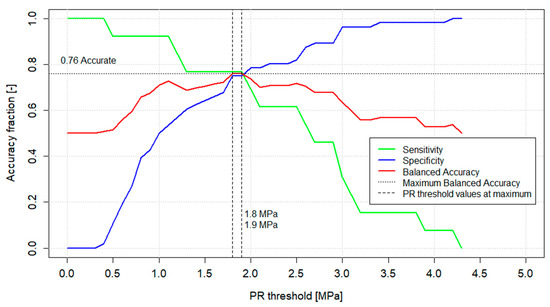
Figure 9.
Sensitivity, specificity and balanced accuracy at all 44 candidate PR thresholds. The y-axis provides the fractional sensitivity, specificity and balanced accuracy. The x-axis provides the range of candidate thresholds.
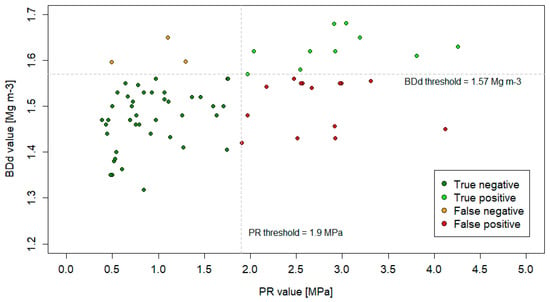
Figure 10.
Scatterplot of the field data, depicting the confusion matrix classifications using a threshold of 1.9 MPa.
3.3. Cost Functions
The expected misclassification costs for seed potatoes, onions, sugar beets and wheat are given in Figure 11 and Table 6. These show that the expected misclassification cost is highest for seed potatoes and lowest for wheat. This is a logical result, as seed potatoes are the more valuable crop. All crops show the same general pattern, with the highest expected misclassification cost at very low PR thresholds. Costs drop with increasing PR thresholds, reaching a minimum at 1.8 and 1.9 MPa for seed potatoes and onions, and at 2.6 MPa for sugar beets and wheat. When the threshold is increased further, the expected costs rise again until the maximum measured PR is reached at 4.3 MPa.
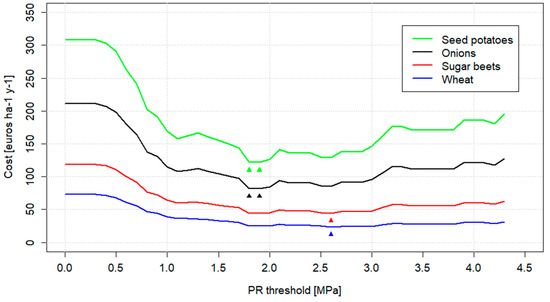
Figure 11.
Misclassification cost for seed potatoes, onions, sugar beets and wheat, using all candidate PR classifications. The arrows indicate the locations of the minimum misclassification cost for each crop. If multiple arrows are present for a crop, the same minimum was found at multiple threshold values.
Table 6.
Summary of misclassification costs from Figure 9, showing optima and values at the extremes.
It is also visible that the cost function flattens for lower revenue crops such as wheat. Where the seed potato cost function still shows a clear dip between 0.5 and 3.0 MPa, wheat shows a relatively flat line from 1.0 MPa onwards. There is still an optimum at 2.6 MPa, but the expected costs do not increase much when the PR threshold is increased again. We also see that the cost near 0.0 MPa, where there are many false positives, is always higher than towards 8.0 MPa, where false negatives dominate.
4. Discussion
4.1. Interpretation of Results
Using a confusion matrix and accuracy metrics can be a simple yet effective way to evaluate the level of agreement between two measurement methods. When we look at the accuracy results in Figure 8 and Table 5, we see a maximum attainable accuracy of 84.1% at 3.0 MPa for the data set used in this study. There also appears to be a plateau of high accuracy extending from roughly 2.5 to 4.3 MPa. The highest attainable accuracy at 3.0 MPa would statistically result in misclassification in around only one out of every nine instances if PR were used instead of BDd. This threshold also fits with the use of PR thresholds in a number of other studies [53,55,57,60,61]. However, these results are misleading due to the effects of data imbalance.
The confusion matrices can be used to provide context for our accuracy results and to illustrate the effects of data imbalance (Figure 7). Ideally, the accuracy of PR classification is always high regardless of whether soil compaction is actually present or not. The comparison to BDd can become unreliable if the accuracy is very high for one class (e.g., compacted) and low for another (e.g., not compacted). The results in Figure 7 show that the plateau of high accuracy from 2.5 to 4.3 MPa is dominated by true negatives and false negatives. True or false positives are virtually absent. In other words, nearly all datapoints are uniformly classified as not compacted using PR, regardless of their BDd classification.
This uniform classification can be problematic and is the main reason for the misleading nature of the accuracy results. It stems from imbalance in the data themselves. Figure 10 shows that over 80% of samples are below the BDd threshold of 1.57 Mg m−3, meaning there is very little soil compaction present in the dataset. In this situation, high accuracy and a high level of agreement between BDd and PR classifications can be achieved simply by labelling all PR samples as not compacted. This results in a dataset of PR classifications that completely misses all samples that were in fact compacted, but these do not carry as much weight since they only make up 20% of the total dataset. This is a cheap and easy way to achieve over 80% accuracy for this specific study area, but it does not provide an informative general assessment of the performance of PR.
The balanced accuracy (Figure 9) provides an estimation of the expected level of agreement, which is more informative as it compensates for data imbalance. The optimum of 76.0% at 1.8 and 1.9 MPa is unbiased, as the sensitivity and specificity are nearly equal to each other. These optimal thresholds are very close to 2.0 MPa—the threshold value that is most commonly used in literature [30,32,34,36,37,38,40,44,46,49,50]. We also see a plateau from 1.0 to 3.0 MPa, where the balanced accuracy is around 70% and close to the optimum. This suggests that deviating slightly from the true optimum does not result in a drastic or quick decrease in balanced accuracy. It also suggests that using either BDd or PR will statistically result in a difference in classification result in just under 3 out of every 10 cases, which can improve to around 1 out of every 4 cases at the optimum.
Figure 9 indicates there is a clear trade-off between sensitivity and specificity. Lower thresholds of PR tend to create better agreement with BDd classifications if locations are compacted, but at the cost of worse agreement in those locations where compaction is absent. Conversely, a higher PR threshold results in better agreement if there is no compaction and worse agreement if there is compaction.
The results from our misclassification cost analysis are in line with those for balanced accuracy, as the optima are located at 1.8, 1.9 and 2.6 MPa (Figure 11). In this analysis, the lower value crops seem to favour a higher optimum PR threshold. The misclassification cost curves also seem to flatten out with a lower crop value. This is likely a result of the ratio between the false positive and false negative costs used in Equation (2). As crop value decreases, the absolute expected yield loss as a result of a false negative also decreases. This is only partly the case for false positive cost, as it always contains a base level of 35 EUR/ha−1 y−1 in subsoiling costs, which does not change. When the misclassification costs converge to the same value, the potential gains of finding the optimal threshold become less pronounced and the curve flattens.
From Figure 11, it quickly becomes evident that the expected misclassification cost of setting the threshold very low (i.e., near 0.0 MPa) is much higher than that of setting it too high (i.e., at 4.3 MPa). This is quite unintuitive when taking into account the misclassification costs in Table 4, which show that the per occurrence cost of a false negative should be more than twice as expensive compared to that of a false positive. Since the costs near 0.0 MPa are mostly due to false positives, one would expect the costs to actually be lower compared to the costs at 4.3 MPa.
Looking at Equation (2), the cause for this must lie in the probabilities obtained from the data. Apparently, the probability of having a false positive is sufficiently larger than that of having a false negative. This is likely a result of the data imbalance shown in Figure 10, which already showed that over 80% of the samples in the dataset lie below the 1.57 Mg m3 BDd threshold. Since BDd is used as the “true” reference, this has an effect on the probability of having soil compaction in the first place. There is a higher a priori probability of “drawing” an uncompacted site simply because there are so many in the dataset. On the other hand, the a priori probability for a compacted site is low because there are so few. The expected costs near 0.0 MPa are so high because the probability of having a misclassification is high, which overpowers the lower costs per occurrence. It is therefore likely a very dataset and study site-specific phenomenon.
It is also possible to illustrate the effect on the farm-level using our results, as farmers usually have multiple hectares of arable land. The average farm size in Flevoland is 50 ha [86]. If farmers and land managers use the PR threshold with the highest level of agreement, they can get the lowest expected misclassification costs. These calculations are indicative only, but they can show the potential effects of picking a suboptimal PR threshold. For seed potatoes, the maximum potential yield is 518,000 EUR, and the optimal expected misclassification costs are 6100 EUR. If PR is used in the least optimal way by setting it close to 0.0 MPa, the misclassification costs could be as high as 15,400 EUR. This is not a logical threshold to use, but it does show the potential for cost savings at the extremes. A more logical example is the use of 1.5 MPa, 2.5 MPa or 3.0 MPa as a threshold, as these are mentioned in scientific literature (Table 1). For a farmer in our study area, these thresholds would result in costs of 6300 EUR, 6500 EUR and 7300 EUR, respectively. This implies that a seed potato farmer in Flevoland can save 200 to 1200 EUR by using the optimal PR threshold value. These savings will reduce with lower yield crops, of course.
4.2. Broader Perspective
Using either BDd or PR to approximate the level of soil compaction is not new, as is evident from Table 1 and the literature cited in the introduction. Attempts have been made to determine the relation of the measurements themselves to each other, with varying results [66,67,68,69]. Our research did not aim to repeat these studies, focusing more on classifications rather than the numerical values of the measurements themselves. It also aimed to acknowledge the fact that both methods are often used in isolation, where the outcome can sometimes depend partially on the used method rather than the actual state of the soil.
It is cheaper and quicker to use a Penetrologger to measure the soil strength (PR) and derive the state of soil compaction from that rather than measuring the density (BDd). The results for our study show that in the most optimal scenario, nearly one in five measurements is likely classified differently if PR is used instead of BDd. This can lead to noticeable differences between results of both methods. Because PR is cheaper and quicker, it can allow for more measurements to be conducted within the same time frame, including duplicate measurements. This could allow farmers and other land managers to have a better spread of measurements over fields, at the cost of having a proportion of misclassifications compared to BDd. Therefore, there may be a trade-off between accuracy, cost and practical usability.
PR is often used to approximate soil compaction, as is evident from Table 1. These thresholds can be assessed within the context of the results from our study, as any of them could be chosen by the owner of the field in our study area. As previously mentioned, the optimum level of agreement that we found is very close to the most commonly used PR threshold of 2.0 MPa (Table 1). We also see that nearly all of the studies from Table 1 use thresholds that are within our plateau of good agreement between PR and BDd, with 4.2 MPa by Stock et al. [54] being the only exception. This means that many of the thresholds in literature would have resulted in a level of agreement that was very close to the optimum. Interestingly, thresholds between 1.0 and 2.0 MPa would still have performed reasonably well in our study area but were not found in the literature.
In this research, we used PR to make a classification into two categories: compacted and not compacted. This is the most commonly used method in the literature, and it matches the way in which BDd classifications are made. However, some studies also use a non-binary system [55,57,60,61]. In such a system, there are also intermediate classes such as “lightly compacted” or “moderately compacted”. This is also the preferred method for the use of PR in some Dutch studies [87], who consider the range of 2.0 MPa to 3.0 MPa to be “somewhat compacted”. We were unable to directly assess this non-binary method, as it was incompatible with the binary BDd classification. It is notable that this system of intermediate classes does overlap with our plateau of high balanced accuracy (Figure 9). We also think that using more than two classes might approximate the true state of the soil better, as soil properties can also change gradually.
It is possible that using more than two classes may result in lower expected misclassification costs, as it allows farmers to tailor their soil management more towards the gradual nature of soil properties. This can mean doing only light remediation on lightly compacted areas, such as less intensive tillage and using more deep-rooting crops. Disruptive and expensive land management options are then only used on heavily compacted areas. This may reduce the added management cost on light soil compaction and therefore also the expected misclassification cost for those areas. The effect of this depends on the exact difference in costs for soil management, an extensive investigation of which was beyond the scope of this study. The results from this study are therefore representative for a situation in which “binary” land management takes place—either there is full alleviation, or no alleviation.
Our analyses were done on the point measurement-level. However, farmers and other land managers will realistically make management decisions for larger areas of land such as individual fields. This requires a translation from point measurements to areas and subsequently to management. The advent of precision and smart farming aims to facilitate in this decision-making process, but technical and social hurdles still exist that inhibit its full use [88,89]. This means that the gap between point measurements and management policy for a field needs to be bridged by the farmers or land managers themselves. This is often done based on experience, personal conviction, advice from experts, practical considerations and many other factors [90]. Some farmers may also decide to specify management for sections of a field, where others apply do not make this within-field distinction. As a result, the way in which measurements are used is likely to be highly personal and variable. The results presented in this study can therefore be used to provide guidelines and insight for the measurements themselves but become more uncertain when the spatial heterogeneity needs to be taken into account.
4.3. Limitations and Future Research
The results in this study were obtained at our study area in Flevoland, the Netherlands. It must be stressed that these specific results are likely to be strongly tied to the conditions in the study area. The concept of misclassification and associated costs is likely to also have an effect in other locations, but the attainable level of agreement and relevant PR threshold range may deviate from those found in this study. There is likely to be an influence of soil texture, which can contribute to the location-specific nature of the relationship between BDd and PR. This influence is hinted to in studies where pedotransfer functions are used to describe the relationship between BDd and PR, which include clay or sand content as a covariate [66,67]. Bengough and Mullins [28] also hint at a combined soil moisture and texture effect. This is especially relevant taking into account the approach in this study, where soil texture and clay content were estimated from a single auger site and both horizontal and vertical heterogeneity were not taken into account. It is possible to include data on soil texture heterogeneity and determine its effects on the BDd threshold. However, doing so would introduce data that farmers and other land managers will not always have. Using simplifications that are in line with common practices therefore strengthened the practical usability of this research. Future research should be used to verify the results from our study in similar soils. Studies on different soils can be used to determine the effect of differences in soil texture on the level of agreement and relevant PR thresholds.
We also mentioned that data imbalance has an effect on the (general) accuracy and the expected misclassification cost. Studies have shown that roughly half of the arable land in the Netherlands is at risk of being compacted and that this risk depends on soil type [16,91]. A follow-up study by Brus and Van den Akker [15] indicates that 43% of the country is actually likely to be compacted, although the data density in Flevoland is low. Fields in low-risk areas may have a strong data imbalance towards uncompacted sites, whereas fields in high-risk areas might show a dominance of compacted sites. Due to the nature of using a single case study, we could not explore the effects of all possible data compositions.
It is possible to hypothesize what the effects of data imbalance and composition may be. We expect that the balanced accuracy is least affected, as it is designed to compensate for imbalance. The general accuracy is sensitive to data imbalance, but its effects can easily be assessed by comparing it to the balanced accuracy. We expect that the misclassification costs are also strongly affected, as it tends to assign a higher expected cost to the more probable class. It is possible to analyse these effects by artificially creating different data balances, either through resampling of the data or modification of the cost function. Our small dataset size prevented us from doing this analysis, as it would be too prone to overfitting. The robustness of our methods and results can also be assessed by performing multiple other case studies, which should naturally have different data balances, soil types and local conditions. We recommend that these case-studies are done in future research.
Finally, a critical reflection on the underlying assumptions for the analysis is also required. In order to determine the expected misclassification costs, we implicitly assumed that the BDd thresholds are directly linked to yield loss and that these thresholds are well-defined. Under that assumption, yield loss would always occur if the BDd were above the calculated threshold and never if it were below the threshold. This is a very practical assumption, but it is likely not fully true. The BDd threshold is sensitive to clay content, meaning it depends on the accuracy of the soil texture estimation or measurement. Soil compaction is also related to soil properties which are not captured in BDd, such as pore connectivity and pore size distribution. It is a gradual phenomenon, meaning that soil compaction and its negative effects do not instantly occur at a certain threshold. This is not captured in a single threshold, as it assumes a clearly definable division between classes. More research into the possibility of using a gradual system of thresholds is therefore needed.
Similar assumptions were made for yield losses and crop value, for which we provide set values from the literature. In reality, yield losses can vary from roughly 5% to 40% depending on the level of soil compaction and the crops being grown [14]. Crop value changes based on location, time and other market dynamics. These two factors can have an effect on the misclassification function and may lead to a shift of the optima. We strongly recommend research and an evaluation of the effects of these assumptions.
5. Conclusions
The analysis in this research shows that, in our study area, classifications of soil compaction on the same soil using BDd and PR result in a maximum level of agreement of 76%. This effectively means that around one in every four classifications differs between both methods. In a wider range of thresholds from 1.0 to 3.0 MPa, the level of agreement lies around 70%. Most thresholds from the literature are found in this range and would therefore have led to just under one misclassification in every three classifications, which is very close to the optimum.
If the farmer or land manager in the study area for this research opts for measurements using Penetrologgers instead of soil cores, they can expect between around one in four or five of the performed measurements to provide a different classification. This is a substantial number, which shows that choosing a measurement tool can have implications for a soil survey and the subsequent management. The added advantage of being able to conduct more measurements and add duplicate measurements was not investigated, but may theoretically compensate slightly for the misclassification chance.
The effects of misclassification on the expected cost to a farmer show a clear relation to the level of agreement, as the expected cost is lower in the range of 1.0 to 3.0 MPa. There is a clear effect of crop value on the cost function, showing that lower value crops such as wheat and sugar beets are less sensitive to the exact PR threshold if the aim is to keep costs low. Higher value crops such as potatoes and onions do show a clearer effect of deviations in the threshold.
These results are sensitive to data imbalance and are therefore very study area-specific. In order to create a more general overview of the level of agreement between BDd and PR-based classifications of soil compaction, a larger number of study sites in a wider range of soil types and compositions should be investigated. We also hypothesise that there are many ways in which a farmer or land manager can improve the accuracy of soil compaction classification using PR. This includes sampling to have sufficient data, capturing the spatial soil compaction patterns and tailoring soil management to those patterns and using additional information from observations and experience to evaluate PR measurements.
Author Contributions
Conceptualisation, T.L.V.O., V.L.M., J.M.S. and G.B.M.H.; methodology, T.L.V.O., V.L.M., J.M.S., E.A.V.E. and G.B.M.H.; software, T.L.V.O.; validation, T.L.V.O.; formal analysis, T.L.V.O.; investigation, T.L.V.O. and K.H.J.P.; resources, T.L.V.O., G.B.M.H., K.H.J.P. and G.J.V.O.; data curation, T.L.V.O.; writing—original draft preparation, T.L.V.O.; writing—reviewing and editing, T.L.V.O., V.L.M., J.M.S., G.J.V.O., E.A.V.E., K.H.J.P. and G.B.M.H.; visualization, T.L.V.O.; supervision, V.L.M., J.M.S., G.J.V.O. and G.B.M.H.; project administration, K.H.J.P.; funding acquisition, G.J.V.O. All authors have read and agreed to the published version of the manuscript.
Funding
This research and the APC were funded by Taskforce for Applied Research (SIA), a subsidiary of the Dutch Research Council (NWO), grant number RAAK.PRO02.021, and by the Province of Flevoland.
Data Availability Statement
Data is available on request from the authors. Any personal information will be anonymized in accordance with Dutch privacy regulations.
Acknowledgments
We want to acknowledge the contributions of Ferry Tigchelhoff, Martijn de Ruiter, and Robert Schierholz during data collection. Secondly, we thank Martin Duijkers and Ellen Kocks-Winterswijk for advice on laboratory analyses and Fenny van Egmond for her help and critical reflection during the project. Finally, we thank Silke Ceulemans for her work with the geophysical data used to run the conditioned Latin hypercube.
Conflicts of Interest
The authors declare no conflict of interest.
References
- Hartemink, A.E. Soils are back on the global agenda. Soil Use Manag. 2008, 24, 327–330. [Google Scholar] [CrossRef]
- Schjønning, P.; van den Akker, H.J.J.; Keller, T.; Greve, H.M.; Lamandé, M.; Simojoki, A.; Stettler, M.; Arvidsson, J.; Breuning-Madsen, H. Soil compaction. In Soil Threats in Europe—Status, Methods, Drivers and Effects on Ecosystem Services; Stolte, J., Tesfai, M., Øygarden, L., Kværnø, S., Keizer, J., Verheijen, F., Panagos, P., Ballabio, C., Hessel, R., Eds.; EUR 27607 EN; Publications Office of the European Union: Luxembourg, 2016; pp. 69–78. [Google Scholar] [CrossRef]
- Van-Camp, L.; Bujarrabal, B.; Gentile, A.R.; Jones, R.J.A.; Montanarella, L.; Olazabal, C.; Selvaradjou, S.-K. Reports of the Technical Working Groups Established under the Thematic Strategy for Soil Protection; EUR 21319 EN/5; Office for the official Publications of the European Communities: Luxembourg, 2004; p. 8722. Available online: https://ec.europa.eu/environment/archives/soil/pdf/vol5.pdf (accessed on 28 June 2018).
- Batey, T.; McKenzie, D.C. Soil compaction: Identification directly in the field. Soil Use Manag. 2006, 22, 123–131. [Google Scholar] [CrossRef]
- Batey, T. Soil compaction and soil management—A review. Soil Use Manag. 2009, 25, 335–345. [Google Scholar] [CrossRef]
- Ellis, S.; Atherton, J.K. Properties and development of soils on reclaimed alluvial sediments of the Humber estuary, eastern England. Catena 2003, 52, 129–147. [Google Scholar] [CrossRef]
- Soane, B.D.H.; Van Ouwerkerk, C. Soil Compaction in Crop Production. In Engineering, Developments in Agricultural 11; Soane, B.D., van Ouwerkerk, C., Eds.; Elsevier: Amsterdam, The Netherlands, 1994. [Google Scholar]
- Birkás, M.; Szemök, A.; Antos, G.; Neményi, M. Environmentally Sound Adaptable Tillage; Akadémiai Kiadó: Budapest, Hungary, 2008; ISBN 9789630586313. [Google Scholar]
- Douglas, J.T.; Koppi, A.J.; Crawford, C.E. Structural improvement in a grassland soil after changes to wheel-traffic systems to avoid soil compaction. Soil Use Manag. 1998, 14, 14–18. [Google Scholar] [CrossRef]
- Horton, R.; Ankeny, M.D.; Allmaras, R.R. Effects of Compaction on Soil Hydraulic Properties. In Soil Compaction in Crop Production; Soane, B.D., Van Ouwerkerk, C., Eds.; Elsevier: Amsterdam, The Netherlands, 1994; pp. 141–165. [Google Scholar] [CrossRef]
- Lipiec, J.; Stępniewski, W. Effects of soil compaction and tillage systems on uptake and losses of nutrients. Soil Tillage Res. 1995, 35, 37–52. [Google Scholar] [CrossRef]
- Mooney, S.J.; Nipattasuk, W. Quantification of the effects of soil compaction on water flow using dye tracers and image analysis. Soil Use Manag. 2003, 19, 356–363. [Google Scholar] [CrossRef]
- Massah, J.; Azadegan, B. Effect of chemical fertilizers on soil compaction and degradation. AMA Agric. Mech. Asia Afr. Lat. Am. 2016, 47, 44–50. [Google Scholar]
- Arvidsson, J.; Håkansson, I. Do effects of soil compaction persist after ploughing? Results from 21 long-term field experiments in Sweden. Soil Tillage Res. 1996, 39, 175–197. [Google Scholar] [CrossRef]
- Brus, D.J.; Van den Akker, J.J.H. How serious a problem is subsoil compaction in the Netherlands? A survey based on probability sampling. Soil 2018, 4, 37–45. [Google Scholar] [CrossRef] [Green Version]
- Van den Akker, J.J.H.; Hoogland, T. Comparison of risk assessment methods to determine the subsoil compaction risk of agricultural soils in The Netherlands. Soil Tillage Res. 2011, 114, 146–154. [Google Scholar] [CrossRef]
- Vermeulen, G.D.; Verwijs, B.R.; Van den Akker, J.J.H. Vergelijking van de Bodembelasting bij Agrarisch Veldwerk in 1980 en 2010; Comparison of the soil Stress during Agricultural Field Activities in 1980 and 2010; Report 501; Plant Research International: Wageningen, The Netherlands, 2013; Available online: https://edepot.wur.nl/258660 (accessed on 16 May 2022).
- Arvidsson, J. Subsoil compaction caused by heavy sugarbeet harvesters in southern Sweden: I. Soil physical properties and crop yield in six field experiments. Soil Tillage Res. 2001, 60, 67–78. [Google Scholar] [CrossRef]
- Håkansson, I.; Lipiec, J. A review of the usefulness of relative bulk density values in studies of soil structure and compaction. Soil Tillage Res. 2000, 53, 71–85. [Google Scholar] [CrossRef]
- Suzuki, L.E.A.S.; Reichert, J.M.; Reinert, D.J. Degree of compactness, soil physical properties and yield of soybean in six soils under no-tillage. Soil Res. 2013, 51, 311–321. [Google Scholar] [CrossRef]
- Van den Akker, J.J.H.; De Groot, W.J.M. Een Inventariserend Onderzoek Naar Ondergrondverdichting van Zandgronden en Lichte zavels; An Inventory Study into Soil Compaction of Sandy and Loamy Soils; Alterra-Report 1450; Alterra: Wageningen, The Netherlands, 2008; Available online: https://www.wur.nl/nl/Publicatie-details.htm?publicationId=publication-way-333637313733 (accessed on 28 June 2018).
- Huber, S.; Prokop, G.; Arrouays, D.; Banko, G.; Bispo, A.; Jones, R.J.A.; Kibblewhite, M.G.; Lexer, W.; Möller, A.; Rickson, R.J.; et al. Environmental Assessment of Soil for Monitoring Volume I: Indicators & Criteria. EUR 23490 EN/1; Office for the Official Publications of the European Communities: Luxembourg, 2008; p. 339. [Google Scholar] [CrossRef]
- Jones, R.J.A.; Spoor, G.; Thomasson, A.J. Vulnerability of subsoils in Europe to compaction: A preliminary analysis. Soil Tillage Res. 2003, 73, 131–143. [Google Scholar] [CrossRef] [Green Version]
- Renger, M. Uber den Einfluβ der Dränung auf das Gefüge und die Wasserdurchlässigkeit bindiger Böden [On the influence of drainage on the structure and water permeability of cohesive soils]. Mitt. Der Dtsch. Bodenkd. Ges. 1970, 11, 23–28. [Google Scholar]
- International Organization for Standardization. ISO 11272:2017. 2017. Available online: https://www.iso.org/standard/68255.html (accessed on 16 July 2021).
- Netherlands Standardisation Institute. NEN-EN-ISO 11272: Soil Quality—Determination of Dry Bulk Density. 2017. Available online: https://www.nen.nl/en/nen-en-iso-11272-2017-en-232321 (accessed on 19 July 2021).
- Wageningen Environmental Research. Bodemkundig Informatiesysteem (English: Soil Information System). 2021. Available online: http://maps.bodemdata.nl/bodemdatanl/index.jsp (accessed on 27 July 2021).
- Bengough, A.G.; Mullins, C.E. Mechanical impedance to root growth: A review of experimental techniques and root growth responses. J. Soil Sci. 1990, 41, 341–358. [Google Scholar] [CrossRef]
- Taylor, H.M.; Roberson, G.M.; Parker, J.J. Soil strength-root penetration relations to coarse-textured materials. Soil Sci. 1966, 102, 18–22. [Google Scholar] [CrossRef]
- Agostini, A.M.; Studdert, A.G.; San Martino, S.; Costa, L.J.; Balbuena, H.R. Crop residue grazing and tillage systems effects on soil physical properties and corn (Zea mays L.) performance. J. Soil Sci. Plant Nutr. 2012, 12, 271–282. [Google Scholar] [CrossRef] [Green Version]
- Gupta, S.C.; Allmaras, R.R. Models to Assess the Susceptibility of Soils to Excessive Compaction. In Advances in Soil Science; Stewart, B.A., Ed.; Springer: New York, NY, USA, 1987; Volume 6, pp. 65–100. [Google Scholar] [CrossRef]
- De Lima, R.P.; Tormena, C.A.; Figueiredo, G.C.; Anderson, R.; Rolim, M.M. Least limiting water and matric potential ranges of agricultural soils with calculated physical restriction thresholds. Agric. Water Manag. 2020, 240, 106299. [Google Scholar] [CrossRef]
- Da Silva, A.P.; Kay, B.D.; Perfect, E. Characterization of the Least Limiting Water Range of Soils. Soil Sci. Soc. Am. J. 1994, 58, 1775–1781. [Google Scholar] [CrossRef]
- Fabrizzi, K.P.; García, F.O.; Costa, J.L.; Picone, L.I. Soil water dynamics, physical properties and corn and wheat responses to minimum and no-tillage systems in the southern Pampas of Argentina. Soil Tillage Res. 2005, 81, 57–69. [Google Scholar] [CrossRef]
- Hamblin, A.P. The influence of soil structure on water movement, crop root growth, and water uptake. Adv. Agron. 1985, 38, 95–158. [Google Scholar] [CrossRef]
- Fernández, P.L.; Alvarez, C.R.; Taboada, M.A. Assessment of topsoil properties in integrated crop-livestock and continuous cropping systems under zero tillage. Soil Res. 2011, 49, 143–151. [Google Scholar] [CrossRef]
- Hernandez-Ramirez, G.; Lawrence-Smith, E.J.; Sinton, S.M.; Schwen, A.; Brown, H.E. Root Responses to Alterations in Macroporosity and Penetrability in a Silt Loam Soil. Soil Water Manag. Conserv. 2014, 78, 1392–1403. [Google Scholar] [CrossRef]
- Lapen, D.R.; Topp, G.C.; Gregorich, E.G.; Curnoe, W.E. Least limiting water range indicators of soil quality and corn production, eastern Ontario, Canada. Soil Tillage Res. 2004, 78, 151–170. [Google Scholar] [CrossRef]
- Greacen, E.L. Root response to soil mechanical properties. In Proceedings of the Transactions of the 13th Congress of International Society of Soil Science, Hamburg, Germany, 13–20 August 1986; Volume 5, pp. 20–47. [Google Scholar]
- Martins, R.N.; Fagundes Portes, M.; Fialho e Moraes, H.M.; Ribeiro Furtado Junior, M.; Fim Rosas, J.T.; Orlando Junior, W.D.A. Influence of tillage systems on soil physical properties, spectral response and yield of the bean crop. Remote Sens. Appl. Soc. Environ. 2021, 22, 100517. [Google Scholar] [CrossRef]
- Barbosa, L.C.; Magalhães, P.S.G.; Bordonal, R.O.; Cherubin, M.R.; Castioni, G.A.F.; Tenelli, S.; Franco, H.C.J.; Carvalho, J.L.N. Soil physical quality associated with tillage practices during sugarcane planting in south-central Brazil. Soil Tillage Res. 2019, 195, 104383. [Google Scholar] [CrossRef]
- Otto, R.; Silva, A.P.; Franco, H.C.J.; Oliveira, E.C.A.; Trivelin, P.C.O. High soil penetration resistance reduces sugarcane root system development. Soil Tillage Res. 2011, 117, 201–210. [Google Scholar] [CrossRef]
- Salem, H.M.; Valero, C.; Muñoz, M.Á.; Rodríguez, M.G.; Silva, L.L. Short term effects of four tillage practices on soil physical properties, soil water potential, and maize yield. Geoderma 2015, 237–238, 60–70. [Google Scholar] [CrossRef] [Green Version]
- Özgöz, E.; Günal, H.; Hüseyin, Ö.; Bayram, M.; Acir, N. Effect of Management on Spatial and Temporal Distribution of Soil Physical Properties. J. Agric. Sci. 2012, 18, 77–91. [Google Scholar] [CrossRef]
- Zaman, Q. Planning variable tillage practices based on spatial variation in soil physical conditions and crop yield using DGPS/GIS. Agric. Mech. Asia Afr. Lat. Am. 2002, 33, 41–44. [Google Scholar]
- Tebebu, T.Y.; Bayabil, H.K.; Stoof, C.R.; Giri, S.K.; Gessess, A.A.; Tilahun, S.A.; Steenhuis, T.S. Characterization of Degraded Soils in the Humid Ethiopian Highlands. Land Degrad. Dev. 2017, 28, 1891–1901. [Google Scholar] [CrossRef] [Green Version]
- Hamza, M.A.; Anderson, W.K. Soil compaction in cropping systems: A review of the nature, causes and possible solutions. Soil Tillage Res. 2005, 82, 121–145. [Google Scholar] [CrossRef]
- Taylor, H.M.; Gardner, H.R. Penetration of cotton seedling taproots as influenced by bulk density, moisture content, and strength of soil. Soil Sci. 1963, 96, 153–156. [Google Scholar] [CrossRef]
- Van Leeuwen, M.M.W.J.; Heuvelink, G.B.M.; Wallinga, J.; De Boer, I.J.M.; Van Dam, J.C.; Van Essen, E.A.; Moolenaar, S.W.; Verhoeven, F.P.M.; Stoorvogel, J.J.; Stoof, C.R. Visual soil evaluation: Reproducibility and correlation with standard measurements. Soil Tillage Res. 2018, 178, 167–178. [Google Scholar] [CrossRef]
- Wilson, M.G.; Sasal, M.C.; Caviglia, O.P. Critical bulk density for a Mollisol and a Vertisol using least limiting water range: Effect on early wheat growth. Geoderma 2013, 192, 354–361. [Google Scholar] [CrossRef]
- Wilson, M.G.; Paparotti, O.; Paz Gonzalez, A.; Díaz Ucha, E. Ecuaciones de ajuste entre la Resistencia Mecánica a la Penetración y el contenido hídrico en un lote en siembra directa. In Proceedings of the XX Congreso Argentino de la Ciencia del Suelo, Salta, Argentina, 19–22 September 2006. [Google Scholar]
- Alvarez, R.; Steinbach, H.S. A review of the effects of tillage systems on some soil physical properties, water content, nitrate availability and crops yield in the Argentine Pampas. Soil Tillage Res. 2009, 104, 1–15. [Google Scholar] [CrossRef]
- Coelho, M.B.; Mateos, L.; Villalobos, F.J. Influence of a compacted loam subsoil layer on growth and yield of irrigated cotton in Southern Spain. Soil Tillage Res. 2000, 57, 129–142. [Google Scholar] [CrossRef]
- Stock, O.; Bens, O.; Hüttl, R.F. The interrelationship between the cultivation of crops and soil-strength dynamics. J. Plant Nutr. Soil Sci. 2007, 170, 713–721. [Google Scholar] [CrossRef]
- Laboski, C.A.M.; Dowdy, R.H.; Allmaras, R.R.; Lamb, J.A. Soil strength and water content influences on corn root distribution in a sandy soil. Plant Soil 1998, 203, 239–247. Available online: http://www.jstor.org/stable/42949872 (accessed on 16 May 2022).
- Boone, F.R.; Nam der Werf, H.M.G.; Kroesbergen, B.; Ten Hag, B.A.; Boers, A. The effect of compaction of the arable layer in sandy soils on the growth of maize for silage. 1. Critical matric water potentials in relation to soil aeration and mechanical impedance. Neth. J. Agric. Sci. 1986, 34, 155–171. [Google Scholar] [CrossRef]
- Çelik, İ.; Günal, H.; Acar, M.; Acir, N.; Bereket, Z.; Budak, M. Strategic tillage may sustain the benefits of long-term no-till in a Vertisol under Mediterranean climate. Soil Tillage Res. 2019, 185, 17–28. [Google Scholar] [CrossRef]
- Bengough, A.G.; Bransby, M.F.; Hans, J.; McKenna, S.J.; Roberts, T.J.; Valentine, T.A. Root responses to soil physical conditions; growth dynamics from field to cell. J. Exp. Bot. 2005, 57, 437–447. [Google Scholar] [CrossRef] [Green Version]
- De Moraes Sá, J.C.; Tivet, F.; Lal, R.; Briedis, C.; Hartman, D.C.; dos Santos, J.Z.; dos Santos, J.B. Long-term tillage systems impacts on soil C dynamics, soil resilience and agronomic productivity of a Brazilian Oxisol. Soil Tillage Res. 2014, 136, 38–50. [Google Scholar] [CrossRef]
- Müller, M.M.L.; Tormena, C.A.; Genú, A.M.; Kramer, L.F.M.; Michalovicz, L.; Caires, E.F. Structural Quality of a No-Tillage Red Latosol 50 Months After Gypsum Aplication. Rev. Bras. Cienc. Solo 2012, 36, 1005–1013. [Google Scholar] [CrossRef]
- Tekeste, M.; Habtzghi, D.H.; Stroosnijder, L. Soil strength assessment using threshold probability approach on soils from three agro-ecological zones in Eritrea. Biosyst. Eng. 2007, 98, 470–478. [Google Scholar] [CrossRef]
- Bradfort, J.M. Penetrability. In Methods of Soil Analysis-Part 1: Physical and Mineralogical Methods, 2nd ed.; Klute, A., Ed.; American Society of Agronomy: Madison, WI, USA, 1986; pp. 463–478. [Google Scholar] [CrossRef]
- Barik, K.; Aksakal, E.L.; Islam, K.R.; Sari, S.; Angin, I. Spatial variability in soil compaction properties associated with field traffic operations. Catena 2014, 120, 122–133. [Google Scholar] [CrossRef]
- Kumar, A.; Chen, Y.; Sadek, A.; Rahman, S. Soil cone index in relation to soil texture, moisture content, and bulk density for no-tillage and conventional tillage. Agric. Eng. Int. CIGR J. 2012, 14, 26–37. [Google Scholar]
- Carrara, M.; Castrignanò, A.; Comparetti, A.; Febo, P.; Orlando, S. Mapping of penetrometer resistance in relation to tractor traffic using multivariate Geostatistics. Geoderma 2007, 142, 294–307. [Google Scholar] [CrossRef] [Green Version]
- Perdok, U.D.; Kroesbergen, B.; Hoogmoed, W.B. Possibilities for modelling the effect of compression on mechanical and physical properties of various Dutch soil types. Soil Tillage Res. 2002, 65, 61–75. [Google Scholar] [CrossRef]
- Vaz, C.M.P.; Manieri, J.M.; de Maria, I.C.; Tuller, M. Modeling and correction of soil penetration resistance for varying soil water content. Geoderma 2011, 166, 92–101. [Google Scholar] [CrossRef]
- Da Silva, W.M.; Bianchini, A.; Da Cunha, C.A. Modeling and correction of soil penetration resistance for variations in soil moisture and soil bulk density. J. Braz. Assoc. Agric. Eng. 2016, 36, 449–459. [Google Scholar] [CrossRef] [Green Version]
- Hernanz, J.L.; Peixoto, H.; Cerisola, C.; Sánchez-Girón, V. An empirical model to predict soil bulk density profiles in field conditions using penetration resistance, moisture content and soil depth. J. Terramech. 2000, 37, 167–184. [Google Scholar] [CrossRef]
- Van den Biggelaar, D.F.A.M. New Land, Old History: Past Landscapes and Hominin Activity Covering the Last 220,000 Years in Flevoland, The Netherlands [Vrije Universiteit Amsterdam]. 2017. Available online: https://research.vu.nl/en/publications/new-land-old-history-past-landscapes-and-hominin-activity-coverin (accessed on 16 May 2022).
- IUSS Working Group WRB. World Reference Base for Soil Resources 2014, Update 2015, International Soil Classification System for Naming Soils and Creating Legends for Soil Maps; World Soil Resources Reports 2015, No. 106; FAO: Rome, Italy, 2015. [Google Scholar]
- Minasny, B.; McBratney, A.B.A. conditioned Latin hypercube method for sampling in the presence of ancillary information. Comput. Geosci. 2006, 32, 1378–1388. [Google Scholar] [CrossRef]
- Walvoort, D.J.J.; Brus, D.J.; De Gruijter, J.J. An R package for spatial coverage sampling and random sampling from compact geographical strata by k means. Comput. Geosci. 2010, 36, 1261–1267. [Google Scholar] [CrossRef]
- Royal Eijkelkamp. Penetrologger—User Manual, (41 pp.). 2021. Available online: https://www.eijkelkamp.com/download.php?file=M0615SAe_Penetrologger_bd1b.pdf (accessed on 27 July 2021).
- Soil Survey Staff. Kellogg Soil Survey Laboratory Methods Manual. Soil Survey Investigations Report No. 42, Version 5.0. 2014. Available online: https://www.nrcs.usda.gov/wps/portal/nrcs/detail/soils/ref/?cid=nrcs142p2_054247 (accessed on 12 July 2021).
- Royal Eijkelkamp, Delta-T Devices Ltd. User Manual for the WET Sensor. 2018, p. 42. Available online: https://www.eijkelkamp.com/download.php?file=M1933e_Wet_sensor_b18b.pdf (accessed on 27 July 2021).
- Mome Filho, E.A.; Da Silva, A.P.; Figueiredo, G.C.; Gimenes, F.H.S.; Vitti, A.C. Compared performance of penetrometers and effect of soil water content on penetration resistance measurements. Rev. Bras. Ciência Solo 2014, 38, 744–754. [Google Scholar] [CrossRef]
- R Core Team. R: A Language and Environment for Statistical Computing. R Foundation for Statistical Computing. 2021. Available online: https://www.r-project.org/ (accessed on 12 November 2021).
- Wand, M.P.; Jones, M.C. Kernel Smoothing; CRC Press: Boca Raton, FL, USA, 1995; ISBN 0-412-55270-1. [Google Scholar]
- Wand, M.P.; Jones, M.C. KernSmooth: Functions for Kernel Smoothing (and Density Estimation). R-Package Version 2.23-20. 2021. Available online: https://cran.r-project.org/web/packages/KernSmooth/index.html (accessed on 27 July 2021).
- Tharwat, A. Classification assessment methods. Appl. Comput. Inform. 2021, 17, 168–192. [Google Scholar] [CrossRef]
- Wageningen Economic Research. BINternet Database. 2022. Available online: https://www.agrofoodportal.com/Binternet.aspx?ID=20&Lang=1 (accessed on 3 August 2021).
- De Wolf, P.; Dawson, A.; Klompe, K. Kosten En Baten Van Bodemmaatregelen: Grondbewerking, Organische Stofaanvoer En Tagetes Patula Als Aaltjesvanggewas; Cost and Benefit of Soil Management: Tillage, Supply of Organic Matter, and Tagetes Patula as Nematode Cover Crop; Report 2019, WPR-819; Wageningen Research, Wageningen Plant Research: Wageningen, The Netherlands, 2019. [Google Scholar] [CrossRef]
- Botta, G.F.; Jorajuria, D.; Balbuena, R.; Ressia, M.; Ferrero, C.; Rosatto, H.; Tourn, M. Deep tillage and traffic effects on subsoil compaction and sunflower (Helianthus annus L.) yields. Soil Tillage Res. 2006, 91, 164–172. [Google Scholar] [CrossRef]
- Drewry, J.J.A.; Paton, R.J.A.; Monaghan, R.M.A. Soil compaction and recovery cycle on a Southland dairy farm: Implications for soil monitoring. Aust. J. Soil Res. 2004, 42, 851–856. [Google Scholar] [CrossRef]
- CBS Statistics Netherlands. Aantal Boerderijen in Flevoland Daalt Minder Snel dan Elders [Number of Farms Decreasing More Slowly in Flevoland than Elsewhere]. Available online: https://www.cbs.nl/nl-nl/nieuws/2015/53/aantalboerderijen-in-flevoland-daalt-minder-snel-dan-elders (accessed on 10 November 2021).
- Tol-Leenders, D.; Knotters, M.; De Groot, W.; Gerritsen, P.; Reijneveld, A.; Van Egmond, F.; Wösten, H.; Kuikman, P. Koolstofvoorraad in de Bodem van Nederland (1998–2018): CC-NL; Carbon Stock in the Soil of the Netherlands (1998–2018): CC-NL; Report 2974; Wageningen Environmental Research: Wageningen, The Netherlands, 2018. [Google Scholar] [CrossRef] [Green Version]
- Klerkx, L.; Jakku, E.; Labarthe, P. A review of social science on digital agriculture, smart farming and agriculture 4.0: New contributions and a future research agenda. NJAS—Wagening J. Life Sci. 2019, 90–91, 100315. [Google Scholar] [CrossRef]
- Wolfert, S.; Ge, L.; Verdouw, C.; Bogaardt, M.J. Big Data in Smart Farming—A review. Agric. Syst. 2017, 153, 69–80. [Google Scholar] [CrossRef]
- Daydé, C.; Couture, S.; Garcia, F.; Martin-Clouaire, R. Investigating operational decision-making in agriculture. In Proceedings of the 7th Congress on Environmental Modelling and Software (IEMSS 2014), San Diego, CA, USA, 15–19 June 2014; Available online: https://hal.inrae.fr/hal-02739614/document (accessed on 16 May 2022).
- Van den Akker, J.J.H.; De Vries, F.; Vermeulen, G.D.; Hack-ten Broeke, M.J.D.; Schouten, T. Risico op Ondergrondverdichting in Het Landelijk Gebied in Kaart; Map of the Risk of Subsoil Compaction in the Rural Areas; Alterra-report 2409; Alterra: Wageningen, The Netherlands, 2013; Available online: https://research.wur.nl/en/publications/risico-op-ondergrondverdichting-in-het-landelijk-gebied-kaart (accessed on 28 June 2018).

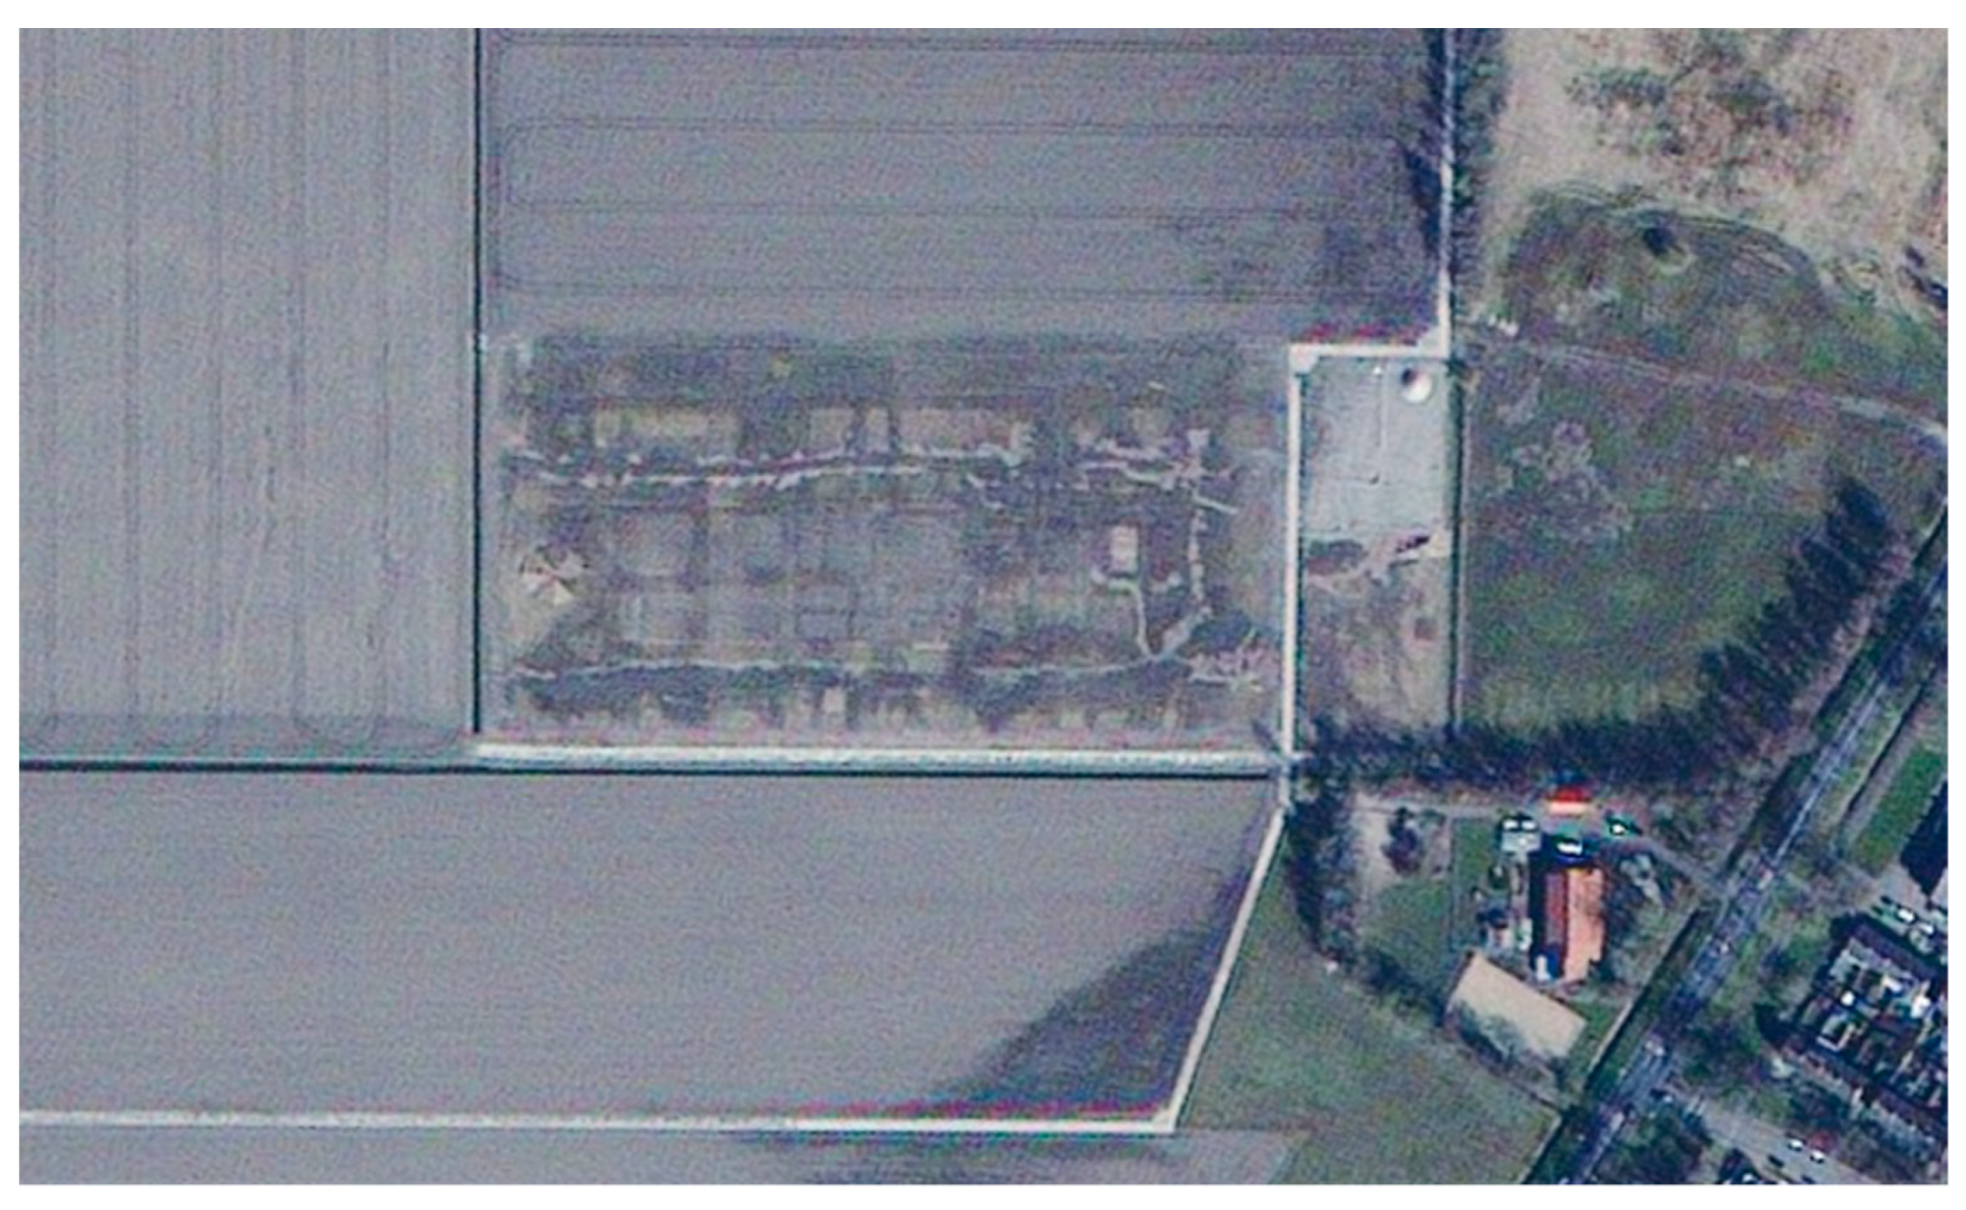

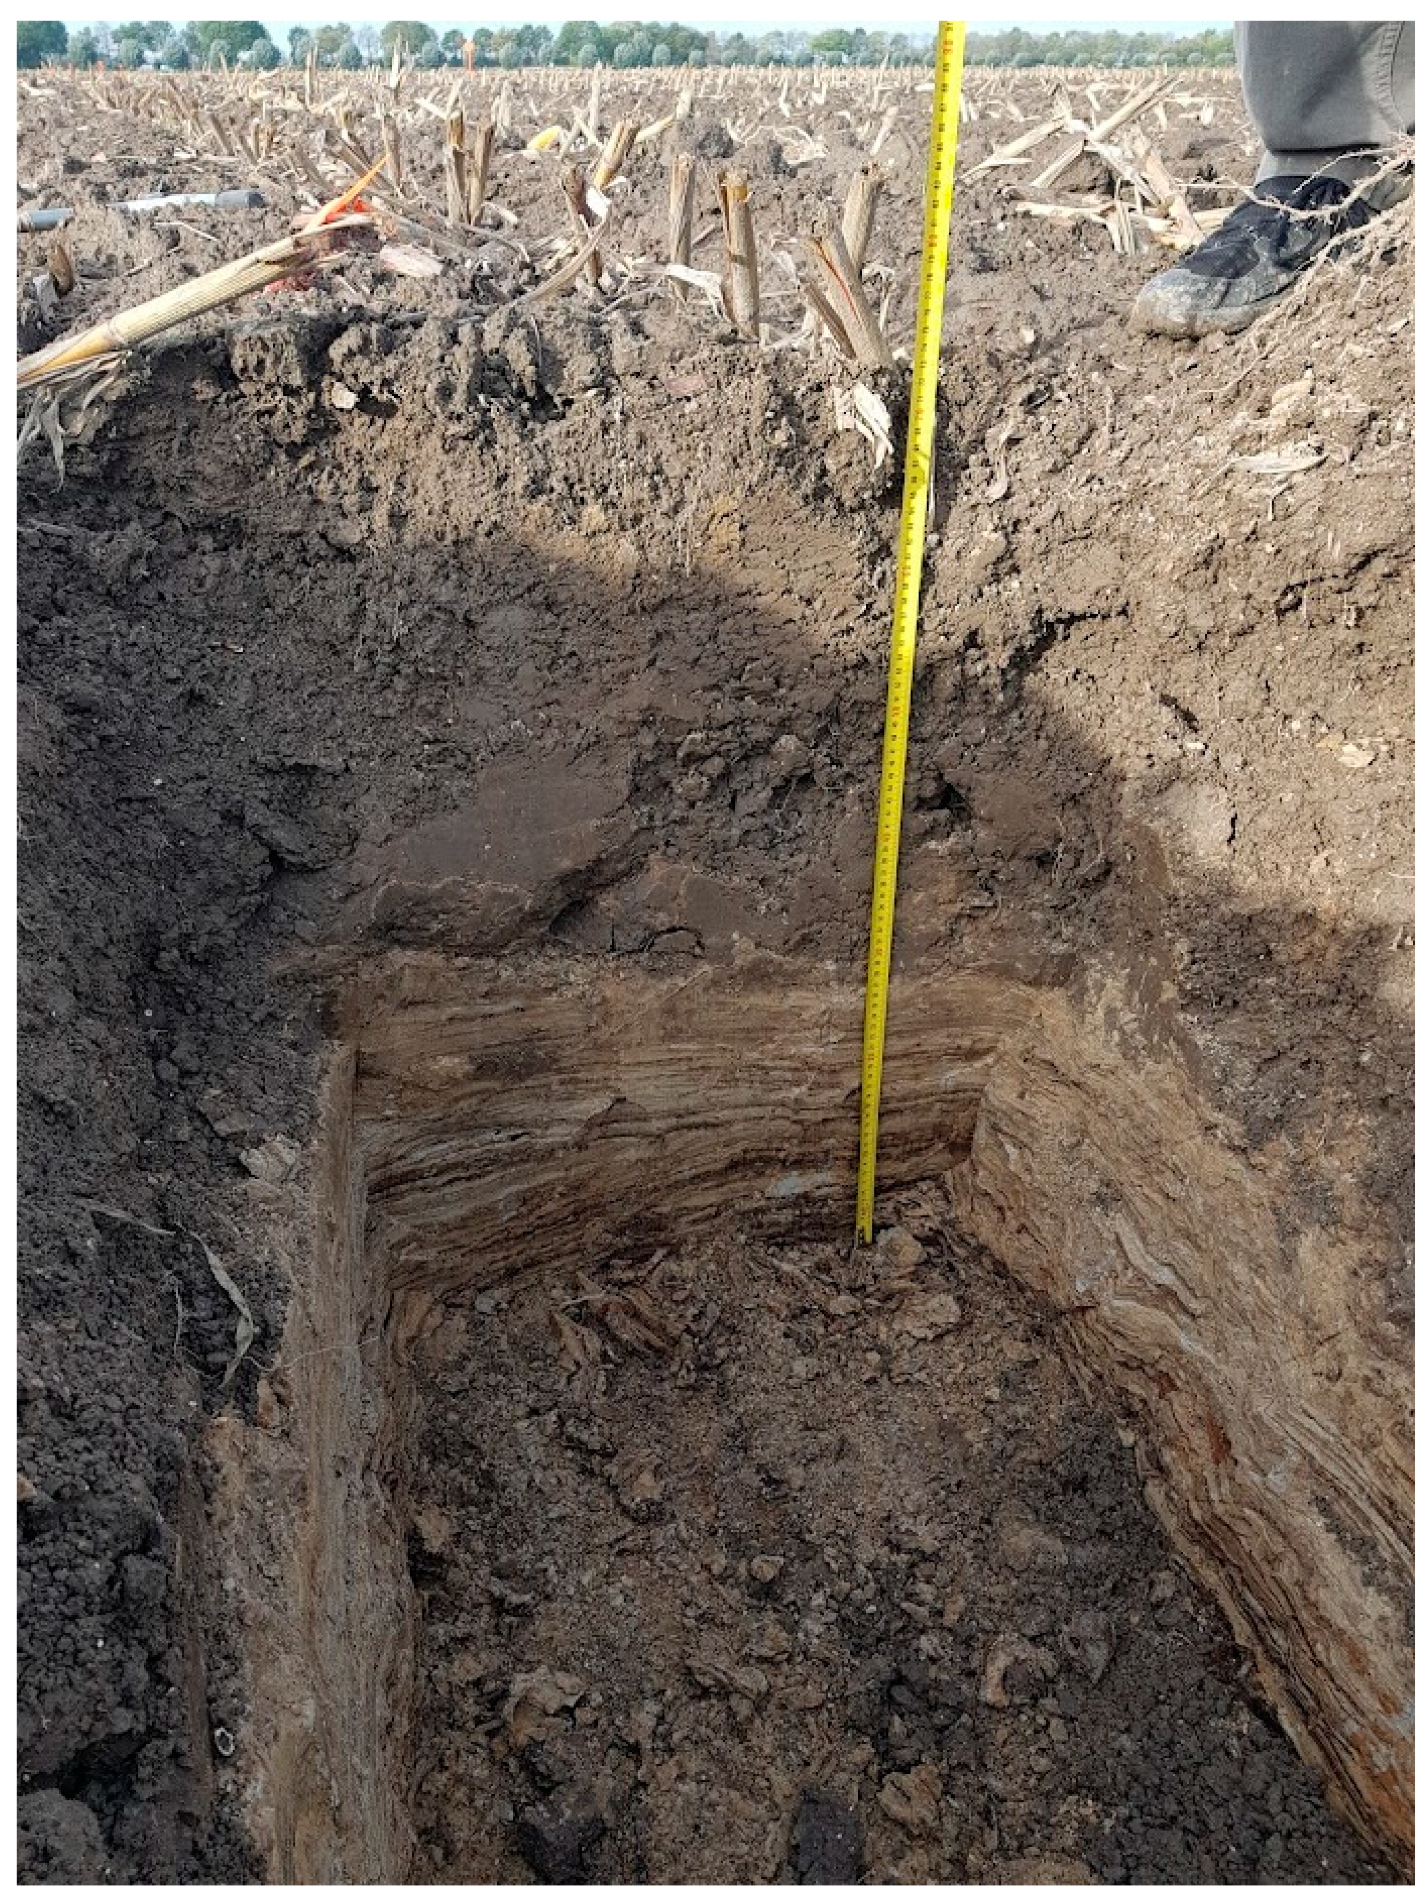
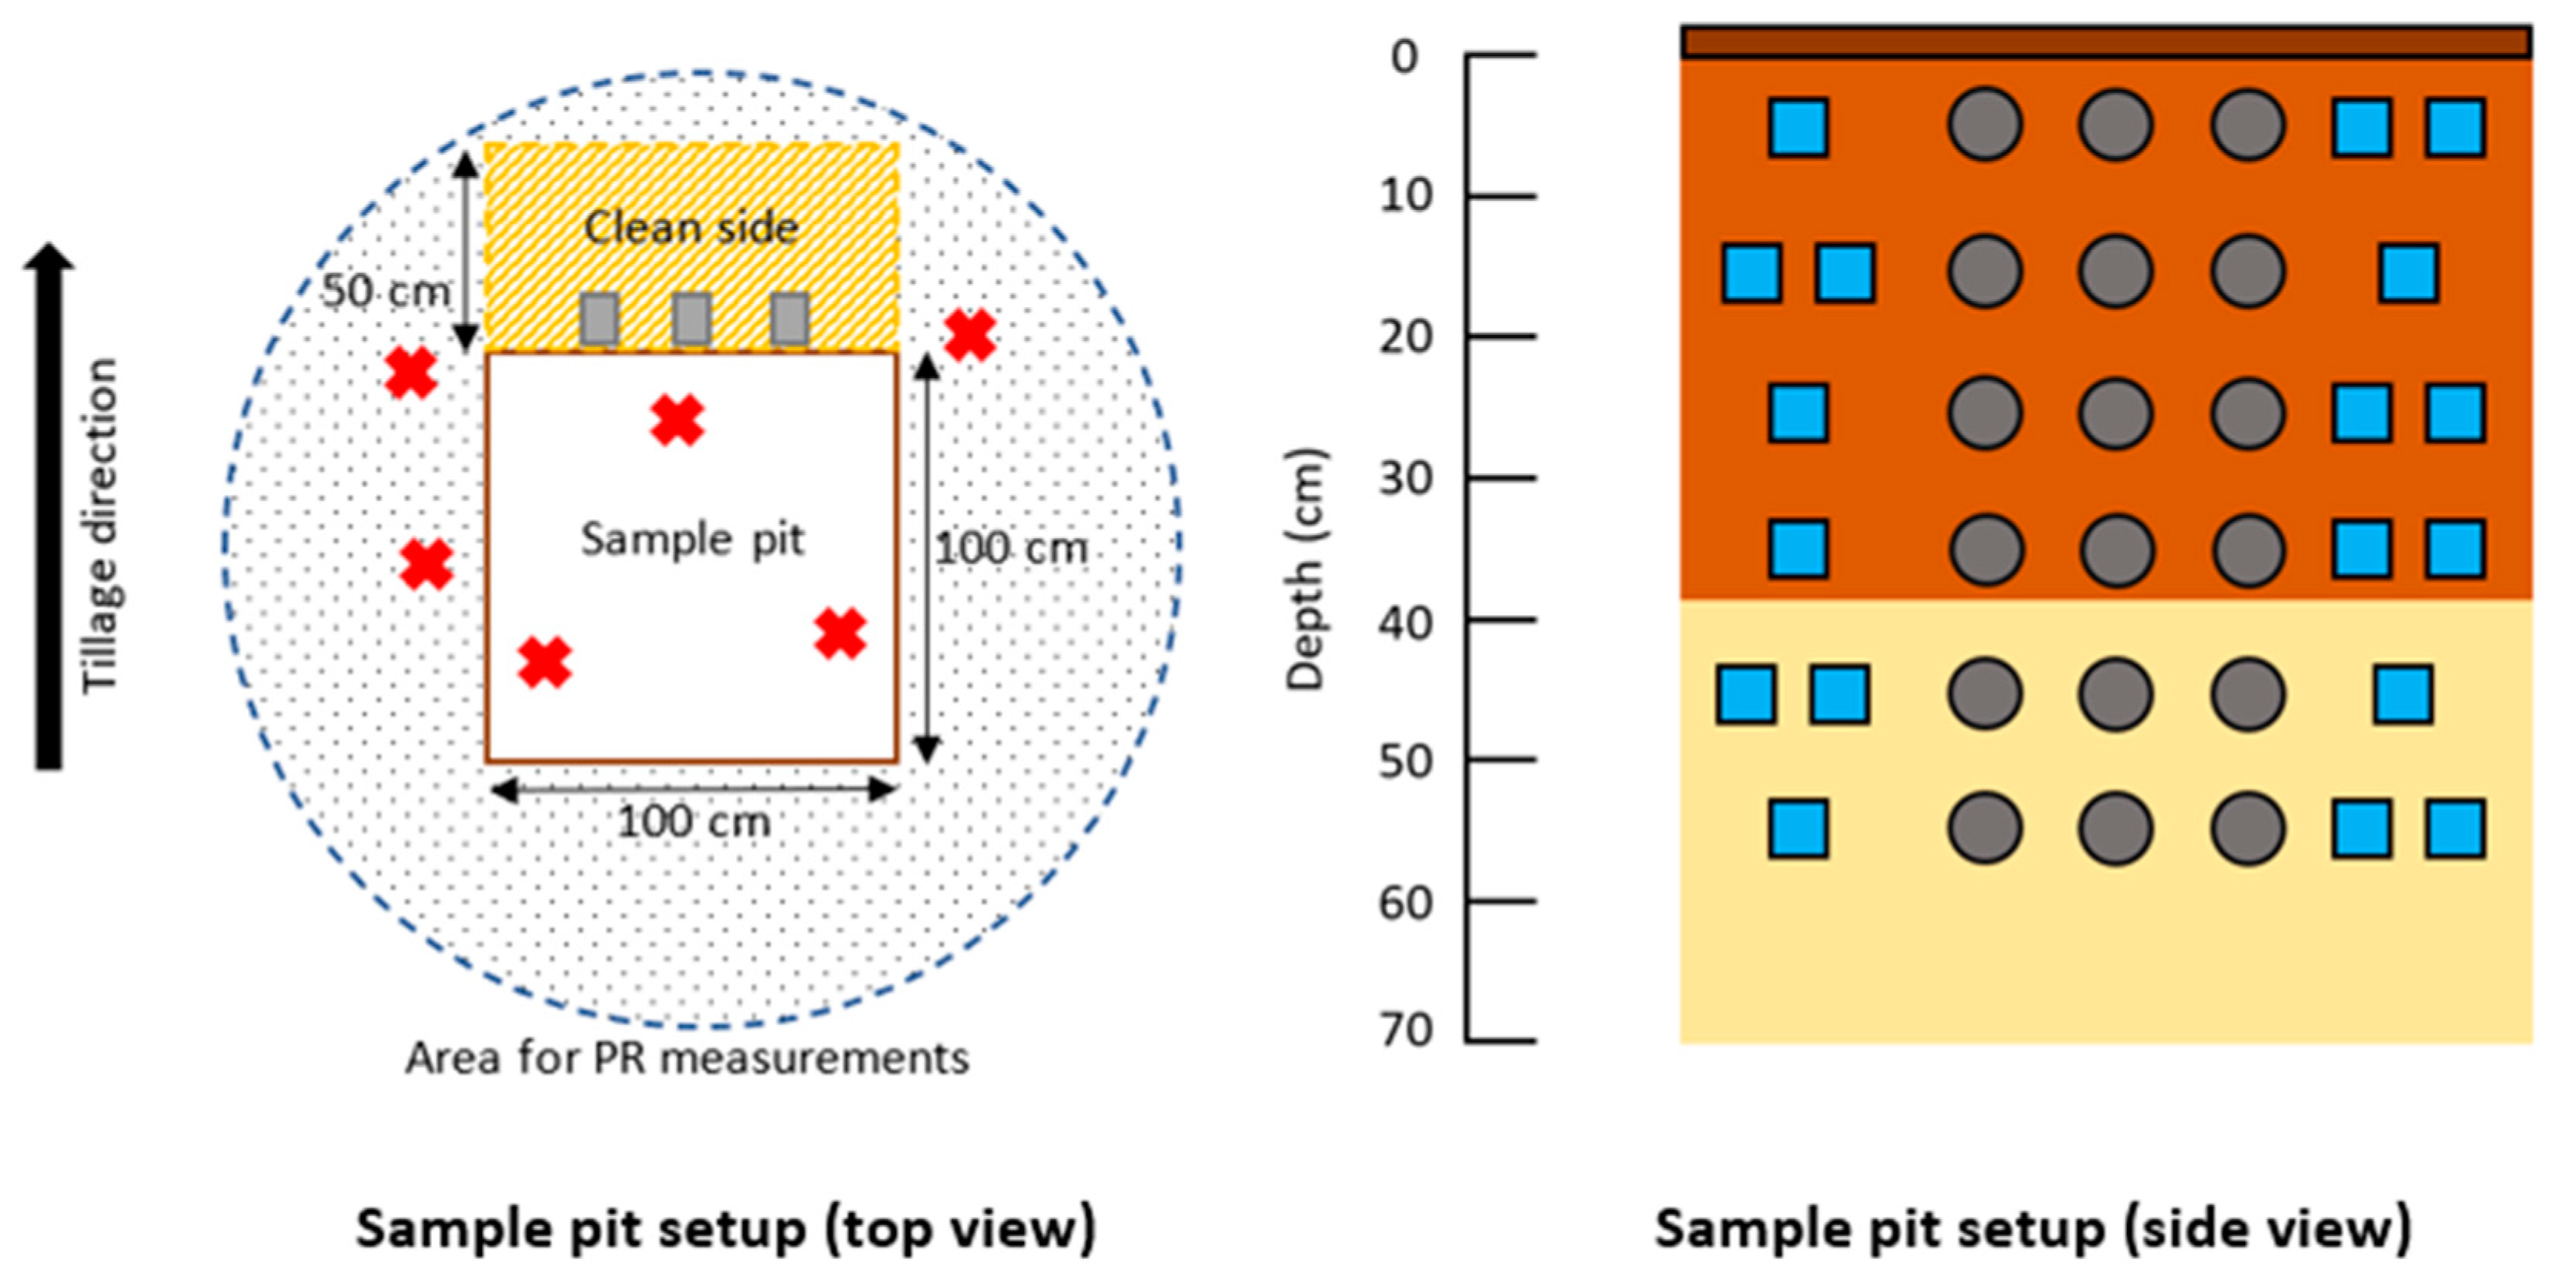
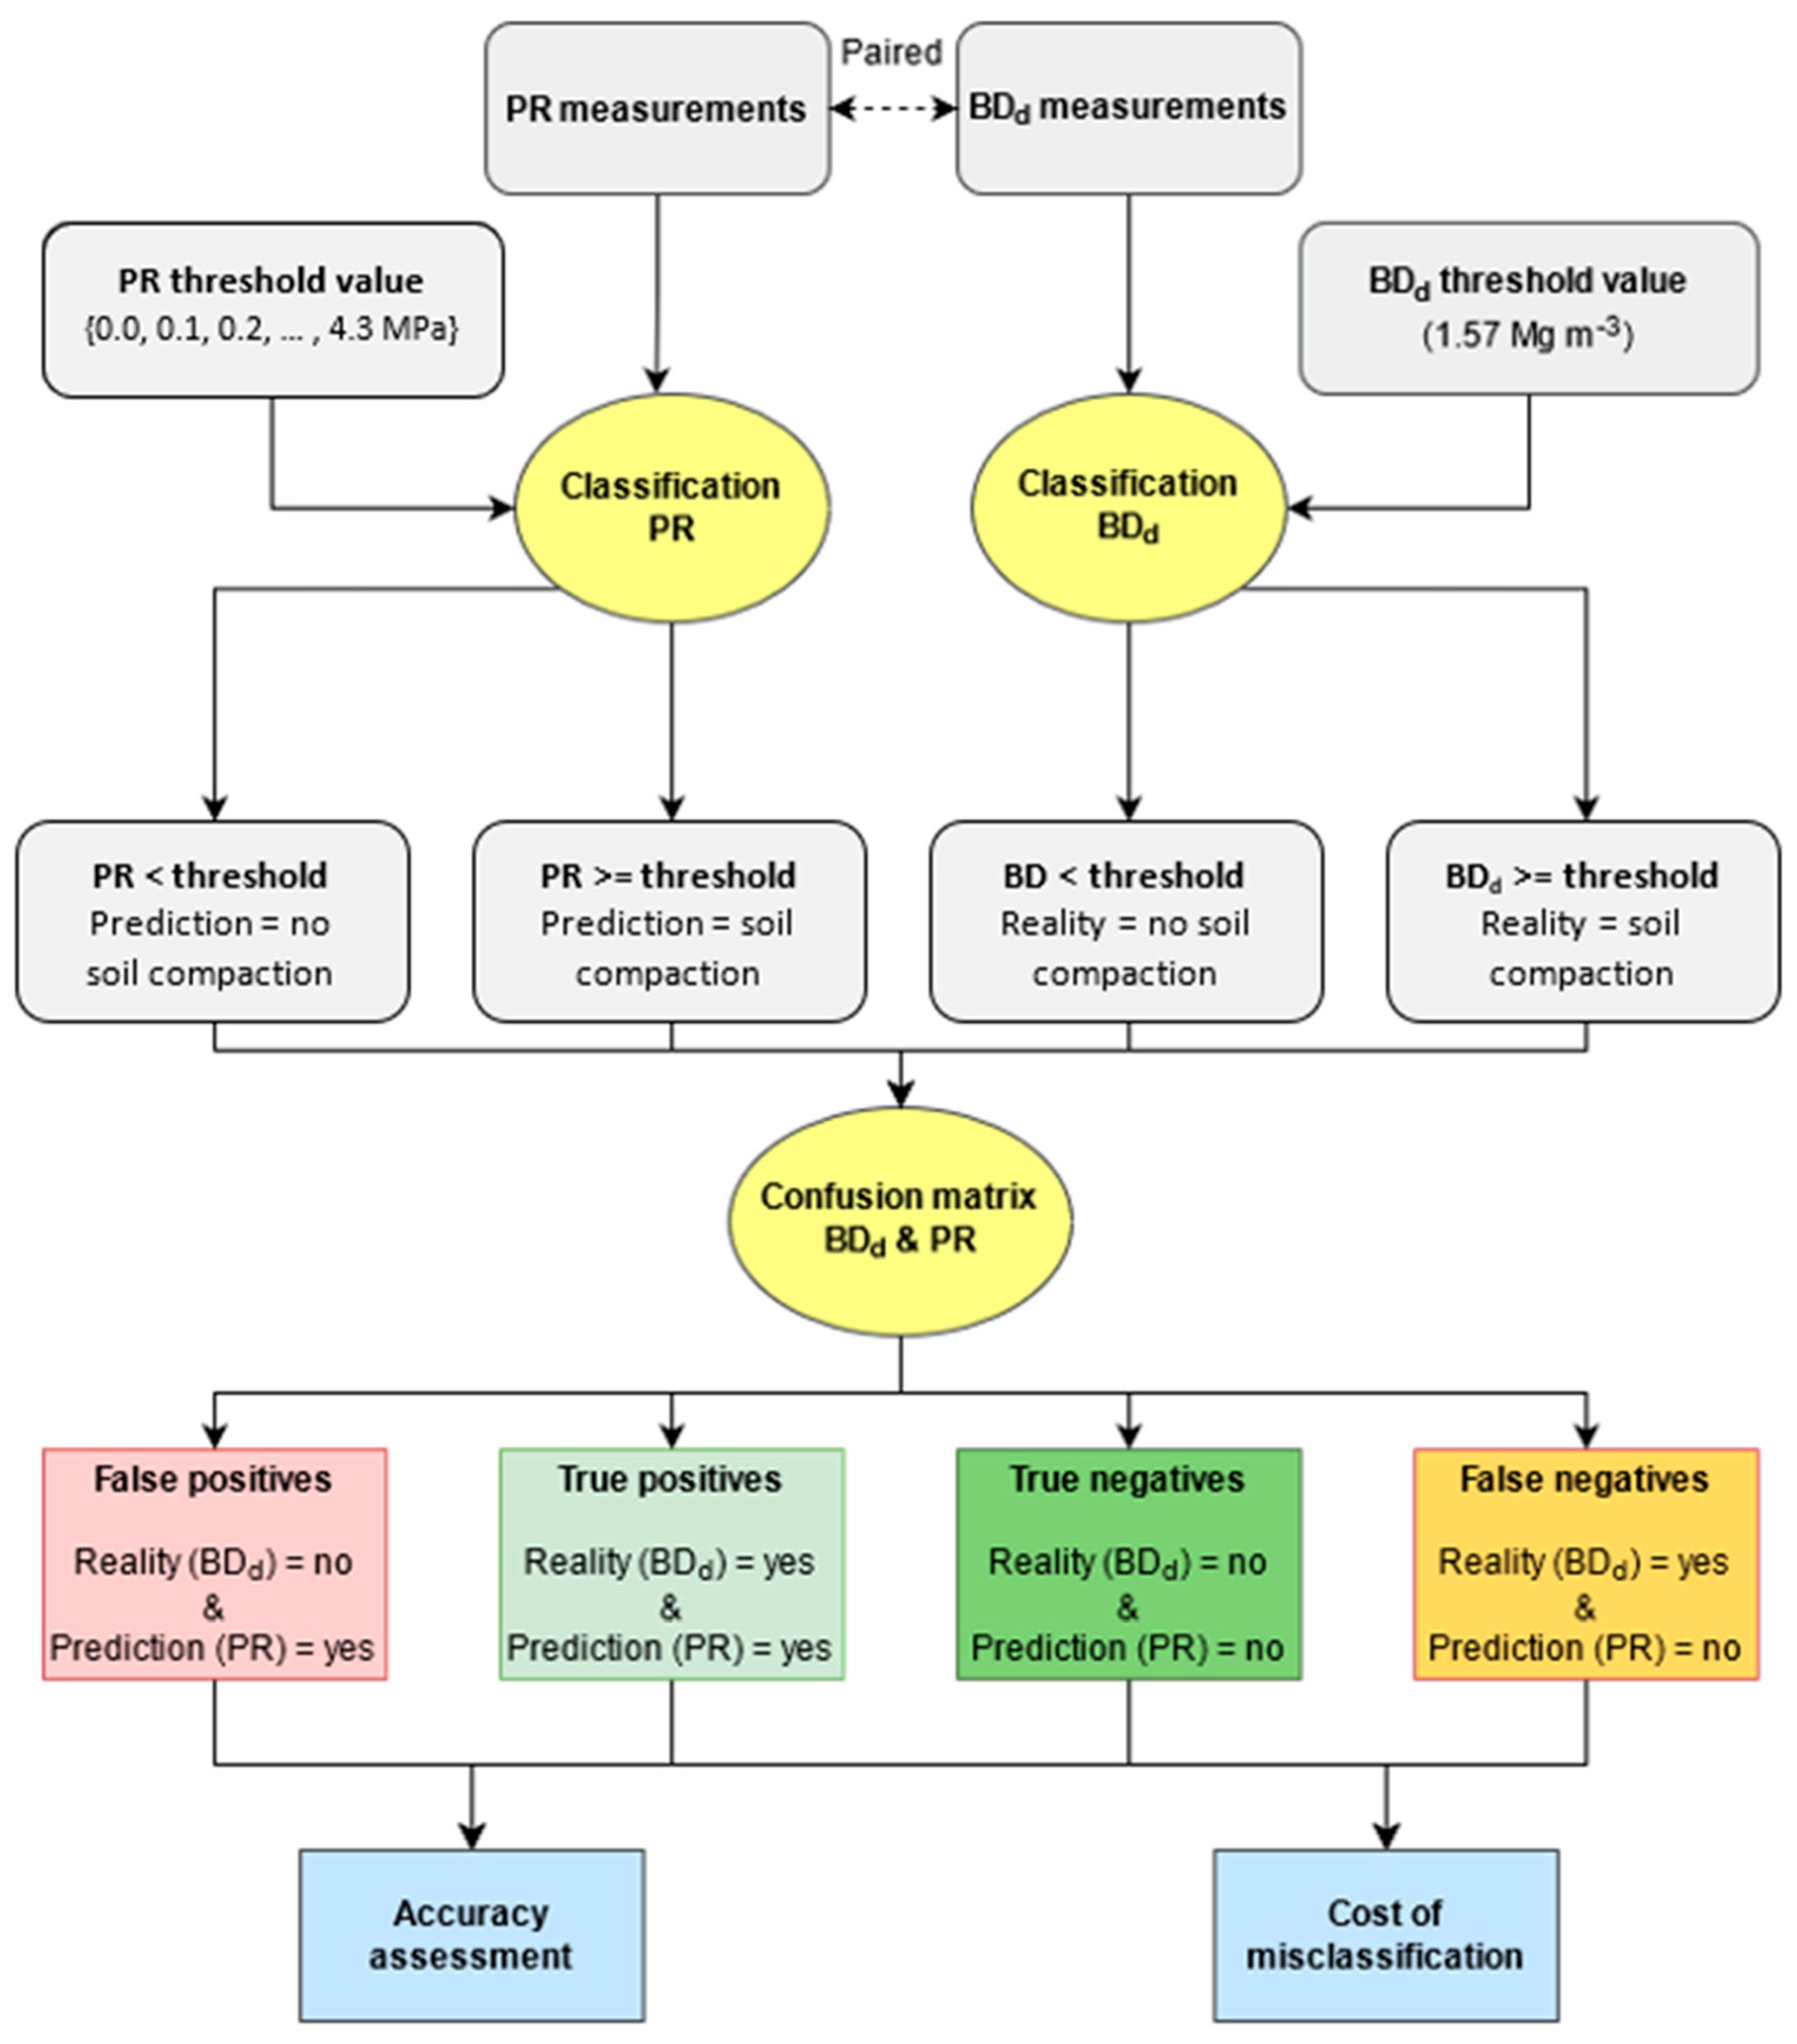
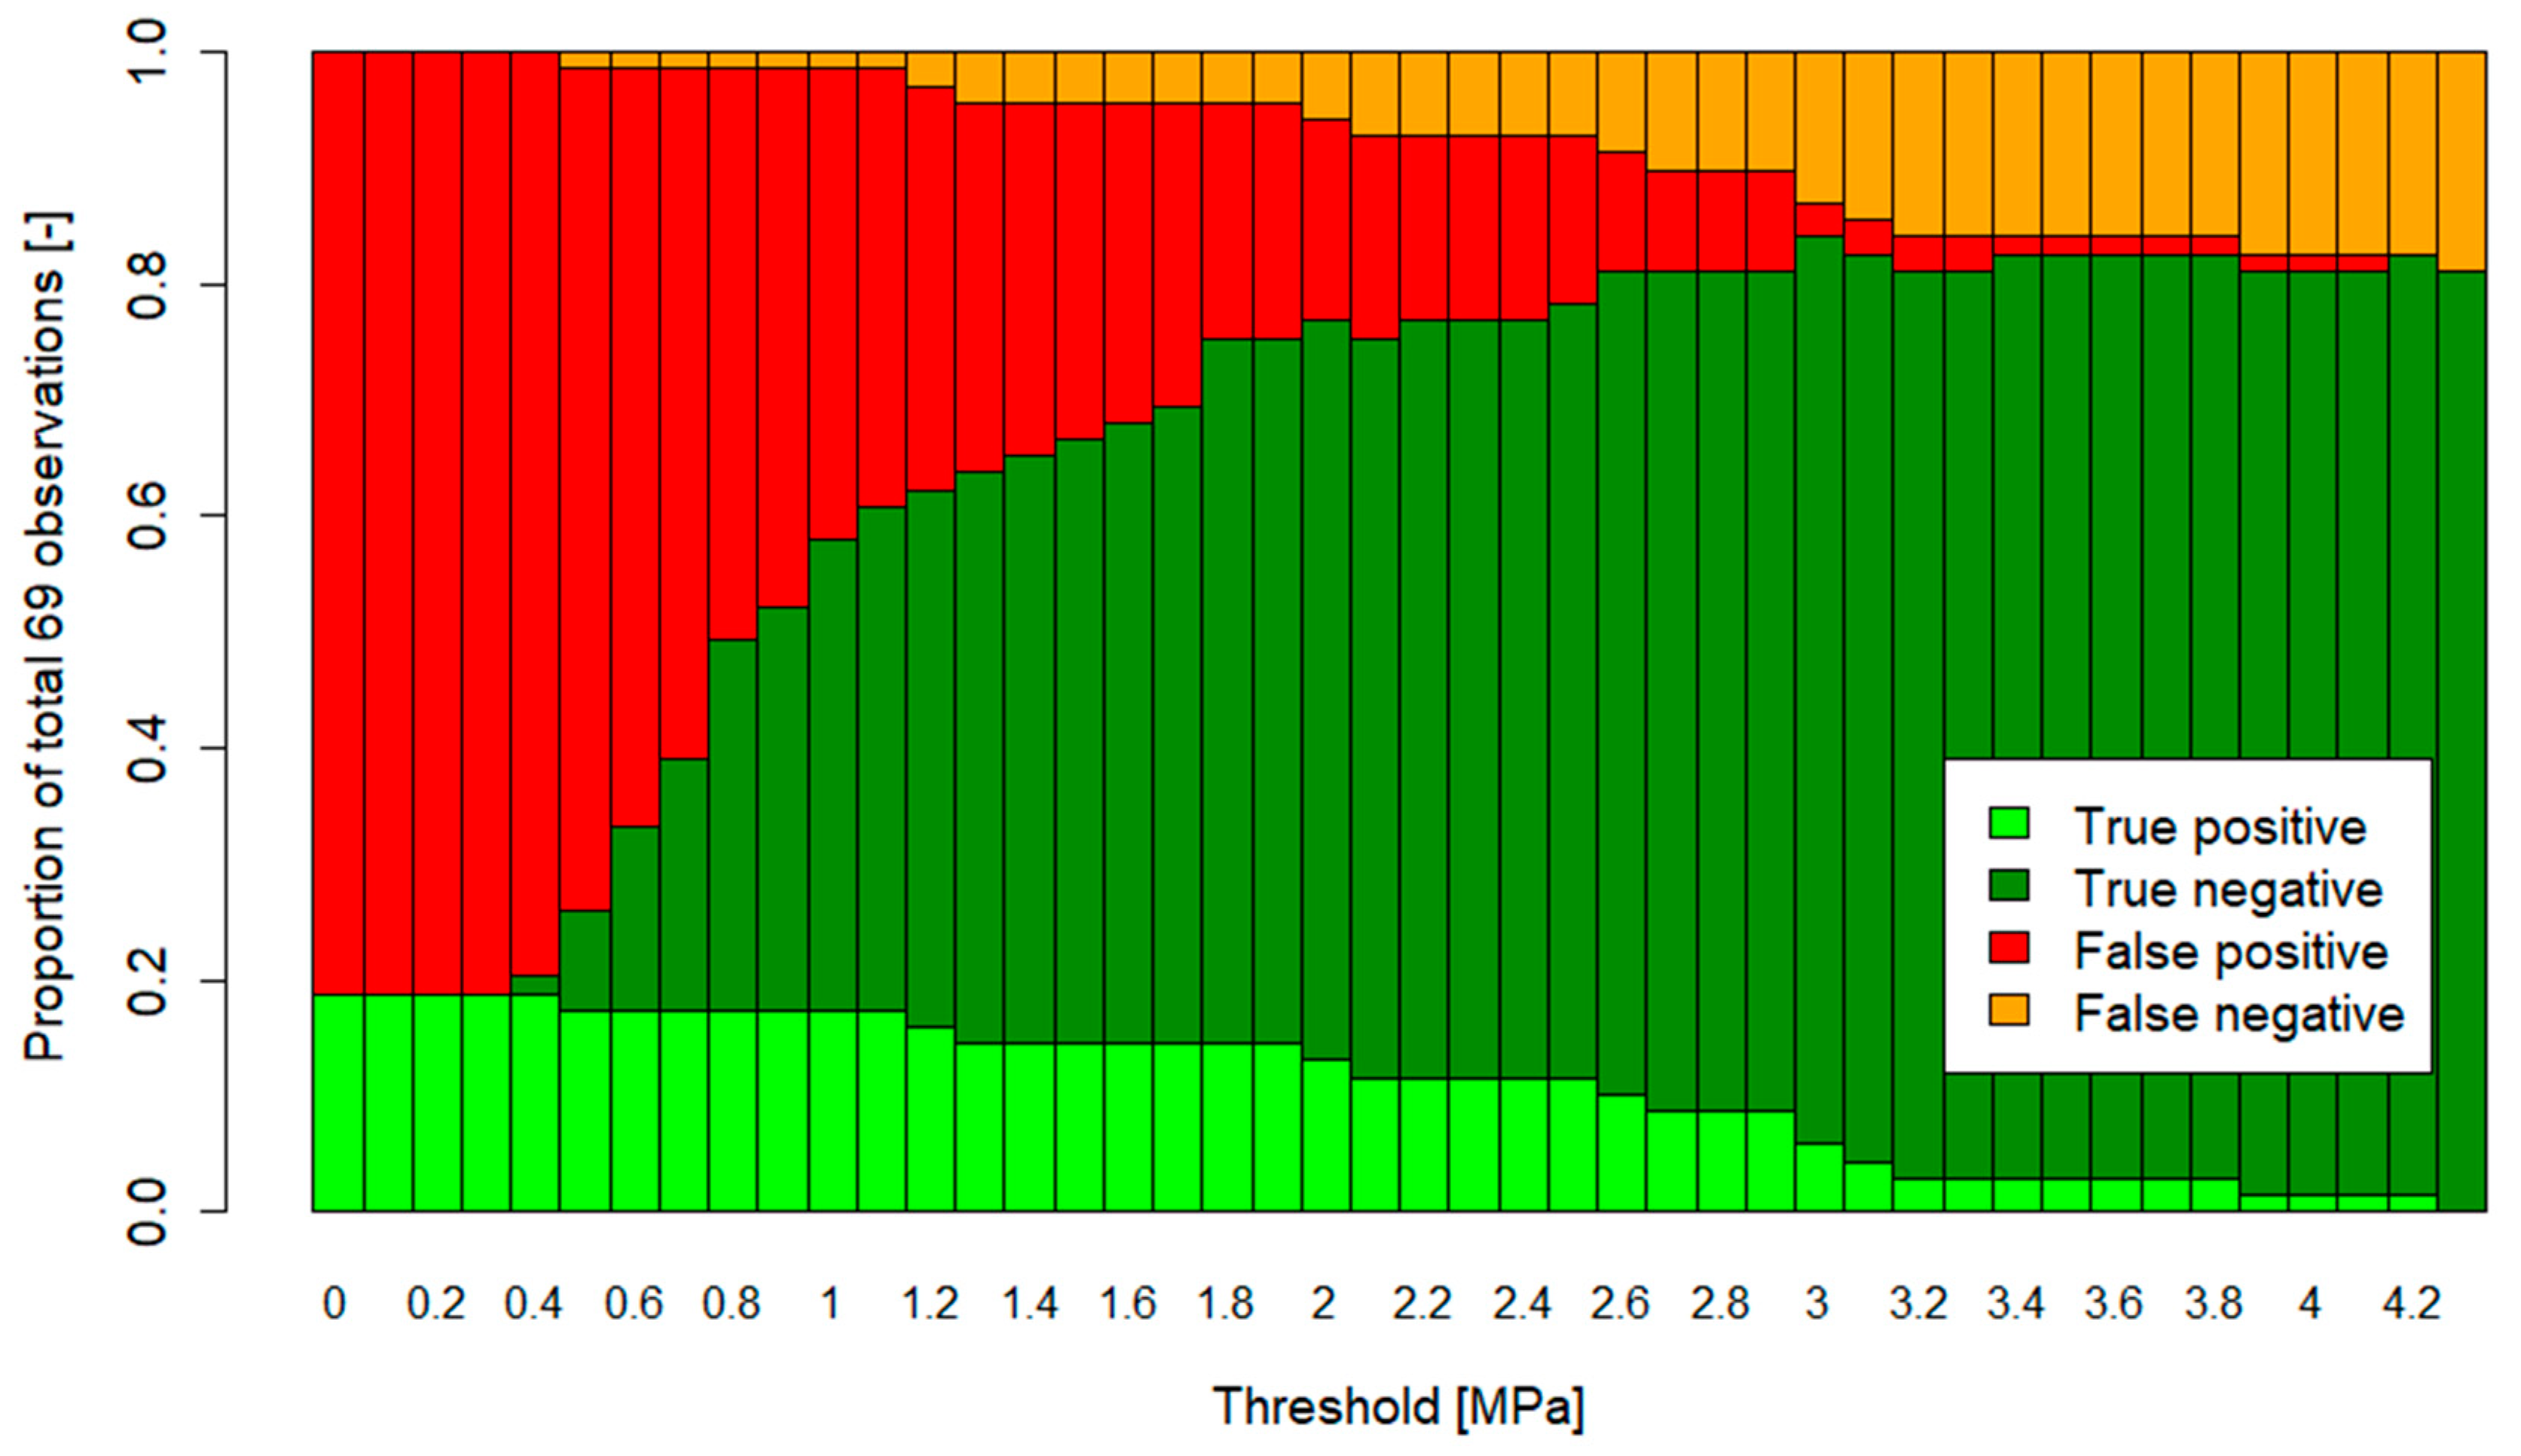
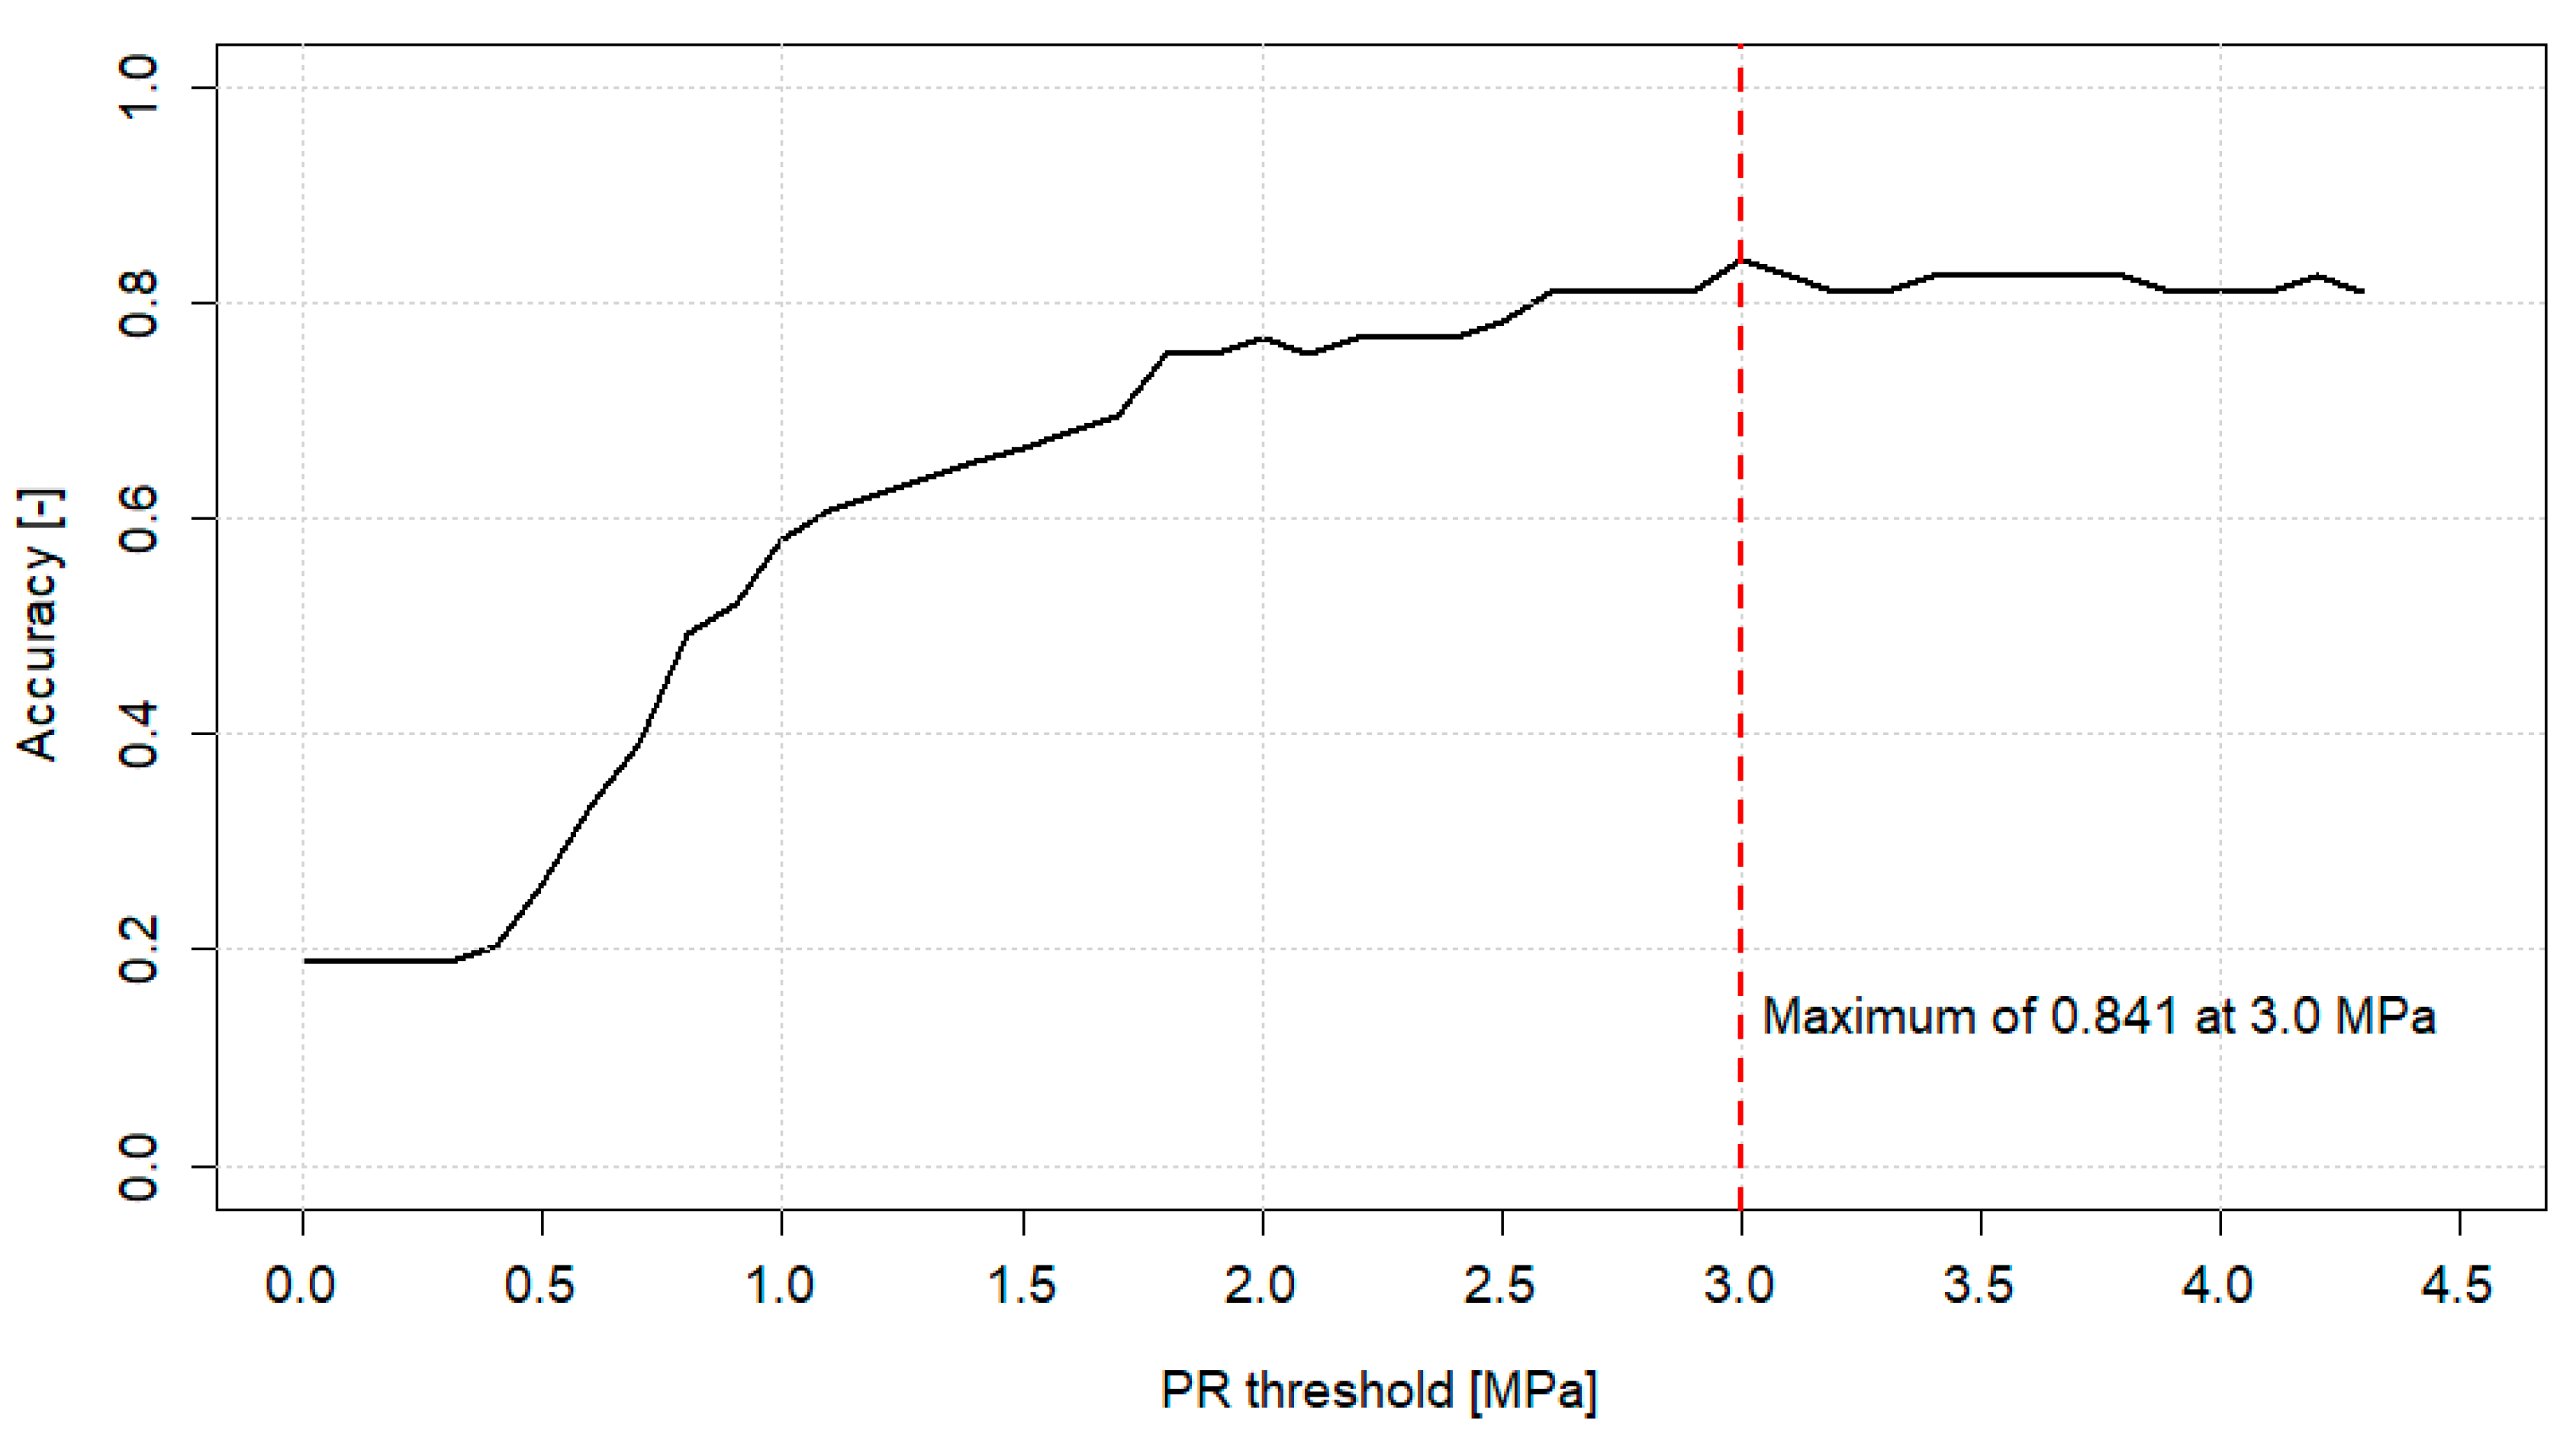
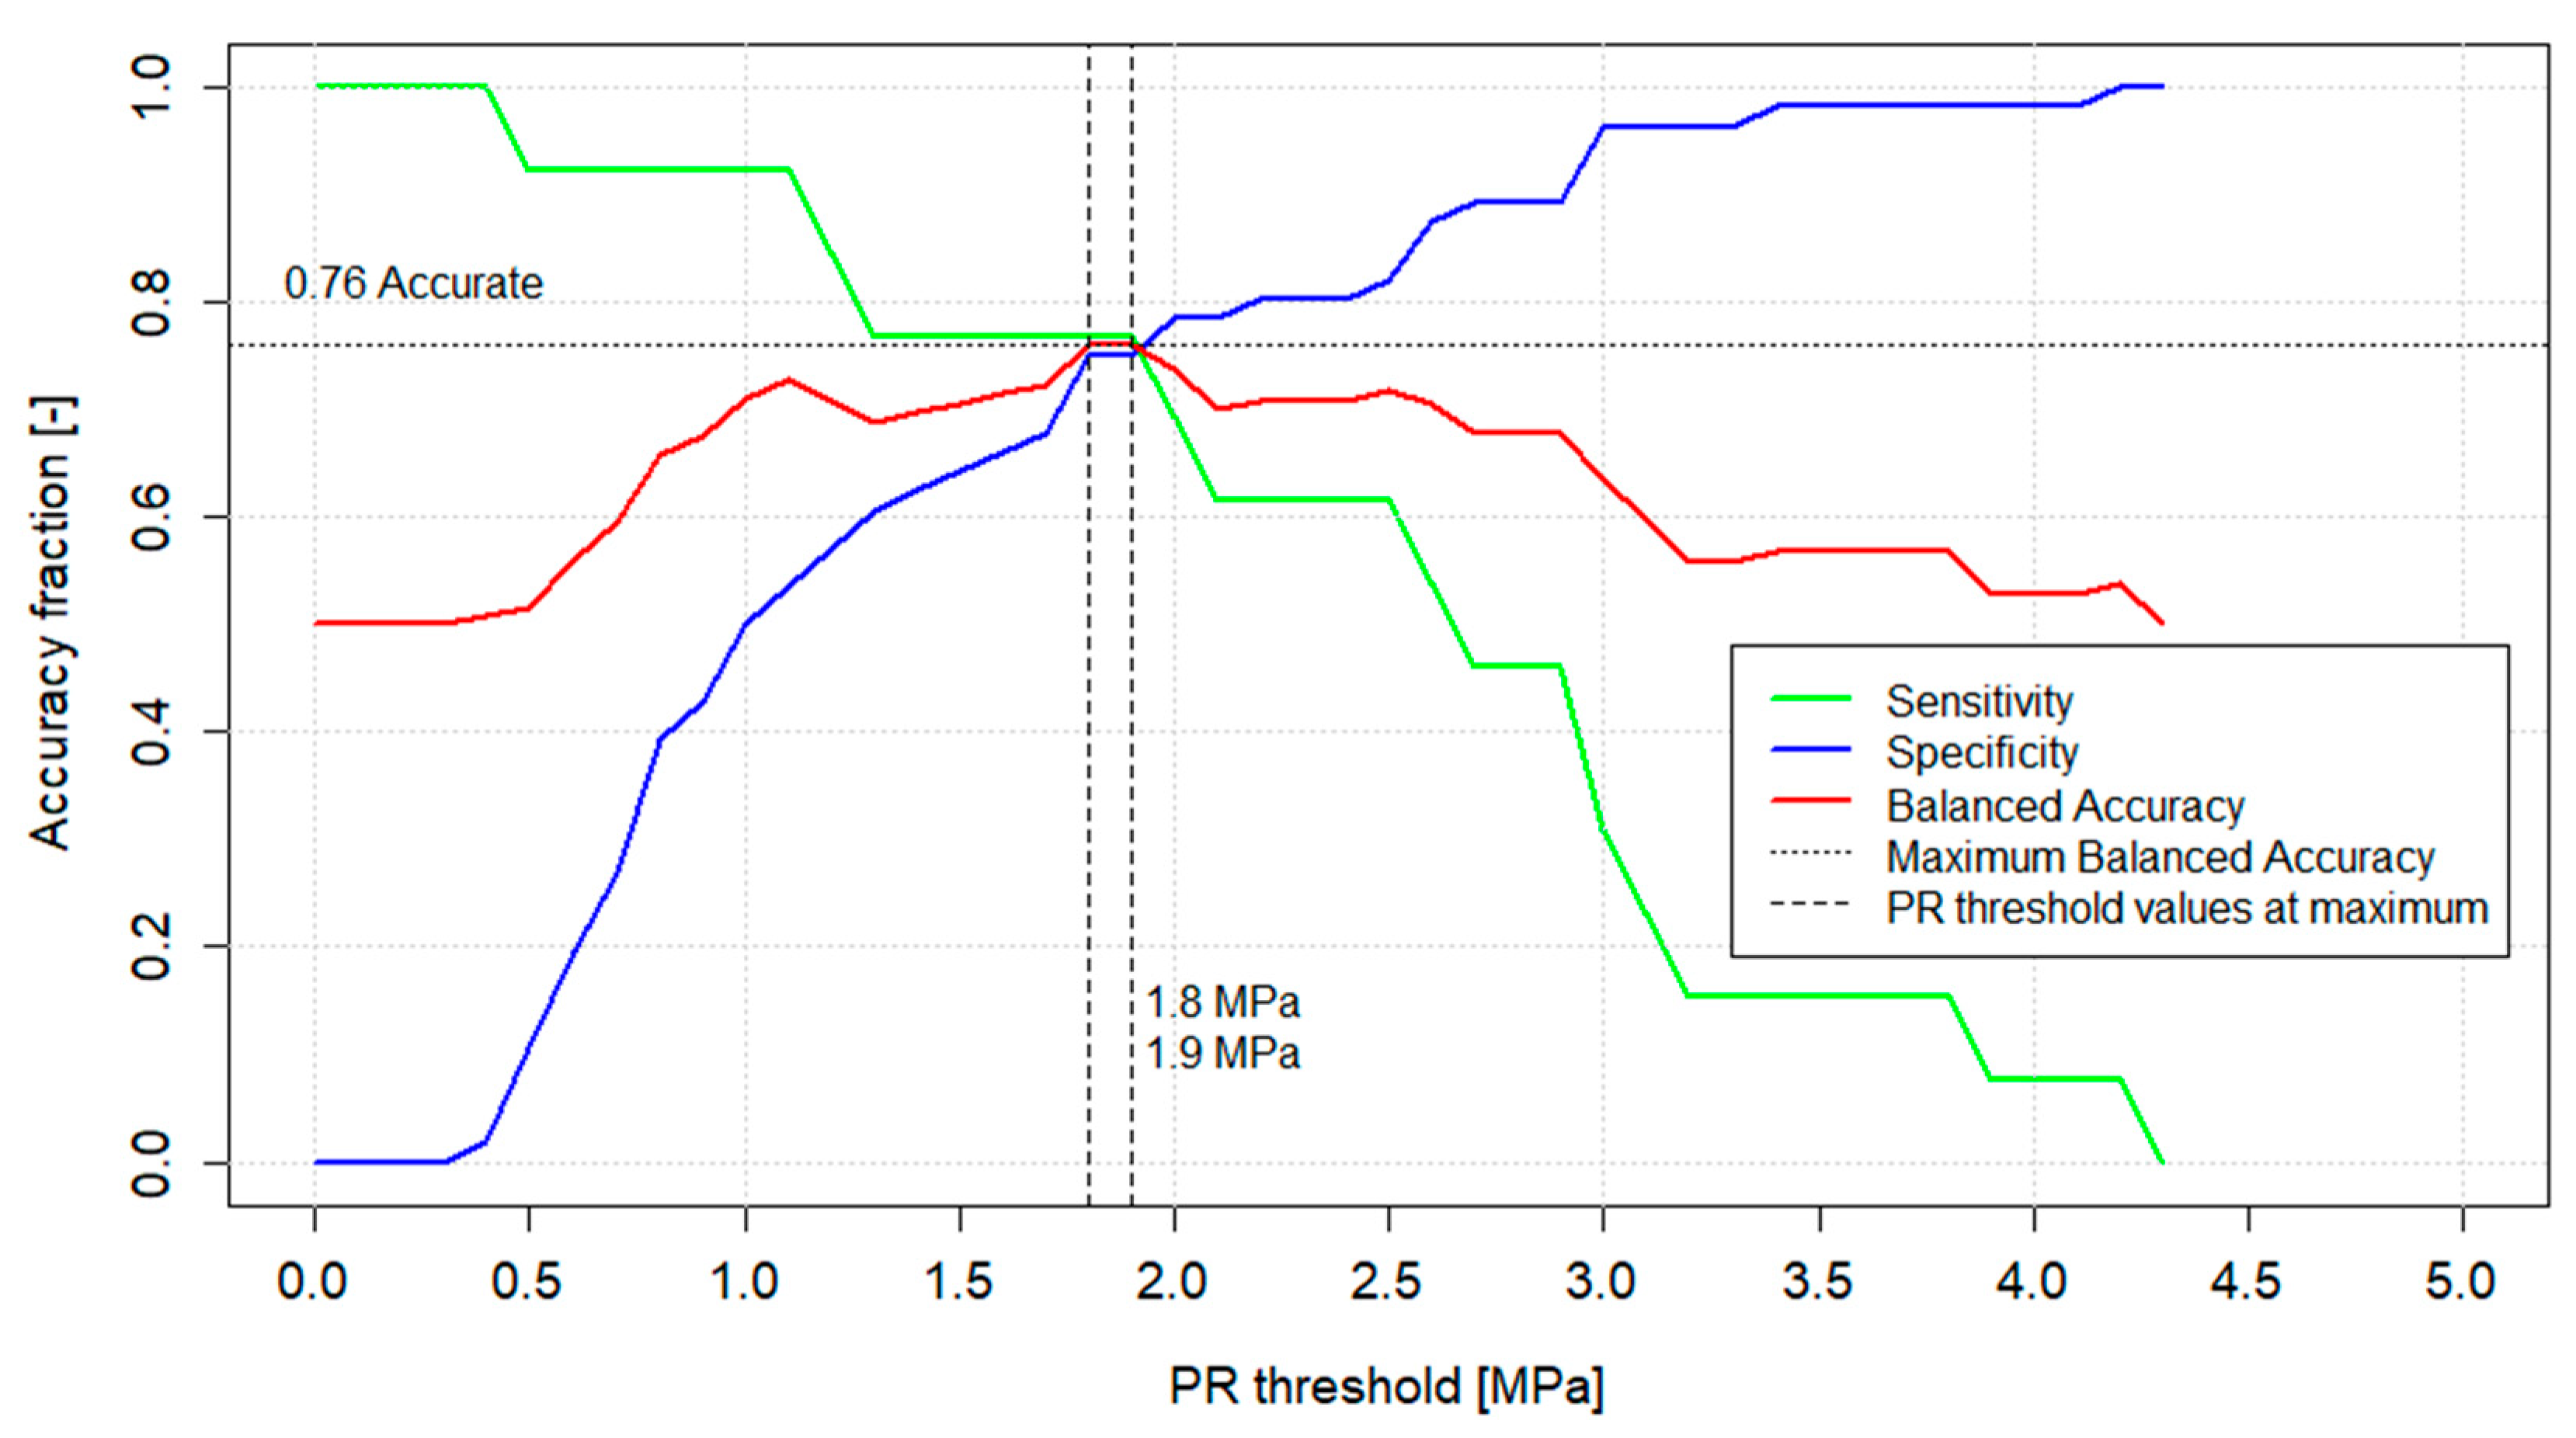
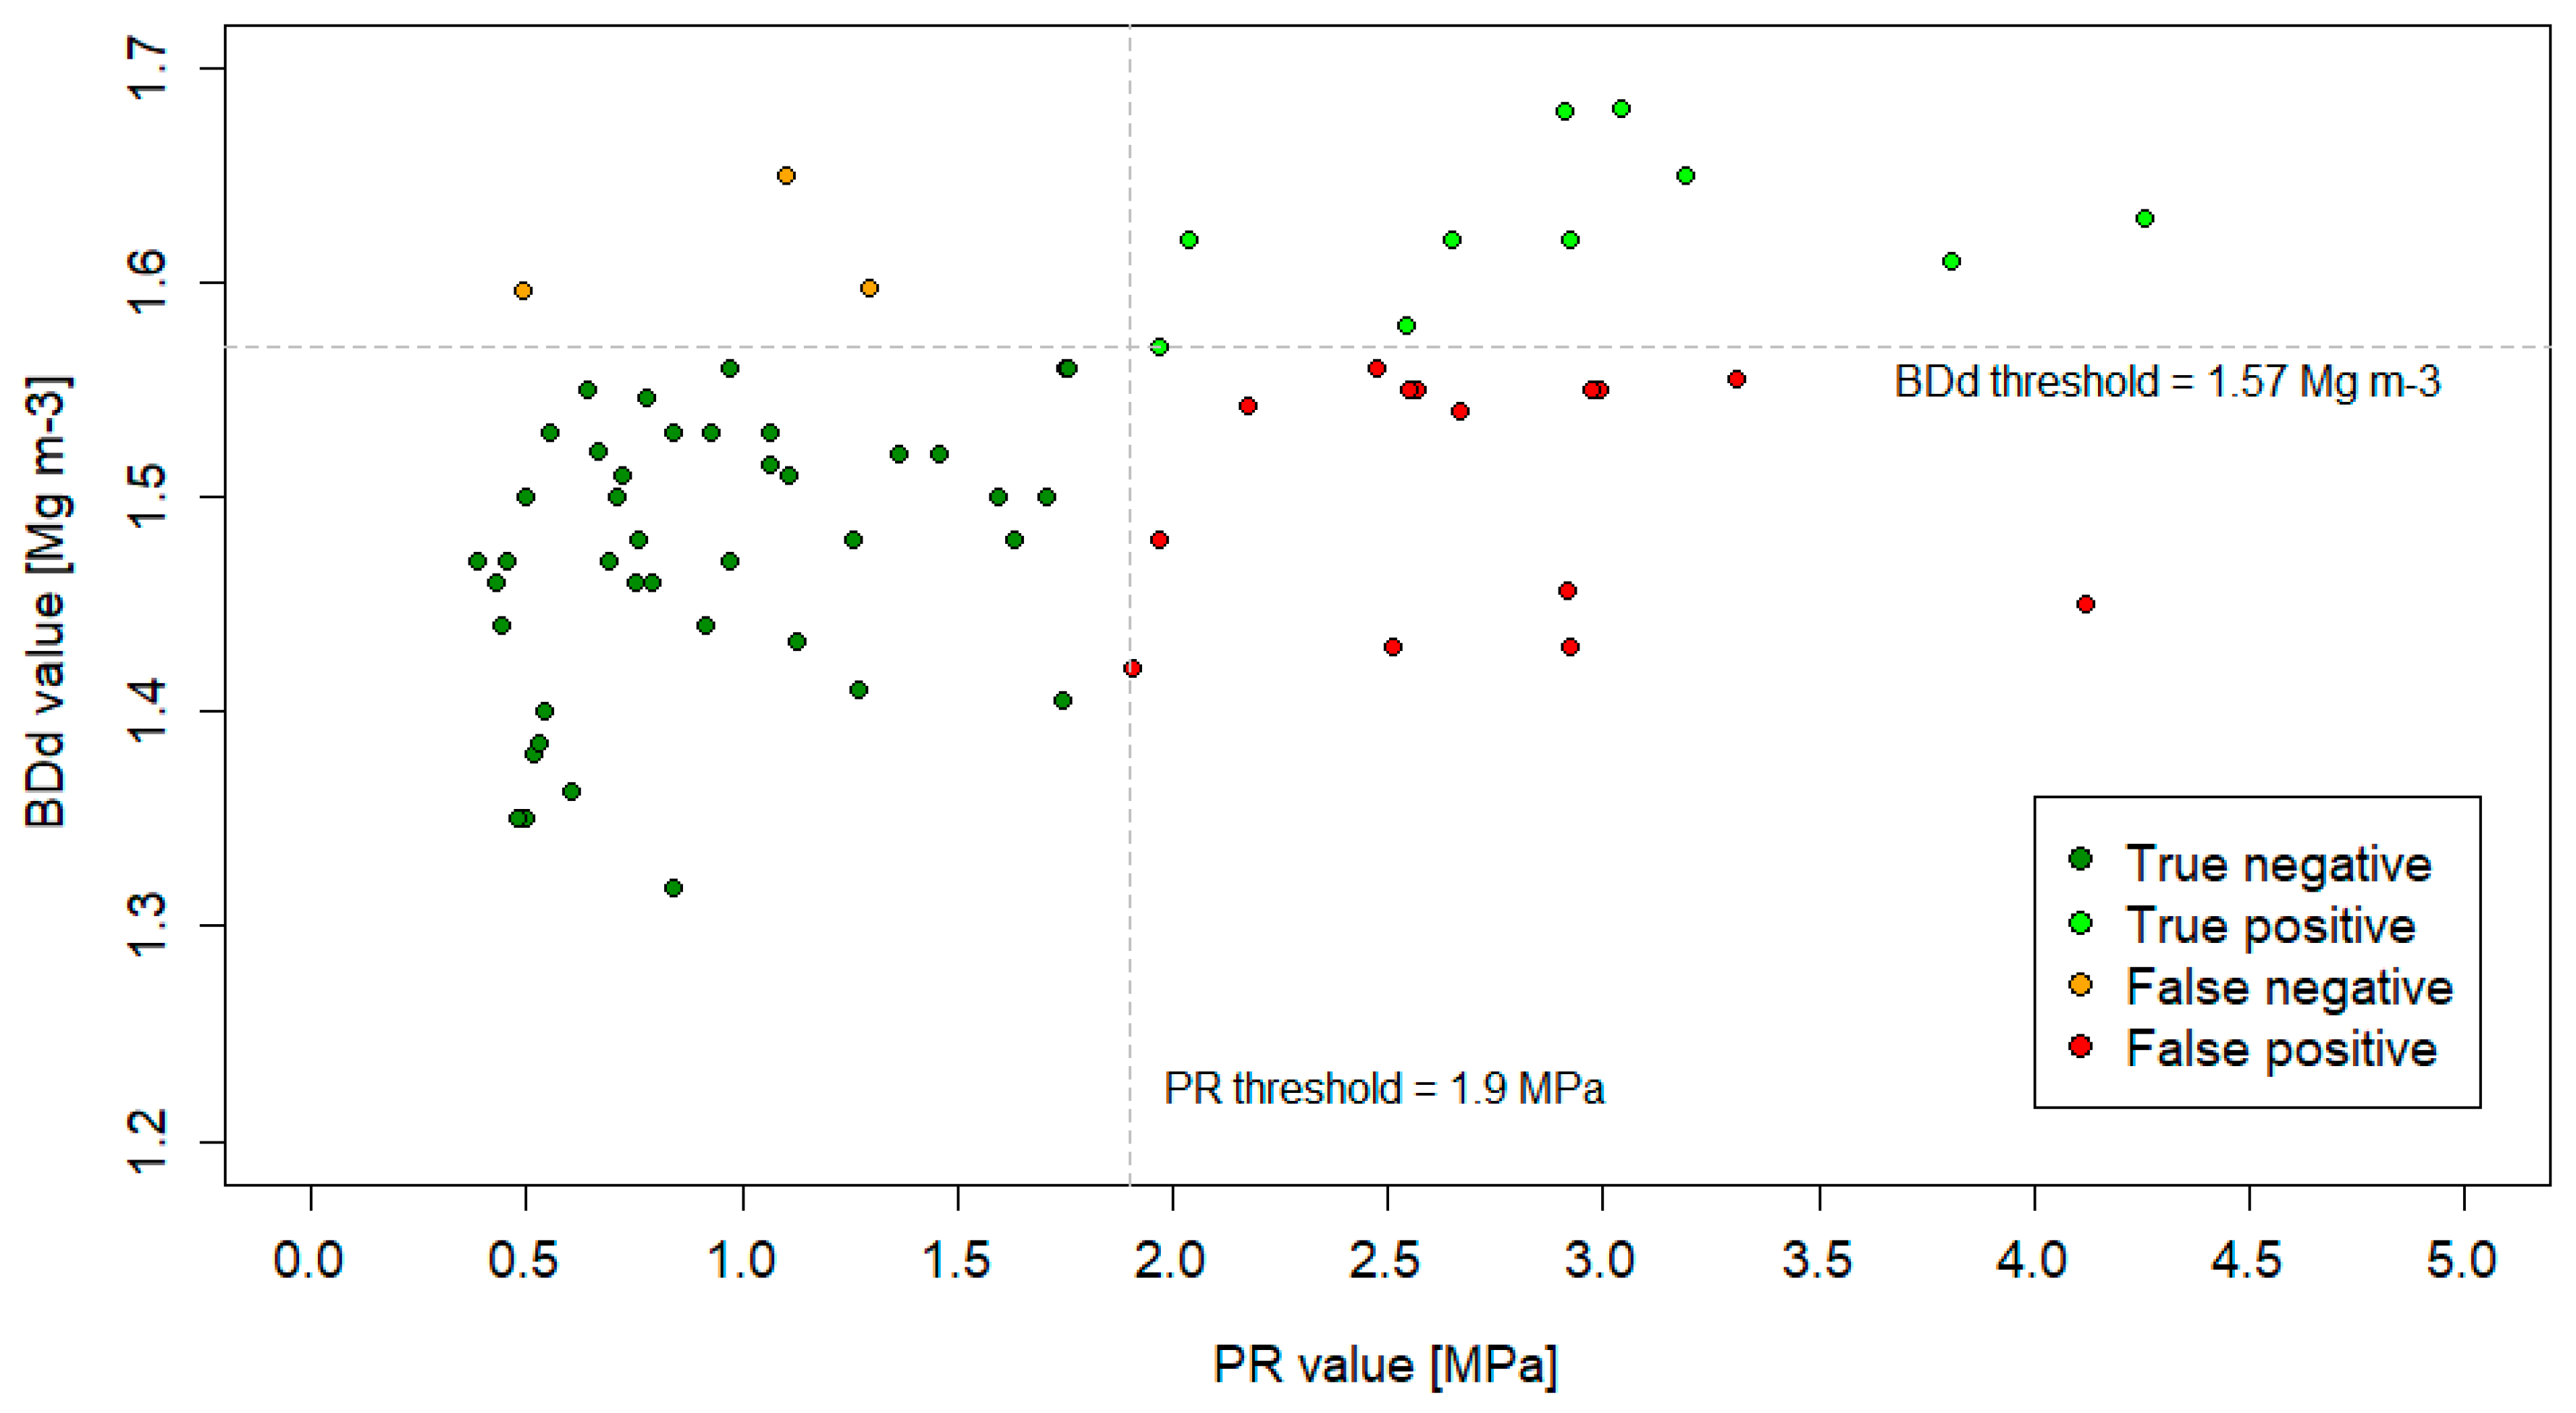
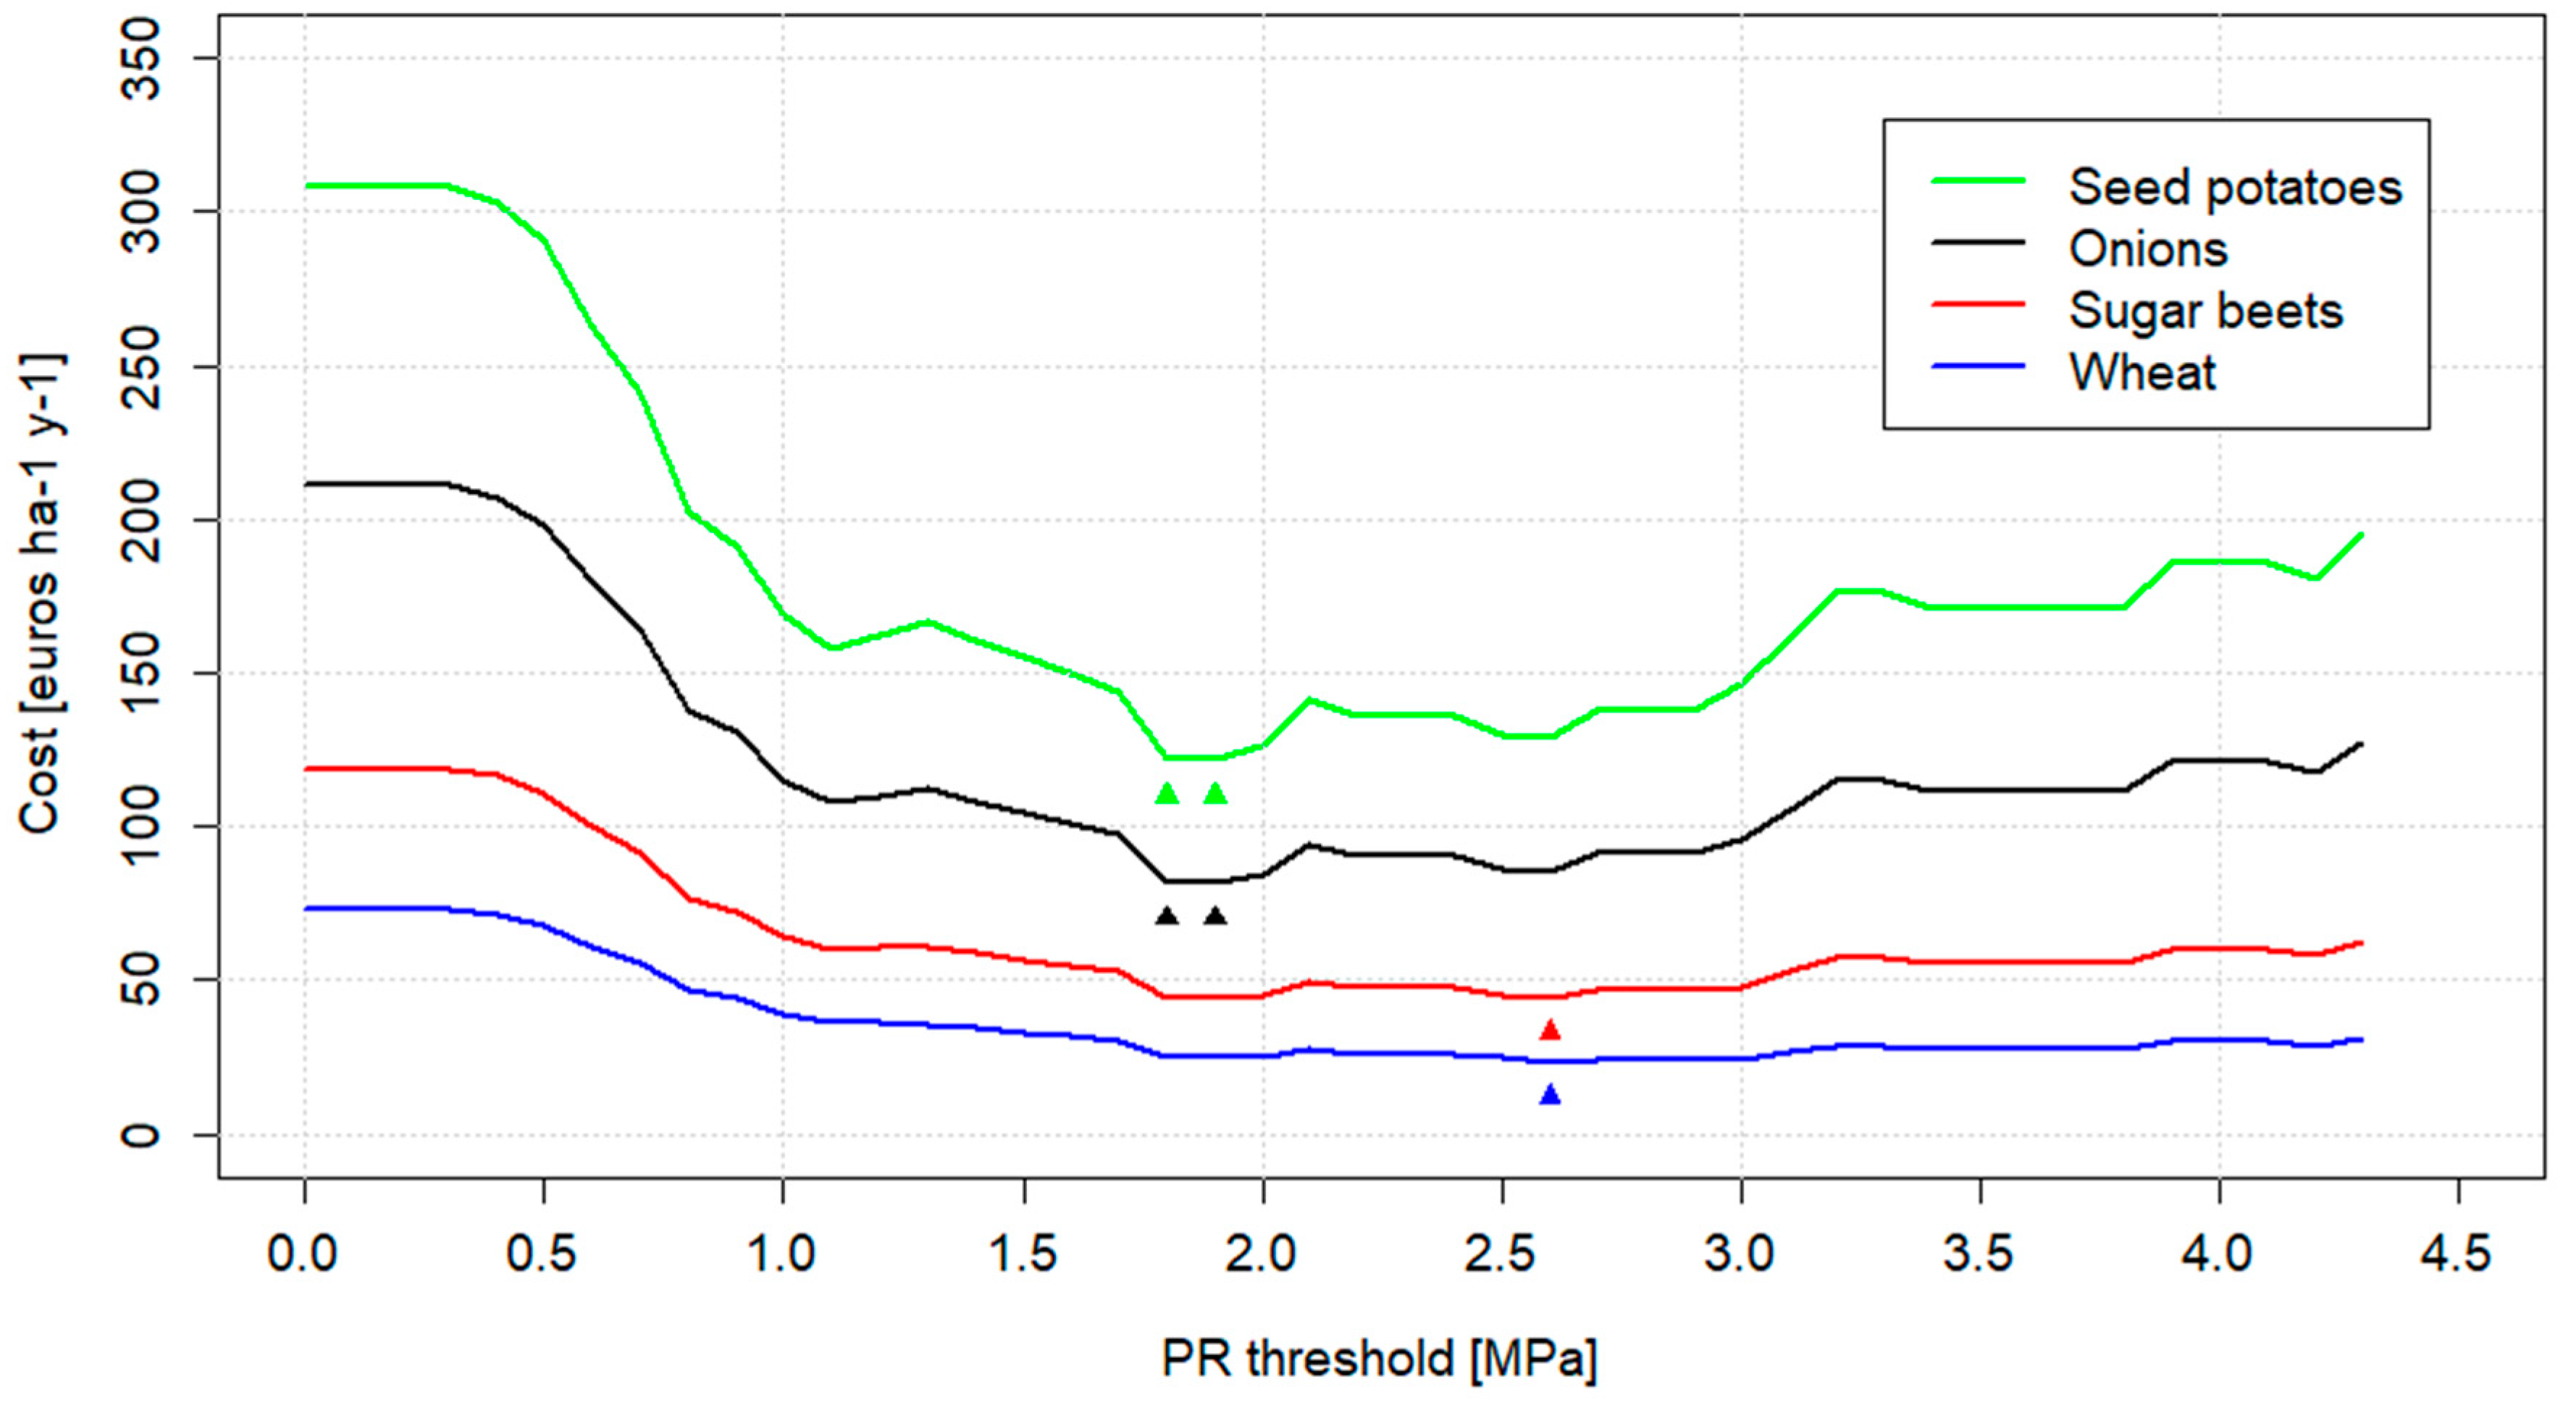
Publisher’s Note: MDPI stays neutral with regard to jurisdictional claims in published maps and institutional affiliations. |
© 2022 by the authors. Licensee MDPI, Basel, Switzerland. This article is an open access article distributed under the terms and conditions of the Creative Commons Attribution (CC BY) license (https://creativecommons.org/licenses/by/4.0/).