Abstract
Tomato production under tunnel structures has shown promising returns in recent years in Pakistan. However, the energy use and GHGs dynamics remain largely unknown for tomato production under controlled conditions. This study estimates the energy budgeting and GHG emission in off-season (tunnel-farming) tomato production. Study data were gathered from 70 tunnel tomato growers through a simple random sampling technique. Energy use efficiency, energy productivity, and net energy along with covariates of energy output were estimated through Cob–Douglas regression. The results indicate that the total input energy consumption and production were 91,376.38 MJ ha−1 and 56,764.64 MJ ha−1, on average, respectively. The contribution of fertilizers (60.78%) was higher in total input energy followed by diesel and chemicals. The value of energy use efficiency was 0.652, which was higher for small farms (0.678) and lower (0.604) for large farms. Energy productivity (0.815 kg MJ−1), specific energy (1.355 MJ Kg−1), and net energy (−34,611.743 MJ ha−1) were also estimated. The total greenhouse gas emission was 3426.66 kg CO2 eq. ha−1, which is low for large farms (3197.57 kg CO2 eq. ha−1). The contribution of farmyard manure to total GHG emissions was high. The results show the inefficient use of inputs, responsible for GHG emissions. Fertilizers were a major contributor both in total input energy and GHG emission. The efficient utilization of agricultural inputs is a solution to reduce GHGs emissions in crop production. Therefore, the agriculture department should play its role to ensure the optimal or efficient use of agricultural inputs. The Department of Extension is working to guide farmers about crop production at each stage. Thus, regular visits from extension staff are recommended to guide vegetable producers about efficient input use.
1. Introduction
The sustainable feeding of the global population is an immense challenge for the entire world. Energy in different forms is needed in the production of various types of foods to feed the ever-increasing population [1]. The GHGs have increased in the atmosphere from several agricultural inputs (i.e., irrigation, fertilizers, pesticides, seeds, and farm operations). These agricultural inputs are categorized into several energy forms which play a key role in crop production. However, high energy utilization causes an environmental burden which in turn leads to poor environment and low economic returns. Thus, a reduction in energy use from several inputs leads to a decrease in GHG emissions from the agriculture sector [2]. Environmental degradation is accountable for several diseases such as stroke, heart disease, respiratory diseases, and lung cancer; thus, it is responsible for the loss of human lives [3]. Thus, investigating the utilization and management of energy inputs in agriculture are the main research challenges that can help in ensuring sustainable production. This is because energy use is directly linked with the environment, having many implications both for agriculture and society. More importantly, the efficient use of agricultural inputs is required to ensure environmental safety and energy savings [4]. Scientists agree that global warming will be the main environmental problem in the future, having wide-ranging implications for agriculture and allied sectors. Global warming is a gradual increase in temperature due to an increase in greenhouse gases (GHGs). GHGs are a result of human activities and naturally occurring phenomena. Agriculture-related GHG emissions contribute about 10% to 12% of total man-made GHG emissions [5]. Different activities, including production, storage, transportation, input distribution, and their application with machinery result in fossil fuel combustion and energy use from substitute sources, responsible for GHG emissions. Therefore, an understanding of GHG emissions from various tillage operations, pesticides, fertilizers, irrigation, and harvesting is useful for the identification of substitutes, such as bio-fuel and renewable energy sources [5].
Protected agriculture is a cultivation practice in which farmers grow crops under an extended favorable climate (i.e., sophisticated heating, lighting, and cooling) to obtain higher crop yields as compared to open farming. In this practice, the crop is protected from meteorological adversities, pests, and diseases [6]. However, protected cultivation is responsible for the excessive use of different agricultural inputs such as pesticides and fertilizers [7]. Due to this, input–output energy estimation is useful for the development of a complete policy for the utilization and management of inputs in protected agriculture [4]. Energy is vital in agriculture which is used for ensuring food security, enhancing productivity, and rural development. The efficient use of energy is required for sustainable production in agriculture. The rapid population increase, scarcity of arable land, and improvements in the living standards were responsible for the increased use of energy in agriculture. Energy utilization in agriculture has also increased due to the intensive use of chemical fertilizers, fossil fuel, machinery, electricity, and pesticides. However, the excessive use of energy also causes some environmental and health problems. Therefore, the efficient utilization of inputs is important for the reduction in environmental problems as well as an increase in production and economic growth [8]. The excessive use of undesirable inputs is evident due to the limited technical knowledge of farmers [9].
Therefore, an input–output analysis of crops is important for policymakers for the evaluation of energy use in this sector [10] including production, the use of agricultural inputs, and machinery involved in fuel combustion, which emits GHGs. Energy use from different sources was responsible for GHGs [11]. In this context, it is clear that the estimation of energy is difficult in agriculture as compared to the industrial sector, but energy budgeting is also important in agriculture [8]. Agricultural production under a protected structure can control the cultivation environment and optimize the growth and development of crops. Figure 1 shows the tunnel structure in which farmers can cultivate fruits, vegetables, and flowers [12].
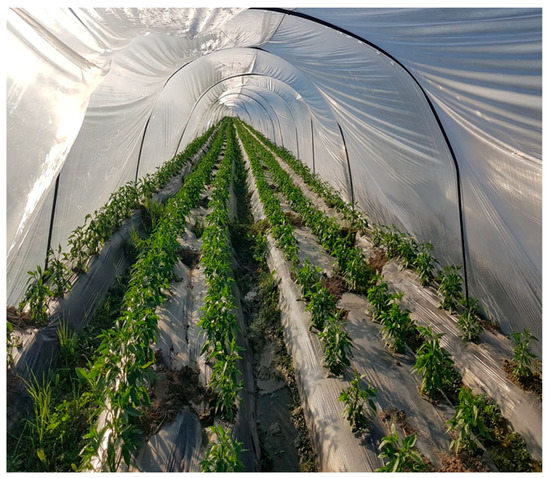
Figure 1.
Tunnel structure in Punjab, Pakistan.
In vegetables, tomato (Lycopersicon esculentum Mill) is ranked second after potato in the world with a production of 124.75 million tons. It is an indispensable component of the diet due to its usefulness in raw and cooked forms. It provides different vitamins, calcium, iron, fiber, and potassium. Lycopene is also found in tomatoes, which is useful for cancer patients [13].
In Pakistan, 20.9% of the GDP comes from agriculture, involving 43.5% of the labor force. In 2013–2014, in Pakistan, 63,200 ha of land was used to grow tomato with 599,700 tonnes of production, while in Punjab, 7800 ha of land was used to grow tomato with 100,100 tonnes of production [14]. Punjab province is located between 24–37° N and 62–75° E in the alluvial land of five south-flowing rivers named Chenab, Jhelum, Indus, Sutlej, and Ravi [15]. The climate of Punjab is adequate for growing vegetables in normal conditions as well as in the off-season. In tunnel farming, vegetables are grown under tunnels covered with plastic sheets that control the temperature and save solar energy. The area under plastic tunnels showed an increase due to an expansion in season and yield [14].
Thus, this study contributes to the literature in three ways: (a) by estimating the energy forms, energy ratios, and GHG in tomato cultivation under the tunnel structure, (b) estimating the energy forms, energy ratio, and GHG for three sub-groups according to operational landholding, and (c) exploring the regression results for energy output and various energy inputs in tomato cultivation under tunnels.
2. Literature Review
There are published reports available from different countries about energy estimation for crops such as tomato, cucumber, eggplant, pepper, cotton, greenhouse tomato, stake-tomato, cherries, melon, watermelon in Turkey [8,10,15,16,17,18,19,20], tomato, cucumber, garlic, wheat, strawberry in Iran [21,22,23,24], cotton in Greece [25], coriander, radish, lettuce, spinach in Colombia [26], tomato, onion, sweet pepper, hot pepper in Nigeria [27], and lettuce in Serbia [28]. Literature about GHG emissions for different crops is available for hazelnut, greenhouse cucumber, potato, and greenhouse and open-field strawberry cultivation in Iran [5,11,29,30]. Tunnel farming is different from a conventional greenhouse structure, and it is more profitable than open-field production, but the literature was not available on energy calculation in tomato cultivation under the tunnel structure in Pakistan. Additionally, no study was available about output–input energy analysis and GHGs in off-season/tunnel farming tomato production in Pakistan, an agriculture-based country.
In a study carried out in Turkey, Esengun et al. [31] explored energy utilization in open-field tomatoes (96,957.36 MJ ha−1), finding that 42% of energy comes from diesel, while the contribution of fertilizers and machinery remained around 38%. The ratio of input and output energy was found to be 0.80, while the value of energy productivity was 1.00 kg MJ ha−1. The share of non-renewable energy was 76%, and renewable energy was about 22%. It was believed that the intensive use of inputs could spearhead a higher yield of tomatoes, but it can also create problems related to global warming and pollution of the environment. Similarly, Heidari and Omid [23] performed energy analysis for vegetables grown in the greenhouse, and the highest total input energy was estimated for cucumber (141,493.51 MJ ha−1), followed by tomato (131,634.19 MJ ha−1). Likewise, Nabavi-Pelesaraei et al. [29] reported the input energy use (1284 GJ ha−1), output energy (125 GJ ha−1), and GHG emissions (82,724 kg CO2 eq. ha−1) in greenhouse cucumber. Similarly, Khoshnevisan et al. [11] found that the total GHG was 803.4 kg CO2 eq. ha−1 (open-field) and 35,083.5 kg CO2 eq. ha−1 (greenhouse) in strawberry cultivation. The total greenhouse gas emission was 803.4 kg CO2 eq. ha−1 and 35,083.5 kg CO2 eq. ha−1 in the open-field and greenhouse production, respectively. Ali et al. [32] estimated the GHG emission in cucumber cultivation under tunnels. The GHG emission was higher for large farms (19.63 kg CO2 eq. for 1000 kg production). The larger share of GHGs came from diesel fuel followed by fertilizer and machinery. Thus, the current study was designed to check the input energy, output energy, and GHG in tunnel farming tomato production. It also explored different energy ratios and energy forms. All empirical analyses were performed for three farm size categories.
3. Methodology
This study was based on the collection of primary data, collected from off-season tomato farmers in Punjab, Pakistan, using a structured questionnaire. The questionnaire was divided into different sub-sections, containing different questions about (a) tunnel structure, (b) land preparation, (c) seed transplantation, (d) hoeing, (e) fertilization, (f) irrigation, (g) chemicals, (h) labor, and (i) tomato output. The average time an interview took was 30 min, and major problems were (a) finding tomato farmers and (b) transportation costs. An agricultural farm, called Mian Shadi agriculture farm, located in tehsil Mamunkanjan, district Faisalabad, was considered the pioneer in vegetable cultivation under tunnels in Punjab. Faisalabad is ranked as the second biggest city in Punjab and has a large vegetable market. Kamalia, district Toba Tek Singh is a center of off-season vegetable production in Punjab. Thus, this study selected two districts named Faisalabad and Toba Tek Singh. Farmers were personally surveyed about input use and output with simple random sampling. The formula for sample size determination [8,13,22] is:
where n shows the required sample size, N represents the total targeted population, s2 shows the variance in the targeted population, t shows the t-value, which is 1.96 at the 5% significance level, and d is the 5% acceptable error [13]. The calculated sample size was 65 but it was increased to 70 for better results. The total farmers engaged in the cultivation of tomatoes under tunnel structures were further distributed into three sub-groups according to the operational land of farmers and producers. Farmers with 5 ha or less fell in the first category, while farmers with more than 5 ha and less than 12 fell in the second sub-group. Farmers having more than 12 ha were classified in the third category [10,13]. Data were analyzed using SPSS-15 and Microsoft Excel. To calculate the energy consumption in tomatoes under the tunnel structure, first, the average use of each input was estimated in the standard units, using a structured questionnaire. All inputs were estimated per ha, and the quantities of inputs were multiplied by their energy equivalent (Table 1). The sum of energy values for each input gave the total input energy. The amount of total tomato production was multiplied by the energy equivalent of tomato to find the total output energy. Energy ratios were estimated using the following expressions [13]:

Table 1.
Energy and GHG equivalents of agricultural input and output.
Moreover, the total amount of input energy was further distributed into various forms, including direct, indirect, renewable, non-renewable, commercial, and non-commercial. Conventional agriculture faced three challenges: (a) an energy deficit, (b) a reduction in profitability, and (c) the deterioration of natural resources. Therefore, it is beneficial to concentrate on several forms of energy used in crop production [32]. Direct energy is obtained from water, diesel, and human labor. On the other hand, indirect energy is obtained from plastic, machinery, chemicals, seeds, fertilizer, and farmyard manure. Renewable energy is obtained from human labor, seeds, water, and manure. Non-renewable energy means the energy from plastic, chemicals, diesel, machinery, and fertilizers. According to Bórawski et al. [33], the promotion of renewable energy sources could reduce the fossil fuel demand, thus playing a favorable role in environmental protection. The development of renewable energy sources is also beneficial for the economy and energy security. Commercial energy is energy from plastic, chemicals, seeds, diesel, fertilizers, water, and machinery. On the other hand, non-commercial energy means energy from farmyard manure and human labor [13]. The GHG emission was measured in kg CO2 eq. by using the coefficient of GHG for each agricultural input (Table 1). Quantities of inputs were multiplied by their respective GHG coefficient to find total GHG emissions. The GHG ratio was calculated with the expression [11,13]:
4. Results and Discussion
4.1. Agronomic Practices in Off-Season Tomato Production
Table 2 depicts the agronomic practices and their time period during off-season tomato production. Sahel and Dollar were the main seed varieties in off-season tomato production. The total number of seedlings was 32,526 ha−1, and those were planted double-side on a bed/ridge of 2.5 feet in width. In the initial stage, a one-month nursery was prepared for off-season tomato production. The first operation in off-season tomato production was ploughing and was performed in September or October. Commonly, MF-240 and Fiat NH-480 were used in the preparation of land along with different agricultural equipment. Tomato is a water-intensive crop, and irrigation was performed for almost the whole time period with different intervals depending upon the type of crop. Variations exist in the use of chemical spray, but farmers performed 24.99 sprays on average depending upon the type and intensity of disease attack. Some farmers started picking in February, but mostly, three-month picking was performed from March to May. A complete description of agronomic practices in off-season tomato production is given in Table 2.
Table 2.
Agronomic application in tomato production under tunnel structure.
4.2. Input–Output Energy in Off-Season Tomato
Table 3 reveals the physical quantities and energy of different inputs and outputs with respect to three farm size groups. It shows that 529.82 kg of plastic sheet, 0.26 kg of seed, 3039.41 h of human labor, 697.13 kg of nitrogen, 454.61 kg of phosphorus, 60.63 kg of potassium, 10.343 tonnes of farmyard manure, 81.51 kg of chemicals, 59.96 h of machinery, 7446.54 m3 of irrigation water, and 234.02 L of diesel were used for the per ha production of tomatoes. Labor is used in different farm operations, such as land preparation, nursery sowing, plant transplantation, hoeing, irrigation, fertilization, spraying, and picking. Thus, the number of labor hours increases with farm size. Large farmers preferred chemical fertilizers N, P, and K over farmyard manure. The per hectare production of off-season tomato was 68,013.59 kg, 72,453.29 kg, and 72,525.32 for the small to large farm size categories, while the weighted average was 70,955.80 kg ha−1. Tomato yield lay within the range of tomato yield showed in the literature, i.e., 22,392.9 kg ha−1 [20], 40,000 kg ha−1 [17], 45,358.7 kg ha−1 [10], 156,185.64 kg ha−1 [23], 159,685.7 kg ha−1 [19], and 200,000 kg ha−1 [16] under different growing conditions (open, glasshouse, and greenhouse).
Table 3.
Input usage and energy consumption in off-season tomato production.
Table 3 shows the energy consumption and output in off-season tomato production. A maximum of 47.81% of total input energy come from plastic sheets, which is a basic component of protected agriculture. A plastic sheet is used for mulching and covering tunnel structures. About 31.72% of total input energy came from fertilizers. The contribution of nitrogen was the maximum (26.33%), followed by phosphorus (3.23%). Farmyard manure contributed 1.77% of total input energy. The third-largest source of input energy was diesel (7.53%), followed by chemical (4.71%), labor (3.4%), water (2.68%), and machinery (2.15%) inputs. The average input energy was 175,089.3 MJ ha−1, and the total output energy was 56,764.64 MJ ha−1.
Table 4 reveals different energy ratios and energy forms in off-season tomato cultivation under a tunnel structure. On average, the energy use efficiency or output–input energy ratio was 0.332, which shows a decreasing trend with farm size. Energy use efficiency lay between the range of previous studies such as 0.10 [27], 0.30 [20], 0.70 [17], 0.80 [31], 0.80 [10], 1.20 [19], 1.26 [16], and 1.48 [23]. Energy productivity was 0.416 Kg MJ−1, which had a reciprocal association with farm size, which reasonably agrees with values reported in the literature: 0.09 Kg MJ−1 [19], 0.12 Kg MJ−1 [27], 0.36 Kg MJ−1 [20], 0.99 Kg MJ−1 [10], and 1.38 Kg MJ−1 [23]. The value of specific energy was 2.577 MJ Kg−1, while the net energy was −118,324.633 MJ ha−1. The specific energy was 1.14 MJ Kg−1 [17] and 1.82 MJ Kg−1 [23]. According to Heidari and Omid [23], the net energy in tomato production was also negative (−44,137.91 MJ ha−1). The share of commercial energy (94.83%) was more than the share from non-commercial energy (5.17%). The share of non-renewable energy (92.15%) was more than renewable energy (7.85%). The share of indirect energy (86.39%) was more than direct energy (13.61%). The share of indirect, commercial, and non-renewable energy was higher for large farm sizes.
Table 4.
Input–output energy ratios and energy forms in off-season tomato production.
4.3. Greenhouse Emission in Off-Season Tomato
Table 5 exposes the GHG (kg CO2 eq. ha−1) in off-season tomato production. GHG emissions were higher in the case of farmyard manure (38.03%) followed by nitrogen (26.45%), diesel (18.85%), machinery (7.79%), chemicals (5.88%), phosphorus (2.65%), and potassium (0.35%). In the literature, only Pishgar-Komleh et al. [30] used farmyard manure for GHG analysis in agriculture. On average, 3426.66 kg CO2 eq. ha−1 GHG was recorded in off-season tomato cultivation. The share of GHG emissions was higher for chemical fertilizer (37.27%) in potatoes [5], diesel fuel (61%) in greenhouse cucumber [30], nitrogen (35%) in open-field strawberries [11], and diesel fuel (33.84%) in hazelnut [29]. The GHG emissions in off-season tomato production were greater than the GHG emissions (77.66 kg CO2 eq. ha−1) in hazelnut [29] and potato (992.88 kg CO2 eq. ha−1) [5], and they were less than the GHG emissions in greenhouse strawberry (35,083.5 kg CO2 eq. ha−1) [11] and greenhouse cucumber (82,724 kg CO2 eq. ha−1) [30]. The GHG ratio was 64.46 kg CO2 eq.t−1 in off-season tomato production, which shows that the emissions of GHG were 64.46 kg CO2 eq. for 1000 kg tomato production.
Table 5.
GHG (kg CO2 eq. ha−1) in off-season tomato production.
Table 6 shows the econometric results between GHG emissions and energy imbalance and energy inputs in tomato cultivation under the tunnel structure. It also explores the coefficient of pairwise correlation between the variables. This model was good according to R2 (0.756). A significant F-stat indicates the overall reliability of the regression model. The impact of an increase (of 1%) in energy imbalance is positive (0.09%) and significant on GHG emissions. A positive and significant increase in GHG was also observed for a 1% rise in the value of farmyard manure and diesel. A significant and negative impact on GHG emissions was observed in the case of chemicals and machinery. These figures are generally accepted, as the tunnel structure would potentially adsorb the emissions as well as curtail the energy imbalance by capturing the potential leakages as well as improving its efficiency [35,36].
Table 6.
Econometric result of GHG emission (endogenous variable: lnGHG).
5. Conclusions and Policy Implications
The analysis of energy and GHG emissions is very important to contribute to the analysis of the actual environmental condition of critical/productive areas of the world. The current study was designed to estimate the energy use, production, and emissions of GHG in per ha off-season/tunnel farming tomato production in Punjab, Pakistan. A total of 70 respondents were distributed into three sub-groups according to farm size. On average, the total input energy was 175,089.3 MJ ha−1, while the total output energy was 56,764.64 MJ ha−1 in off-season tomato production.
The use of plastic sheets contributed most (47.81%) to the total input energy followed by fertilizers (31.72%), diesel (7.53%), chemicals (4.71%), labor (3.4%), irrigation water (2.68%), and machinery (2.15%). The total output energy showed an increasing trend with farm size, while energy use efficiency showed a decreasing trend with farm size. Energy use efficiency was 0.332, which was less than a sufficient level (0.80), as pointed out by [10]. Energy use efficiency was higher for medium farm size groups (0.356) and lower (0.309) in the case of large farm size groups, which shows that medium farmers made better use of energy resources. On average, the energy production was 0.416, which indicates 0.416 kg production of tomatoes by using 1 MJ of energy inputs. On average, the specific energy was 2.577 MJ Kg−1 in off-season tomato production, which shows that input energy use was 2.577 MJ for 1 kg production of off-season tomato. The net energy was negative (−118,324.633 MJ ha−1), which shows that the energy output was lower than the energy inputs. These energy parameters related to efficiency as well as emission figures point toward a massive intervention to curb the energy wastage that too is harmful in terms of excessive emissions of GHGs at the farmers’ fields.
All these energy calculations paint different views of the same picture which indicate the margin of increasing output energy or decreasing input energy use. The use of indirect energy (86.39%) was more than direct energy (13.61%). Similarly, the use of non-renewable energy (92.15%) and commercial energy (94.83%) was higher than their counterparts. The estimation of greenhouse gases is very important in agricultural production to check to what extent the growth of a crop damages the environment. GHG emissions were higher from farmyard manure (38.03%) followed by nitrogen (26.45%), diesel (18.85%), machinery (7.79%), chemicals (5.88%), phosphorus (2.65%), and potassium (0.35%). The total GHG emissions were lower for large farm size groups (3197.57 kg CO2 eq. ha−1) due to less use of farmyard manure. The GHG ratio showed that the GHG was 64.46 kg CO2 eq. for 1000 kg tomato production.
The findings of the study pointed out the inefficient use of inputs with respect to energy and GHG emissions. Fertilizers were found to be the leading element both in energy input consumption and GHG emissions. This shows that fertilizers were unconsciously used by the farmers, but they are harmful to the environment. The efficient utilization of energy resources is important for sustainable agriculture and the cleaning of the environment. The econometric impact of diesel was higher as compared to other inputs. The government should introduce some environmentally friendly fuel for use in machinery. The GHG emissions showed a reduction due to the increase in machinery. It is the responsibility of agriculture extension personnel to conduct regular meetings with vegetable producers and guide them on the efficient use of energy inputs. The government should ensure the availability of extension staff by organizing training programs.
Author Contributions
Conceptualization, Q.A., A.A. and B.A.A.; methodology, M.T.I.K., B.A.A., S.B. and A.T.; software, A.A., Q.A. and B.A.A.; validation, A.A. and M.T.I.K.; formal analysis, Q.A., M.T.I.K. and A.T.; investigation, B.A.A., S.B. and Q.A.; resources, B.A.A., M.T.I.K. and M.T.; data curation, A.A. and B.A.A.; writing—original draft preparation, Q.A., M.T.I.K. and B.A.A.; writing—review and editing, A.A. and B.A.A.; visualization, Q.A., A.A., M.T. and S.B.; supervision, A.A., S.B., and B.A.A.; project administration, Q.A. and M.T.I.K.; funding acquisition, B.A.A. and A.T. All authors have read and agreed to the published version of the manuscript.
Funding
This research was funded by Researchers Supporting Project Number (RSP2022R443), King Saud University, Riyadh, Saudi Arabia.
Institutional Review Board Statement
Ethical approval obtained from the Institutional Review Board of the second author.
Informed Consent Statement
The participating farmers were made fully aware about the purpose and nature of information being sought from them before formal interview process.
Data Availability Statement
Data can be made available on request.
Conflicts of Interest
The authors declare no conflict of interest.
References
- Laso, J.; Hoehn, D.; Margallo, M.; García-Herrero, I.; Batlle-Bayer, L.; Bala, A.; Fullana-i-Palmer, P.; Vázquez-Rowe, I.; Irabien, A.; Aldaco, R. Assessing energy and environmental efficiency of the Spanish agri-food system using the LCA/DEA methodology. Energies 2018, 11, 3395. [Google Scholar] [CrossRef] [Green Version]
- Nisar, S.; Benbi, D.K.; Toor, A.S. Energy budgeting and carbon footprints of three tillage systems in maize-wheat sequence of north-western Indo-Gangetic Plains. Energy 2021, 229, 120661. [Google Scholar] [CrossRef]
- Khan, M.T.I.; Yaseen, M.R.; Ali, Q. Nexus between financial development, tourism, renewable energy, and greenhouse gas emission in high-income countries: A continent-wise analysis. Energy Econ. 2019, 83, 293–310. [Google Scholar] [CrossRef]
- Khanali, M.; Movahedi, M.; Yousefi, M.; Jahangiri, S.; Khoshnevisan, B. Investigating energy balance and carbon footprint in saffron cultivation—A case study in Iran. J. Clean. Prod. 2016, 115, 162–171. [Google Scholar] [CrossRef]
- Pishgar-Komleh, S.H.; Ghahderijani, M.; Sefeedpari, P. Energy consumption and CO2 emissions analysis of potato production based on different farm size levels in Iran. J. Clean. Prod. 2012, 33, 183–191. [Google Scholar] [CrossRef]
- Phani, V.; Khan, M.R.; Dutta, T.K. Plant-parasitic nematodes as a potential threat to protected agriculture: Current status and management options. Crop Prot. 2021, 144, 105573. [Google Scholar] [CrossRef]
- He, X.; Qiao, Y.; Liu, Y.; Dendler, L.; Yin, C.; Martin, F. Environmental impact assessment of organic and conventional tomato production in urban greenhouses of Beijing city, China. J. Clean. Prod. 2016, 134, 251–258. [Google Scholar] [CrossRef]
- Kizilaslan, H. Input–output energy analysis of cherries production in Tokat Province of Turkey. Appl. Energy 2009, 86, 1354–1358. [Google Scholar] [CrossRef]
- Imran, M.; Ozcatalbas, O. Optimization of energy consumption and its effect on the energy use efficiency and greenhouse gas emissions of wheat production in Turkey. Discov. Sustain. 2021, 2, 28. [Google Scholar] [CrossRef]
- Cetin, B.; Vardar, A. An economic analysis of energy requirements and input costs for tomato production in Turkey. Renew. Energy 2008, 33, 428–433. [Google Scholar] [CrossRef]
- Khoshnevisan, B.; Shariati, H.M.; Rafiee, S.; Mousazadeh, H. Comparison of energy consumption and GHG emissions of open field and greenhouse strawberry production. Renew. Sustain. Energy Rev. 2014, 29, 316–324. [Google Scholar] [CrossRef]
- Yano, A.; Cossu, M. Energy sustainable greenhouse crop cultivation using photovoltaic technologies. Renew. Sustain. Energy Rev. 2019, 109, 116–137. [Google Scholar] [CrossRef]
- Ali, Q.; Yaseen, M.R.; Khan, M.T.I. Energy budgeting and greenhouse gas emission in cucumber under tunnel farming in Punjab, Pakistan. Sci. Hortic. 2019, 250, 168–173. [Google Scholar] [CrossRef]
- Ali, Q.; Khan, M.T.I.; Khan, M.N.I. Impact of energy efficiency improvement on greenhouse gas in off-season tomato farming: Evidence from Punjab, Pakistan. Adv. Energy Res. 2017, 5, 207–217. [Google Scholar]
- Farooqi, A.; Masuda, H.; Firdous, N. Toxic fluoride and arsenic contaminated groundwater in the Lahore and Kasur districts, Punjab, Pakistan and possible contaminant sources. Environ. Pollut. 2007, 145, 839–849. [Google Scholar] [CrossRef]
- Ozkan, B.; Kurklu, A.; Akcaoz, H. An input-output energy analysis in greenhouse vegetable production: A case study for Antalya region of Turkey. Biomass Bioenergy 2004, 26, 89–95. [Google Scholar] [CrossRef]
- Canakci, M.; Topakci, M.; Akinci, I.; Ozmerzi, A. Energy use pattern of some field crops and vegetable production: Case study for Antalya Region, Turkey. Energy Convers. Manag. 2005, 46, 655–666. [Google Scholar] [CrossRef]
- Yilmaz, I.; Akcaoz, H.; Ozkan, B. An analysis of energy use and input costs for cotton production in Turkey. Renew. Energy 2005, 30, 145–155. [Google Scholar] [CrossRef]
- Hatirli, S.A.; Ozkan, B.; Fert, C. Energy inputs and crop yield relationship in greenhouse tomato production. Renew. Energy 2006, 31, 427–438. [Google Scholar] [CrossRef]
- Ozkan, B.; Ceylan, R.F.; Kizilay, H. Comparison of energy inputs in glasshouse double crop (fall and summer crops) tomato production. Renew. Energy 2011, 36, 1639–1644. [Google Scholar] [CrossRef]
- Shahan, S.; Jafari, A.; Mobli, H.; Rafiee, S.; Karimi, M. Energy use and economical analysis of wheat production in Iran: A case study from Ardabil province. J. Agric. Technol. 2008, 4, 77–88. [Google Scholar]
- Banaeian, N.; Omid, M.; Ahmadi, H. Energy and economic analysis of greenhouse strawberry production in Tehran province of Iran. Energy Convers. Manag. 2011, 52, 1020–1025. [Google Scholar] [CrossRef]
- Heidari, M.; Omid, M. Energy use patterns and econometric models of major greenhouse vegetable productions in Iran. Energy 2011, 36, 220–225. [Google Scholar] [CrossRef]
- Samavatean, N.; Rafiee, S.; Mobli, H.; Mohammadi, A. An analysis of energy use and relation between energy inputs and yield, costs and income of garlic production in Iran. Renew. Energy 2011, 36, 1808–1813. [Google Scholar] [CrossRef]
- Tsatsarelis, C. Energy requirements for cotton production in central Greece. J. Agric. Eng. Res. 1991, 50, 239–246. [Google Scholar] [CrossRef]
- Bojaca, C.; Schrevens, E. Energy assessment of peri-urban horticulture and its uncertainty: Case study for Bogota, Colombia. Energy 2010, 35, 2109–2118. [Google Scholar] [CrossRef]
- Ibrahim, H.Y. Energy use pattern in vegetable production under fadama in north central Nigeria. Trop. Subtrop. Agroecosystems 2011, 14, 1019–1024. [Google Scholar]
- Djevic, M.; Dimitrijevic, A. Energy consumption for different greenhouse constructions. Energy 2009, 34, 1325–1331. [Google Scholar] [CrossRef]
- Nabavi-Pelesaraei, A.; Sadeghzadeh, A.; Payman, M.H.; Mobtaker, H.G. An analysis of energy use, CO2 emissions and relation between energy inputs and yield of hazelnut production in Guilan province of Iran. Int. J. Adv. Biol. Biomed. Res. 2013, 1, 1601–1613. [Google Scholar]
- Pishgar-Komleh, S.H.; Omid, M.; Heidari, M.D. On the study of energy use and GHG (greenhouse gas) emissions in greenhouse cucumber production in Yazd province. Energy 2013, 59, 63–71. [Google Scholar] [CrossRef]
- Esengun, K.; Erdal, G.; Gunduz, O.; Erdal, H. An economic analysis and energy use in stake-tomato production in Tokat province of Turkey. Renew. Energy 2007, 32, 1873–1881. [Google Scholar] [CrossRef]
- Jat, H.S.; Jat, R.D.; Nanwal, R.K.; Lohan, S.K.; Yadav, A.K.; Poonia, T.; Sharma, P.C.; Jat, M.L. Energy use efficiency of crop residue management for sustainable energy and agriculture conservation in NW India. Renew. Energy 2020, 155, 1372–1382. [Google Scholar] [CrossRef]
- Bórawski, P.; Bełdycka-Bórawska, A.; Szymańska, E.J.; Jankowski, K.J.; Dubis, B.; Dunn, J.W. Development of renewable energy sources market and biofuels in the European Union. J. Clean. Prod. 2019, 228, 467–484. [Google Scholar] [CrossRef]
- Nalley, L.; Popp, M.; Fortin, C. The impact of reducing greenhouse gas emissions in crop agriculture: A spatial-and production-level analysis. Agric. Resour. Econ. Rev. 2011, 40, 63–80. [Google Scholar] [CrossRef]
- de Villiers, D.S.; Wien, H.C.; Reid, J.E.; Albright, L.D. Energy use and yields in tomato production: Field, high tunnel and greenhouse compared for the northern tier of the USA (upstate New York). Acta Hortic. 2011, 893, 373–380. [Google Scholar] [CrossRef]
- Rogers, M.A.; Wszela, A.L. Influence of High Tunnel Production and Planting Date on Yield, Growth, and Early Blight Development on Organically Grown Heirloom and Hybrid Tomato. HortTechnology 2012, 22, 452–462. [Google Scholar] [CrossRef] [Green Version]

Publisher’s Note: MDPI stays neutral with regard to jurisdictional claims in published maps and institutional affiliations. |
© 2022 by the authors. Licensee MDPI, Basel, Switzerland. This article is an open access article distributed under the terms and conditions of the Creative Commons Attribution (CC BY) license (https://creativecommons.org/licenses/by/4.0/).