Article

Impacts of Biochar on Hydro-Physical Properties of Sandy Soil under Different Irrigation Regimes for Enhanced Tomato Growth

by
Abdulaziz G. Alghamdi
1,*,
Abdulrasoul Al-Omran
1,
Arafat Alkhasha
1 and
Abdulaziz R. Alharbi
2
1
Soil Sciences Department, College of Food and Agricultural Sciences, King Saud University, P.O. Box 2460, Riyadh 11451, Saudi Arabia
2
Plant Production Department, College of Food and Agricultural Sciences, King Saud University, P.O. Box 2460, Riyadh 11451, Saudi Arabia
*
Author to whom correspondence should be addressed.
Agronomy 2022, 12(8), 1762; https://doi.org/10.3390/agronomy12081762
Submission received: 19 June 2022 / Revised: 16 July 2022 / Accepted: 22 July 2022 / Published: 27 July 2022

Abstract

:
The performance of biochar application in water conservation, salt distribution, water infiltration, and tomato growth was evaluated under regulated deficit irrigation (RDI) (40%, 60% and 80% of ETc) and partial root drying (PRD) systems by using different quality irrigation water. Date palm derived biochar was applied to sandy soil at 4% (w/w) in pots, and tomato was grown as the test crop under greenhouse conditions. The results indicated that soil moisture was decreased by 27.38% to 24.95% without biochar application at different levels of irrigation, whereas it increased by 8.11% and 5.48% with biochar application, compared with control treatment of 100% of ETc. Soil moisture was decreased by 12.78%, 15.82% and 12.78% for the 1st stage, 2nd stage and 3rd growth stage, respectively, while it increased by 37.93% at the 4th growth stage compared with full irrigation. Soil salinity ranged between 0.5 and 1.4 dS·m−1 with biochar application, while 0.7–2.1 dS·m−1. Cumulative infiltration at one minute varied between 1.89 and 2.79 cm and 1.74 and 2.79 cm for biochar and non-biochar treatments, respectively. Infiltration rate varied from 0.98 to 2.63 cm min−1 and 1.48 to 1.68 cm·min−1 for fresh and saline water, respectively. Overall, the results revealed that biochar application substantially improved the characteristics of sandy soil, subsequently resulting in water conservation.

1. Introduction

Most of the Kingdom of Saudi Arabia, which exceeds two million square km, is considered to be one of the driest areas in the world. Water used for irrigation is one of the most important factors that affects agricultural activities, and 85% of the total water consumed in the country is used for irrigation [1]. Sandy and sandy loam soils are dominant and need careful management because of their low water holding capacity, high infiltration rate, and low clay content. The Kingdom has had a shift in policy requiring water conservation. Adaption of modern water saving technologies is a key in increasing water use efficiency while maintaining good production.
Among these methods is the addition of soil amendments, whether natural such as biochar, or synthetic. They improve the physical, chemical, or biological properties of the soil [2]. Biochar is used to improve crop growth in sandy soils under unfavorable environmental conditions, such as drought, extreme high temperature, unfavorable soil pH, and low available water [2,3,4,5,6].
Biochar is a carbon-rich product formed by the incomplete combustion of biomass from organic residues. The pyrolytic process used to produce biochar is usually conducted at high temperatures under oxygen limited conditions [7]. Biochar is characterized by a large surface area, negative surface charge, large charge density, and a highly porous structure [8]. Application of biochar improves soil properties and subsequently increase crop production, while at the same time it helps to mitigate the negative impact of global warming [9]. The application of biochar can improve the hydraulic properties of soils to increase agricultural production, such as lowering the infiltration rate, reducing evaporation, decreasing hydraulic conductivity, increasing available water, and reducing bulk density. Application of biochar as a soil amendment is considered as a means to enhance soil physical properties and hydrological parameters [10]. Agbna et al. [11] concluded that, under deficit irrigation, biochar derived from wheat straw could improve irrigation water use efficiency and the quality of fruits of tomato plants grown in a greenhouse. Likewise, Yu et al. [12] reported that biochar as an amendment is not only effective but also affordable for improving the physical, chemical, and biological properties of sandy soils.
Recently, biochar produced from the carbonization of tree wastes has been successfully used in arid regions to improve chemical and physical properties of sandy soils [13,14,15]. In a recent study, Kapoor et al. [16] reported that long-term application of biochar to soil could improve soil moisture retention, aggregate stability, pH, cation exchangeable capacity, nutrient retention, and microbial growth. Likewise, Šimanský et al. [17] reported that application of different biochars to sandy soils could improve soil properties such as pore size distribution, soil-air content, soil structure, and water retention capacity (WRC). Haider et al. [18] reported that the application of biochar could enhance physicochemical properties and increase surface area, porosity, and water holding capacity.
The methods of deficit irrigation (DI) and partial root-zone drying (PRD) have been used extensively to save water and increase water use efficiency (WUE) [2]. In these methods, crops are deliberately exposed to some degree to shortage of water through all growth stages or at certain stages. However, before using DI, one should have the knowledge of crop water requirements, crop response to water stress, critical stages of growth under water stress for each crop, and the economic effects on yield [19]. Alrajhi et al. [20] reported that there were no significant changes in saturated hydraulic conductivity under different scenarios of partial root-zone drying (PRD) irrigation. Likewise, Sepaskhah and Ahmadi [21] showed that PRD is a good technique for deficit irrigation on agronomic and horticultural farms. In PRD, irrigation water can be conserved and saved until 50% evapotranspiration without significant reductions in yield. In another study, using full irrigation (FI), DI, and PRD irrigation for tomato under greenhouse conditions, Akhtar et al. [22] concluded that biochar applied to soil at rates of 0% and 5% by weight resulted in an increased soil moisture content and yield production. The results showed that, with biochar addition, an increase in WUE by 35% and 15% for PRD and DI, respectively, compared to FI, and an increase in fruit yield of tomato by 20% and 13% for FI and PRD, respectively, compared to the untreated soil. The results showed that deficit irrigation can conserve water and increase water use efficiency. However, little research has been done considering the effects of deficit irrigation and biochar on salinity and water distribution in soil. Therefore, the aim of this study was to investigate under greenhouse conditions the effects of DI and PRD irrigations, as well as irrigation water quality, on water distribution, salinity, and infiltration in a calcareous soil amended with date palm waste biochar.

2. Materials and Methods

2.1. Location of the Experiments

This study was carried out under greenhouse conditions at the Almohous Commercial Farms, which are 120 km northwest of Riyadh city, the Kingdom of Saudi Arabia. The farms are located at 25°17′40″ N, 45°52′55″ E with an average elevation of +722 m.

2.2. Analysis of Soil and Water

Soil and water samples were collected from the greenhouse prior to the experiments. Analyses of the water samples included EC and pH, which were conducted using an EC meter (Test kit Model 1500_20 Cole and Parmer) and a pH meter (pH meter-CG 817), respectively. Water-soluble sodium (Na+), potassium (K+), magnesium (Mg2+), calcium (Ca2+), sulfate (SO42−) and chloride (Cl) were measured by an ion chromatography device (ICS 5000, Thermo, Waltham, MA, USA). Soluble carbonate (CO32−) and bicarbonate (HCO3) concentrations were measured using a titration method with acid [23]. The results of chemical analyses of water and soil are shown in Table 1.
The soil extract was prepared using saturated soil paste, and electrical conductivity (ECe), pH, and soluble ions were determined in the extracts according to Sparks [24]. Soil-water soluble Ca2+, Mg2+, Na+, and K+ were determined using inductively coupled plasma emission spectroscopy (Perkin Elmer Optima 4300 DV ICP-OES). CO32−, HCO3 and Cl were determined by titration with acid and AgNO3 respectively. The turbidity method was used to determine SO42−, as described by Tabatabai [25]. Soil particle size distribution was determined using the hydrometer method after organic matter and total carbonate removal [26]. Lime content (CaCO3%) was measured using the calcimeter method as described by Loeppert and Suarez [27] (Table 1).

2.3. Preparation of the Biochar

Biochar was produced in a greenhouse complex at Almohous Farms, 120 km northwest of Riyadh city, the Kingdom of Saudi Arabia. Leaves of the date palm were used, without leaflets, as the source material for biochar production. The leaves were collected from different locations, exposed to direct sunlight to dry out, and then the petiole bases (fronds) were cut down to small pieces (20–30 cm). The pieces were packed in the biochar kiln. The kiln consisted of a stainless-steel cylinder container covered tightly to minimize the air volume and provide almost oxygen-free conditions. The kiln was subjected to pyrolysis at a temperature of 400–450 ± 10 °C. After pyrolysis, the biochar pieces were crushed manually by a 12 kg hammer, ground using an electrical grinder, and screened through a 2 mm sieve. The proximate analyses of biochar such as moisture content, mobile materials, ash, and fixed carbon (resident materials), were determined according to ASTM D1762-84 [28]. The specific surface area was estimated by the Brunauer–Emmett–Teller (BET) method using adsorption of pure nitrogen by using Micromeritics ASAP 2020 BET Surface Area and Porosity Analyzer (Micromeritics Instrument Co., Norcross, GA, USA). An aqueous extract 1:10 (w/v) from the biochar was used for determining EC and pH, which were measured with a conductivity meter and pH meter, respectively. Carbon (C), hydrogen (H), and nitrogen (N) contents were measured using a CHN analyzer (Series II; PerkinElmer, Waltham, MA, USA). Results of physiochemical and proximate analyses of the biochar are given in Table 2).

2.4. Experimental Layout

Eighteen treatments were used in the greenhouse experiment to investigate the effect of date palm biochar at a rate of 4% (w/w). Nine of them were tested under deficit irrigation and the other nine treatments were under partial root drying. Two sources of water were used: fresh water with EC 0.9 dS/m and saline water with EC 3.61 dS/m. Biochar was added to the soil and mixed manually into the soil surface layer. The crop that was planted was tomato (Solanum lycopersicum). Soil moisture devices (Decagon Devices (5TE) (now METER Group, Pullman, WA, USA)) were installed in the soil. Deficit irrigation was 40%, 60% and 80% of ETc. The control was 100% of ETc. Partial root drying was applied at different growth stages. Irrigation pipes measured 2 inches, which was the main, and 0.5 inches, which was the lateral line. Measurements of soil moisture and soil salinity were taken throughout the crop growth stages (first, second, third, and last). The combination of treatments using both saline and fresh water are presented in Table 3).

2.5. Water Content and Salt Sensors

Decagon Devices (5TE) (now METER Group, Pullman, WA, USA) sensors for gravimetric soil water content and salinity monitoring were installed in the soil at different depths 0–15, 15–30, and 30–45 cm, under all deficit irrigation levels. All treatments were replicated three times. The impacts of different treatments on the output of the sensors were evaluated using statistical analysis, as described in Section 2.7.

2.6. Cumulative Infiltration

Infiltration was measured by a mini-disk infiltrometer that held 100 cm3 water (model M11, 0.5 cm suction; METER Group, Pullman, WA, USA). The volume of water infiltrated was recorded every 30 s until the water was emptied from the mini-disk infiltrometer. Cumulative infiltration was based on the Philip equation, shown in Equation (1), and the infiltration rate (i) was determined by Equation (2).
I = S t + A t ,
where: I is the cumulative infiltration (cm), S is the sorptivity (cm min−0.5), and A is a constant related to the hydraulic conductivity. A mathematical representation for Equation (1) was obtained by plotting cumulative infiltration versus the square root of time, and a second-order polynomial was fitted to the measured data.
i = 1 2 S   t 1 2 + A .
A mathematical representation Appendix A for Equation (2) was obtained by plotting infiltration rate versus 1/(2 t 0.5) and fitting a linear equation to the measured data.

2.7. Statistical Analysis

Means were determined and statistical analyses were carried out using ANOVA, and the least significant difference (LSD at p < 0.05) was determined using the software package for Windows (IBM SPSS Statistics 21 Core System, IBM Corporation 2019, Armonk, NY, USA).

3. Results and Discussion

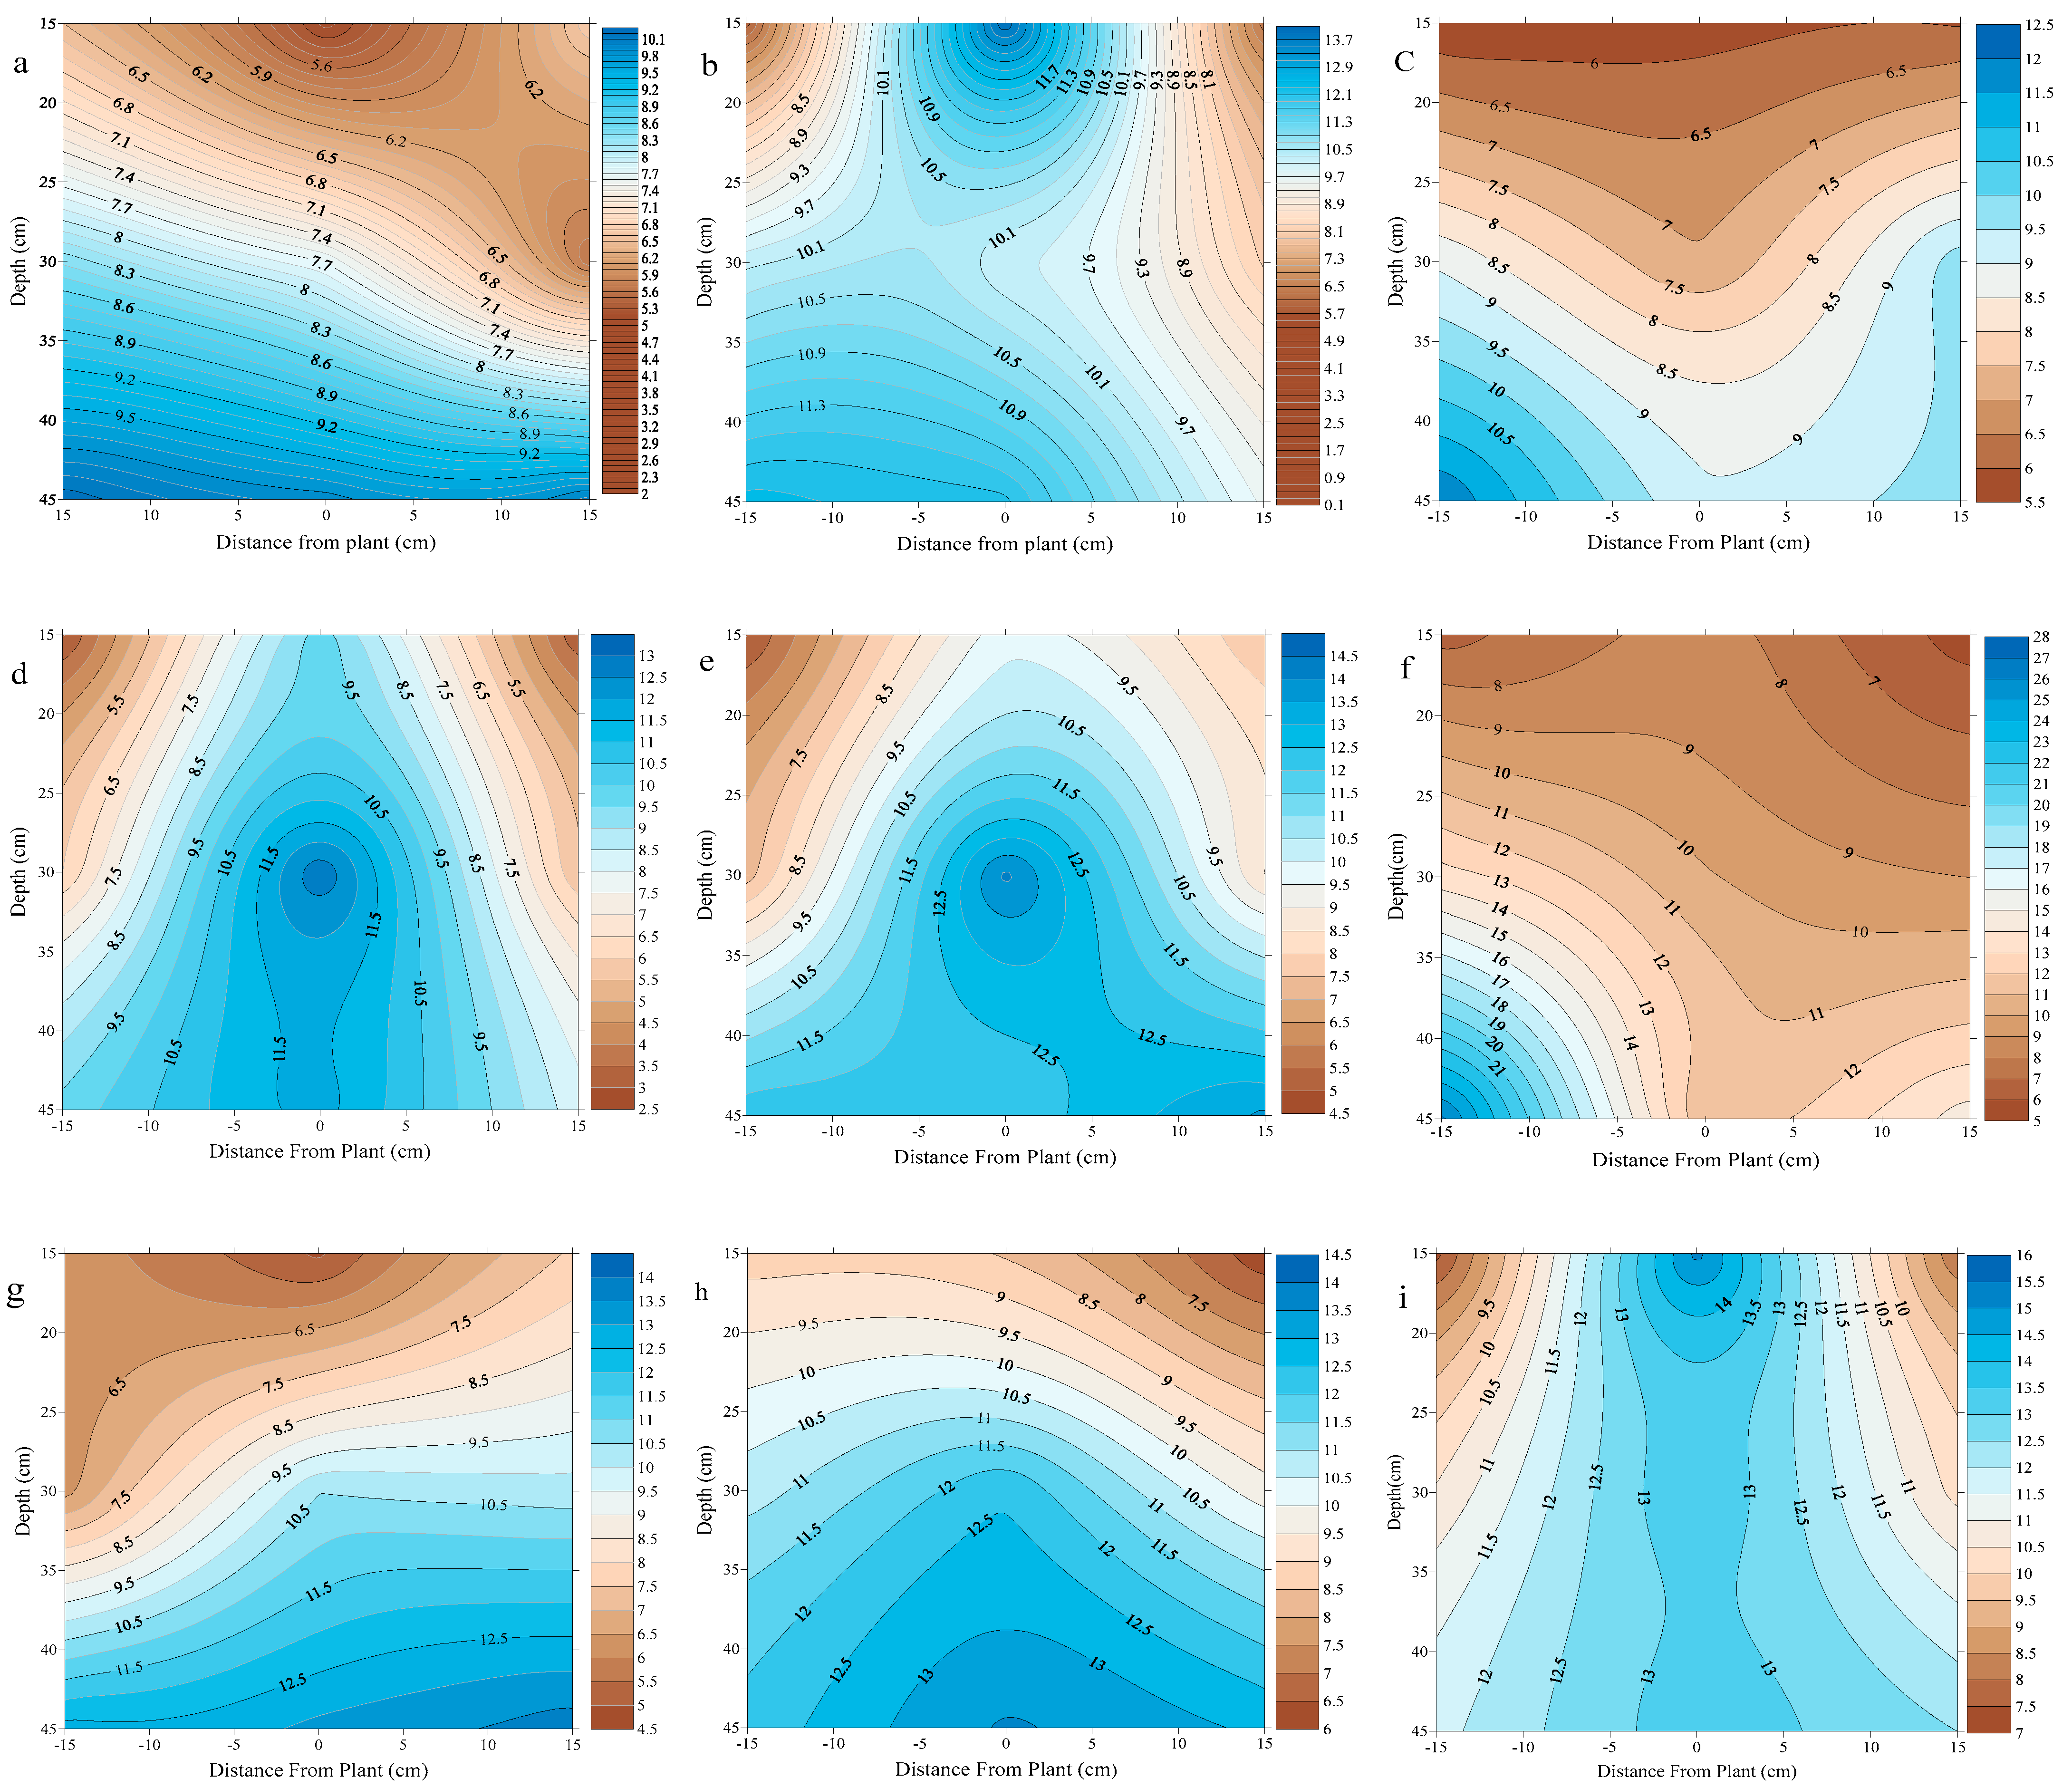
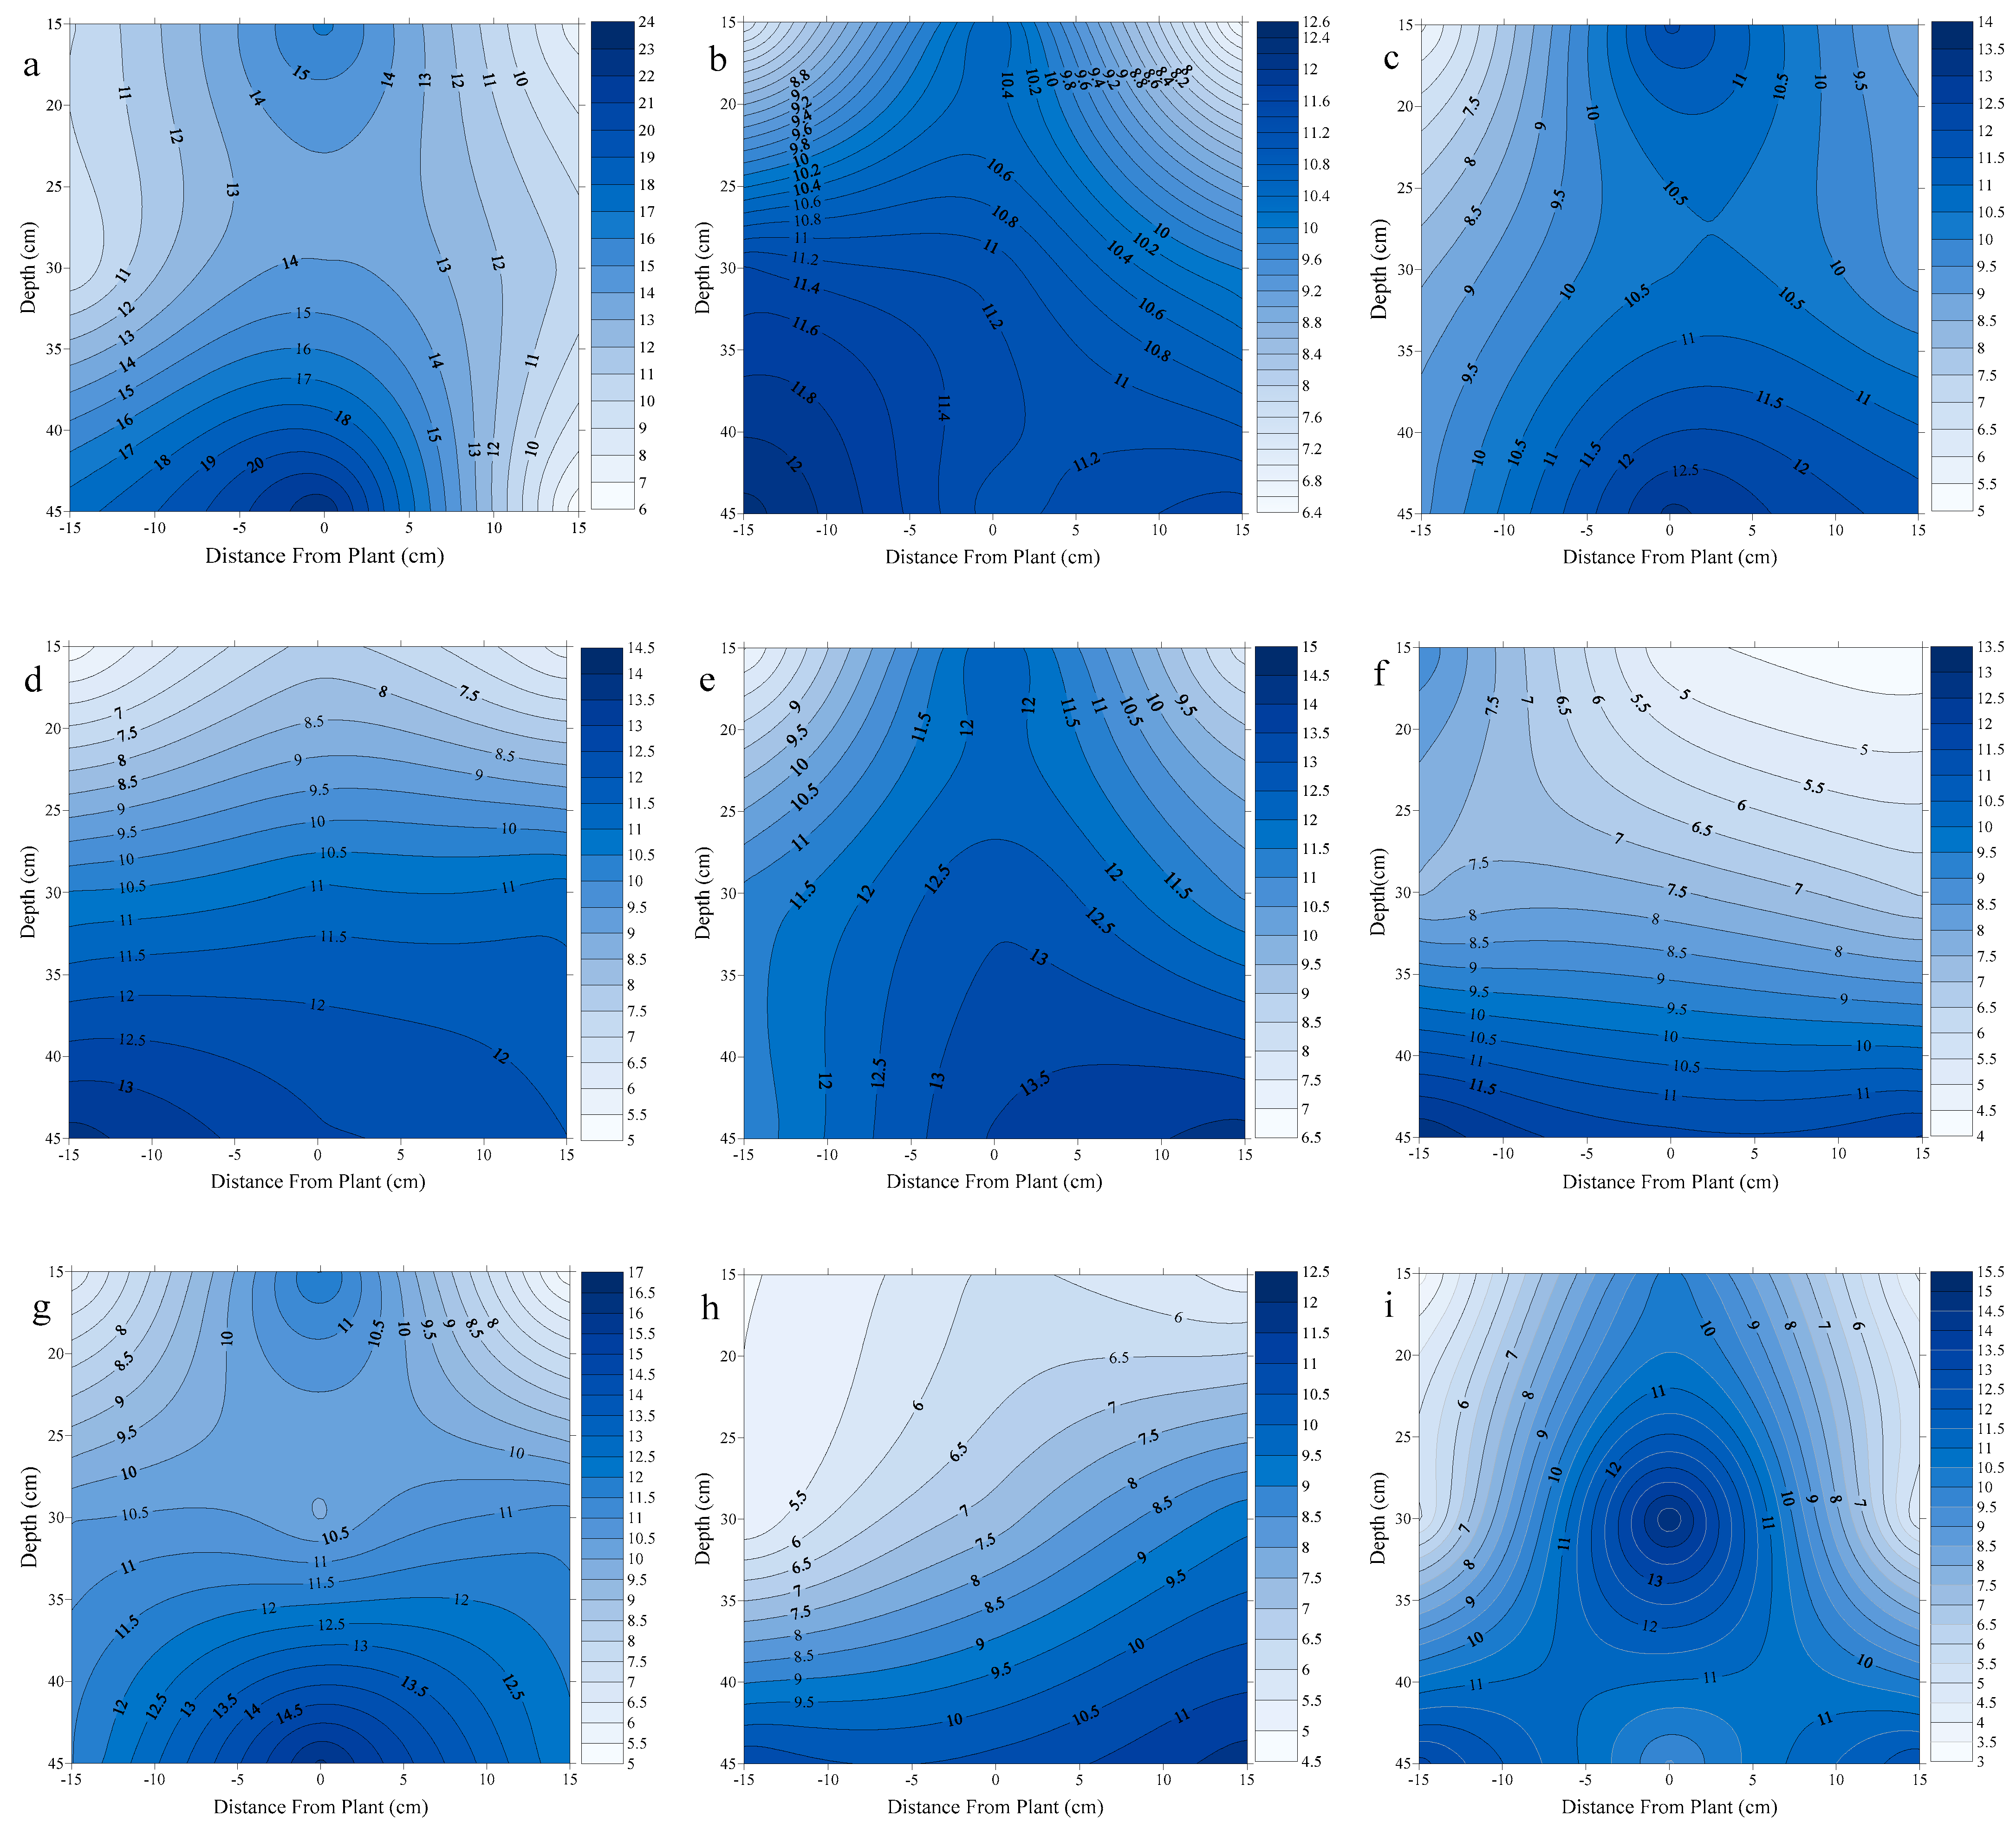
3.1. Soil Moisture Distribution

The soil moisture distribution (SMD) in the root zone with different irrigation regimes including regulated deficit and PRD with fresh water are graphically represented in a contour plot Figure 1. The SMD with regulated deficit irrigation for 100%, 80%, 60% and 40% ETc are shown in Figure 1a–d respectively. Treatments a and c were without biochar, b and d were with biochar. Results for the soil water content are shown for depths of 0–15, 15–30, and 30–45 cm. The water distribution patterns were different between amended soil and non-amended soil. The highest SMD values were observed under the dripper. With biochar application, soil moisture was higher, especially in the surface layers of the soil. The average decrease in moisture content at a depth of 0–30 cm ranged between 27.38% to 24.95% for all treatments, which were without biochar. Furthermore, moisture content was increased between 8.11% and 5.48% for treatments of biochar, compared with full irrigation treatment (Figure 1e). Figure 1i shows the SMD under partial root drying during four growth stages, respectively. Figure 1f–h show data without biochar, and Figure 1g–i show data with biochar. Compared to the full irrigation, values decreased by 12.78%, 15.82% and 12.78% for the 1st stage, 2nd stage, and 3rd stage, respectively. In contrast, in the last (4th) stage of growth it increased by 37.93%. These findings might be related to the water consumed by the plant.
Figure 2 shows the SMD after amending the soil with biochar and irrigating with saline water. Figure 2b–e show the water distribution during different stages of plant growth with saline water applied during partial root drying. Compared with full PRD, soil moisture decreased by 20.50%, 20.59%, 37.50% and 9.56% for first, second, third, and fourth stages of plant growth, respectively. Appling biochar with saline water led to more water retention, especially in the last stage of the growth. This could lower water consumption by the plants. Application of regulated deficit irrigation with saline water resulted in a decrease in moisture in the root zone. This could be related to the restriction of water movement by salts and increased evaporation. Soil moisture decreased by 55.15%, 22.06%, 48.53% and 19.12% for RDI of 100%, 80%, 60% and 40% ETc, respectively. Similar results were reported by De-Melo et al. [29], who observed an increased level of available soil water for plants with an application rate of 0.8% biochar in an upper soil layer. Vitkova et al. [30] concluded that biochar amended at a rate of 20 t ha−1 had a positive effect on soil water content, which was strongly related to the type of the crop grown. Novak et al. [31] found that application of biochar enhanced moisture storage by 0.5 to 0.8 cm of water per 15 cm of soil depth in Ultisols and arid soils.

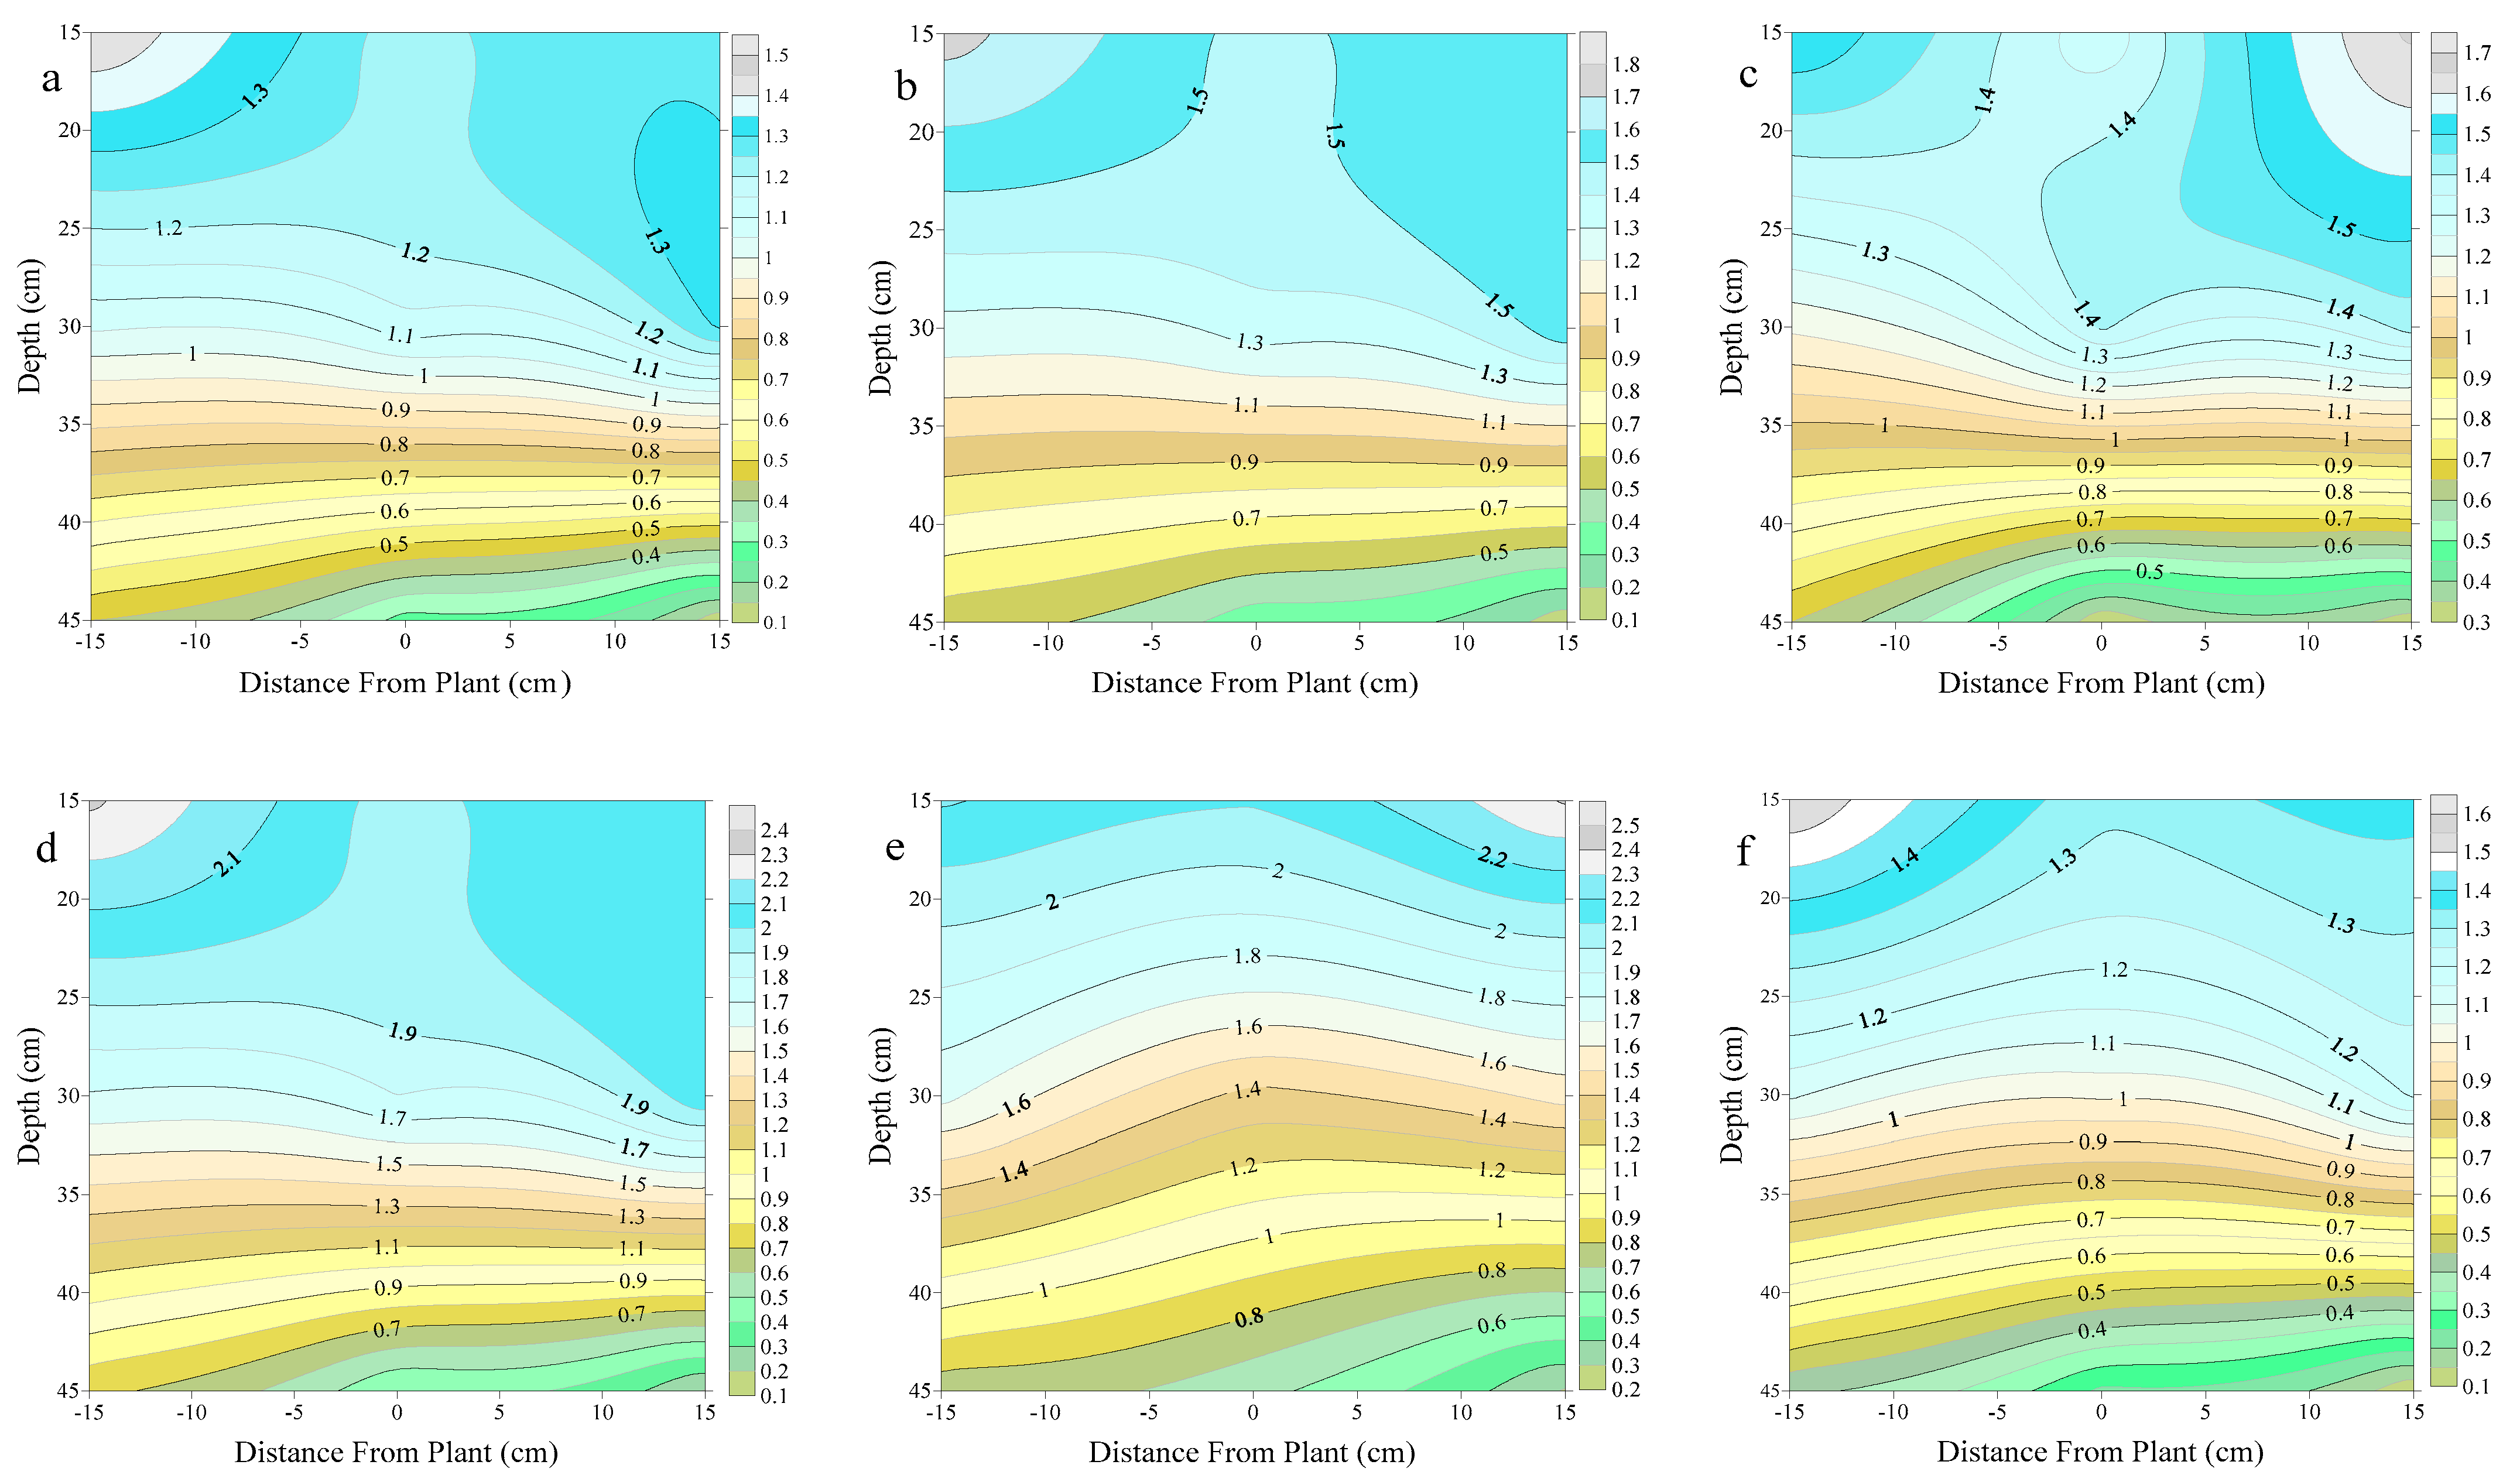
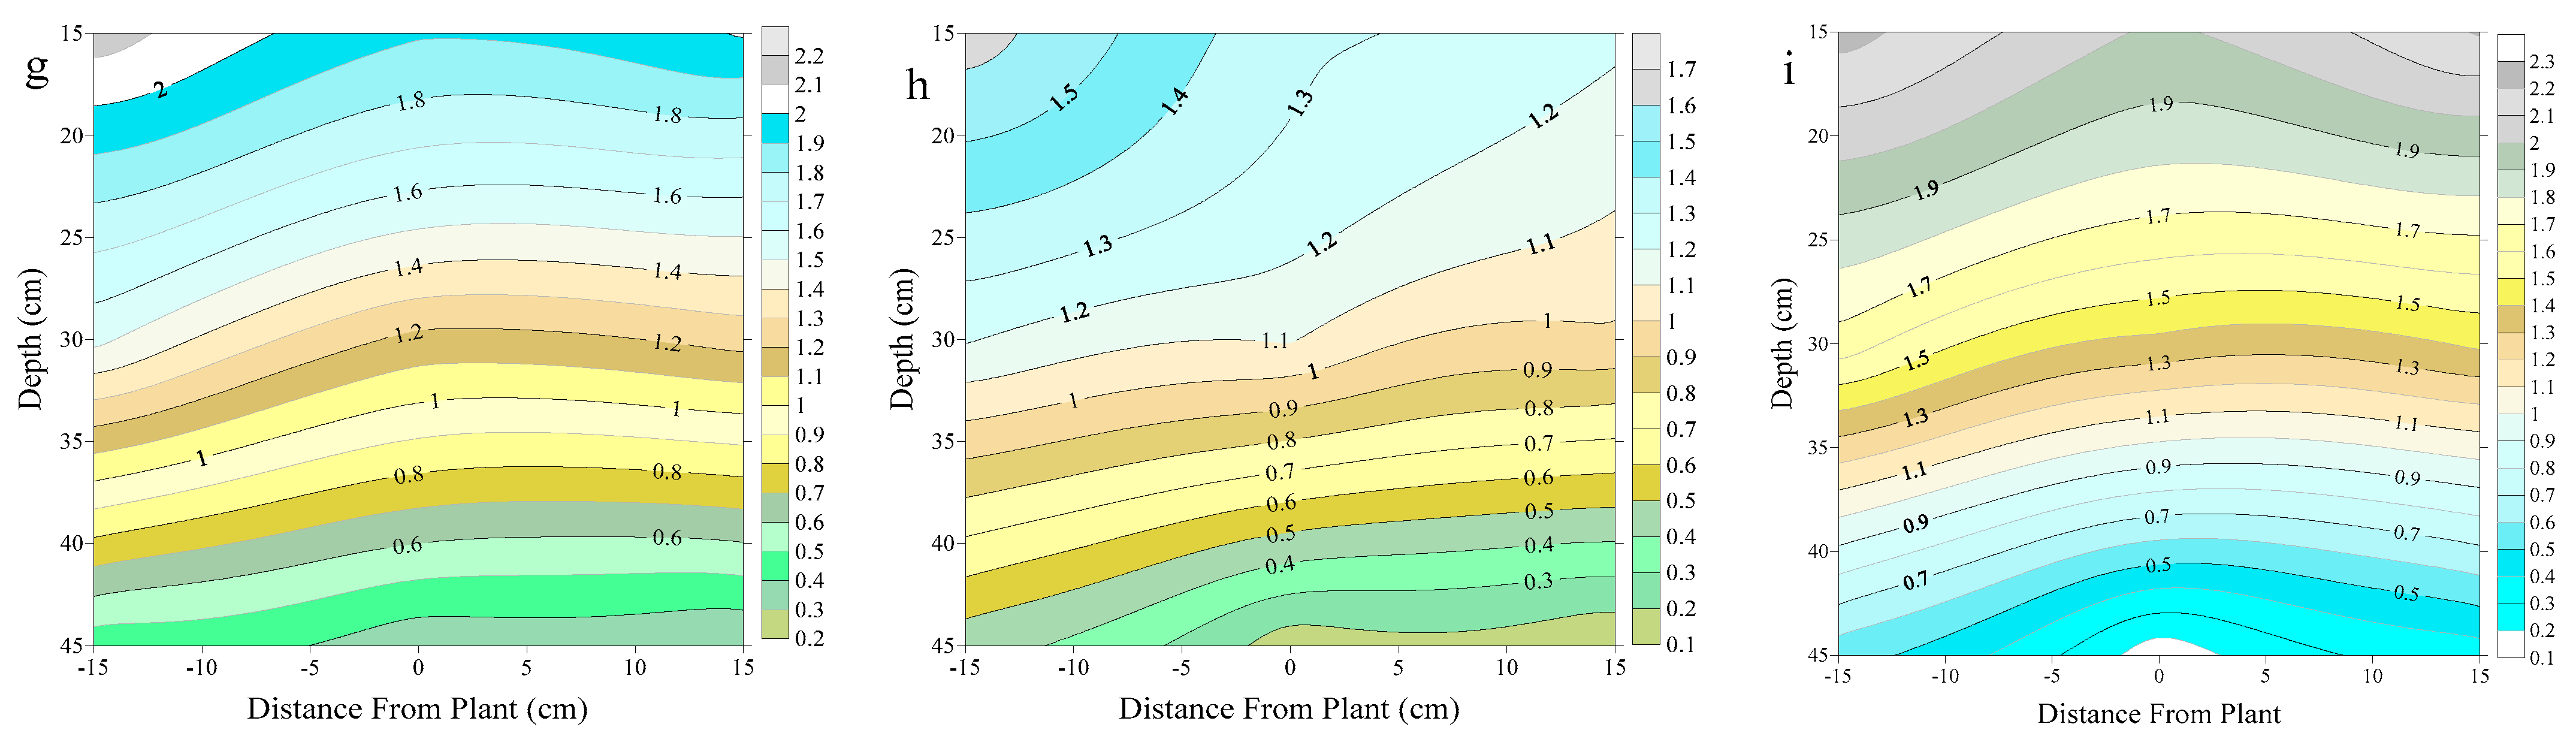
3.2. Salinity Distribution

Salinity distribution (SD) was determined in the soil under RDI and PRD using fresh and saline water. All irrigation regimes are represented by a contour line in Figure 3, for depths of 0–15, 15–30 and 30–45 cm. Figure 3a–d show SD under RDI of 100%, 80%, 60% and 40% ETc, respectively. Figure 3a–c show 100% and 60% without biochar, and Figure 3b–d show 80% and 40% ETc with biochar. Figure 3 shows that the salinity distribution patterns were different between soil with and without biochar. The highest values for salinity were observed at the sides of stem and lowest values were observed under the dripper. Without biochar, salinity ranged between 0.5 and 1.4 dS·m−1, while with biochar, it ranged between 0.7 and 2.1 dS·m−1. Compared with 100% Etc and at a depth of 0 to 20 cm, salinity increased by 15.38%, 7.69% and 61.54% for 80%, 60% and 40%, respectively. Figure 3e–i show SD under partial root drying during all growth stages. Figure 3f–i show the first, second, third, and fourth stages of growth, respectively. Figure 3e shows full PRD throughout the season. Figure 3f–h show the first and third stages without biochar. Figure 3g–i show the second and fourth stages with biochar. Compared to full irrigation, values decreased by 30%, 30% and 5% for the first, third, and fourth stages, respectively. This result could be related to the water consumed by the plants.
Figure 4 shows SD with and without biochar, when the soil was irrigated with saline water. Figure 4a–e show the SD during the first, second, third, and fourth stages of growth, respectively. Figure 4a show the results for plants irrigated with saline water and grown with biochar during all season with 100% Etc. Figure 4b–d show results for the first and third stages of growth without biochar. Figure 4c–e show results for the second and fourth stages of growth with biochar. Compared with full PRD. Figure 4a–e shows that salinity increased by 20%, 36% and 28%, respectively. Soil with biochar and irrigated with saline water had a higher salinity, especially in the last stage of growth, which could be due to the accumulation of salt as a result of saline water with biochar.
RDI with saline water decreased the salinity by 12.5% for 80% ETc, (Figure 4g Compared to 100% ETc. Figure 4f, the salinity increased by 6.25% and 6.25%. Figure 4h,i for 60% and 40% ETc, respectively. Similar results were reported by Melo et al. [32], who observed an increased level of available soil water for plants with an application rate of 0.8% biochar in upper soil layers. Vitkova et al. [30] concluded that biochar at a rate of 20 t ha−1 increased soil water content and decreased salinity, but the results were strongly related to the type of crop grown.

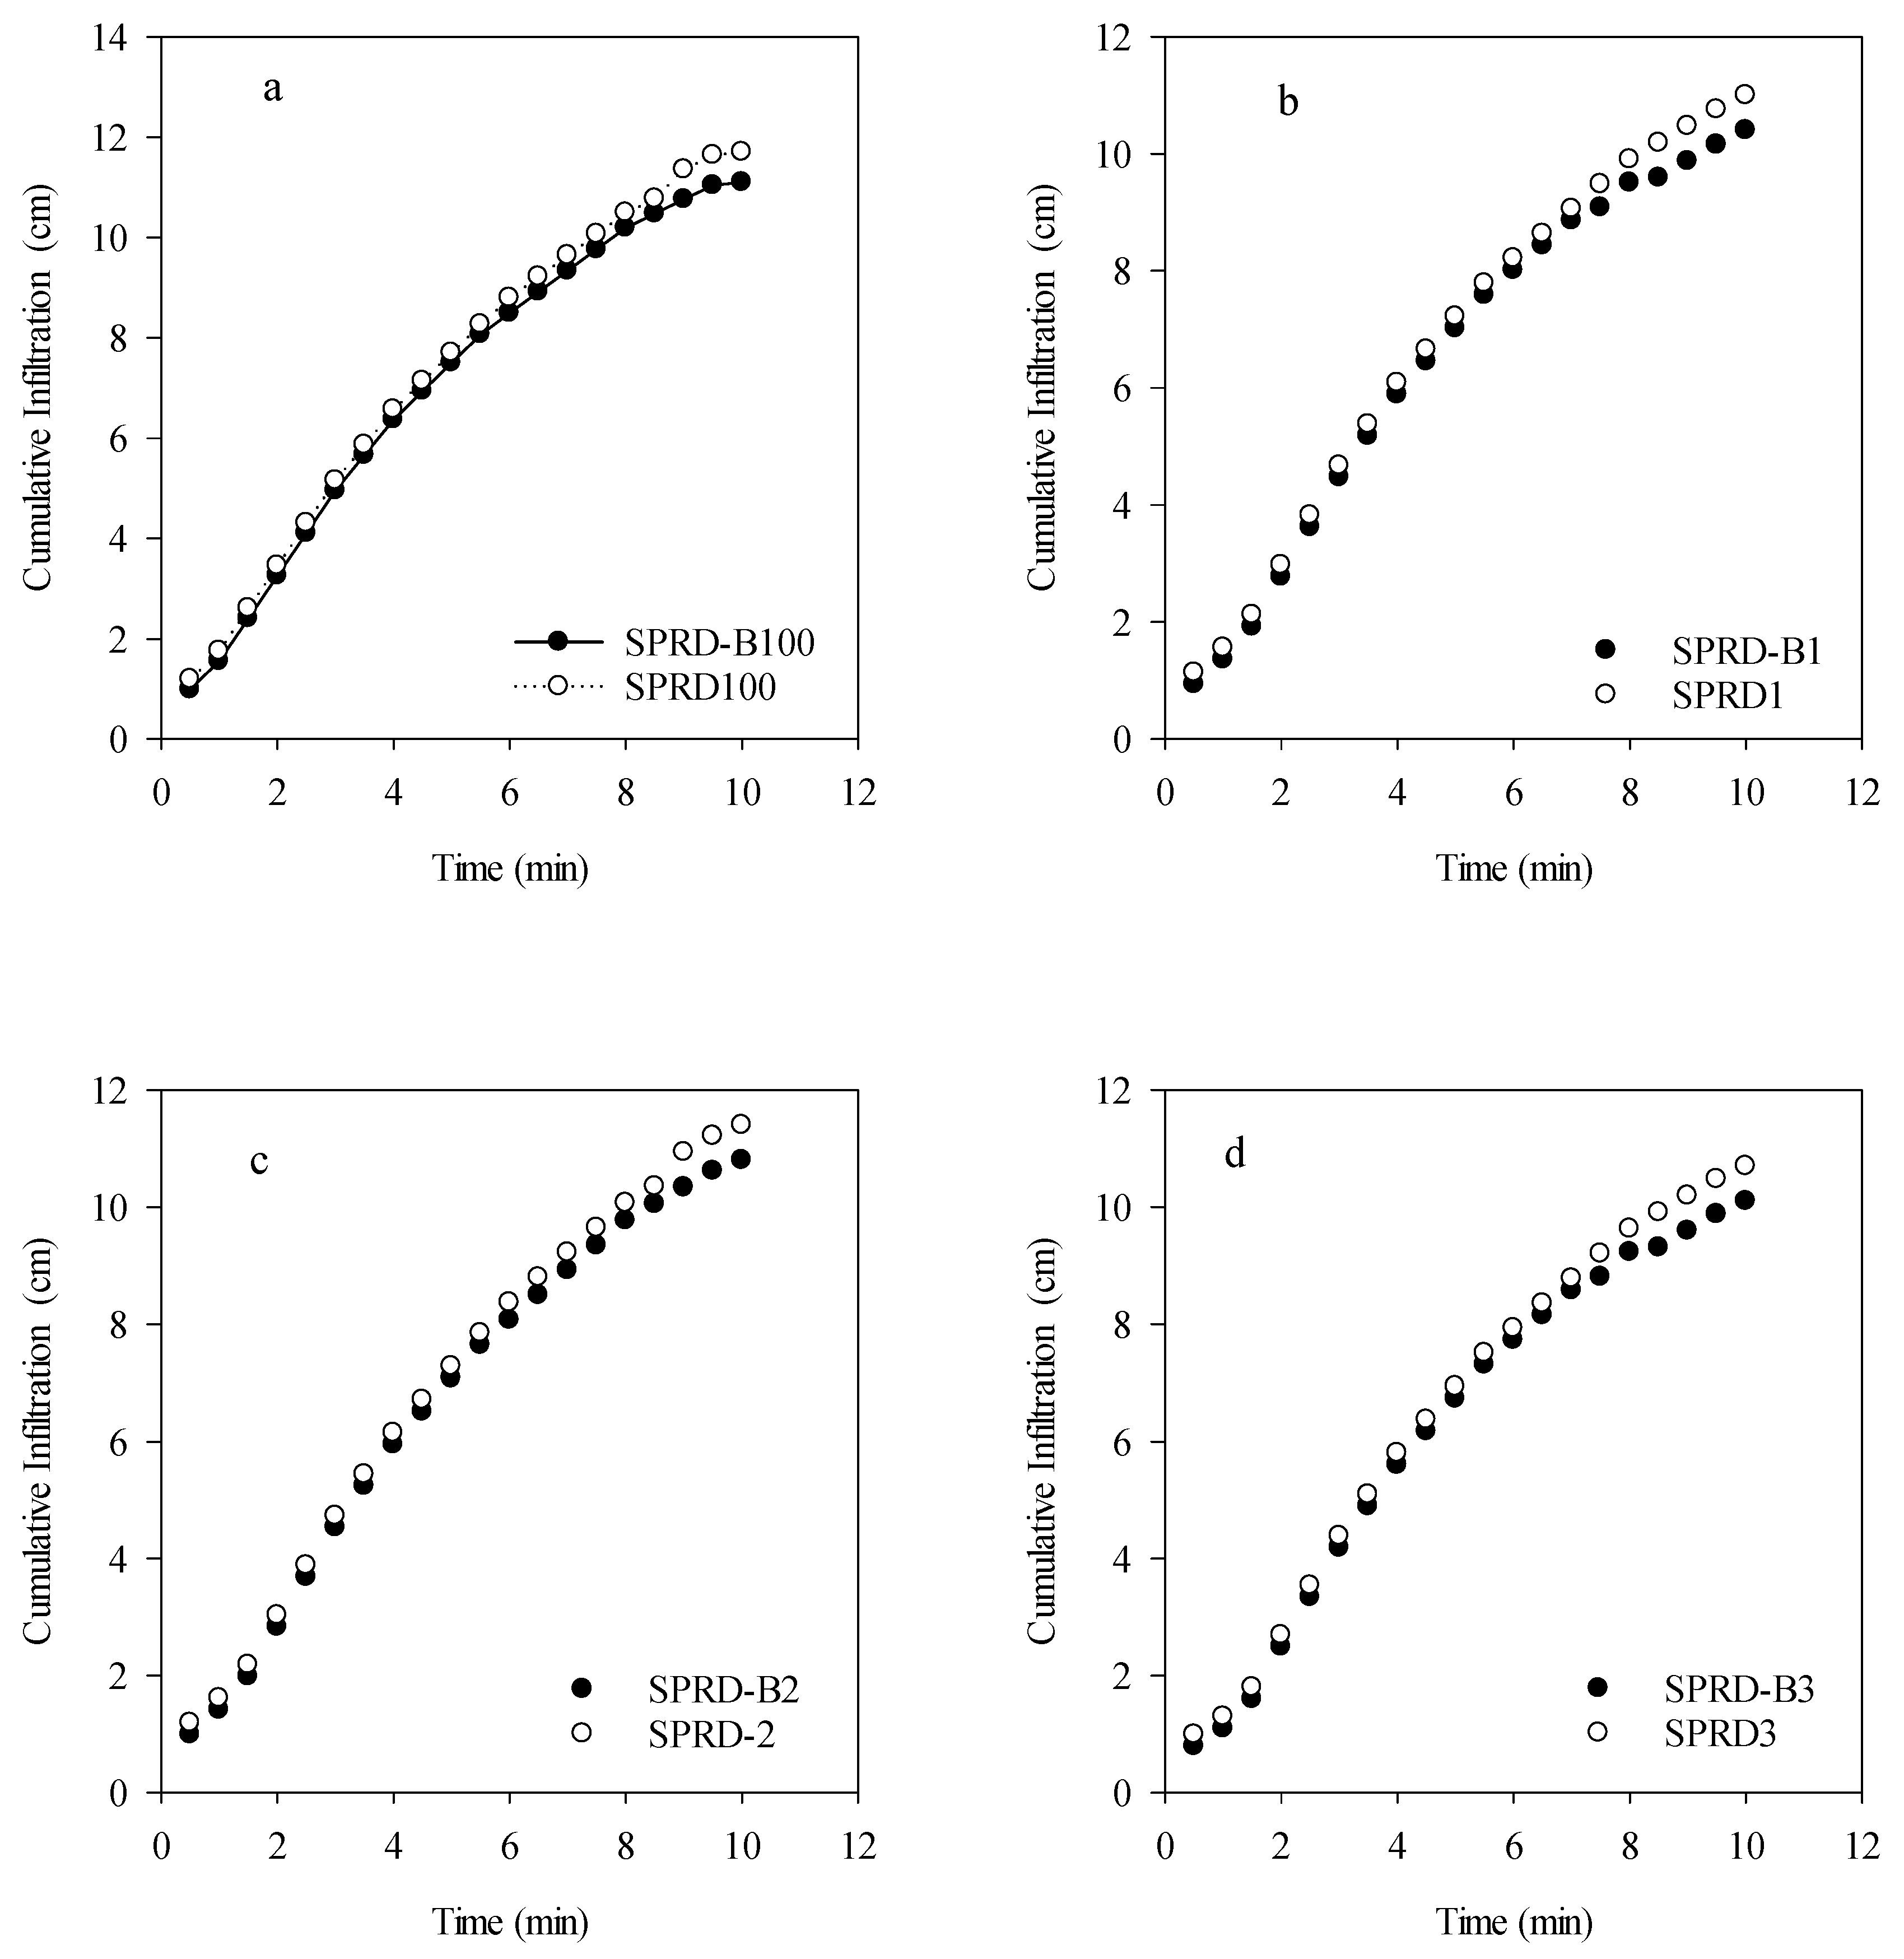
3.3. Cumulative Infiltration

Cumulative infiltration in the greenhouse under RDI at 100%, 80%, 60% and 40% ETc with and without biochar application, hereafter referred to as DIF-B100, DIF-B80, DIF-B60 and DIF-B40, DIF100, DIF80, DIF60 and DIF40 is shown in Figure 5. Volumes of cumulative infiltration were 1.89, 1.84, 2.24, 2.61, 2.09, 2.09, 2.47 and 2.79 cm for DIF-B100, DIF-B80, DIF-B60, DIF-B40, DIF-100, DIF-80, DIF-60, and DIF-40, respectively. The difference between treatments with and without biochar was significant at the 0.05 level. The decrease between biochar and non-biochar was 10.29%, 13.52%, 10.32% and 7.06%, respectively. Cumulative infiltration under PRD with saline water is shown in Figure 6. The values were 1.74,1.49, 1.46, 1.24, 1.87, 1.60, 1.58 and 2.79 cm for SPRD-B100, SPRD-B1, SPRD-B2, SPRD-B3, SPRD100, SPRD1, SPRD2 and SPRD3, respectively. Compared to the non-biochar treatments, the decrease for the biochar treatments was 7.18%, 7.25%, 8.58% and 125.76%. Compared to fresh water, cumulative infiltration using saline water was less. The results showed that the use of biochar led to a reduction in cumulative infiltration in a sandy soil. The decreased cumulative infiltration could be due to the filling of large pores in the sandy soil with biochar. A non-significant difference between deficit irrigation treatments at the first and second stages of plant growth was found. Addition of biochar decreased (clogged) pore spaces and the decrease depended on the quantity of fine biochar fractions. Other work has shown that biochar decreases hydraulic conductivity [33]. Chen et al. [34] found that commercially available biochar nanoparticles (NBC) not only affected the volume of soil pore by blocking space between soil particles, but it also reduces cumulative infiltration by 13.75%. Sun et al. [35] also found that biochar application decreased water infiltration.

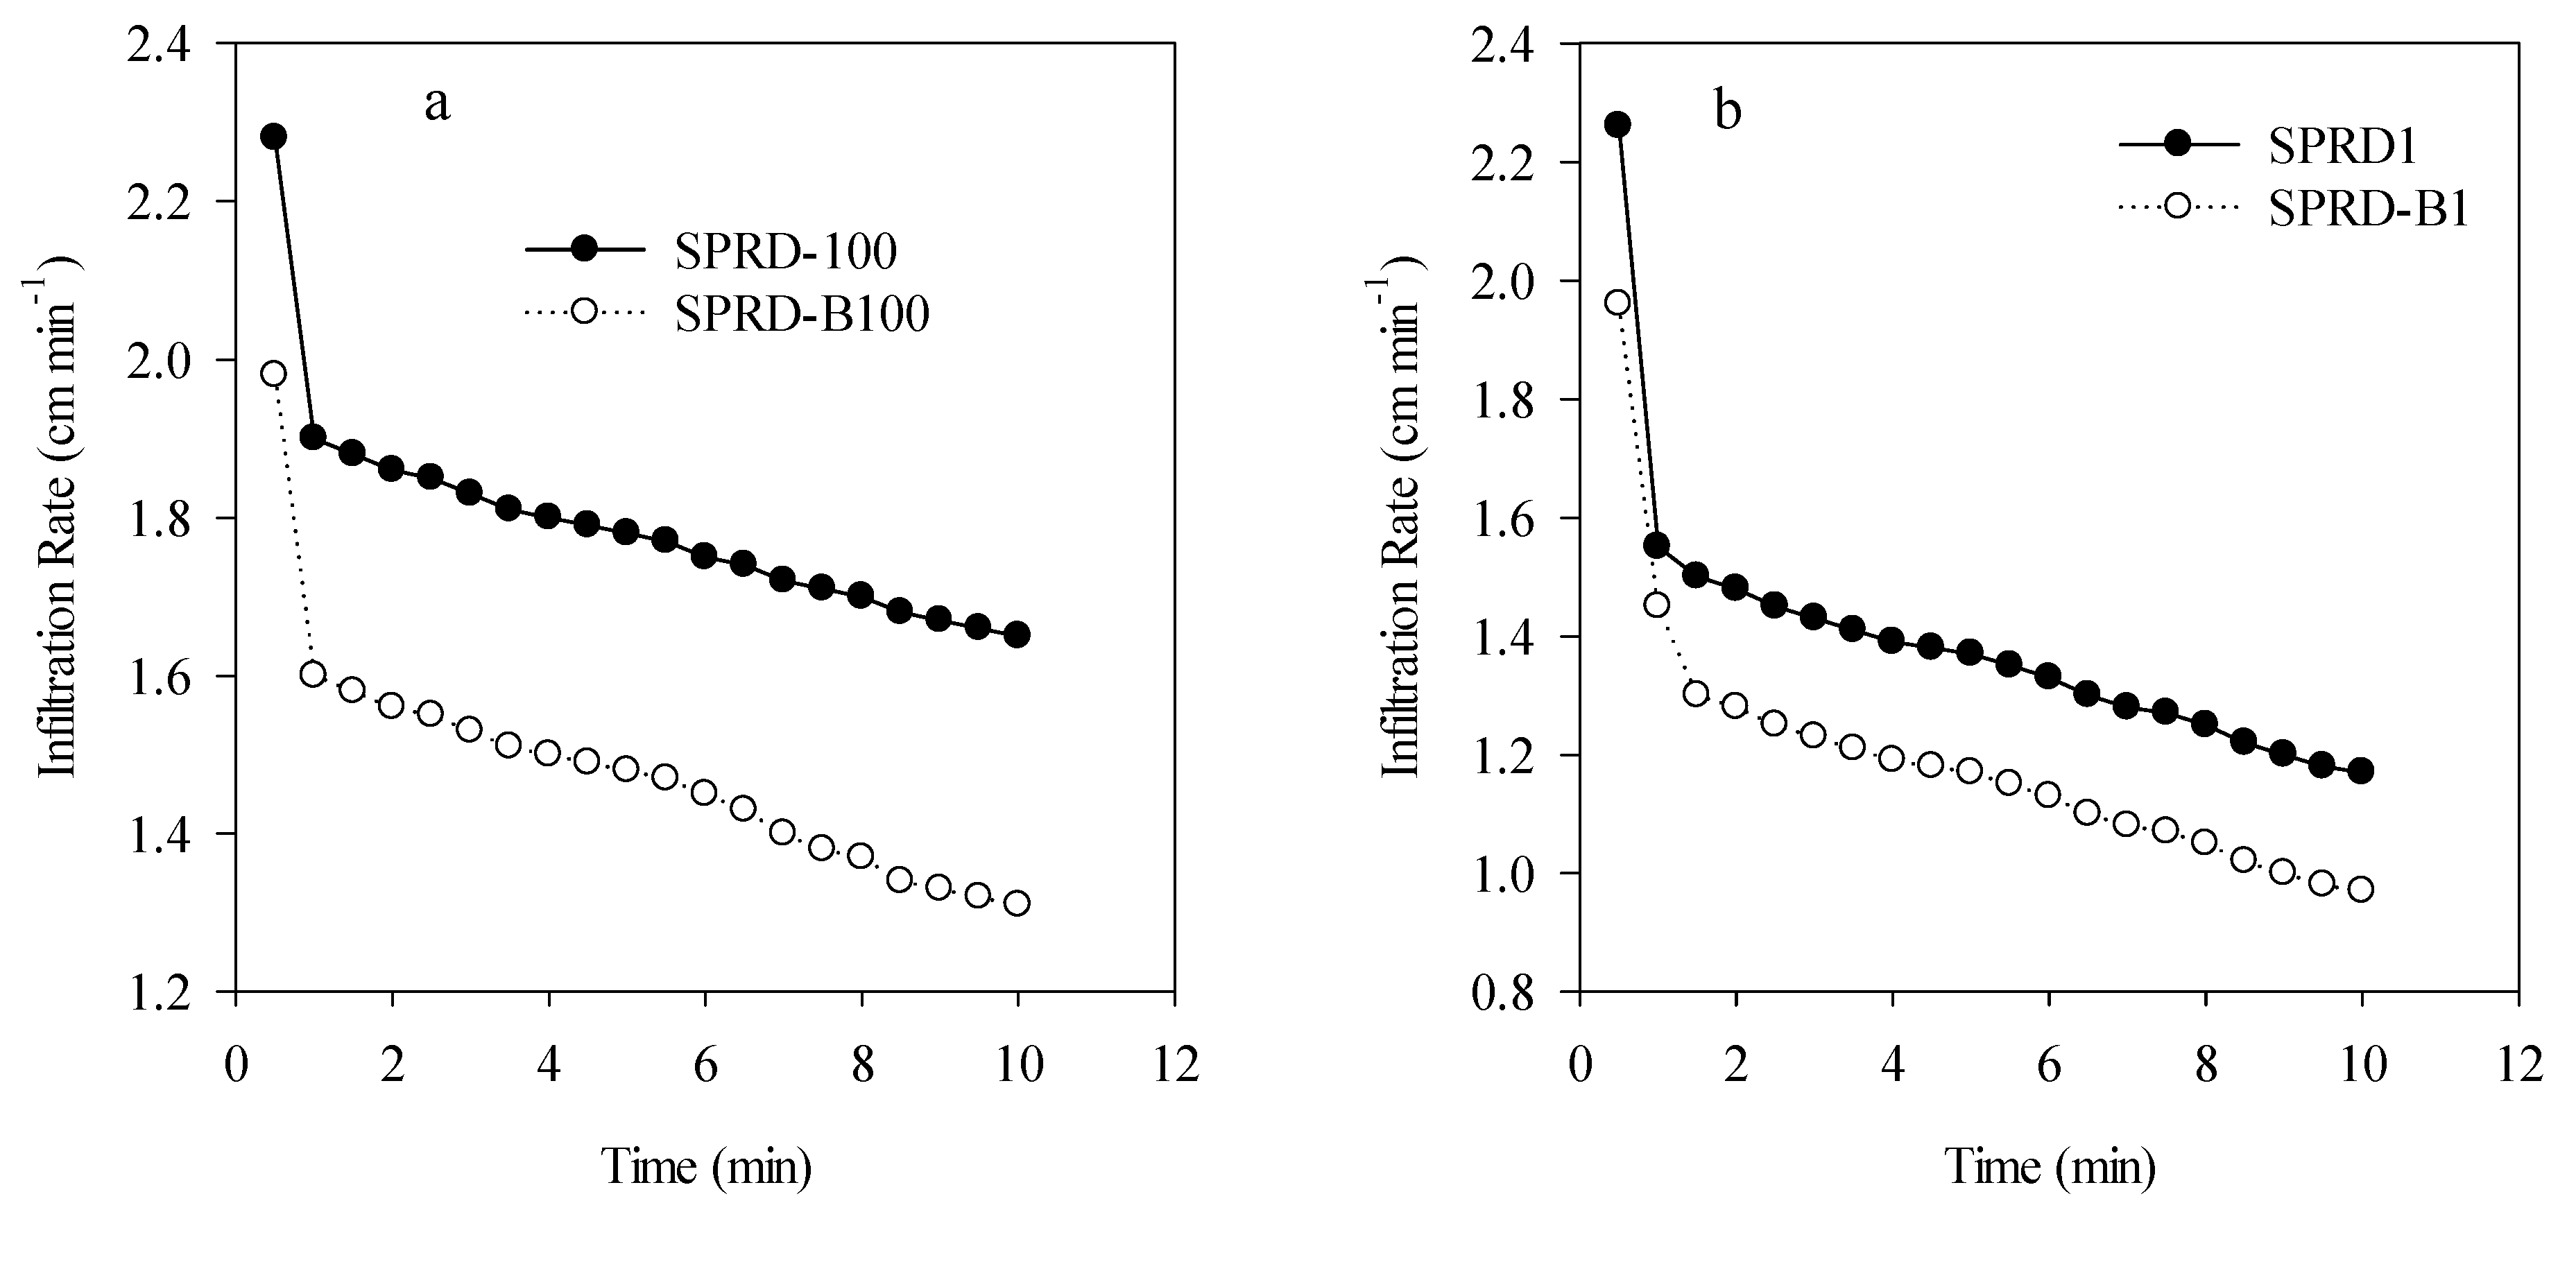
3.4. Infiltration Rate

The infiltration rate is another character of hydrological property of soil that affects irrigation water management. Figure 7 shows the infiltration rate (IR) for freshwater under the different irrigation treatments with and without biochar. The results for IR were 0.98, 1.66, 1.69, 1.511, 1.36, 1.81, 2.49 and 2.63 cm min−1 for DIF-B100, DIF-B80, DIF-B60, DIF-B40, DIF-100, DIF-80, DIF-60 and, DIF-40, respectively. IR for saline water is shown in Figure 8 for PRD. Values were 1.68, 1.49, 1.53, 1.27, 1.98, 1.71, 1.83 and 1.48 cm min−1 for SPRD-B100, SPRD-B1, SPRD-B2, SPRD-B3, SPRD100, SPRD1, SPRD2 and SPRD3, respectively. Trifunovic et al. [32] suggested that the addition of biochar could increase tortuosity and reduce the pore size of a soil. Rasa et al. [36] and Yi et al. [37] said that application of biochar of the nanoparticle size could increase the contact angle of soil, which would reduce the infiltration rates and induce preferential water flow.

4. Conclusions

The management of irrigation water under dry conditions and water scarcity includes different policies: application of soil amendment such as biochar and methods of irrigation. In general, the policies should tend to increase water use efficiency by reducing non-beneficial irrigation water uses or reducing delivered water to the crop. The adoption of both RDI and PRD with the addition of biochar improve farm irrigation systems. In this study, the application of date palm biochar under RDI and PRD increased the soil water content, especially in the surface layer of soil. The highest salinity distribution was observed in the sides of plants compared with under the dripper. Without biochar the salinity ranged between 0.5 and 1.4 dS·m−1, while in biochar SD it was 0.7 to 2.1 dS·m−1. The decrease between biochar and non-biochar was 10.29%, 13.52%, 10.32% and 7.06%, respectively. Furthermore, the cumulative infiltration under PRD with saline water was 1.74,1.49, 1.46, 1.24, 1.87, 1.60, 1.58, 2.79 cm·min−1, for SPRD-B100, SPRD-B1, SPRD-B2, SPRD-B3, SPRD100, SPRD1, SPRD2, and SPRD3, respectively. The decreased was 7.18%, 7.25%, 8.58% and 125.76% compared with biochar and non-biochar treatments. The infiltration rate (IR) for freshwater under different irrigation level with biochar was reduced significantly compared with non-biochar.

Author Contributions

Conceptualization, supervision, funding acquisition: A.G.A. and A.A.-O.; methodology, formal analysis and investigation, original draft preparation: A.G.A., A.A.-O. and A.A.; resources management, data acquisition, statistical analyses, manuscript—review and editing: A.G.A., A.A.-O. and A.A.; data analyses, statistical analyses: A.G.A., A.A.-O., A.A. and A.R.A.; manuscript—review and editing: A.G.A., A.A.-O., A.A. and A.R.A. All authors have read and agreed to the published version of the manuscript.

Funding

This project was funded by the National Plan for Science, Technology and Innovation (MAARIFAH), King Abdulaziz City for Science and Technology, Kingdom of Saudi Arabia, Award Number (15-AGR4704-02).

Data Availability Statement

Data is contained within the article.

Acknowledgments

This project was funded by the National Plan for Science, Technology and Innovation (MAARIFAH), King Abdulaziz City for Science and Technology, Kingdom of Saudi Arabia, Award Number (15-AGR4704-02).

Conflicts of Interest

The authors declare no conflict of interest.

Appendix A

Table A1. Equations of infiltration obtained by plotting infiltration rate versus 1/(2 t 0.5) and fitting a linear equation.
Fresh water DIF-B100y = 1.797x + 0.0835R² = 0.9729
DIFB-80y = 2.3044x + 0.5105R² = 0.9345
DIF-B60y = 2.3755x + 0.5016R² = 0.9386
DIFB-40y = 2.6586x + 0.1816R² = 0.9503
DIF100y = 2.3044x + 0.2105R² = 0.9345
DIF-80y = 2.3487x + 0.635R² = 0.9203
DIF60y = 2.3755x + 1.3016R² = 0.9386
DIF-40y = 2.6586x + 1.3016R² = 0.9503
Saline water SPRD-B100y = 0.6187x + 1.3677R² = 0.8687
SPRD-B1y = 0.9486x + 1.0179R² = 0.945
SPRD-B2y = 0.9095x + 1.0759R² = 0.9489
SPRD-B3y = 0.8677x + 0.8329R² = 0.9473
SPRD-100y = 0.5869x + 1.6859R² = 0.9134
SPRD-1y = 1.0013x + 1.2084R² = 0.9276
SPRD-2y = 0.9191x + 1.3707R² = 0.9365
SPRD-3y = 0.9204x + 1.0234R² = 0.9345

References

  1. Al-Omran, A.; Ibrahim, A.; Alharbi, A. Effects of biochar and compost on soil physical quality indices. Commun. Soil Sci. Plant Anal. 2021, 52, 2482–2499. [Google Scholar] [CrossRef]
  2. Al-Omran, A.M.; Al-Harbi, A.R. Improvement of sandy soils with soil conditioners. In Handbook of Soil Conditioners; CRC Press: Boca Raton, FL, USA, 2020; pp. 363–384. [Google Scholar]
  3. Al-Omran, A.; Ibrahim, A.; Alharbi, A. Evaluating the impact of combined application of biochar and compost on hydro-physical properties of loamy sand soil. Commun. Soil Sci. Plant Anal. 2019, 50, 2442–2456. [Google Scholar] [CrossRef]
  4. Shetty, R.; Vidya, C.S.N.; Prakash, N.B.; Lux, A.; Vaculik, M. Aluminum toxicity in plants and its possible mitigation in acid soils by biochar: A review. Sci. Total Environ. 2021, 765, 142744. [Google Scholar] [CrossRef]
  5. Agegnehu, G.; Srivastava, A.K.; Bird, M.I. The role of biochar and biochar-compost in improving soil quality and crop performance: A review. Appl. Soil Ecol. 2017, 119, 156–170. [Google Scholar] [CrossRef]
  6. Ali, S.; Rizwan, M.; Qayyum, M.F.; Ok, Y.S.; Ibrahim, M.; Riaz, M.; Arif, M.S.; Hafeez, F.; Al-Wabel, M.I.; Shahzad, A.N. Biochar soil amendment on alleviation of drought and salt stress in plants: A critical review. Environ. Sci. Pollut. Res. 2017, 24, 12700–12712. [Google Scholar] [CrossRef]
  7. Ahmad, M.; Ahmad, M.; Usman, A.R.; Al-Faraj, A.S.; Abduljabbar, A.; Ok, Y.S.; Al-Wabel, M.I. Date palm waste-derived biochar composites with silica and zeolite: Synthesis, characterization and implication for carbon stability and recalcitrant potential. Environ. Geochem. Health 2019, 41, 1687–1704. [Google Scholar] [CrossRef]
  8. Ahmad, M.; Ahmad, M.; Usman, A.R.; Al-Faraj, A.S.; Abduljabbar, A.S.; Al-Wabel, M.I. Biochar composites with nano zerovalent iron and eggshell powder for nitrate removal from aqueous solution with coexisting chloride ions. Environ. Sci. Pollut. Res. 2018, 25, 25757–25771. [Google Scholar] [CrossRef] [PubMed]
  9. Lehmann, J. A handful of carbon. Nature 2007, 447, 143–144. [Google Scholar] [CrossRef] [PubMed]
  10. Alghamdi, A.G.; Al-Omran, A.; Alkhasha, A.; Alasmary, Z.; Aly, A.A. Significance of Pyrolytic Temperature, Particle Size, and Application Rate of Biochar in Improving Hydro-Physical Properties of Calcareous Sandy Soil. Agriculture 2021, 11, 1293. [Google Scholar] [CrossRef]
  11. Agbna, G.H.; Dongli, S.; Zhipeng, L.; Elshaikh, N.A.; Guangcheng, S.; Timm, L.C. Effects of deficit irrigation and biochar addition on the growth, yield, and quality of tomato. Sci. Hortic. 2017, 222, 90–101. [Google Scholar] [CrossRef]
  12. Yu, H.; Zou, W.; Chen, J.; Chen, H.; Yu, Z.; Huang, J.; Tang, H.; Wei, X.; Gao, B. Biochar amendment improves crop production in problem soils: A review. J. Environ. Manag. 2019, 232, 8–21. [Google Scholar] [CrossRef] [PubMed]
  13. Atkinson, C.J.; Fitzgerald, J.D.; Hipps, N.A. Potential mechanisms for achieving agricultural benefits from biochar application to temperate soils: A review. Plant Soil 2010, 337, 1–18. [Google Scholar] [CrossRef]
  14. Borchard, N.; Siemens, J.; Ladd, B.; Möller, A.; Amelung, W. Application of biochars to sandy and silty soil failed to increase maize yield under common agricultural practice. Soil Till. Res. 2014, 144, 184–194. [Google Scholar] [CrossRef]
  15. Ahmad, M.; Usman, A.R.; Al-Faraj, A.S.; Ahmad, M.; Sallam, A.; Al-Wabel, M.I. Phosphorus-loaded biochar changes soil heavy metals availability and uptake potential of maize (Zea mays L.) plants. Chemosphere 2018, 194, 327–339. [Google Scholar] [CrossRef] [PubMed]
  16. Kapoor, A.; Sharma, R.; Kumar, A.; Sepehya, S. Biochar as a means to improve soil fertility and crop productivity: A review. J. Plant Nutr. 2022, 45, 1–9. [Google Scholar] [CrossRef]
  17. Šimanský, V.; Horák, J.; Bordoloi, S. Improving the soil physical properties and relationships between soil properties in arable soils of contrasting texture enhancement using biochar substrates: Case study in Slovakia. Geoderma Reg. 2022, 28, e00443. [Google Scholar] [CrossRef]
  18. Haider, F.U.; Coulter, J.A.; Liqun, C.A.I.; Hussain, S.; Cheema, S.A.; Jun, W.U.; Zhang, R. An overview on biochar production, its implications, and mechanisms of biochar-induced amelioration of soil and plant characteristics. Pedosphere 2022, 32, 107–130. [Google Scholar] [CrossRef]
  19. Pereira, L.S.; Oweis, T.; Zairi, A. Irrigation management under water scarcity. Agric. Water Manag. 2002, 57, 175–206. [Google Scholar] [CrossRef]
  20. Alrajhi, A.; Beecham, S.; Hassanli, A. Effects of partial root-zone drying irrigation and water quality on soil physical and chemical properties. Agric. Water Manag. 2017, 182, 117–125. [Google Scholar] [CrossRef]
  21. Sepaskhah, A.R.; Ahmadi, S.H. A review on partial rootzone drying irrigation. Int. J. Plant Prod. 2012, 4, 241–258. [Google Scholar]
  22. Akhtar, S.S.; Li, G.; Andersen, M.N.; Liu, F. Biochar enhances yield and quality of tomato under reduced irrigation. Agric. Water Manag. 2014, 138, 37–44. [Google Scholar] [CrossRef]
  23. Maiti, S.K. Handbook of Methods in Environmental Studies: Water and Wastewater Analysis; ABD Publishers: Natraj Nagar, Imliwala Phatak Jaipur, India, 2004; pp. 255–258. [Google Scholar]
  24. Sparks, D.L.; Page, A.L.; Helmke, P.A.; Loeppert, R.H.; Soltanpour, P.N.; Tabatabai, M.A.; Johnston, C.T.; Sumner, M.E. Methods of Soil Analysis, Part 3: Chemical Methods; John Wiley & Sons: Madison, WI, USA, 1996; pp. 1085–1121. [Google Scholar]
  25. Tabatabai, M.A. Sulfur. In Methods of Soil Analysis, Part 3: Chemical Methods; John Wiley & Sons: Madison, WI, USA, 1996; pp. 921–960. [Google Scholar]
  26. Hillel, D. Soil and Water: Physical Principles and Processes; Academic Press: New York, NY, USA, 1971. [Google Scholar]
  27. Loeppert, R.H.; Suarez, D.L. Carbonate and gypsum. In Methods of Soil Analysis, Part 3: Chemical Methods; John Wiley & Sons: Madison, WI, USA, 1996; pp. 437–474. [Google Scholar]
  28. ASTM D1762-84; Standard Methods forChemical Analysis of Wood Charcoal. American Society for Testing and Materials (ASTM): Philadelphia, PA, USA, 1989.
  29. de Melo Carvalho, M.T.; de Holanda Nunes Maia, A.; Madari, B.E.; Bastiaans, L.; Van Oort, P.A.J.; Heinemann, A.B.; Soler da Silva, M.A.; Petter, F.A.; Marimon, B.H., Jr.; Meinke, H. Biochar increases plant-available water in a sandy loam soil under an aerobic rice crop system. Solid Earth 2014, 5, 939–952. [Google Scholar] [CrossRef] [Green Version]
  30. Vitkova, J.; Surda, P.; Kondrlova, E.; Horak, J.; Rodny, M. Analysis of soil water content and crop yield after biochar application in field conditions. Plant Soil Environ. 2017, 63, 569–573. [Google Scholar]
  31. Novak, J.M.; Busscher, W.J.; Watts, D.W.; Amonette, J.E.; Ippolito, J.A.; Lima, I.M.; Gaskin, J.; Das, K.C.; Steiner, C.; Ah-medna, M.; et al. Biochars impact on soil-moisture storage in an ultisol and two aridisols. Soil Sci. 2012, 177, 310–320. [Google Scholar] [CrossRef] [Green Version]
  32. Melo, H.F.D.; Souza, E.R.D.; Duarte, H.H.; Cunha, J.C.; Santos, H.R. Gas exchange and photosynthetic pigments in bell pepper irrigated with saline water. Rev. Bras. Eng. Agrícola Ambient. 2017, 21, 38–43. [Google Scholar] [CrossRef] [Green Version]
  33. Trifunovic, B.; Gonzales, H.B.; Ravi, S.; Sharratt, B.S.; Mohanty, S.K. Dynamic effects of biochar concentration and particle size on hydraulic properties of sand. Land Degrad. Dev. 2018, 29, 884–893. [Google Scholar] [CrossRef]
  34. Chen, X.; Duan, M.; Zhou, B.; Cui, L. Effects of biochar nanoparticles as a soil amendment on the structure and hydraulic characteristics of a sandy loam soil. Soil Use Manag. 2022, 38, 836–849. [Google Scholar] [CrossRef]
  35. Sun, J.; Yang, R.; Zhu, J.; Zhou, C.; Yang, M.; Pan, Y.; Zhang, Z. Contrasting effects of corn straw biochar on soil water infiltration and retention at tilled and compacted bulk densities in the Yellow River Delta. Can. J. Soil Sci. 2019, 99, 357–366. [Google Scholar] [CrossRef]
  36. Rasa, K.; Heikkinen, J.; Hannula, M.; Arstila, K.; Kulju, S.; Hyväluoma, J. How and why does willow biochar increase a clay soil water retention capacity? Biomass Bioenergy 2018, 119, 346–353. [Google Scholar] [CrossRef]
  37. Yi, S.; Witt, B.; Chiu, P.; Guo, M.; Imhoff, P. The origin and reversible nature of poultry litter biochar hydrophobicity. J. Environ. Qual. 2015, 44, 963–971. [Google Scholar] [CrossRef]
Figure 1. Soil moisture distribution under regulated deficit irrigation for (a) 100%, (b) 80%, (c) 60% and (d) 40% ETc and under partial root drying for four stages, full irrigation treatment (e), (fh) without biochar and (gi) with biocahr under saline water.
Agronomy 12 01762 g001
Figure 2. Soil moisture distribution after amending the soil with biochar and irrigating with saline water for (a) 100%, (b) 80%, (c) 60%, and (d) 40% ETc and under partial root drying for four stages, full irrigation treatment (e), (fh) without biochar and (gi) with biocahr under fresh water.
Agronomy 12 01762 g002
Figure 3. Salinity distribution under regulated deficit irrigation for (a) 100%, (b) 80%, (c) 60% and (d) 40% ETc and under partial root drying for four four stages, full irrigation treatment (e), (fh) without biochar and (gi) with biocahr under fresh water.
Agronomy 12 01762 g003aAgronomy 12 01762 g003b
Figure 4. Salinity distribution after amending the soil with biochar and irrigating with saline water for (a) 100%, (b) 80%, (c) 60% and (d) 40% ETc and under partial root drying for four stages, full irrigation treatment (e), (fh) without biochar and (gi) with biocahr under fresh water.
Agronomy 12 01762 g004aAgronomy 12 01762 g004b
Figure 5. Cumulative infiltration of fresh water under deficit irrigation with and without biochar, where (a) 100%, (b) 80%, (c) 60% and (d) 40% of ETc.
Agronomy 12 01762 g005
Figure 6. Cumulative infiltration of saline water under deficit irrigation with and without biochar, where (a) 100%, (b) 80%, (c) 60% and (d) 40% of ETc.
Agronomy 12 01762 g006
Figure 7. The infiltration rate of fresh water under deficit irrigation with and without biochar, where (a) 100%, (b) 80%, (c) 60% and (d) 40% of ETc.
Agronomy 12 01762 g007
Figure 8. Infiltration rate under deficit irrigation by saline water with biochar and non-biochar, where (a) 100%, (b) 80%, (c) 60% and (d) 40% of ETc.
Agronomy 12 01762 g008aAgronomy 12 01762 g008b
Table 1. Main properties of the soil and the fresh and saline irrigation water.
Depth cmpHEC dS·m−1Cations meql−1Anions meql−1SAR
Ca2+Mg2+Na+K+CO32−HCO3Cl
Soil 0–407.452.7914.59.052.781.750.2118.97.950.78
Fresh water 7.110.93.692.55.70.1202.17.214.02
Saline water 7.513.612.82.231.560.2902.8631.2920.12
Physical properties of soil Sand (%)Silt (%)ClaySoil texture
81136Loamy Sand
Table 2. Physico-chemical characteristics and proximate composition analysis of biochar.
ParameterUnitBiochar
Specific surface aream2 g−1237.8
pH (H2O)-8.92
EC (1:10)dS·m−17.78
OM%30.32
C%60.00
H%3.44
N%0.24
P%0.22
K%0.87
Ca%5.63
C/N ratio-250:1
Moisture%3.53
Mobile material%22.82
Ash%25.70
Resident material (Fixed carbon)%47.95
Table 3. Combination of treatments using saline and fresh water.
Fresh Water
LettersSymbolTreatments
aRDIF100Deficit irrigation-100%, Fresh water without biochar
RDIF-B100Deficit irrigation-100%, Fresh water with biochar
bRDIF80RDI-80%, Fresh water without biochar
RDIF-B80RDI-80%, Fresh water with biochar
cRDIF60RDI-60%, Fresh water without biochar
RDIF-B60RDI-60%, Fresh water with biochar
dRDIF40RDI-40%, Fresh water without biochar
RDIF-B40RDI-40%, Fresh water with biochar
eFPRD100Full PRD, Fresh water with biochar
fFPRD11st Stage PRD, Fresh water without biochar
gFPRD22nd Stage PRD, Fresh water with biochar
hFPRD33rd Stage PRD, Fresh water without biochar
iFPRD44th Stage PRD, Fresh water with biochar
Saline Water
aSPRD-B100Full PRD, Saline water with biochar
SPRD100Full PRD, Saline water without biochar
bSPRD-B11st Stage PRD, Saline water with biochar
SPRD11st Stage PRD, Saline water without biochar
cSPRD-B22nd Stage PRD, Saline water with biochar
SPRD22nd Stage PRD, Saline water without biochar
dSPRD-B33rd Stage PRD, Saline water with biochar
SPRD33rd Stage PRD, Saline water without biochar
eSPRD4th Stage PRD, Saline water with biochar
fSRDI100RDI-100%, Saline water without biochar
gSRDI80RDI-80%, Saline water with biochar
hSRDI60RDI-60%, Saline water without biochar
iSRDI40RDI-40%, Saline water with biochar
Publisher’s Note: MDPI stays neutral with regard to jurisdictional claims in published maps and institutional affiliations.

