Article

Biochar Texture—A Parameter Influencing Physicochemical Properties, Morphology, and Agronomical Potential

Faculty of Chemistry, Brno University of Technology, Purkynova 464/118, 61200 Brno, Czech Republic
*
Author to whom correspondence should be addressed.
Agronomy 2022, 12(8), 1768; https://doi.org/10.3390/agronomy12081768
Submission received: 27 June 2022 / Revised: 18 July 2022 / Accepted: 19 July 2022 / Published: 28 July 2022

Abstract

:
Biochar represents a stable form of carbon-rich organic material produced by the pyrolysis of various biomass residues. It has the potential to stabilize organic carbon in the soil and improve soil fertility, water retention, and enhance plant growth. Despite its potential, there is limited information on the mutual relation of biochar texture with its physicochemical characteristics, morphology, and the content of organic matter. For these reasons, we studied three biochar samples with potential use in agriculture as soil supplements (NovoCarbo, Sonnenerde, Biouhel.cz). Our experimental approach performed on the individual sieved fraction of studied biochars (<0.5; 0.5–2.0; 2.0–4.0 and >4.0 mm) confirmed the importance of a selection of optimal source biomass material as the content of lignin, cellulose, and hemicellulose, together with the conditions of pyrolysis (temperature of pyrolysis), play a crucial role in the managing of the properties of produced biochar. Agronomically more stable biochars containing a higher content of organic matter and organic carbon, with alkaline pH response and well-developed aromatic porous structure, could be produced from lignin-based biomass residues at higher pyrolysis temperatures, which is an important finding taking into account the possible utilization of biochar in soils as a soil conditioner.

1. Introduction

The soil is an important natural system, which is crucial for agricultural production, but it is already depleted, and today’s way of cultivating the land does not help it much. It is not only erosion but also lack of organic matter, aridity, and salinity that is the problem. The possible solution for how to improve soil fertility [1], water retention [2], and enhance plant growth [3] is represented by the utilization of soil conditioners such as lignite, lignohumate, alginate, hydrosorbents, or biochar. Biochar is a carbon-rich solid product of the thermochemical conversion of biomass under anaerobic conditions (pyrolysis). The attractive chemical properties of biochar are connected mainly with its potential to reduce the release of greenhouse gasses [4], to reduce nutrient (P, N, Mg, Ca, and K) leaching [5], to enhance plant growth [6], to reduce heavy metal (e.g., As, Cu, Pb, Cr, and Cd) mobility [7,8], as well as to positively affect soil microorganisms [9]. Physical properties of biochar (e.g., particle size distribution, density, porosity, and surface area), as well as chemical properties (e.g., pH, electric conductivity, zeta potential, organic carbon and PAH, nutrient content, and elemental composition), depend on thermochemical (pyrolysis) operating conditions (temperature, pressure, and resistance time), and the intrinsic nature of the source biomass [10]. In principle, pyrolysis is a process of solid biomass conversion into bio-oil, gaseous products, and biochar under an oxygen-limited or anoxic environment [11]. Various products serve as a feedstock used for biochar production, ranging from wood-based products (e.g., sawdust [12], woodchips [13] and wood pellets, and tree bark), organic wastes (e.g., manure [14] and sludges, [15]), and plant-based materials (e.g., wheat straw [16], leaves [17], husks, seeds, and cobs [18]). The huge variability of biochar source biomasses, as well as the broad extent of possible biochar production conditions, cause rather variable properties of produced biochar [19]. Therefore, in 2012 the European Biochar Certificate (EBC) was developed with the cooperation of scientists and biochar producers [20]. This voluntary European industrial standard ensures that the biochar producer possessing the EBC certificate can produce biochar with sustainable and consistent properties meeting the European restrictions with a low potential hazard of its use in agriculture or other human-driven applications.
Generally, the effect of biochar on soil or plant growth is widely investigated by many researchers [21,22,23], but only a few studies focus on the cross-correlation of observed effects with basic biochar characteristics. Biochar particle size affects soil physico-chemical properties and nutrient contents. The soil treated with biochar of various particle sizes (<3, 3–6 and 6–9 mm) shows generally a decrease in the bulk density and an increase in porosity, saturation percentage, and soil organic matter in comparison with the soil without biochar treatment [2,4]. Biochar amendment also shows improvement in the soil mineral N, AB-DTPA (ammonium bicarbonate diethylenetriaminepentaacetic acid, multiextractant), extractable P, and K over biochar control. In more detail, biochar of the smallest particle size (<3 mm) shows the maximum improvement of previously mentioned soil properties and the plant growth parameters (tomato crop) [1]. Alkaline biochar (pH ≥ 10) can be used in acidic soil (e.g., neutralizing the acidity of peat). Different particle fractions of biochar (<3.3, 3.3–6 and 6–10 mm) were tested for the peat acid neutralizing capacity and the finest fraction has the highest neutralizing ability. Although, in comparison with 2.5 g of calcium carbonate (the most used liming material), it is necessary to use 43 g of biochar to reach the same liming effect per liter of peat. Nevertheless, biochar shows additional peat-based growing media improvement, such as an increase in air content and higher physical stability during cropping [24]. Biochar nutrient extraction performed by [25] shows that the recovery of P, K, and Mg was greater for smaller particle size fractions. It is important to note that the size fractions after sieving were much smaller (0.15–0.60 mm, 0.60–1.18 mm, 1.18–4.00 mm, and >4.00 mm) in comparison to the previously mentioned research. Another study [26] confirmed that particle size fractions of the same biochar have a different amount of total extractable nutrients and pH level (higher for finer fraction <1 mm). From the other point of view [27], the quality and quantity of humic substances released from biochar can be affected by grain size as well. Particle size fraction >1 mm released humic substances with increasing humification degree, increasing molecular weight and aromaticity. However, there was no effect of pH on the quantity and quality of humic substances released from biochar. The adsorption energy, corresponding indirectly to the total content of accessible functional groups at the biochar structure, was the lowest for the finest particles, which indicates the highest ion change capacity. The adsorption energy was increasing along with the size of biochar particles. In contrast, carbon mobility between solid and liquid phases was greatest for the finest fraction (<1 mm).
The positive effect of biochar on soil properties, organic matter stabilization, and carbon sequestration is from the historical context, as well as from the above-described text, indisputable; on the other hand, the knowledge of the proper application form and the application dosage is still not sufficient. Therefore, the experimental part of this work was focused on the description of the relation between the texture of biochar and its corresponding physicochemical characteristics, morphology, and the content of organic matter and organic elements to be able to identify whether the produced biochar size fraction can influence its possible agronomical potential. This knowledge is crucial for the subsequent research and production of the optimal application form of biochar. The provided set of basic characteristics will help to determine the optimal application conditions in agriculture, where we believe biochar could serve as a promising soil supplement.

2. Materials and Methods

2.1. Biochar Sieve Analysis

The biochar sample database consisted of two biochar samples possessing the European Biochar Certificate for use in agriculture as soil conditioners. These samples were purchased from Sonnenerde GmbH (Bio Pflanzenkohle, Riedlingsdorf, Austria) and NovoCarbo GmbH (NovoTerra, Dörth, Germany). The third sample represented biochar produced as a soil supplement by a domestic Czech producer, Biouhel.cz s.r.o. (Agrouhel, Zlín, Czech Republic).
All the purchased biochar samples were firstly air-dried at 45 °C for 48 h to remove the absorbed moisture. The dried biochar samples were sieved by a vibratory sieve shaker AS 2000 (Retsch GmbH, Haan, Germany) allowing us to obtain the following fractions—Fraction A (<0.5 mm), Fraction B (0.5–2.0 mm), Fraction C (2.0–4.0 mm) and Fraction D (>4.0 mm). Table 1 summarizes the sample database of prepared fractions of biochar samples used in the study, as well as the sum of crucial parameters of biochar feedstock materials and their production conditions. Moreover, prior to the selected performed instrumental analyses (EA, TGA, TOC, NMR, pH, and conductivity measurement), the individual biochar samples were milled using a desktop swing mill HK 40 (H&K Laboratory equipment, Turnov, Czech Republic) in a HKMG6 zirconia oxide grinding vessel.
Demineralized water (ELGA Purelab Classic system, VWS, Celle, Germany) was used in all experiments. Calcium carbonate dihydrate (CaCl2∙2 H2O) of analytical purity grade was purchased from Penta s.r.o. (Prague, Czech Republic) and used without further purification.

2.2. Organic Matter and Organic Elements Characterization

The individual obtained fractions of biochar samples used in the work were initially characterized by their content of organic matter, inorganic ash, and adsorbed moisture, as was determined by thermogravimetric analysis (TGA) and subsequently by determination of organic element (C, H, O, and N) composition using elemental analysis (EA) and by analysis of total organic carbon (TOC) content.

2.2.1. Thermogravimetry

A thermogravimetric analyzer Q5000 (TA Instruments, New Castel, DE, USA) was used to determine the content of moisture, organic matter, and ash (inorganic matter) in the fractions of biochar samples. For individual analysis, approximately 5 mg of a sample was weighed into a platinum pan. The used heating rate was 10 °C/min, the measurement was performed from ambient temperature to 800 °C under an air atmosphere. From the continual measurement of temperature-dependent residual weight, the content of sample moisture (weight difference at 110 °C), the content of organic matter (the weight difference between 110 °C and 800 °C), and the content of ash (the weight at 800 °C) were determined.

2.2.2. Elemental Analysis

The relative content of organic elements (C, O, H, and N) in the individual fractions of biochar samples was characterized using a CHNS/O analyzer EA 3000 (Euro Vector, Pavia, Italy). For purposes of the analysis, 0.5–1.0 mg of the sample was weighed into a tin capsule and packed. The analysis was performed through the combustion of prepared tin capsules with the samples at 980 °C in the analyzer using oxygen as the combustion gas and helium as the carrier gas. Calibration of carbon (C), hydrogen (H), nitrogen (N), and sulphur (S) determination was performed using a sulphanilamide as a standard sample. In all analyzed samples, no content of sulphur was detected. The relative oxygen content was calculated from the residual combustible mass, and the data obtained were corrected to the moisture and ash content determined using TGA analysis. The measurements were performed in triplicates and are presented in the manuscript as the averaged values ± SD.

2.2.3. Total Organic Carbon

Total organic carbon (TOC) in fractions of dried and milled biochar samples was determined by a dry combustion method on a Shimadzu SSM-5000A analyzer (Shimadzu Europa GmbH, Duisburg, Germany) by the certified laboratory of Povodí Moravy, s.p. (Brno, Czech Republic) in respect to the CSN EN ISO/IEC 17025:2018 ISO standard. TOC was calculated as a difference in total carbon (TC) and total inorganic carbon (TIC) content in the samples. TC was determined by the direct burning of 0.1 g of solid material in the SSM-TC furnace at 900 °C. TIC was determined by mixing 0.1 g of solid material with 0.5 mL of concentrated H3PO4 (14.8 M) and the subsequent burning of the sample in an SSM-IC furnace at 200 °C. For both analyses, oxygen (flow rate 500 mL/min) was used as the carrier gas.

2.3. Conductivity and pH of Water Extract

The individual fractions of biochar samples were characterized by measuring the pH and conductivity of their water extracts. For these purposes, 1 g of individual dried and milled biochar samples was dispersed in 10 mL of demineralized water. After 1 h of shaking (under laboratory conditions), pH was measured directly in the suspension. For the conductivity measurement, the individual samples were filtered through 0.45 μm syringe filters (nylon membrane). Additionally, the pH of biochar extracts was characterized also by using the standard calcium chloride method. For these purposes, 1 g of individual dried and milled fractions of biochar was dispersed in 10 mL 0.01 M CaCl2 solution. After 1 h of shaking, the pH was measured directly in the suspension.
The pH and conductivity measurements were performed on three independently prepared replicates and the data presented in the manuscript are shown in the form of average values ± SD.

2.4. Structural Characterization

The characterization of structural motifs and differences between individual fractions of biochar samples were investigated using Fourier transform infrared (FTIR) spectrometry and nuclear magnetic resonance (NMR).

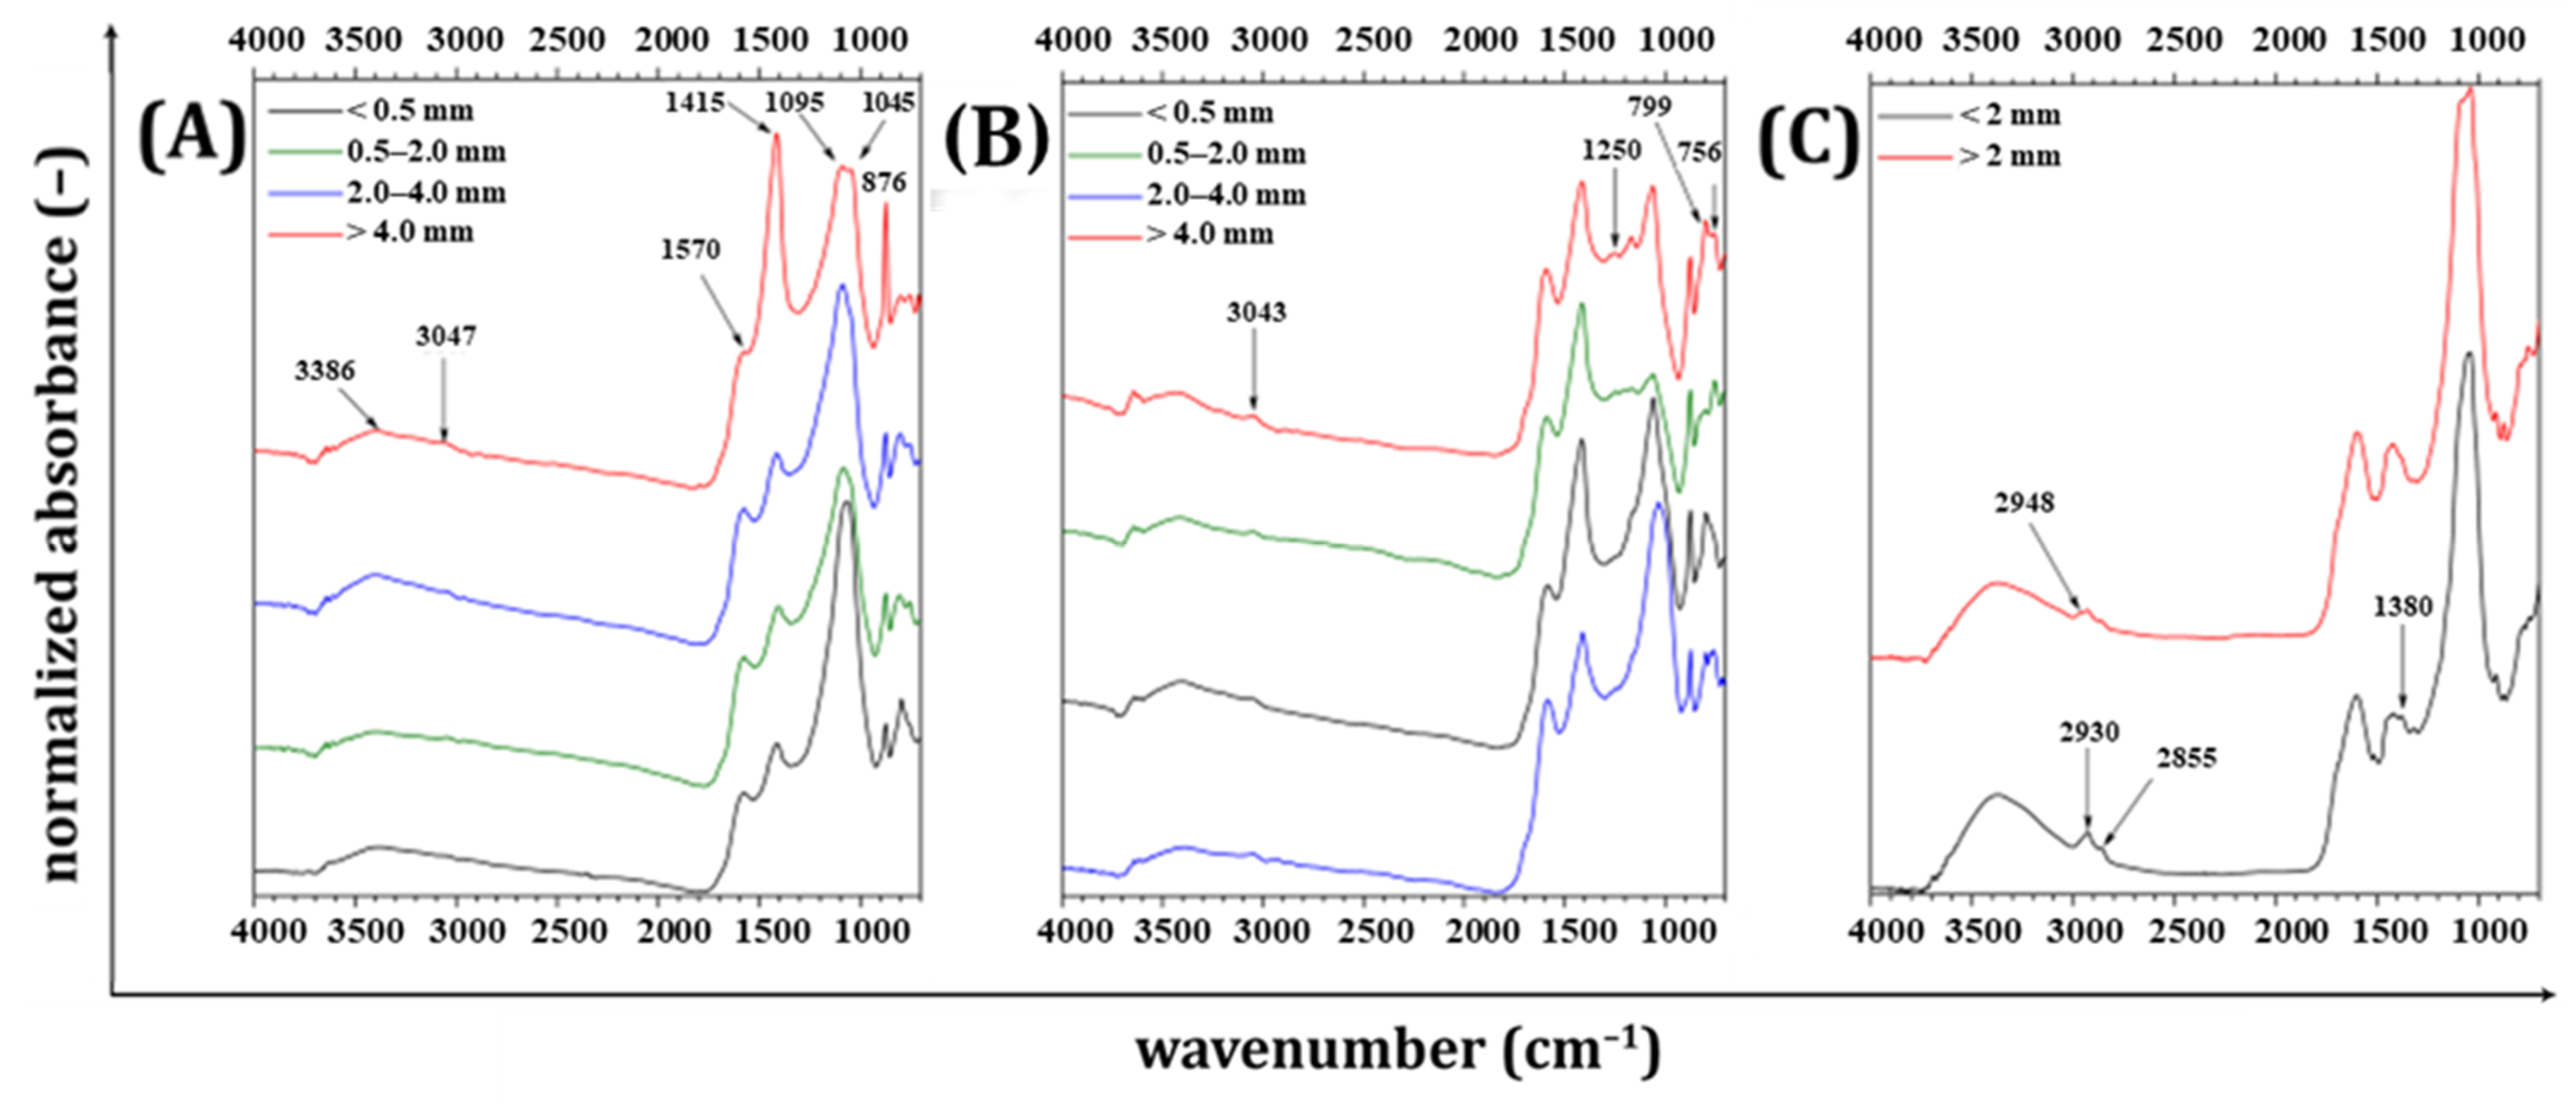
2.4.1. FTIR Spectrometry

The FTIR structural characterization of individual fractions of biochar samples was performed using the attenuated total reflectance (ATR) technique. For these purposes, individual samples were attached to the ATR crystal (single reflection built-in germanium ATR crystal) and subsequently, FTIR spectra were recorded using a Nicolet iS50 spectrometer (Thermo Fisher Scientific, Waltham, MA, USA). All measurements were performed at 25 °C in the spectral range of 4000–600 cm−1 at 4 cm−1 resolutions as an average of 128 scans. A background spectrum was collected from the clean dry surface of the ATR crystal in an ambient atmosphere. Raw absorption infrared spectra with no artificial processing (such as baseline or ATR corrections) are presented and evaluated.

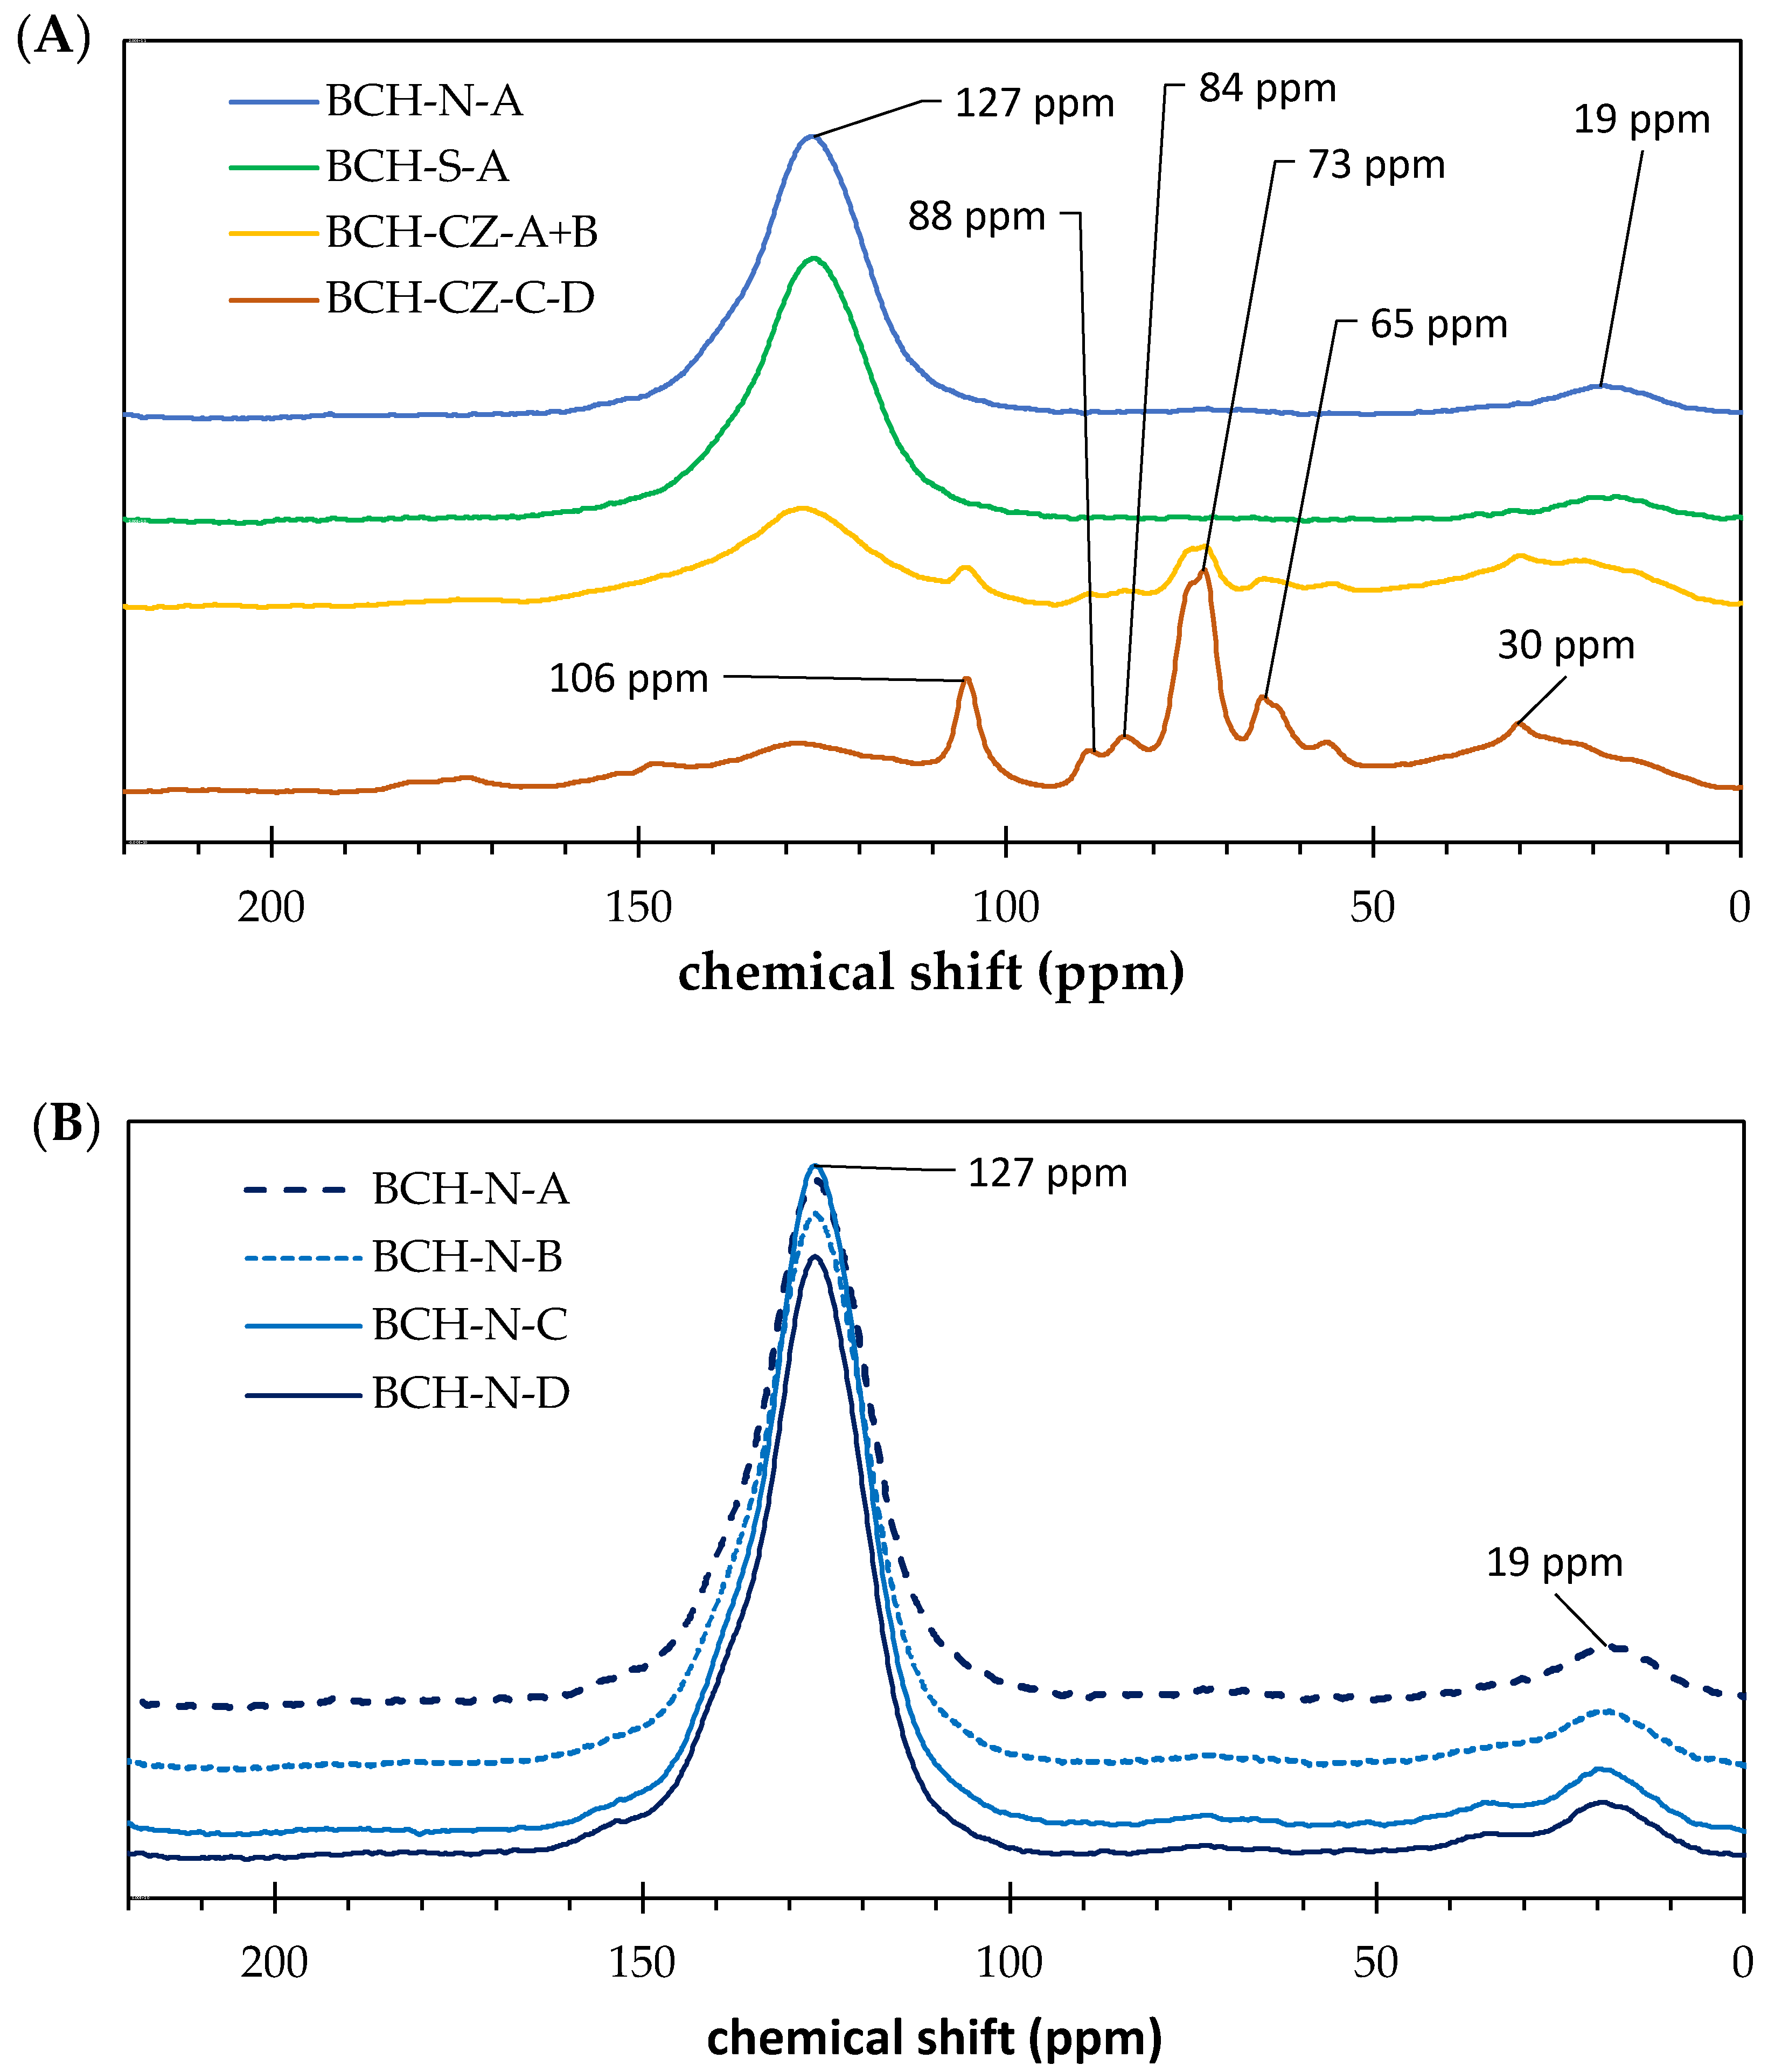
2.4.2. 13C NMR Analysis

NMR analysis on individual fractions of biochar samples was performed with a Bruker Avance Neo instrument (Bruker Corporation, Billerica, MA, USA) working at 700 MHz. 13C cross-polarization (CP) NMR spectra with magic angle spinning (MAS) were recorded by using a 4 mm dual CP-MAS probehead (rotor) for solid-state measurement. Further processing of NMR and the assessment of the content of individual carbon structural motives was performed using the Origin 2019b software (OriginLab, Northampton, NC, USA).

2.5. Morphological Analysis

The morphological analysis of the individual size fractions of biochar was performed by using scanning electron microscopy (SEM) and by specific surface area measurement of the samples using the Brunauer–Emmett–Teller (BET) analysis.

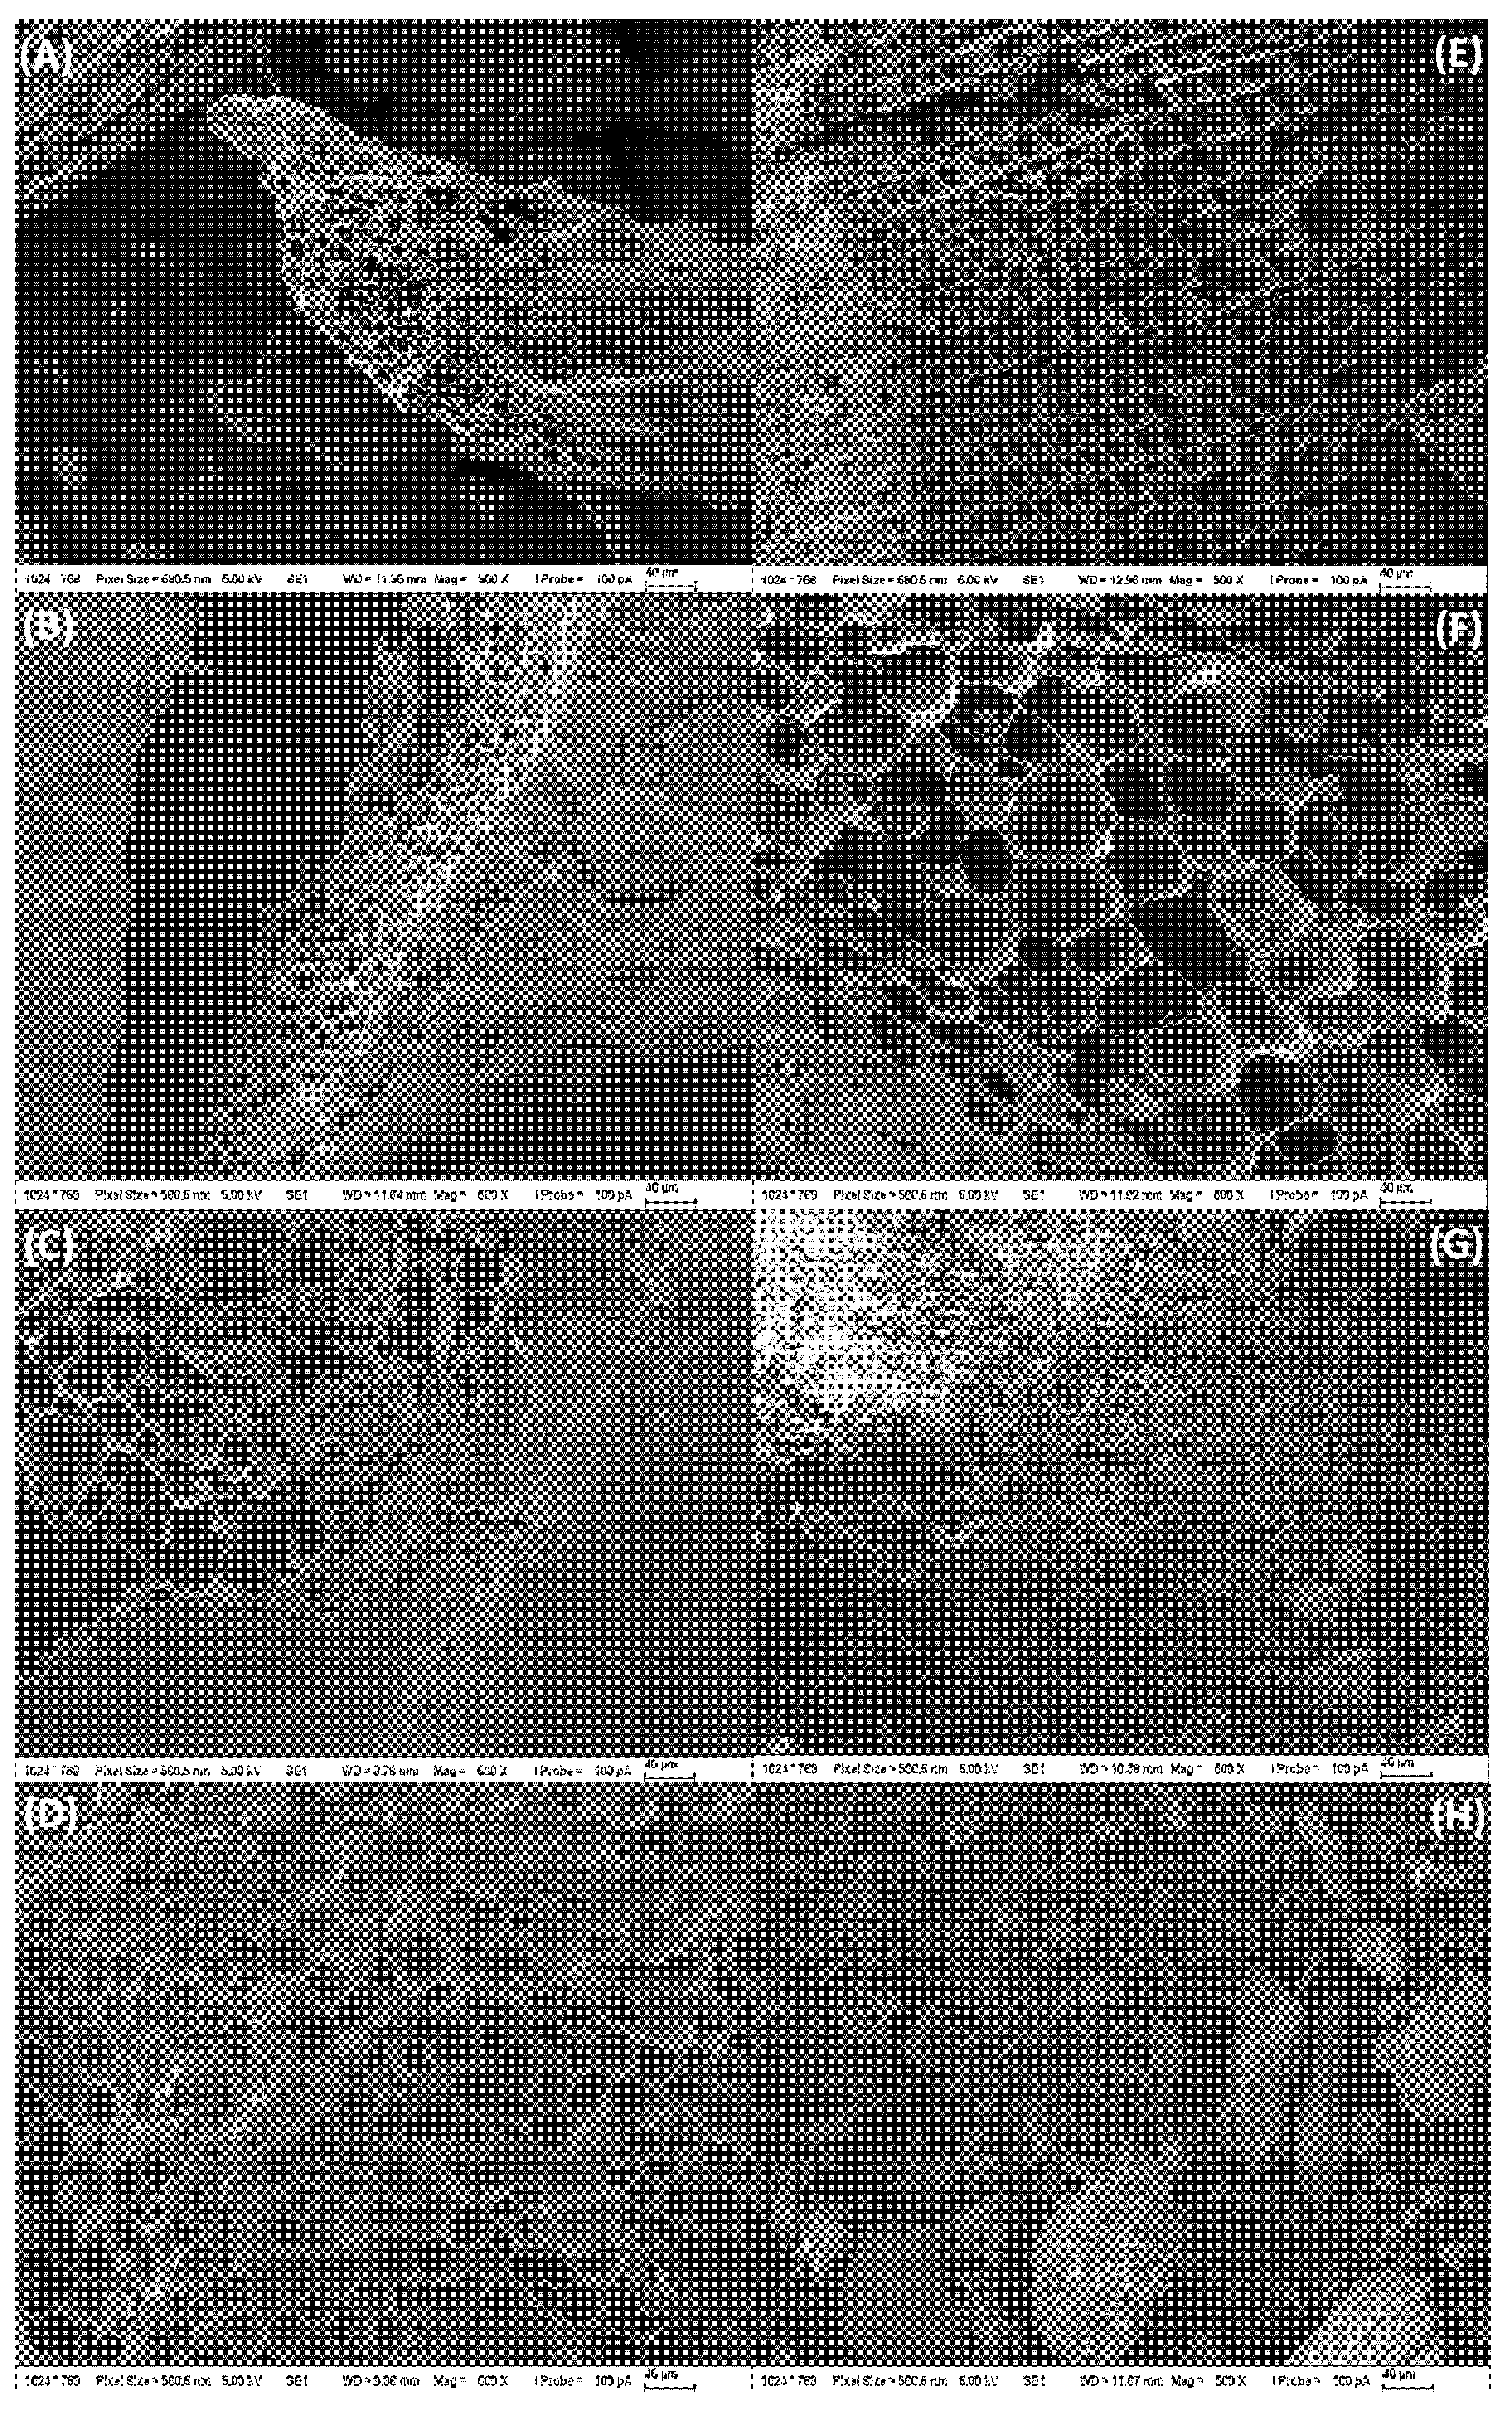
2.5.1. SEM Characterization

The visualization of internal structure and porosity was realized using SEM imaging. For purposes of this analysis, small parts of the biochar specimen were selected. These specimens were subsequently gold-coated in a sputtering device and investigated using a scanning electron microscope ZEISS EVO LS 10 in the mode of secondary electrons (SE). The accelerating voltage was set to 5 kV.

2.5.2. BET Analysis

The specific surface area of the individual fractions of studied biochar samples was characterized by a specific surface analyzer Nova 2200e (Quantachrome Instruments, Boynton Beach, FL, USA) using the Brunauer–Emmett–Teller analysis. Prior to the measurement, the analyzed samples were degassed for 24 h at a constant temperature of 200 °C. The measurement of the specific surface area of biochar samples was performed in an inert atmosphere (nitrogen was used as analysis absorption gas) at a constant temperature of liquid nitrogen (77.3 K). The obtained specific surface areas of individual fractions of biochar samples presented in the manuscript are the average values of at least two individually replicated measurements.

2.5.3. Statistical Analysis

The individually obtained experimental data were processed using a Dean Dixon Q-test for identification and rejection of outliers in Statistica® 13.3 software (TIBCO, Palo Alto, CA, USA). The results presented in the manuscript are shown in the form of average values ± SD.

3. Results and Discussion

The main aim of the research was the investigation of the role of the biochar particle size on its corresponding physico-chemical properties, the content of organic and inorganic matter, and its morphological and structural characteristics. The research was performed on two representative samples of biochar possessing EBC certification for use in agriculture, and one sample of a biochar sample produced in the Czech Republic for use in agriculture. We believe that the results concluded for our selected sample database could be generalized for the biochar samples produced from lignocellulose-based biomass at comparable production conditions and that the results discussed in the manuscript will provide the crucial knowledge necessary for further assessment of biochar utilization as a soil conditioner as well as for a prediction of its agronomical potential.

3.1. Organic Matter Content and Elemental Analysis

The results of the analysis of the content of organic and inorganic content of individual fractions of studied biochar samples, as well as further determination of the content of organic elements (C, H, O, and N) composition, are summarized in Table 2. The data are indicating the decreasing content of organic matter (determined by TGA) and organic carbon (determined by EA and TOC) with the decreasing size fraction of biochar. Contrary to the decreasing contents of organic matter, the residual inorganic matter (or inorganic ash) content was increasing with biochar particle fineness. The increase in the content of inorganic ash in biochar produced at higher pyrolysis temperatures is connected with a decrease in the content of volatile substances (e.g., aliphatic moieties such as carboxylates etc.) and also the increase in the content of alkaline metals and alkaline earth metals [28].
The comparison of elemental composition between the individual used samples shows the same trends with the increasing contents of organic carbon and a minor increase in the content of hydrogen and nitrogen with the increasing size fraction of biochar. The most significant effect of biochar texture on the determined content of organic matter was observed for BCH-N samples (1/3 difference relatively). On the other hand, the lowest difference was observed for BCH-CZ (1/4 difference relatively). The determined values of organic carbon content are in good agreement with producers’ declared values (63.2 wt.% of carbon for BCH-S [29]; 79.4 wt.% for BCH-N [30]; and 45 wt.% for BCH-CZ [31]), determined by TOC analysis. The BCH-CZ sample reflected the highest content of oxygen, which relates to the lower pyrolysis temperature used for the production of this biochar sample (450–470 °C) compared to the remaining two samples (pyrolyzed at temperatures above 650 °C). The lower pyrolysis temperature indicates the higher content of oxygen functional groups of the volatile acidic organic moieties [32] in the case of BCH-CZ compared to the remaining two samples.
The elemental composition of the biochar fractions (except the sample BCH-CZ) meets the criteria for use in agriculture defined by EBC [20]. EBC restrictions define the value of the H/C ratio below 0.7 as the crucial parameter regarding the organic element composition. Moreover, the results in Table 2 also indicate the size relation of the content of N. Nitrogen represents the macronutrient important for soil fertility [32]. The determined results indicate more significant effects of coarser biochar particles on soil fertility considering its use as a soil conditioner in agriculture.

3.2. pH, Conductivity of Aqueous Extract

The role of individual particle size fraction on the leaching of macronutrients and micronutrients was addressed in the manuscript by the determination of pH and conductivity of aqueous extract. The effect of the size fractions of selected biochar samples on the pH and conductivity of water extract is summarized in Table 3. The pH of analyzed samples was in respect to the published literature [25,26] for most of the samples increasing with the decreasing size of biochar particles, indicating the increasing content of soluble alkaline metals (e.g., K, Na, Mg, and Ca). The observed variations in pH between the individual fractions of the same biochar are for the EBC biochar samples (BCH-N and BCH-S) below 5%, on the other hand, the difference between the fractions of the BCH-CZ sample is more significant at it reaches almost 20%. More significant differences were observed in the conductivity measurements, where even the EBC biochar samples reflected a more significant variation between the fractions (BCH-S < 25%, BCH-N < 30%, and BCH-CZ < 10%). This result correlates well with the observed increase in the inorganic ash content summarized in Table 2.
Only the finest fraction of BCH-N-A showed a minor break in the observed trend, resulting in slightly lower pH and conductivity in comparison with coarser fractions. These results were supported by the observed increase in measured conductivity of individual fractions of samples, where the finest fractions reflected the highest conductivities and the measured values continually decreased with the increase in the particle size of a fraction. The comparison of individual used biochar samples indicated the more alkaline nature of BCH-S, followed by BCH-N, and at the end was the less alkaline sample of BCH-CZ. These findings correlate well with the production conditions of all three biochar samples and mainly their used temperature of pyrolysis, which was in the case of the BCH-S and BCH-N samples above 600 °C, in contrast to the BCH-CZ sample, which was 450–470 °C. The higher pyrolysis temperature is, according to the literature [33,34], associated with the increase in biochar pH due to the combined effect of the increasing content of alkaline metals and alkaline earth metals (K, Na, Mg, and Ca), and with an increase in the decomposition of acidic organic moieties during pyrolysis, which are considered to be less stable at higher temperatures. The higher content of inorganic ash for the samples of BCH-S and BCH-CZ compared to the BCH-N sample, together with the almost four times lower conductivity of BCH-N, indicate different structural moieties contributing to the total alkalinity of fractions of the BCH-N sample. The high alkalinity of the BCH-S sample is probably caused by the high content of inorganic salts of alkaline metals and alkaline earth metals, as well as a lower content of acidic organic moieties. On the other hand, BCH-N has a significantly lower content of inorganic salts of alkaline metals, as well as a lower content of acidic organic moieties than BCH-S. To summarize, BCH-CZ contains higher contents of inorganic salts, but contrary to the remaining two samples, with a more neutral pH response. The measured pH values are also in good agreement with the producers declared data of pH (CaCl2) = 9.6 [29] for sample BCH-S and pH (CaCl2) = 8.5 [30] for sample BCH-N, respectively.
The results confirmed the alkaline nature of all the fractions of biochar samples possessing the EBC certification for use in agriculture. Fidel et al. [35] identified that the alkaline nature of biochar is responsible for its positive effects on soil properties and soil fertility due to the specific interactions of the surface functional groups of biochar with the soil organic matter, which is expected to be more pronounced for BCH-N and BCH-S samples in comparison with the BCH-CZ sample. They also described that the total biochar alkalinity and the contribution of individual structural moieties (carbonates, organics, inorganics, and low pKa structures) to the total alkalinity of biochar are dependent on the biochar pyrolysis properties and used feedstock materials.

3.3. Structural Analysis

The investigation of the structure of the studied samples of biochar and the effect of the size fraction of individual biochar samples on their crucial structural motives was studied by NMR and FTIR spectrometry.
The NMR analysis was used as the main analytical method for the identification of structural differences caused by the texture of biochar samples, as well as for mutual comparison of the individual biochar samples (Figure 1). The results indicate no direct dependence of detected structural motives on the size fraction in the case of BCH-N and BCH-S samples. On the other hand, the BCH-CZ sample showed a more complex structure with more structural motives detected, which also depended partially on the size of the analyzed biochar fraction.
To access the main structural motives and their relative content in the analyzed biochar sample, the data obtained from 13C NMR were integrated according to [21]. The relative content of the individual structural motives of the analyzed biochar fractions is summarized in Table 4. The outcome is straightforward, both the biochar samples possessing the EBC certification for use in agriculture showed similar structural features with the dominant content of aryl carbon structures between 76.5 and 81.9%. These aromatic structures are the main structural component of both BCH-S and BCH-N biochar samples. Moreover, for both BCH-N and BCH-S samples, also a minor content of alkyl carbon moieties (5.1–7.9) was detected. All the other structures identified by the 13C NMR were below 1.5%. These conclusions for BCH-N and BCH-S are consistent with all the studied size fractions regardless of the sample texture. The obtained data also confirm that both these biochar samples were produced at the optimal pyrolysis conditions and there is no detectable composition of the original biomass residues. The data of both the studied fractions of BCH-CZ biochar show slightly more complex structural features with the principal content of 30.1–48.5% of aryl carbon structures and more dominant content of alkyl carbon structural moieties between 21.0 and 24.3%. Moreover, detectable contents of O-alkyl (13.5 to 34.8%), N-alkyl carbon and methoxy region (4.9 to 7.2%), and carbonyl structures (2.4 to 2.9%) were also found in the studied fractions of the BCH-CZ sample.
These results correlate well with elemental analysis, where a significantly higher content of O and H and a slightly higher content of N were detected (Table 2) for fractions of BCH-CZ biochar. The explanation is straightforward: BCH-CZ biochar was produced at the lower temperature of pyrolysis, which resulted in a lower extent of biomass to biochar conversion compared to the remaining two biochar samples. As a consequence, the minor contents of O-containing functional groups were preserved [33,34]. The finer fraction of BCH-CZ indicated the higher content of aromatic aryl carbon-containing structures, and oppositely, a lower content of O-alkyl and carboxyl-containing structural moieties. NMR analysis indicates that both BCH-N and BCH-S biochar samples will be more stable in an aqueous environment, as their major structural features are aromatic and aliphatic carbon-containing moieties, on the other side the structure of BCH-CZ biochar contains some structural features (carboxyl, O-alkyl, and N-alkyl) with higher potential to be accessible in soil and the aqueous environment of soil. These are in good agreement with the published literature discussing the role of pyrolysis temperature on the structural motives of biochars [21,36].
The attenuated total reflectance (ATR-FTIR) technique was also used as a complementary technique for a deeper structural characterization of biochar samples. The subsequent data interpretation of the individual absorption bands was conducted according to the literature data [37,38,39]. ATR-FTIR spectra (Figure 2) of all samples show several common spectral features.
One of these is represented by a broad band with variable relative intensity located at around 1600–1570 cm−1, which is attributed to symmetric C=C stretching in aromatic moieties. The symmetric valence vibrations of aromatic rings (C–H stretching in aromatic groups) occur in the spectra as weak bands and/or less pronounced shoulders at around 3050 cm−1. The presence of the aromatic rings is usually also manifested by the sharp band centred at about 875 ± 5 cm−1, resulting from the C–H out-of-plane bending vibrations mode of the aromatic compounds. Further differences among the samples concerning aromatic groups can be deduced from the deeper evaluation of the fingerprint region 900–700 cm−1. This region is characterized by sharp and various intensive C–H out-of-plane bending bands at 825 cm−1, 800 cm−1, and 760 cm−1. Unlike other samples, BCH-CZ biochar samples contain a less pronounced absorption band at 875 cm−1, as a result of the lower relative content of aromatic moieties, which can be ascribed to the lower temperature of the pyrolysis used during its production. The presence of aromatic rings and/or inorganic carbonate were confirmed by the intensive band at 1415 ± 10 cm−1 in all samples. Further spectral features, which are in common for all the biochars refer to aliphatic compounds. The relative content of aliphatic groups is evaluated primarily in the 3000–2800 cm−1 spectral range. Pronounced bands at 2935 ± 5 cm−1 and 2855 cm−1 were ascribed to asymmetric and symmetric C–H stretching in methylene groups, which were only observed for fractions of BCH-CZ biochar sample, occurring as a weak band and/or shoulder in the rest of the biochars. The FTIR spectrum of BCH-CZ-B (particle size > 2 mm) contains a less pronounced shoulder at around 2948 cm−1, which is attributed to asymmetric C–H stretching of –CH3 functional groups. Furthermore, the deformation vibrations of the –CH3 functional groups at 1380 cm−1 occur in the BCH-CZ spectra. The characteristic absorption bands concerning alkyl/aromatic ethers (mixture) can be deducted from the deeper evaluation of fingerprint regions 1300–1200 cm−1 and 1150–1050 cm−1. The first region is characterized by a relatively intense band at 1250 ± 5 cm−1, corresponding to the C–O vibration in aryl-ethers. This band is apparent only in the spectra of Novoterra samples. The latter fingerprint zone is characterized by two bands at 1080 ± 10 cm−1 and 1050 ± 10 cm−1, corresponding to the asymmetric C–O–C and C–C–O stretching in mixture ethers. The broad absorption bands centred at about 3450–3380 cm−1 correspond to O–H stretching of moisture (water molecules), which are connected with an intramolecular hydrogen bond. The observed more complex structure of BCH-CZ samples correlate well with the results of 13C NMR spectroscopy, and also with the observed content higher of N, H, and mainly O determined by elemental analysis.

3.4. Morphological Analysis

The ability of biochar to act as a soil amendment and to positively influence the properties of soil due to the interaction with soil nutrients, pollutants, and/or water is closely connected with its internal morphology and the development of its internal porous structure [40]. The porosity and pore size of biochar are crucial parameters of biochar defining its soil amendment potential [41]. The morphological characteristics of studied biochar samples were determined by a combination of SEM visualization and BET analysis providing the information on the specific surface area.
The SEM visualization showed that the development of internal porous structure is rather dependent on source material and pyrolysis conditions than on the size fraction of the biochar. Figure 3 is indicating that the individual fractions (A to D) of the same sample of biochar showed the comparable development of the internal porous structure. The comparison of individual biochar samples confirmed a similar porous structure with the well-developed internal pores of biochar samples BCH-N and BCH-S with a partially larger pore size of fractions of the BCH-N sample. Both these biochar samples were prepared by pyrolysis at a high temperature above 600 °C. In contrast, SEM visualization indicated a low extent of development of a porous structure for the BCH-CZ sample, produced at low temperatures of pyrolysis around 450 °C. SEM showed, for fractions of BCH-CZ, rather small fine particles in submicron size range, as well as small residual structures originating from the source biomass and small crystal-like structures. These results correlate well with data published in the literature [42,43,44]. Ma et al. [43] defined the well-developed porous structure as a typical feature of biochar samples produced at a higher pyrolysis temperature above 600 °C originating from lignin-based source biomass materials. These biochar samples retained the original macrocellular morphology of their feedstock, undergoing only partial degradation and causing the creation of a rough structure with a large extent of pores development. The original biomass used for the production of BCH-S and BCH-N was based on the sunflower and corn residues and peels (BCH-S) and softwood cut (BCH-N), which, together with the production temperature of pyrolysis above 600 °C, resulted in their well-developed porous structure. The cellulose-based biomass (corn digestate, wheat residues, and grass biomass) used for the production of BCH-CZ, together with the lower temperature of pyrolysis, yielded a material with spherical microparticles and no apparent pores on the surface.
The SEM visualization of individual sample morphologies was supported also by the results of the BET analysis, where the specific surface area of individual fractions of BCH-S, BCH-N, and BCH-CZ samples were determined (Figure 4).
The increase in the size of the biochar fraction obtained by sieve analysis had a different effect on the specific surface areas (SSA) of individual studied biochar samples. The BCH-N sample reflected the direct dependency of a specific surface area on the size of fraction with the highest specific surface area detected in the case of BCH-N-D. In the case of the BCH-S sample, initially from BCH-S-A to BCH-S-C, the specific surface area was increasing, but in the case of the BCH-S-D sample, a significant decrease in the trend of specific surface area was observed. Despite some minor observed variations in SSA between the individual size fractions of BCH-S and BCH-N, both these biochar samples reflected SSA, and are in good agreement with data published in the literature [45]. Chen et al. [46] described the strong Gaussian dependence of SSA on the pyrolysis temperature used during biochar production, with the maximal SSA formed at pyrolysis temperatures between 600 and 800 °C. BET analysis on both the fractions of BCH-CZ showed almost 10× lower specific surface area in comparison with the previous two biochar samples. These results are in good agreement with the SEM visualization of the internal porous structure (Figure 3), as well as with the published data defining the dependency of biochar internal structure on pyrolysis conditions and used feedstock materials (lignin-based vs. cellulose-based) [42,43,44]. The determined value of the specific surface area of the BCH-N sample corresponds to the value certified for the sample by the producer (SSA = 269 m2/g; [30]) [29]. On the other hand, the values of SSA declared by Sonnenerde GmbH for a biochar sample of BCH-S (SSA = 297 m2/g; [29]) and Biouhel.cz s.r.o. for a biochar sample of BCH-CZ (SSA = 120 m2/g; [20]) are significantly higher than the determined values, which could be explained by the heterogeneity of their products or inconsistency of settings of the BET analyses.

4. Conclusions

The main aim of the present study was the investigation of the mutual interconnection of biochar texture to its physicochemical, structural, and morphological properties. The results of our work confirm that the importance of a selection of optimal source biomass material as the content of lignin, cellulose, and hemicellulose, together with the conditions of pyrolysis (mainly the temperature of pyrolysis) have an indisputable role in the managing of the properties of produced biochar, which brings important consequences also in respect to its possible utilization as a soil conditioner with optimal agronomical effect in the soil for a longer timescale. Our results indicate that the biochar texture has a minor effect on its main structural motives; the more significant effect was observed in the physicochemical properties (pH and conductivity of aqueous leachate), the content of organic matter and inorganic ash, and internal morphology. With decreasing biochar fraction fineness, the content of inorganic ash increases. Such samples contain higher ratios of inorganic alkaline salts, which in consequence more significantly increase the pH and salinity of aqueous extracts. These finer fractions of biochar could represent suitable soil amendment for acidic soils, and after a detailed analysis of corresponding ions, which are released from biochar, the agronomical potential concerning the time scale of its possible operation in soils could be further discussed in more detail. Agronomically more stable biochars containing a higher content of organic matter and organic carbon, with alkaline pH response and a well-developed aromatic porous structure, could be produced from lignin-based biomass residues at higher pyrolysis temperatures, which is an important finding, taking into account the possible utilization of biochar as a soil conditioner, especially in a longer timescale. We believe that the results summarized in our work for a selected sample database could be generalized for the biochar samples produced from lignocellulose-based biomass at comparable production conditions, which is an important finding for helping further the assessment of biochar utilization as a soil conditioner, as well as for a prediction of its agronomical potential.

Author Contributions

Conceptualization, M.K.; methodology, M.K.; investigation, S.S., L.K., M.T., J.H. and V.E.; writing—original draft preparation, M.K., S.S., J.S. and V.E.; writing—review and editing, M.K., S.S., J.S. and V.E.; supervision, M.K.; project administration, M.K.; funding acquisition, M.K. All authors have read and agreed to the published version of the manuscript.

Funding

This research was funded by Czech Science Foundation of Czech Republic by grant number GJ20-28208Y. We acknowledge also CF NMR of CIISB, Instruct-CZ Centre, supported by MEYS CR (LM2018127) and European Regional Development Fund-Project “UP CIISB” (No. CZ.02.1.01/0.0/0.0/18_046/0015974).

Acknowledgments

The collective of authors also acknowledges Jaromir Tousek (Josef Dadok National NMR Centre of CEITEC Masaryk University, Brno) for the NMR analyses and Marek Burian (Povodi Moravy, s.p., Brno) for the TOC analyses.

Conflicts of Interest

The authors declare no conflict of interest.

References

  1. Zeeshan, M.; Ahmad, W.; Hussain, F.; Ahamd, W.; Numan, M.; Shah, M.; Ahmad, I. Phytostabalization of the Heavy Metals in the Soil with Biochar Applications, the Impact on Chlorophyll, Carotene, Soil Fertility and Tomato Crop Yield. J. Clean. Prod. 2020, 255, 120318. [Google Scholar] [CrossRef]
  2. Yang, C.D.; Lu, S.G. Effects of Five Different Biochars on Aggregation, Water Retention and Mechanical Properties of Paddy Soil: A Field Experiment of Three-Season Crops. Soil Tillage Res. 2021, 205, 104798. [Google Scholar] [CrossRef]
  3. Feng, W.; Yang, F.; Cen, R.; Liu, J.; Qu, Z.; Miao, Q.; Chen, H. Effects of Straw Biochar Application on Soil Temperature, Available Nitrogen and Growth of Corn. J. Environ. Manag. 2021, 277, 111331. [Google Scholar] [CrossRef] [PubMed]
  4. Yang, W.; Feng, G.; Miles, D.; Gao, L.; Jia, Y.; Li, C.; Qu, Z. Impact of Biochar on Greenhouse Gas Emissions and Soil Carbon Sequestration in Corn Grown under Drip Irrigation with Mulching. Sci. Total Environ. 2020, 729, 138752. [Google Scholar] [CrossRef]
  5. Siedt, M.; Schäffer, A.; Smith, K.E.C.; Nabel, M.; Roß-Nickoll, M.; van Dongen, J.T. Comparing Straw, Compost, and Biochar Regarding Their Suitability as Agricultural Soil Amendments to Affect Soil Structure, Nutrient Leaching, Microbial Communities, and the Fate of Pesticides. Sci. Total Environ. 2021, 751, 141607. [Google Scholar] [CrossRef]
  6. Kumar, A.; Joseph, S.; Tsechansky, L.; Schreiter, I.J.; Schüth, C.; Taherysoosavi, S.; Mitchell, D.R.G.; Graber, E.R. Mechanistic Evaluation of Biochar Potential for Plant Growth Promotion and Alleviation of Chromium-Induced Phytotoxicity in Ficus Elastica. Chemosphere 2020, 243, 125332. [Google Scholar] [CrossRef]
  7. Albert, H.A.; Li, X.; Jeyakumar, P.; Wei, L.; Huang, L.; Huang, Q.; Kamran, M.; Shaheen, S.M.; Hou, D.; Rinklebe, J.; et al. Influence of Biochar and Soil Properties on Soil and Plant Tissue Concentrations of Cd and Pb: A Meta-Analysis. Sci. Total Environ. 2021, 755, 142582. [Google Scholar] [CrossRef]
  8. Li, M.; Zhang, J.; Yang, X.; Zhou, Y.; Zhang, L.; Yang, Y.; Luo, L.; Yan, Q. Responses of Ammonia-Oxidizing Microorganisms to Biochar and Compost Amendments of Heavy Metals-Polluted Soil. J. Environ. Sci. 2021, 102, 263–272. [Google Scholar] [CrossRef]
  9. Ajeng, A.A.; Abdullah, R.; Ling, T.C.; Ismail, S.; Lau, B.F.; Ong, H.C.; Chew, K.W.; Show, P.L.; Chang, J.-S. Bioformulation of Biochar as a Potential Inoculant Carrier for Sustainable Agriculture. Environ. Technol. Innov. 2020, 20, 101168. [Google Scholar] [CrossRef]
  10. Hussain, R.; Ravi, K.; Garg, A. Influence of Biochar on the Soil Water Retention Characteristics (SWRC): Potential Application in Geotechnical Engineering Structures. Soil Tillage Res. 2020, 204, 104713. [Google Scholar] [CrossRef]
  11. Zhu, X.; Li, Y.; Wang, X. Machine Learning Prediction of Biochar Yield and Carbon Contents in Biochar Based on Biomass Characteristics and Pyrolysis Conditions. Bioresour. Technol. 2019, 288, 121527. [Google Scholar] [CrossRef]
  12. Zhu, K.; Wang, X.; Chen, D.; Ren, W.; Lin, H.; Zhang, H. Wood-Based Biochar as an Excellent Activator of Peroxydisulfate for Acid Orange 7 Decolorization. Chemosphere 2019, 231, 32–40. [Google Scholar] [CrossRef] [PubMed]
  13. Muter, O.; Berzins, A.; Strikauska, S.; Pugajeva, I.; Bartkevics, V.; Dobele, G.; Truu, J.; Truu, M.; Steiner, C. The Effects of Woodchip- and Straw-Derived Biochars on the Persistence of the Herbicide 4-Chloro-2-Methylphenoxyacetic Acid (MCPA) in Soils. Ecotoxicol. Environ. Saf. 2014, 109, 93–100. [Google Scholar] [CrossRef] [PubMed]
  14. Song, C.; Shan, S.; Yang, C.; Zhang, C.; Zhou, X.; Ma, Q.; Yrjälä, K.; Zheng, H.; Cao, Y. The Comparison of Dissolved Organic Matter in Hydrochars and Biochars from Pig Manure. Sci. Total Environ. 2020, 720, 137423. [Google Scholar] [CrossRef] [PubMed]
  15. Yin, Q.; Liu, M.; Ren, H. Biochar Produced from the Co-Pyrolysis of Sewage Sludge and Walnut Shell for Ammonium and Phosphate Adsorption from Water. J. Environ. Manag. 2019, 249, 109410. [Google Scholar] [CrossRef]
  16. Qian, T.-T.; Wu, P.; Qin, Q.-Y.; Huang, Y.-N.; Wang, Y.-J.; Zhou, D.-M. Screening of Wheat Straw Biochars for the Remediation of Soils Polluted with Zn (II) and Cd (II). J. Hazard. Mater. 2019, 362, 311–317. [Google Scholar] [CrossRef]
  17. Li, J.; Yu, G.; Pan, L.; Li, C.; You, F.; Xie, S.; Wang, Y.; Ma, J.; Shang, X. Study of Ciprofloxacin Removal by Biochar Obtained from Used Tea Leaves. J. Environ. Sci. 2018, 73, 20–30. [Google Scholar] [CrossRef]
  18. Razzaghi, F.; Obour, P.B.; Arthur, E. Does Biochar Improve Soil Water Retention? A Systematic Review and Meta-Analysis. Geoderma 2020, 361, 114055. [Google Scholar] [CrossRef]
  19. Nemati, M.R.; Simard, F.; Fortin, J.-P.; Beaudoin, J. Potential Use of Biochar in Growing Media. Vadose Zone J. 2015, 14, 1–8. [Google Scholar] [CrossRef]
  20. EBC (2012–2022). European Biochar Certificate-Guidelines for a Sustainable Production of Biochar; Version 10.0; European Biochar Foundation (EBC): Arbaz, Switzerland; Available online: http://european-biochar.org (accessed on 1 January 2022).
  21. Campos, P.; Miller, A.Z.; Prats, S.A.; Knicker, H.; Hagemann, N.; de la Rosa, J.M. Biochar Amendment Increases Bacterial Diversity and Vegetation Cover in Trace Element-Polluted Soils: A Long-Term Field Experiment. Soil Biol. Biochem. 2020, 150, 108014. [Google Scholar] [CrossRef]
  22. Wang, L.; Yang, K.; Gao, C.; Zhu, L. Effect and Mechanism of Biochar on CO2 and N2O Emissions under Different Nitrogen Fertilization Gradient from an Acidic Soil. Sci. Total Environ. 2020, 747, 141265. [Google Scholar] [CrossRef] [PubMed]
  23. Rehman, A.; Nawaz, S.; Alghamdi, H.A.; Alrumman, S.; Yan, W.; Nawaz, M.Z. Effects of Manure-Based Biochar on Uptake of Nutrients and Water Holding Capacity of Different Types of Soils. Case Stud. Therm. Eng. 2020, 2, 100036. [Google Scholar] [CrossRef]
  24. Zaccheo, P.; Crippa, L.; Cattivello, C. Liming power of different particle fractions of biochar. Acta Hortic. 2014, 1034, 363–368. [Google Scholar] [CrossRef]
  25. Angst, T.E.; Sohi, S.P. Establishing Release Dynamics for Plant Nutrients from Biochar. GCB Bioenergy 2013, 5, 221–226. [Google Scholar] [CrossRef]
  26. Prasad, M.; Chrysargyris, A.; McDaniel, N.; Kavanagh, A.; Gruda, N.S.; Tzortzakis, N. Plant Nutrient Availability and PH of Biochars and Their Fractions, with the Possible Use as a Component in a Growing Media. Agronomy 2019, 10, 10. [Google Scholar] [CrossRef] [Green Version]
  27. Cybulak, M.; Sokołowska, Z.; Boguta, P.; Tomczyk, A. Influence of PH and Grain Size on Physicochemical Properties of Biochar and Released Humic Substances. Fuel 2019, 240, 334–338. [Google Scholar] [CrossRef]
  28. Liao, W.; Thomas, S. Biochar Particle Size and Post-Pyrolysis Mechanical Processing Affect Soil PH, Water Retention Capacity, and Plant Performance. Soil Syst. 2019, 3, 14. [Google Scholar] [CrossRef] [Green Version]
  29. Sonnenerde_Datenblatt_Bio. Available online: https://cdn-pf.niceshops.com/upload/file/sonnenerde_datenblatt_bio_pflanzenkohle_v2021_06.pdf (accessed on 13 January 2022).
  30. EBC-Pflanzenkohle-Analytik-PK-B31.Pdf. Available online: https://www.novocarbo.com/wp-content/uploads/2021/08/EBC-Pflanzenkohle-Analytik-PK-B31.pdf (accessed on 13 January 2022).
  31. Agrouhel_Pribal_Letak.Pdf. Available online: https://www.agrouhel.cz/wp-content/uploads/2017/09/agrouhel_pribal_letak.pdf (accessed on 27 May 2022).
  32. Dommergues, Y.R.; Ganry, F. Biological Nitrogen Fixation and Soil Fertility Maintenance. In Management of Nitrogen and Phosphorus Fertilizers in Sub-Saharan Africa; Springer: Dordrecht, The Netherlands, 1986; pp. 95–115. [Google Scholar]
  33. Gezahegn, S.; Sain, M.; Thomas, S. Variation in Feedstock Wood Chemistry Strongly Influences Biochar Liming Potential. Soil Syst. 2019, 3, 26. [Google Scholar] [CrossRef] [Green Version]
  34. Novak, J.M.; Lima, I.M.; Gaskin, J.W.; Steiner, C.; Ahmedna, M.; Watts, D.W.; Schomberg, H.H. Characterization of Designer Biochar Produced at Different Temperatures and Their Effects on a Loamy Sand. Ann. Environ. Sci. 2009, 3, 195–206. [Google Scholar]
  35. Fidel, R.B.; Laird, D.A.; Thompson, M.L.; Lawrinenko, M. Characterization and Quantification of Biochar Alkalinity. Chemosphere 2017, 167, 367–373. [Google Scholar] [CrossRef] [Green Version]
  36. Wu, W.; Yang, M.; Feng, Q.; McGrouther, K.; Wang, H.; Lu, H.; Chen, Y. Chemical Characterization of Rice Straw-Derived Biochar for Soil Amendment. Biomass Bioenergy 2012, 47, 268–276. [Google Scholar] [CrossRef]
  37. Cakmak, I.; Kirkby, E.A. Role of Magnesium in Carbon Partitioning and Alleviating Photooxidative Damage. Physiol. Plant. 2008, 133, 692–704. [Google Scholar] [CrossRef]
  38. Wu, M.; Feng, Q.; Sun, X.; Wang, H.; Gielen, G.; Wu, W. Rice (Oryza Sativa L.) Plantation Affects the Stability of Biochar in Paddy Soil. Sci. Rep. 2015, 5, 10001. [Google Scholar] [CrossRef] [PubMed] [Green Version]
  39. Singh, B.; Fang, Y.; Johnston, C.T. A Fourier-Transform Infrared Study of Biochar Aging in Soils. Soil Sci. Soc. Am. J. 2016, 80, 613–622. [Google Scholar] [CrossRef] [PubMed]
  40. Janu, R.; Mrlik, V.; Ribitsch, D.; Hofman, J.; Sedláček, P.; Bielská, L.; Soja, G. Biochar Surface Functional Groups as Affected by Biomass Feedstock, Biochar Composition and Pyrolysis Temperature. Carbon Resour. Convers. 2021, 4, 36–46. [Google Scholar] [CrossRef]
  41. Lu, S.; Zong, Y. Pore Structure and Environmental Serves of Biochars Derived from Different Feedstocks and Pyrolysis Conditions. Environ. Sci. Pollut. Res. 2018, 25, 30401–30409. [Google Scholar] [CrossRef] [PubMed]
  42. Xu, G.; Wei, L.L.; Sun, J.N.; Shao, H.B.; Chang, S.X. What Is More Important for Enhancing Nutrient Bioavailability with Biochar Application into a Sandy Soil: Direct or Indirect Mechanism? Ecol. Eng. 2013, 52, 119–124. [Google Scholar] [CrossRef]
  43. Ma, X.; Zhou, B.; Budai, A.; Jeng, A.; Hao, X.; Wei, D.; Zhang, Y.; Rasse, D. Study of Biochar Properties by Scanning Electron Microscope–Energy Dispersive X-Ray Spectroscopy (SEM-EDX). Commun. Soil Sci. Plant Anal. 2016, 47, 593–601. [Google Scholar] [CrossRef]
  44. Méndez, A.; Terradillos, M.; Gascó, G. Physicochemical and Agronomic Properties of Biochar from Sewage Sludge Pyrolysed at Different Temperatures. J. Anal. Appl. Pyrolysis 2013, 102, 124–130. [Google Scholar] [CrossRef]
  45. Mohanty, P.; Nanda, S.; Pant, K.K.; Naik, S.; Kozinski, J.A.; Dalai, A.K. Evaluation of the Physiochemical Development of Biochars Obtained from Pyrolysis of Wheat Straw, Timothy Grass and Pinewood: Effects of Heating Rate. J. Anal. Appl. Pyrolysis 2013, 104, 485–493. [Google Scholar] [CrossRef]
  46. Chen, Y.; Zhang, X.; Chen, W.; Yang, H.; Chen, H. The Structure Evolution of Biochar from Biomass Pyrolysis and Its Correlation with Gas Pollutant Adsorption Performance. Bioresour. Technol. 2017, 246, 101–109. [Google Scholar] [CrossRef] [PubMed]
Figure 1. 13C NMR spectra of (A) BCH-N-A, BCH-S-A, and both fractions of BCH-CZ, (B) individual fractions of BCH-N.
Agronomy 12 01768 g001
Figure 2. Attenuated Total Reflectance (ATR-FTIR) spectra of individual fractions of biochar samples (A) BCH-S, (B) BCH-N, and (C) BCH-CZ.
Agronomy 12 01768 g002
Figure 3. SEM visualization of individual biochar sample internal porous structure (A) BCH-S-A; (B) BCH-S-B; (C) BCH-S-C; (D) BCH-S-D; (E) BCH-N-A; (F) BCH-N-C; (G) BCH-CZ-A+B; and (H) BCH-CZ-C+D.
Agronomy 12 01768 g003
Figure 4. Specific surface area (SSA) of individual fractions of biochar determined by BET analysis.
Agronomy 12 01768 g004
Table 1. Labels of individual samples of biochar used in the manuscript.
Biochar ProducerFeedstockPyrolysis ConditionsFraction DescriptionLabel
Sonnenerde GmbHcorn and sunflower peels, fruit sludge20 min, max. 650 °C<0.5 mmBCH-S-A
0.5–2.0 mmBCH-S-B
2.0–4.0 mmBCH-S-C
>4.0 mmBCH-S-D
NovoCarbo GmbHsoftwood woodcut10 min, max. 720 °C<0.5 mmBCH-N-A
0.5–2.0 mmBCH-N-B
2.0–4.0 mmBCH-N-C
>4.0 mmBCH-N-D
Biouhel.cz s.r.ocorn digestate, wheat straw, grass biomass20–30 min, 450–470 °C<2.0 mmBCH-CZ-A+B
>2.0 mmBCH-CZ-C+D
Table 2. Characterization of individual fractions of studied biochar samples employing TGA (the content of organic matter—worg and inorganic ash—winorg), TOC and elemental analysis.
Sample Labelworg (wt.%)winorg (wt.%)TOC (wt.%)Elemental Composition (wt.%)H/C *
CHON
BCH-S-A67.932.154.459.97 ± 0.630.81 ± 0.095.39 ± 0.281.70 ± 0.110.16
BCH-S-B72.927.161.867.66 ± 1.020.94 ± 0.232.33 ± 0.442.00 ± 0.080.16
BCH-S-C79.021.061.071.72 ± 1.482.00 ± 0.142.93 ± 0.562.31 ± 0.080.33
BCH-S-D77.422.659.665.66 ± 0.541.61 ± 0.267.05 ± 0.293.09 ± 0.090.29
BCH-N-A71.428.661.263.40 ± 0.131.57 ± 0.064.69 ± 0.121.78 ± 0.180.30
BCH-N-B82.617.471.374.48 ± 0.651.63 ± 0.024.54 ± 0.261.92 ± 0.120.26
BCH-N-C91.18.978.684.34 ± 1.232.62 ± 0.352.39 ± 0.561.73 ± 0.100.37
BCH-N-D81.218.869.873.27 ± 0.662.64 ± 0.123.97 ± 0.291.34 ± 0.080.43
BCH-CZ-A+B70.329.741.647.89 ± 0.514.54 ± 0.1615.06 ± 0.282.36 ± 0.141.13
BCH-CZ-C+D77.222.848.256.40 ± 0.543.38 ± 0.3915.29 ± 0.373.10 ± 0.180.71
* H/C ratio was calculated from the molar concentration of C and H in the individual samples.
Table 3. pH (H2O and CaCl2 methods) and conductivity of individual fractions of biochar.
Sample LabelpH H2O (–)pH CaCl2 (–)Conductivity (mS/cm)
BCH-S-A10.04 ± 0.149.29 ± 0.063.053 ± 0.006
BCH-S-B10.07 ± 0.029.26 ± 0.042.973 ± 0.040
BCH-S-C10.05 ± 0.109.15 ± 0.022.417 ± 0.049
BCH-S-D10.02 ± 0.029.14 ± 0.022.260 ± 0.010
BCH-N-A9.24 ± 0.218.41 ± 0.020.830 ± 0.006
BCH-N-B9.65 ± 0.088.44 ± 0.041.046 ± 0.008
BCH-N-C9.37 ± 0.028.34 ± 0.070.969 ± 0.013
BCH-N-D9.35 ± 0.018.24 ± 0 040.887 ± 0.003
BCH-CZ-A+B8.56 ± 0.067.96 ± 0.043.447 ± 0.025
BCH-CZ-C+D7.16 ± 0.046.76 ± 0.033.227 ± 0.051
Table 4. Assessment (%) of different C-type structures determined by 13C NMR.
Sample Label185–220 ppm160–185 ppm90–160 ppm60–90 ppm45–60 ppm0–45 ppm
Carbonyl-CCarboxyl-CAryl-CO-alkyl-CN-alkyl-C/Methoxyl-CAlkyl-C
BCH-S-A0.51.576.51.40.46.9
BCH-S-B0.00.181.90.20.15.4
BCH-S-C0.00.380.40.20.07.1
BCH-S-D0.01.278.61.40.37.1
BCH-N-A0.10.377.91.20.07.2
BCH-N-B0.70.176.80.80.17.9
BCH-N-C0.00.178.60.10.07.1
BCH-N-D0.00.179.40.20.05.1
BCH-CZ-A+B0.02.448.513.54.924.3
BCH-CZ-C+D0.42.930.134.87.221.0
Publisher’s Note: MDPI stays neutral with regard to jurisdictional claims in published maps and institutional affiliations.

