Article

Carbon Footprint Assessment and Energy Budgeting of Different Annual and Perennial Forage Cropping Systems: A Study from the Semi-Arid Region of Karnataka, India

by
Konapura Nagaraja Manoj
1,*,
Bommalapura Gundanaik Shekara
2,
Shankarappa Sridhara
3,
Mudalagiriyappa
4,
Nagesh Malasiddappa Chikkarugi
2,
Pradeep Gopakkali
3,
Prakash Kumar Jha
5 and
P. V. Vara Prasad
5,6
1
Department of Agronomy, University of Agricultural Sciences, Gandhi Krishi Vignan Kendra, Bangalore 560 065, Karnataka, India
2
All India Coordinated Research Project on Forage Crops and Utilization, Zonal Agricultural Research Station, Vishweshwaraiah Canal Farm, Mandya 571 405, Karnataka, India
3
Center for Climate Resilient Agriculture, University of Agricultural and Horticultural Sciences, Shivamogga 577 201, Karnataka, India
4
All India Coordinated Research Project on Dryland Agriculture, University of Agricultural Sciences, Bangalore 560 065, Karnataka, India
5
Sustainable Intensification Innovation Lab, Kansas State University, Manhattan, KS 66506, USA
6
Department of Agronomy, Kansas State University, Manhattan, KS 66506, USA
*
Author to whom correspondence should be addressed.
Agronomy 2022, 12(8), 1783; https://doi.org/10.3390/agronomy12081783
Submission received: 6 July 2022 / Revised: 25 July 2022 / Accepted: 26 July 2022 / Published: 28 July 2022
(This article belongs to the Special Issue Advances in Forages, Cover Crops, and Biomass Crops Production)

Abstract

:
Efficient use of available resources in agricultural production is important to minimize carbon footprint considering the state of climate change. In this context, the current research was conducted to identify carbon and energy-efficient fodder cropping systems for sustainable livestock production. Annual monocropping, perennial monocropping, annual cereal + legume intercropping and perennial cereal + legume intercropping systems were evaluated by employing a randomized complete block design with three replications under field conditions. The lucerne (Medicago sativa L.) monocropping system recorded significantly lower carbon input (274 kg-CE ha−1 year−1) and showed higher carbon indices viz., carbon sustainability index (165.8), the carbon efficiency ratio (166.8) and carbon efficiency (347.5 kg kg-CE−1) over other systems. However, higher green fodder biomass led to statistically higher carbon output (78,542 kg-CE ha−1 year−1) in the Bajra–Napier hybrid (Pennisetum glaucum × Pennisetum purpureum) + lucerne perennial system. Similar to carbon input, lower input energy requirement (16,106 MJ ha−1 year−1) and nutrient energy ratio (25.7) were estimated with the lucerne perennial system. However, significantly higher energy output (376,345 and 357,011 MJ ha−1 year−1) and energy indices viz., energy use efficiency (13.3 and 12.2), energy productivity (5.8 and 5.3 kg MJ−1), net energy (327,811 and 347,961 MJ ha−1 year−1) and energy use efficiency (12.3 and 11.2) were recorded with Bajra–Napier hybrid + legume [lucerne and cowpea (Vigna unguiculata (L.) Walp.)] cropping systems, respectively. However, these systems were on par with the lucerne monocropping system. Additionally, Bajra–Napier hybrid + legume [cowpea, sesbania (Sesbania grandiflora (L.) Pers.) and lucerne] cropping systems also showed higher human energy profitability. Concerning various inputs’ contribution to total carbon and energy input, chemical fertilizers were identified as the major contributors (73 and 47%), followed by farmyard manure (20 and 22%) used to cultivate crops, respectively, across the cropping systems. Extensive use of indirect (82%) and non-renewable energy sources (69%) was noticed compared to direct (18%) and renewable energy sources (31%). Overall, perennial monocropping and cereal + legume cropping systems performed well in terms of carbon and energy efficiency. However, in green biomass production and carbon and energy efficiency, Bajra–Napier hybrid + legume (lucerne and cowpea) cropping systems were identified as the best systems for climate-smart livestock feed production.

1. Introduction

Agricultural productivity and profitability assessment in terms of carbon footprint and energy budgeting is essential for efficient utilization and conserving available natural resources [1,2]. Reducing carbon footprint and efficient energy use in agricultural systems are important for sustainability [3]. Carbon equivalent greenhouse gas (GHG) emissive inputs and energy consumption are consistently increasing in agricultural systems to meet the increasing food and fodder needs of human and livestock populations. These include excessive use of various inputs such as fertilizers, chemicals, fossil fuel-driven farm machinery, electricity and more [4,5,6]. According to the Intergovernmental Panel on Climate Change (IPCC), agriculture, forestry and other land use activities accounted for approximately 23% of total anthropogenic GHG emissions during 2007–2016, i.e., 12.0 ± 2.9 Gt CO2 equivalent per year [7,8].
Being an agricultural-based economy, India’s food grain production has increased significantly from 522 kg ha−1 in the 1950 s to 2233 kg ha−1 in 2018–2019 [9]. Similarly, food grain production has increased from 52 million tons in 1951–1952 to 284.95 million tons in 2018–2019 [10]. Many studies have reported that fertilizer application is a vital component in achieving higher food grain production in India [11,12]. The average fertilizer consumption in India was 28 kg ha−1 during 1977–78, and it increased to 133.1 kg ha−1 during 2018–2019 ([13], Agricultural Statistics at a Glance, Ministry of Agriculture and Farmers Welfare, Government of India, 2020). This scenario of fertilizer consumption is almost similar to that of the world’s fertilizer consumption patterns, i.e., 71 kg ha−1 of arable land in 1976 to 136.8 kg ha−1 in 2018 (Food and Agriculture Organization, 2020). On the other hand, farm mechanization is gaining importance in Indian agriculture due to shrinking agricultural labor and the availability of draught animals. In India, the contribution of animal power to agriculture has decreased from 93% (1960–1961) to 12.6% (2010–11), while contributions from mechanical and electrical sources have increased from 7 to 87.4% and will continue to increase in the future as animal power declines to 4.1% by 2032–2033 [14]. GHG emissions from the agriculture sector increased by 25% during 1990–2014, mainly due to emissions from synthetic fertilizers (47%) and enteric fermentation from livestock (30%) [15]. In this context, it is necessary to comprehensively analyze the nexus of agricultural production systems with different cultivation processes and their carbon emissions and energy use.
Energy forms an integral part of successful crop production in agriculture. Since the green revolution, commercial energy sources (e.g., fossil fuels), insecticides and machinery have played a significant role in achieving higher agricultural production besides posing a threat to the environment [16,17,18]. Agricultural farms use energy from various sources, including direct, indirect (chemicals, irrigation and machinery), renewable and non-renewable sources [19]. As a result, identifying energy-efficient inputs and production systems will aid in reducing environmental risks and, as a consequence, promote sustainable agriculture through natural resource conservation [18,20]. However, several studies have reported higher crop yields with increasing energy input consumption while reducing energy use efficiency and energy profitability [21,22]. In this context, the energy budgeting of different crop cultivation processes helps to identify inefficient farm practices and inputs, further providing an opportunity for farm planners and policymakers to devise strategies to improve efficiency. Many researchers have already determined the carbon indices viz., carbon sustainability index and carbon efficiency ratio, and energy indices viz., energy use efficiency, energy productivity, energy profitability, nutrient energy ratio and human energy profitability in many field crops such as paddy, wheat, maize, eggplant, apple, sugar beet, rice-wheat cropping systems, crop–livestock–poultry integrated farming systems, etc., for identifying the best cultivation practices and production systems in terms of carbon and energy utilization, but these are rarely documented regarding fodder crop cultivation throughout the world [1,2,3,4,5,6].
In India, livestock forms the backbone of the agriculture sector, contributing 24.7% to the total agricultural gross domestic product annually [23]. The consistent increase in the livestock population is creating higher demand for fodder biomass as fodder cultivation is limited to 4% of the cropped area in India [24]. Further increasing the human population results in the expansion of area under commercial food crops to meet their food and nutritional requirements. As of 2019 in India, there is a shortage of 11.2% green fodder, 23.4% dry fodder and 28.9% concentrate feeds [25]. Thus, there is a need to achieve higher fodder production through increasing productivity within the available area for fodder cultivation. Adoption of cropping systems, particularly cereal + legume cropping systems, will help to achieve higher productivity per unit area and time by complementary nature of the component crops [23,24]. Generally, cereal fodder crops are rich in carbohydrates, and legume crops are a good source of protein; hence, a mixture of these fodder will further help to achieve nutritional rich fodder for livestock in the place of costly concentrate feeds [26]. Many studies have reported good quality of fodder with higher productivity under cereal–legume intercropping systems across India [27,28] and abroad [29,30,31]. However, in most studies, they documented their performance only in terms of productivity and fodder quality. In the present scenario, the selection of cropping systems should not be limited to their productivity or economic profitability, but they should also be assessed in terms of carbon footprint and energy consumption patterns to achieve long-term sustainability [32]. Input–output analysis of carbon and energy has been rarely evaluated and documented in fodder cropping systems. Thus, the main objective of this research was to estimate carbon footprint and energy budgeting analysis under different annual and perennial fodder cropping systems to identify the most efficient and productive system.

2. Materials and Methods

2.1. Experimental Site

This research was conducted throughout 2018–19 and 2019–20 (June–May) at the Zonal Agricultural Research Station, Vishweshwaraiah Canal Farm, Mandya, Karnataka, India (12°45′ to 13°57′ North latitude and 76°45′ to 78°24′ East longitude and an altitude of 695 m above mean sea level). Prevailed weather conditions and chemical properties of the study site are presented in Table 1.

2.2. Fodder Cropping System

In our study, we investigated 15 different fodder cropping systems, comprising 5 annual monocropping, 4 perennial monocropping, 2 annual cereals + legume intercropping and 4 perennial cereals + legume intercropping systems. The statistical design used was Randomized Complete Block Design (RCBD) with three replications. Details of the different systems, varieties and spacing adopted in the experiment are presented in Table 2. Annual cropping systems were sown during each season, while perennial systems were sown only once at the initial establishment of the systems. All management practices were followed as per the package of practices developed by the University of Agricultural Sciences, Bangalore, Karnataka. As per the recommendation, farmyard manure (FYM) was applied three weeks before sowing (Supplementary Table S1). Chemical fertilizers were applied at the sowing time with a full dose of phosphorus (P) and potassium (K) (Supplementary Table S1). In annual monocropping and intercropping systems, 50% nitrogen (N) was supplied as a basal dose, with the remainder applied 30 days after sowing (DAS) as a top dress. In perennial monocropping and intercropping systems, 10% N was supplied as a basal dose at the time of sowing, with the remainder applied in equal splits after each harvest.

2.3. Fodder Yield Measurement

All crops were manually harvested individually with a sickle based on the growth and development stage in each treatment. Annual crops such as maize (Zea mays L.) and sorghum [Sorghum bicolor (L.) Moench.] were harvested at the milking and full blooming stages, respectively, while oats (Avena sativa L.), pearl millet (Pennisetum glaucum L.) and cowpea were harvested at 50% flowering. Regarding perennials viz., lucerne, desmanthus [Desmanthus virgatus (L.) Willd.], sesbania and the Bajra–Napier hybrid, an initial cut was taken at 60, 90, 180 and 70 DAS, respectively, at a 15–20 cm height from the ground level and succeeding cuts were made at 25–30, 45–50, 45–50 and 35–45 days, based on their growth. The green fodder yield was weighed according to the treatment and expressed in kilograms per hectare (kg ha−1) at each harvest. The total pooled yield of the cropping systems was presented, and the same was used to estimate different carbon and energy indices.

2.4. Carbon Analysis

Total GHG emission from the various input components was determined by multiplying their specific carbon coefficients (Table 3) and expressed in terms of carbon equivalent (CE) per unit area and time (CE ha−1 year−1) [33,34]. Total carbon output was derived by adding both above-ground (green fodder) and below-ground (root) biomass of the fodder crops [35]. The root biomass was calculated from the shoot to root ratio of respective fodder crops. The total carbon present in the biomass was determined by multiplying the biomass by 40%, as it was assumed that biomass contains 40% carbon [36]. The different carbon indices were estimated for all the cropping systems using the following equations [36,37,38].
  C a r b o n   i n p u t   ( K g C E / h a / y e a r ) = ( S u m   o f   t o t a l   G H G   e m i s s i o n s   i n   C O 2   e q u i v a l e n t s ) × 12 44
C a r b o n   o u t p u t   ( k g C E / h a / y e a r ) = T o t a l   b i o m a s s × 0.4 .
C a r b o n   s u s t a i n a b i l i t y   i n d e x = ( C a r b o n   o u t p u t C a r b o n   i n p u t ) C a r b o n   i n p u t   .
C a r b o n   e f f i c i e n c y   r a t i o = C a r b o n   o u t p u t   C a r b o n   i n p u t .
C a r b o n   e f f i c i e n c y   ( k g / k g C E ) = F o d d e r   y i e l d   ( k g / h a / y e a r ) C a r b o n   o u t p u t   ( k g C E / h a / y e a r ) .

2.5. Energy Analysis

Energy requirement for the cultivation of different fodder cropping systems was quantified using various input components consumed and energy outputs produced from each cropping system. All the physical input and output components were converted into their respective energy equivalents by multiplying them by their corresponding energy co-efficient (Table 4). Further, the following energy indices were estimated for identifying energy-efficient fodder cropping systems [37,42,43,44].
E n e r g y   u s e   e f f i c i e n c y = T o t a l   e n e r g y   o u p u t   ( M J / h a / y e a r ) T o t a l   e n e r g y   i n p u t   ( M J / h a / y e a r ) .
E n e r g y   p r o d u c t i v i t y   ( k g / M J ) = F o d d e r   y i e l d   ( k g / h a / y e a r ) T o t a l   e n e r g y   i n p u t   ( M J / h a / y e a r ) .
S p e c i f i c   p r o d u c t i v i t y   ( M J / k g ) = T o t a l   e n e r g y   i n p u t   ( M J / h a / y e a r ) F o d d e r   y i e l d   ( k g / h a / y e a r ) .
N e t   e n e r g y   ( M J / h a / y e a r ) = T o t a l   e n e r g y   o u p u t   ( M J / h a / y e a r ) T o t a l   e n e r g y   i n p u t   ( M J / h a / y e a r ) .
E n e r g y   p r o f i t a b i l i t y = N e t   e n e r g y   ( M J / h a / y e a r ) T o t a l   e n e r g y   i n p u t   ( M J / h a / y e a r ) .
N u t r i e n t   e n e r g y   r a t i o = T o t a l   e n e r g y   o u p u t   ( M J / h a / y e a r ) N u t r i e n t   e n e r g y   i n p u t   ( M J / h a / y e a r ) .
H u m a n   e n e r g y   p r o f i t a b i l i t y = T o t a l   e n e r g y   o u p u t   ( M J / h a / y e a r ) H u m a n   e n e r g y   i n p u t   ( M J / h a / y e a r ) .
D i r e c t   e n e r g y   ( M J / h a / y e a r ) = L a b o u r + F u e l + E l e c t r i c i t y .
I n d i r e c t   e n e r g y   ( M J / h a / y e a r ) = F e r t i l i z e r s + M a c h i n e r y + C h e m i c a l s + I r r i g a t i o n + S e e d .
R e n e w a b l e   e n e r g y   ( M J / h a / y e a r ) = L a b o u r + F Y M + I r r i g a t i o n   w a t e r .
N o n r e n e w a b l e   e n e r g y   ( M J / h a / y e a r ) = F e r t i l i z e r s + M a c h i n e r y + F u e l + C h e m i c a l s + E l e c t r i c i t y + S e e d .

2.6. Statistical Analysis

The pooled data were subjected to Duncan’s Multiple Range Test (DMRT) to determine the significant difference (p < 0.05) between the cropping systems using OPSTAT, a statistical software package developed by Chaudhary Charan Singh Haryana Agricultural University, Hisar, Haryana, India [53].

3. Results

3.1. Total Carbon Input and Share of Different Inputs

In general, perennial fodder cropping systems consumed less agricultural inputs and resulted in lower carbon input. They also showed higher carbon output due to large green fodder biomass production compared to other cropping systems involving annual crops. The monocropped lucerne perennial cropping system showed considerably lower carbon input, followed by sesbania and desmanthus perennial systems. However, monocropped maize recorded numerically higher carbon input throughout the year followed by annual cereal–legume intercropping systems viz., fodder maize + cowpea–fodder oat + cowpea–pearl millet + cowpea and fodder sorghum + cowpea–fodder maize + cowpea–pearl millet + cowpea (Table 5).
The contribution from various inputs used to cultivate different fodder crops will vary according to their carbon emission potential. In this study, the important inputs considered were fertilizers, FYM, pesticides, fuel and irrigation water. Among these inputs, fertilizers accounted for a major share (73%), followed by FYM (20%), diesel (6%) and irrigation (1%). However, due to the very low amount of pesticide usage, it showed extremely low values (almost zero) contribution to the carbon input in our study (Figure 1)

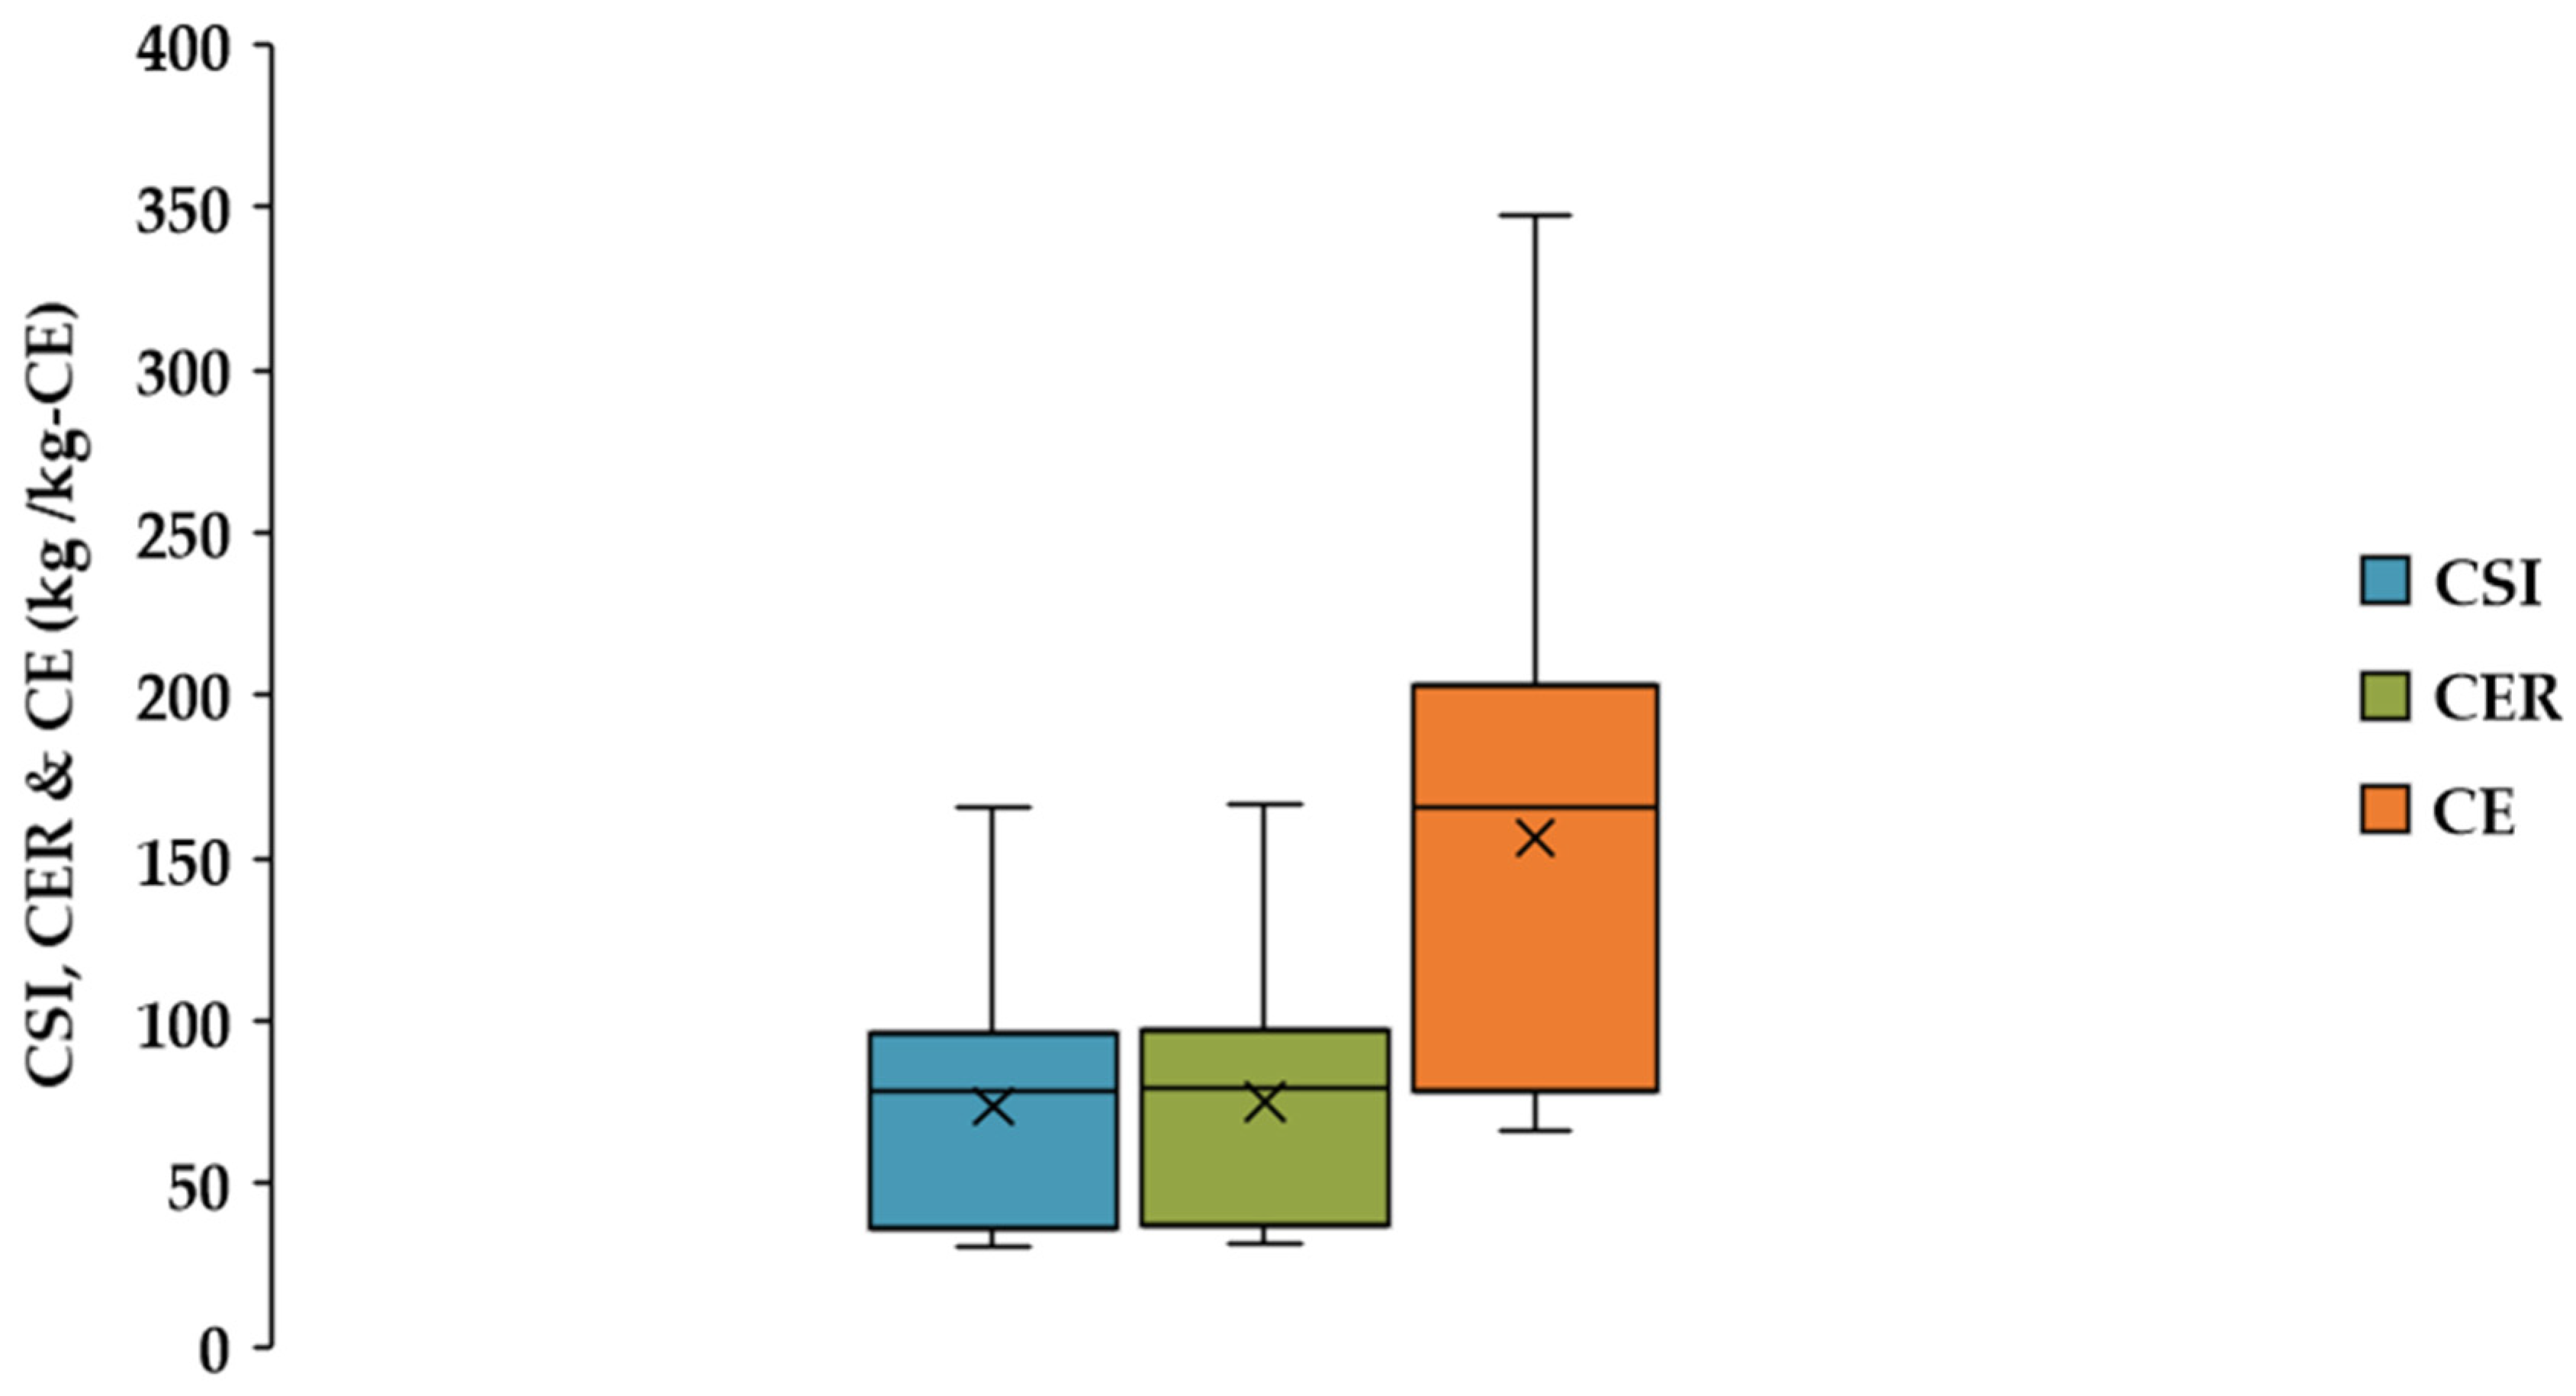
3.2. Total Carbon Output and Carbon Indices

With respect to carbon output, significantly higher green fodder biomass with Bajra–Napier hybrid + lucerne and Bajra–Napier hybrid + cowpea systems resulted in statistically higher carbon output over other cropping systems. Further, Bajra–Napier hybrid + sesbania and Bajra–Napier hybrid + desmanthus systems closely followed the above-mentioned cropping systems. In this study, reduced carbon output with both annual (maize, sorghum, pearl millet, oats and cowpea) and perennial (Bajra–Napier hybrid, lucerne, desmanthus and sesbania) monocropping systems by 36, 45, 48, 50, 52, 23, 42, 51, 41%, respectively, were noticed over the superior Bajra–Napier hybrid + lucerne system (Table 5).
To identify carbon-efficient fodder cropping systems, different carbon indices, viz., carbon sustainability index (CSI), carbon efficiency ratio (CER) and carbon efficiency (CE), were estimated and presented in Table 5. Among the systems, the perennial lucerne cropping system was identified as the best carbon-efficient system with higher CSI, CER and carbon efficiency, which was closely followed by the sesbania monocropping, Bajra–Napier hybrid + lucerne and Bajra–Napier hybrid + cowpea perennial cropping systems. The above statement indicates the efficient utilization of different carbon emitting inputs in biomass production in those cropping systems. However, inefficient input utilization and higher carbon-emitting inputs consumption lead to lower CSI, CER and carbon efficiency in seasonal cereal–legume intercropping systems (fodder maize + cowpea–fodder oat + cowpea–pearl millet + cowpea and fodder sorghum + cowpea-fodder maize + cowpea–pearl millet + cowpea) as well as annual cereal (maize, sorghum, oats and pearl millet) monocropping systems. Overall, the carbon indices ranged from 30.8–165.8 (CSI), 31.8–166.8 (CER) and 66.3–347.5 kg kg−1-CE−1 (carbon efficiency), with the highest in the Bajra–Napier hybrid + lucerne perennial system and the lowest in the oats monocropping system (Figure 2).

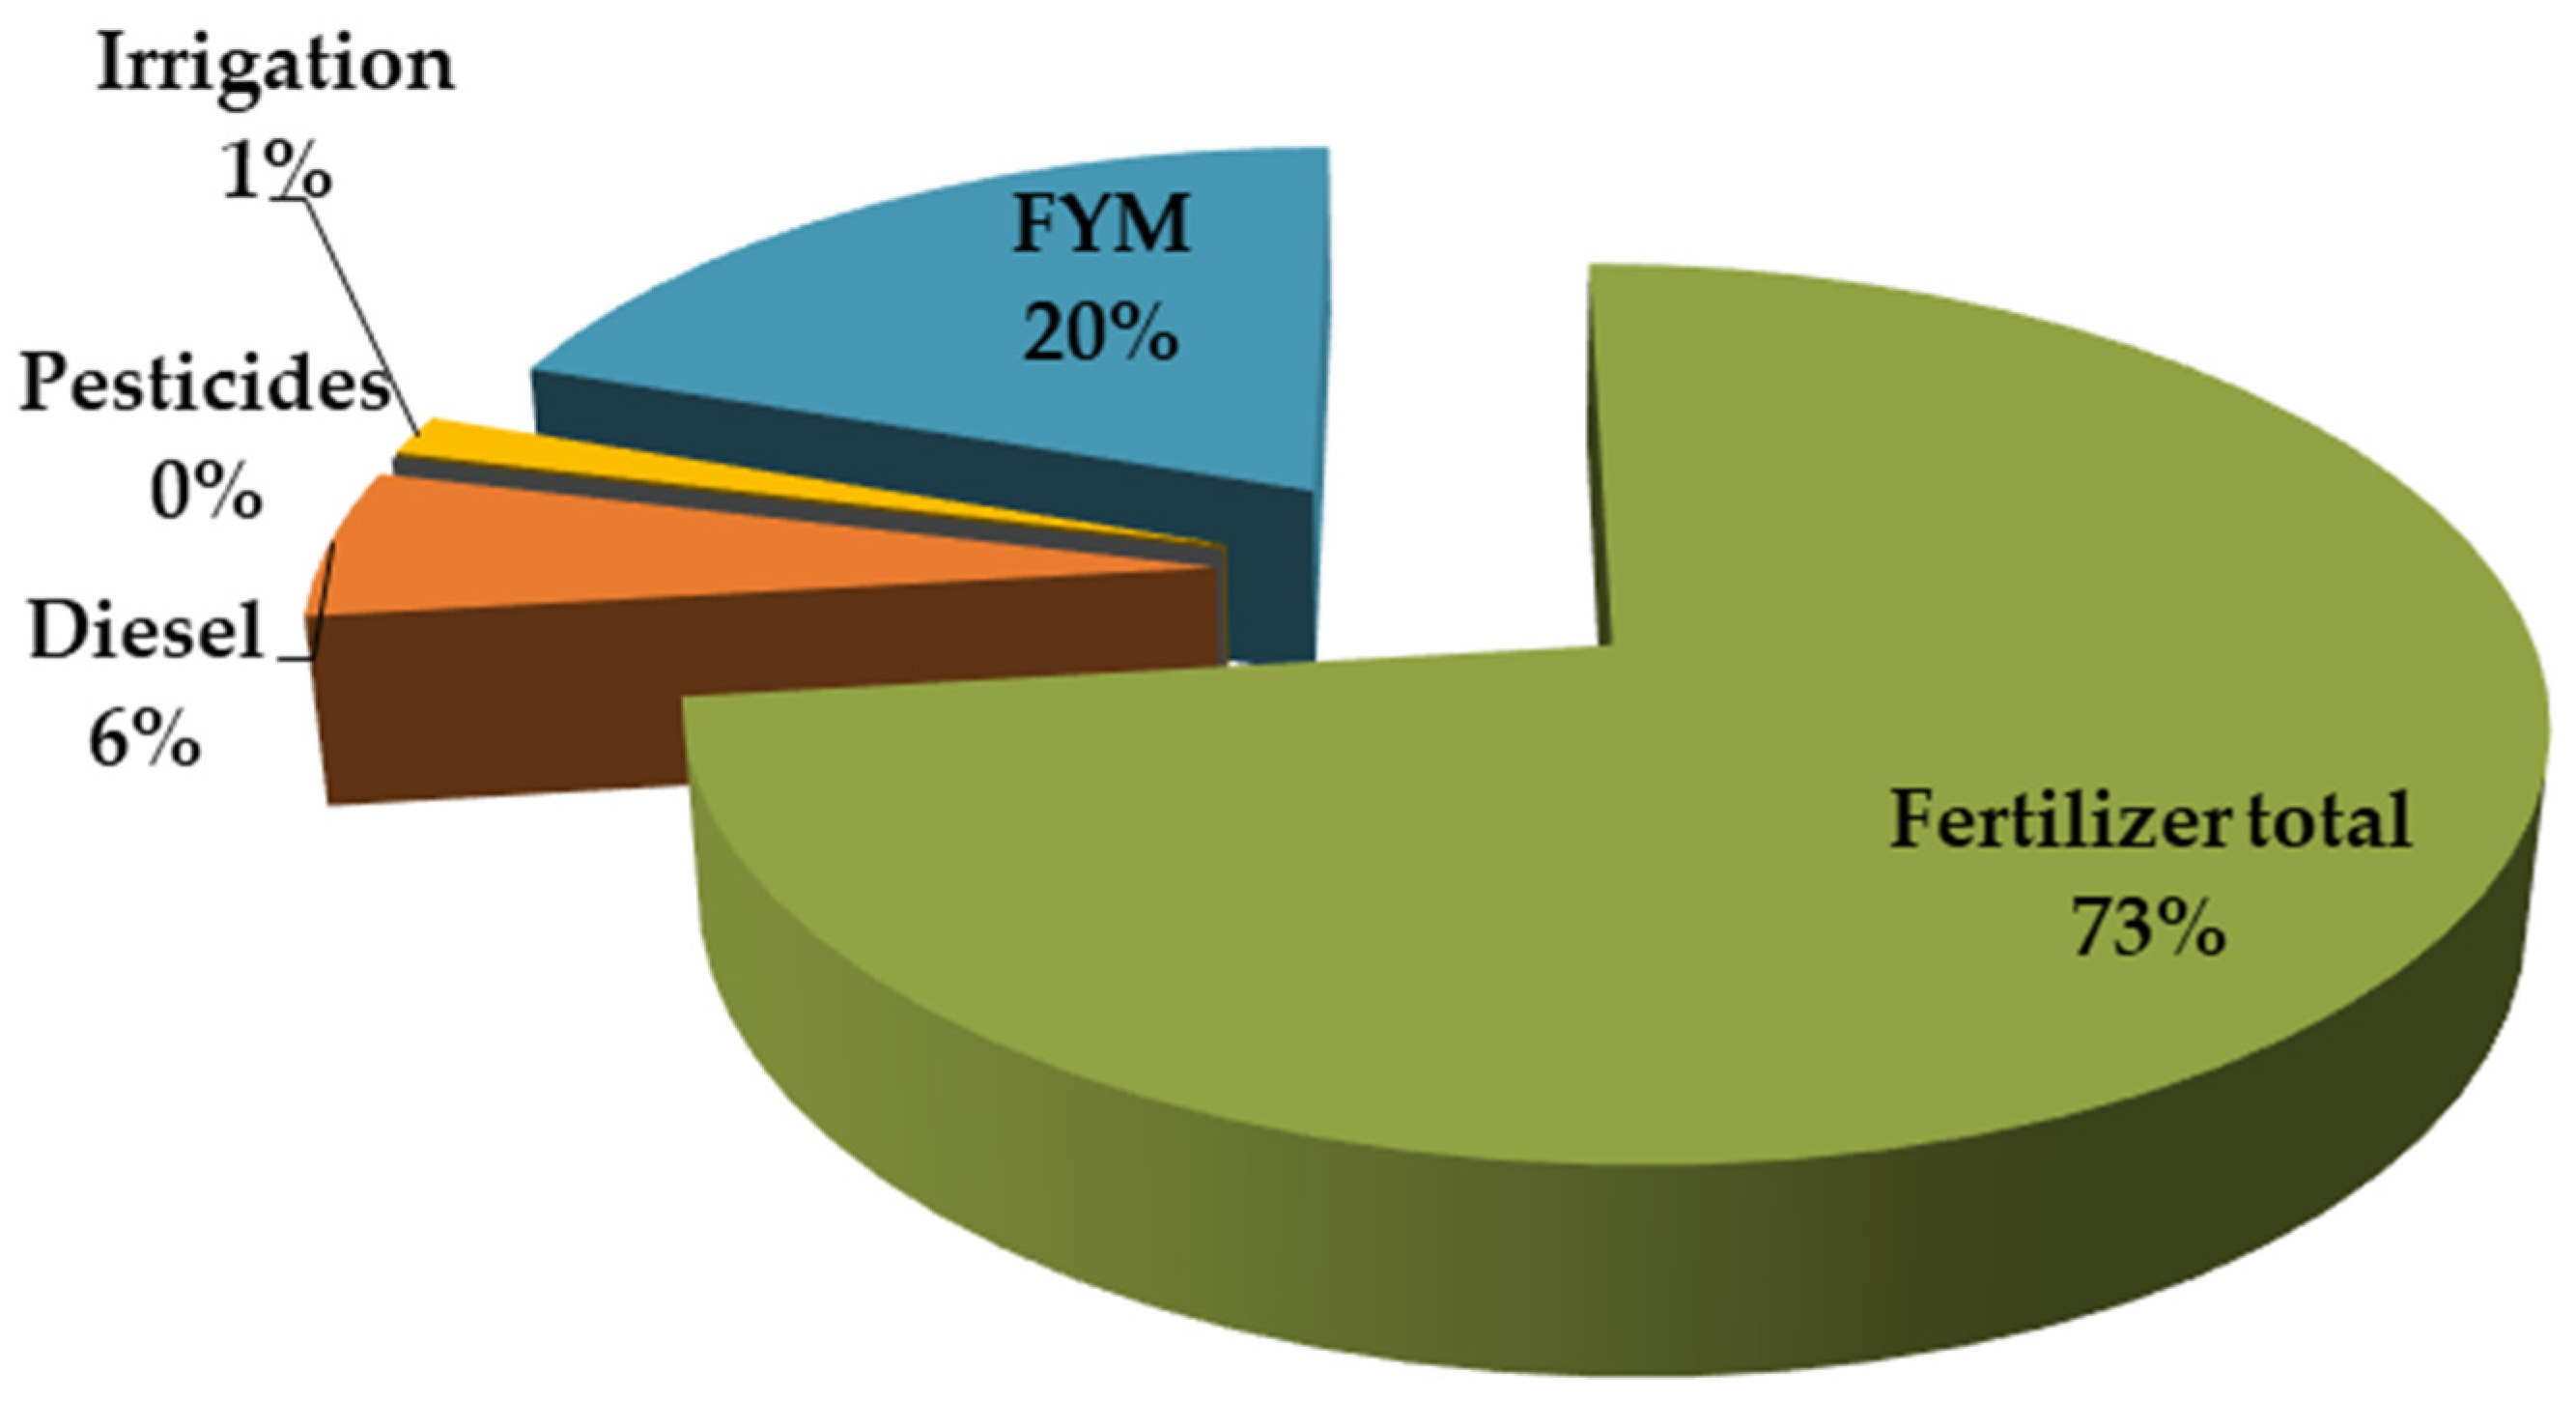
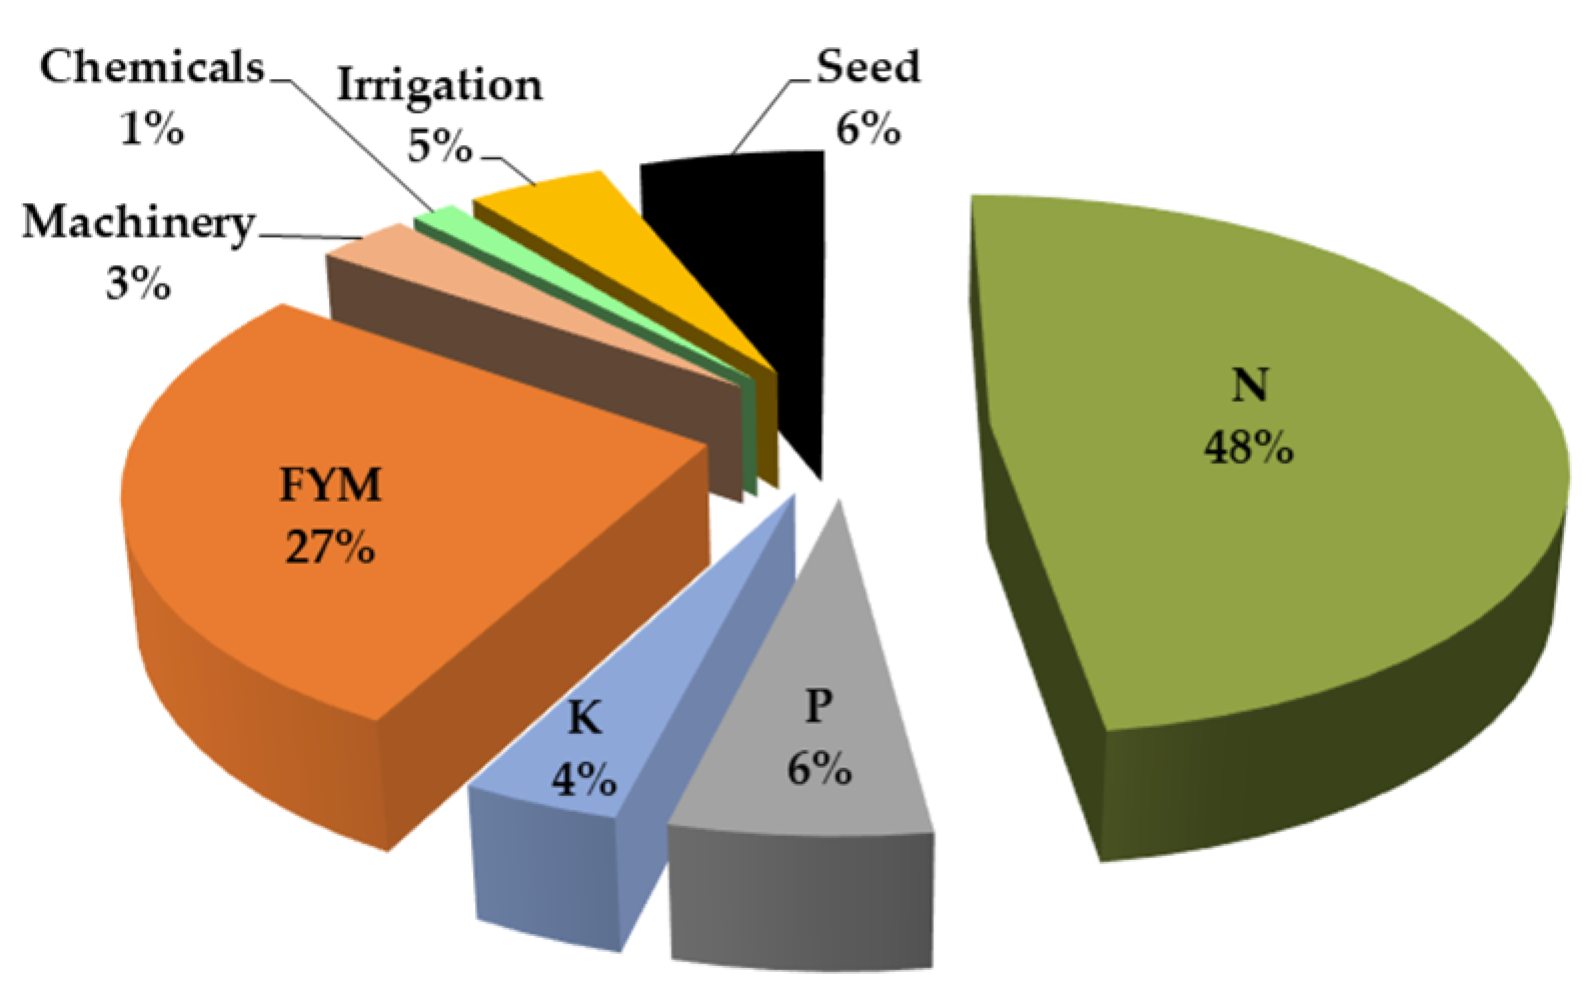
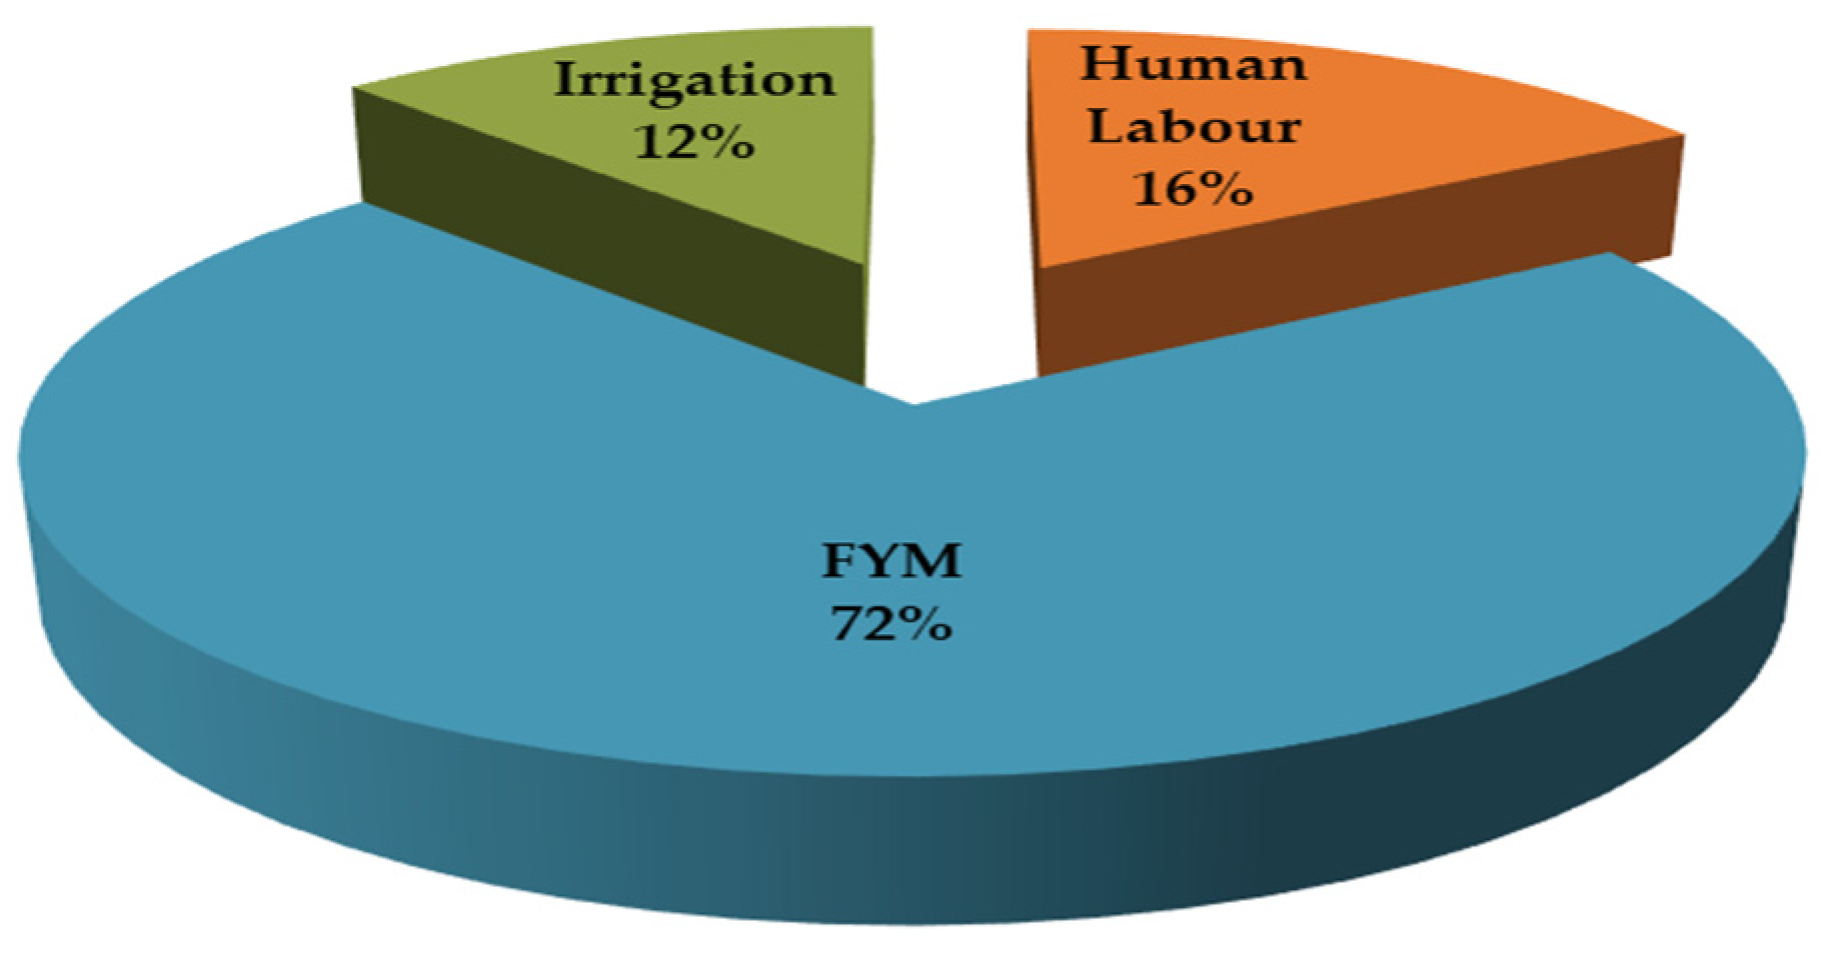
3.3. Total Energy Input and Share of Different Inputs

Similar to the carbon input consumption pattern, lower total energy input utilization was observed in perennial fodder cropping systems than in annual systems. Among the systems, numerically, the lowest energy consumption was noticed with lucerne, followed by desmanthus and sesbania perennial systems. Among the annual systems, the cropping system involving cowpea recorded lower input energy consumption than other annual systems in the study. There was a 76, 47, 47 and 11% increase in the total energy input of the systems when lucerne, desmanthus, sesbania and cowpea were intercropped with the Bajra–Napier hybrid compared to monocropping. However, the highest energy consumption was noticed with the maize monocropping system, and the tune of increase was 226% over the lowest consumed lucerne system (Table 6).
The different inputs viz., fertilizers, FYM, human labor, machinery, diesel, chemicals, irrigation, electricity and seeds were computed for energy input calculations in different cropping systems. Among the various inputs, fertilizers accounted for the major share of 67%, which was followed by Diesel (17%). However, the contribution of human labor, machinery, chemicals, irrigation, electricity and seeds was ≤ 5% in the current study (Figure 3).

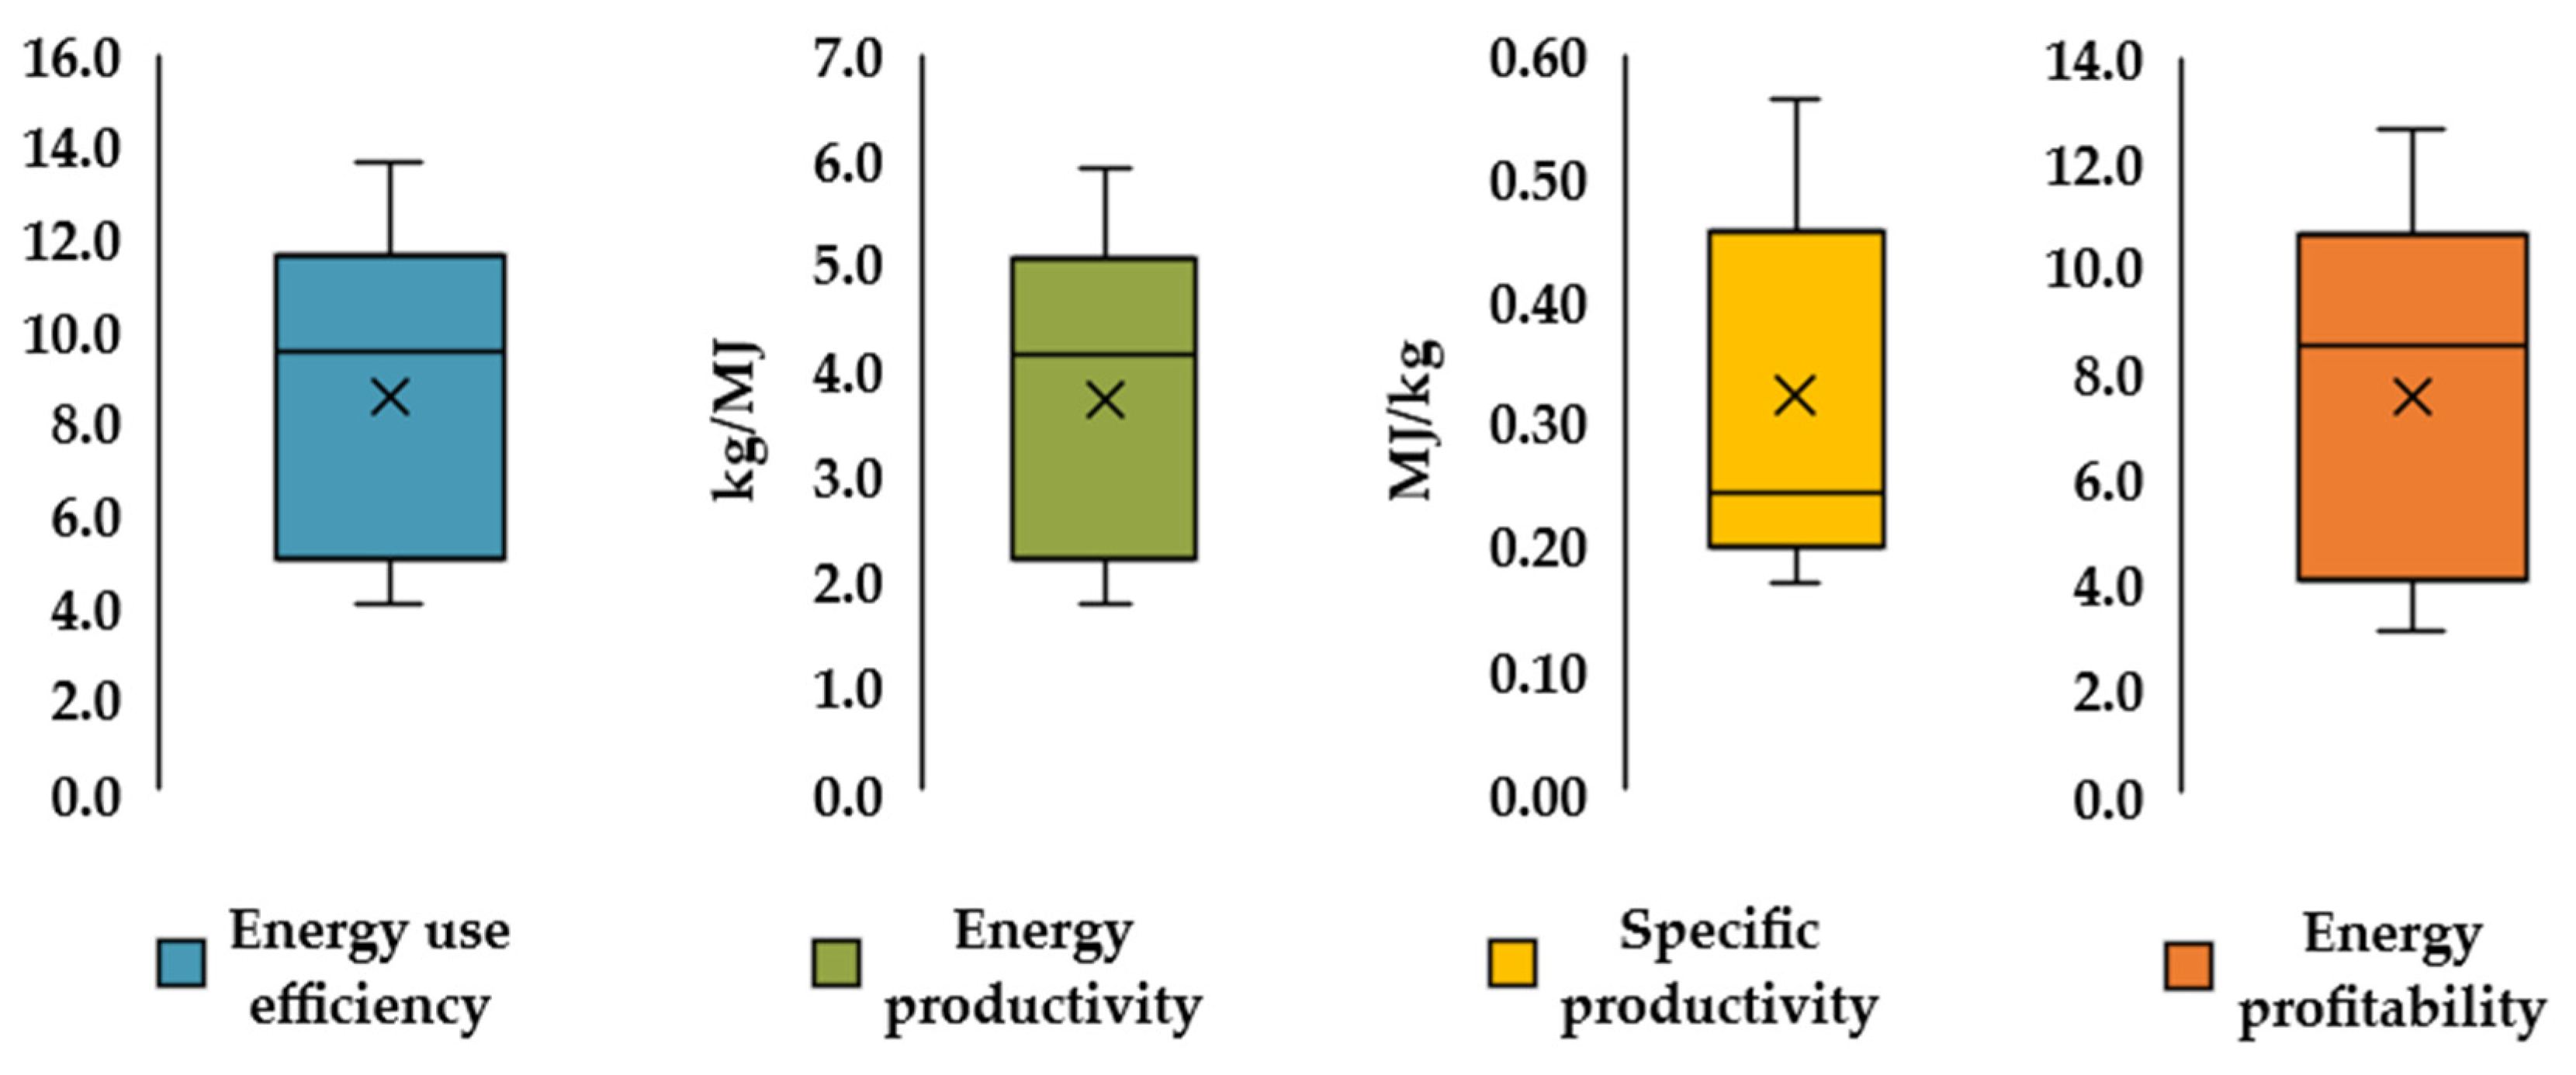
3.4. Total Energy Output and Energy Indices

Using the green biomass of different cropping systems, the total energy output and different energy indices were determined and presented in Table 6. A significantly higher energy output was recorded with the Bajra–Napier hybrid + lucerne and the Bajra–Napier hybrid + cowpea perennial cropping systems, and it was 110 and 100% higher than the lowest energy output recorded by the cowpea monocropping system. In the case of cropping systems involving monocropping of both cereal and legume fodder crops, the reduction in the energy output up to the magnitude of 23, 36, 45, 48, 49, 41, 42, 51 and 52% was noticed with the Bajra–Napier hybrid, maize, sorghum, pearl millet, oats, sesbania, lucerne, desmanthus and cowpea systems, respectively.
With respect to energy indices, the values ranged around 4.1–13.6 (energy use efficiency), 1.8–5.9 kg MJ−1 (energy productivity), 0.56–0.17 MJ kg−1 (specific productivity) and 3.1–12.6 (energy profitability) in the oats to lucerne monocropping systems (Figure 4). However, lucerne monocropping and the Bajra–Napier hybrid + legume (lucerne and cowpea) cropping systems were identified as the best energy-efficient systems as they showed significantly higher values of energy indices viz., energy use efficiency, energy productivity and energy profitability, respectively, over other systems in the study. Despite this, higher net energy was noticed with the Bajra–Napier hybrid + legume (lucerne and cowpea) cropping systems. On the other hand, the monocropping systems, mainly cereal (oats, pearl millet, maize, sorghum) fodder cropping systems, were noted as the most energy-inefficient systems in the current study because of their significantly lower energy indices values. With respect to specific products, all the perennial fodder cropping systems showed lower values ranging from 0.17 MJ kg−1 in the Bajra–Napier hybrid + lucerne system to 0.24 MJ kg−1 in the desmanthus system, which indicates that a lower amount of energy was consumed per unit quantity of fodder production in those cropping systems. On the other hand, significantly higher energy consumption per unit quantity of fodder production was recorded in oats, maize and pearl millet cereal monocropping systems.

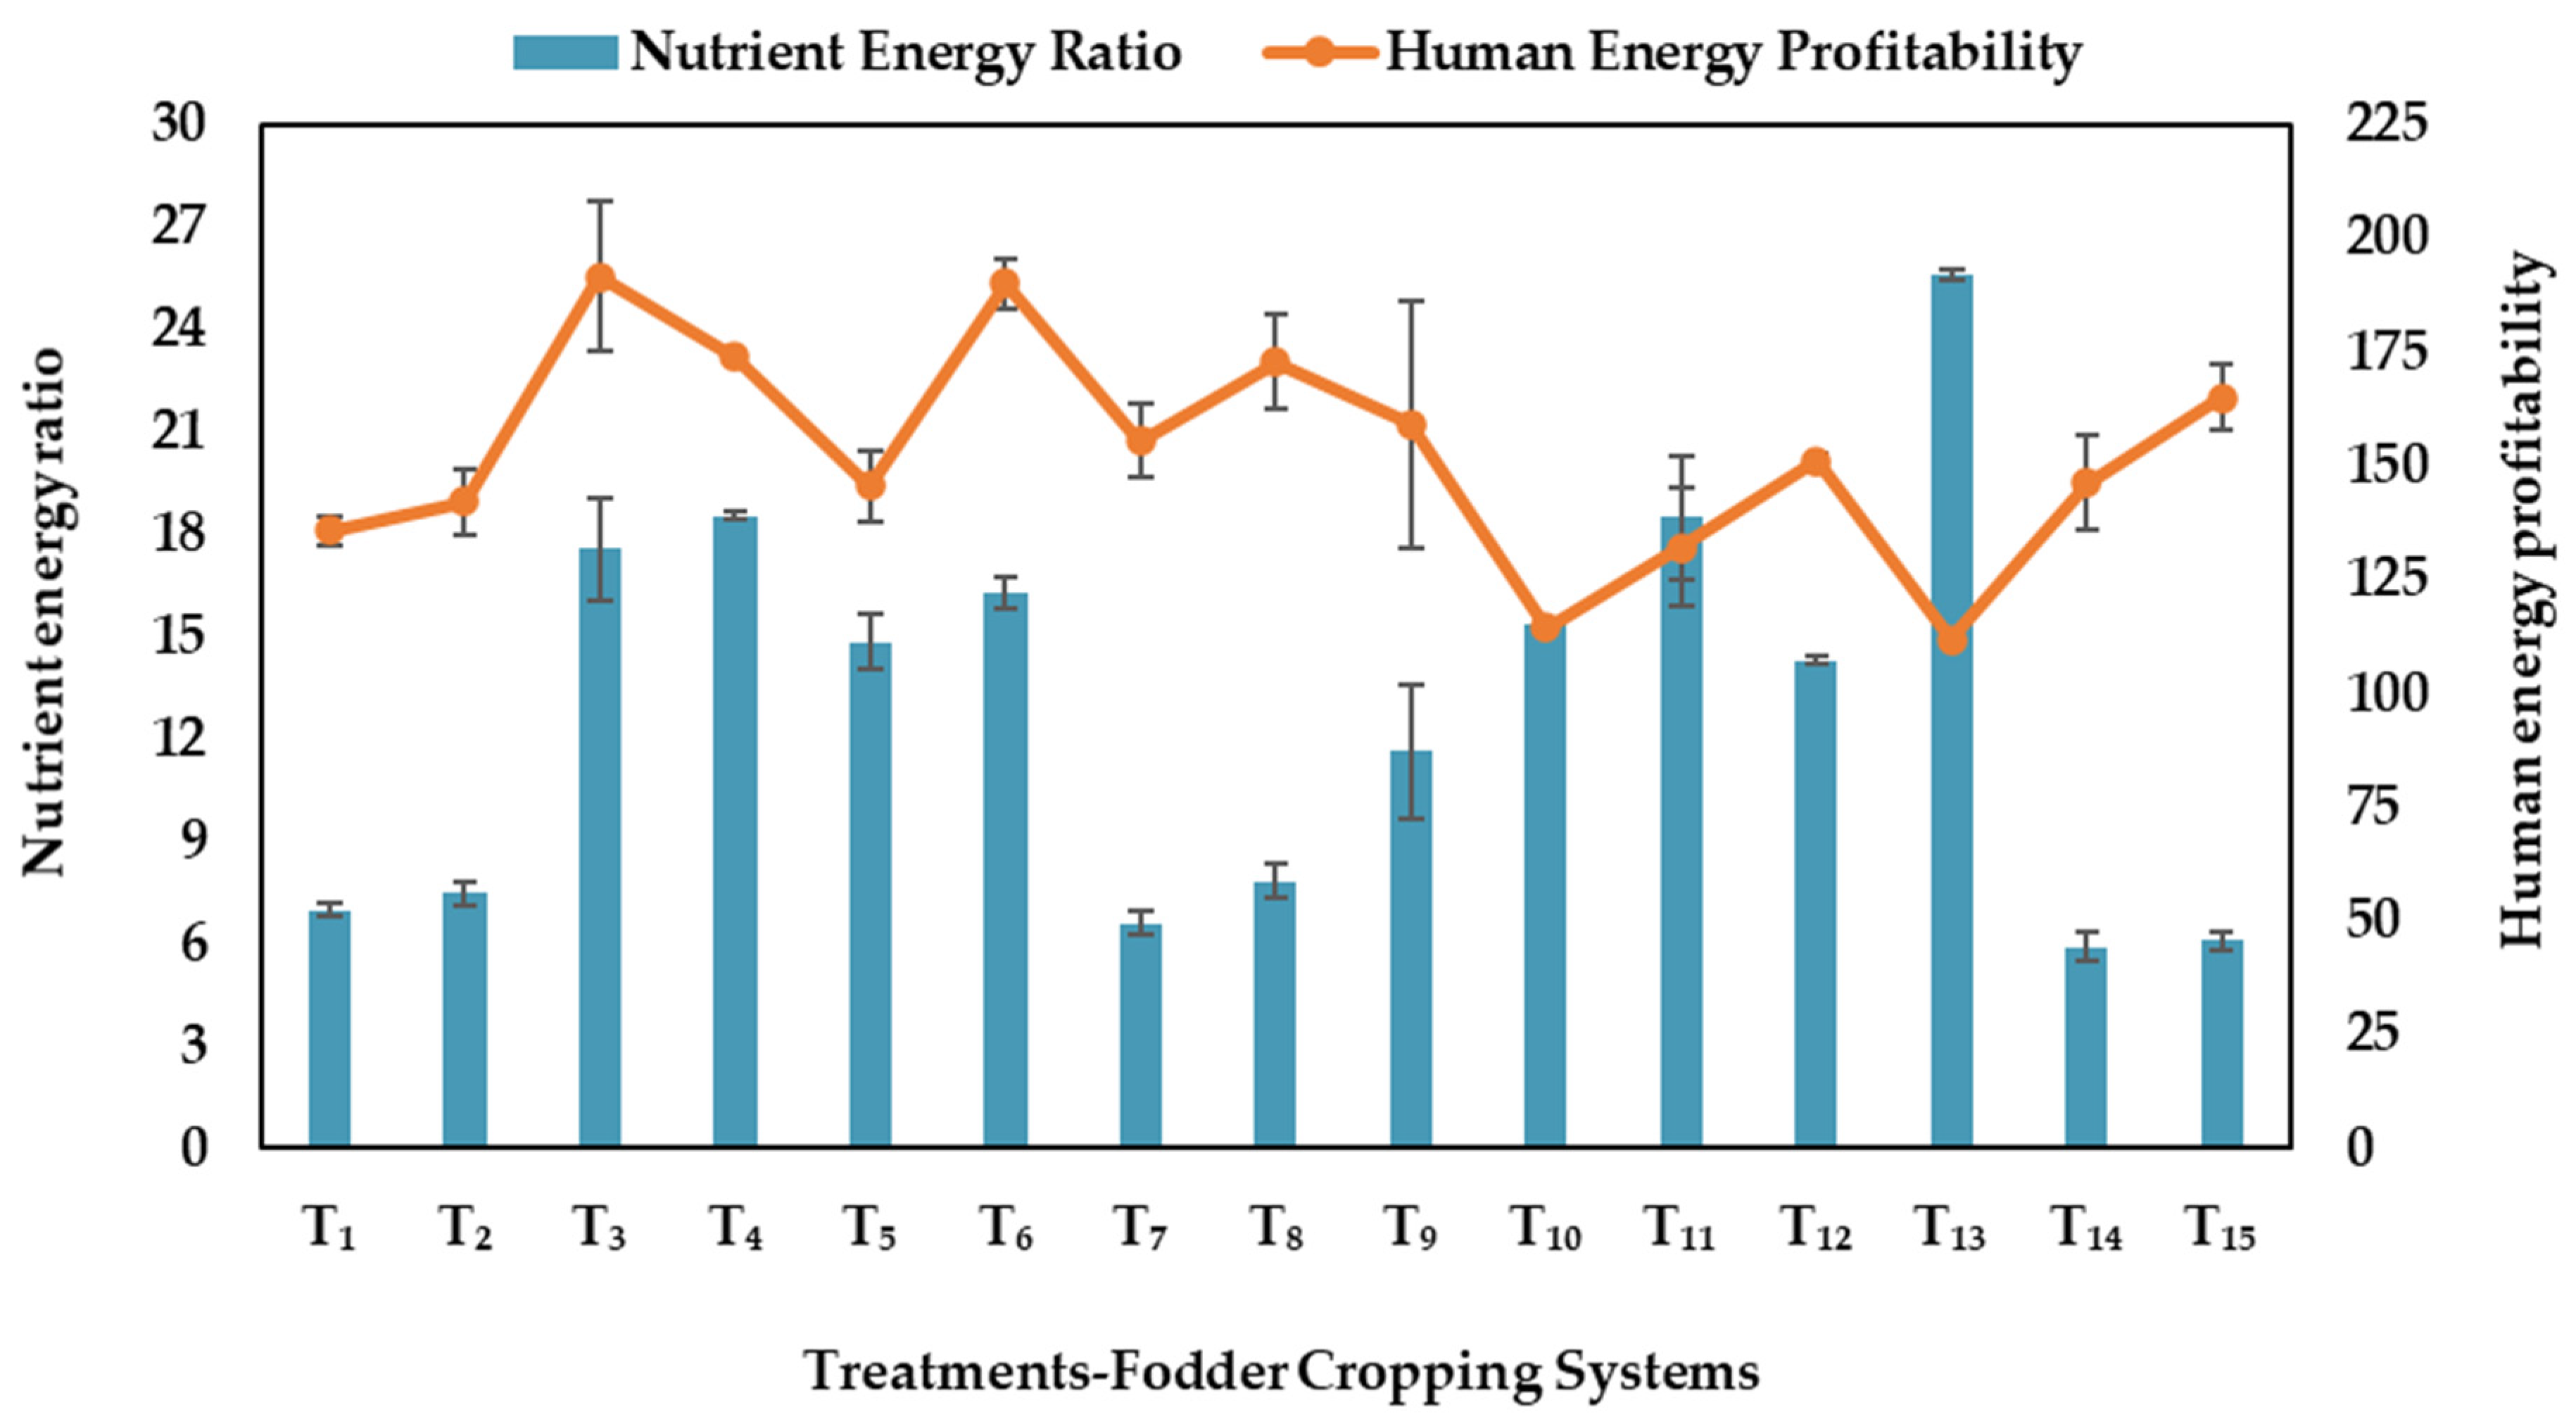
3.5. Nutrient Energy Ratio and Human Energy Profitability
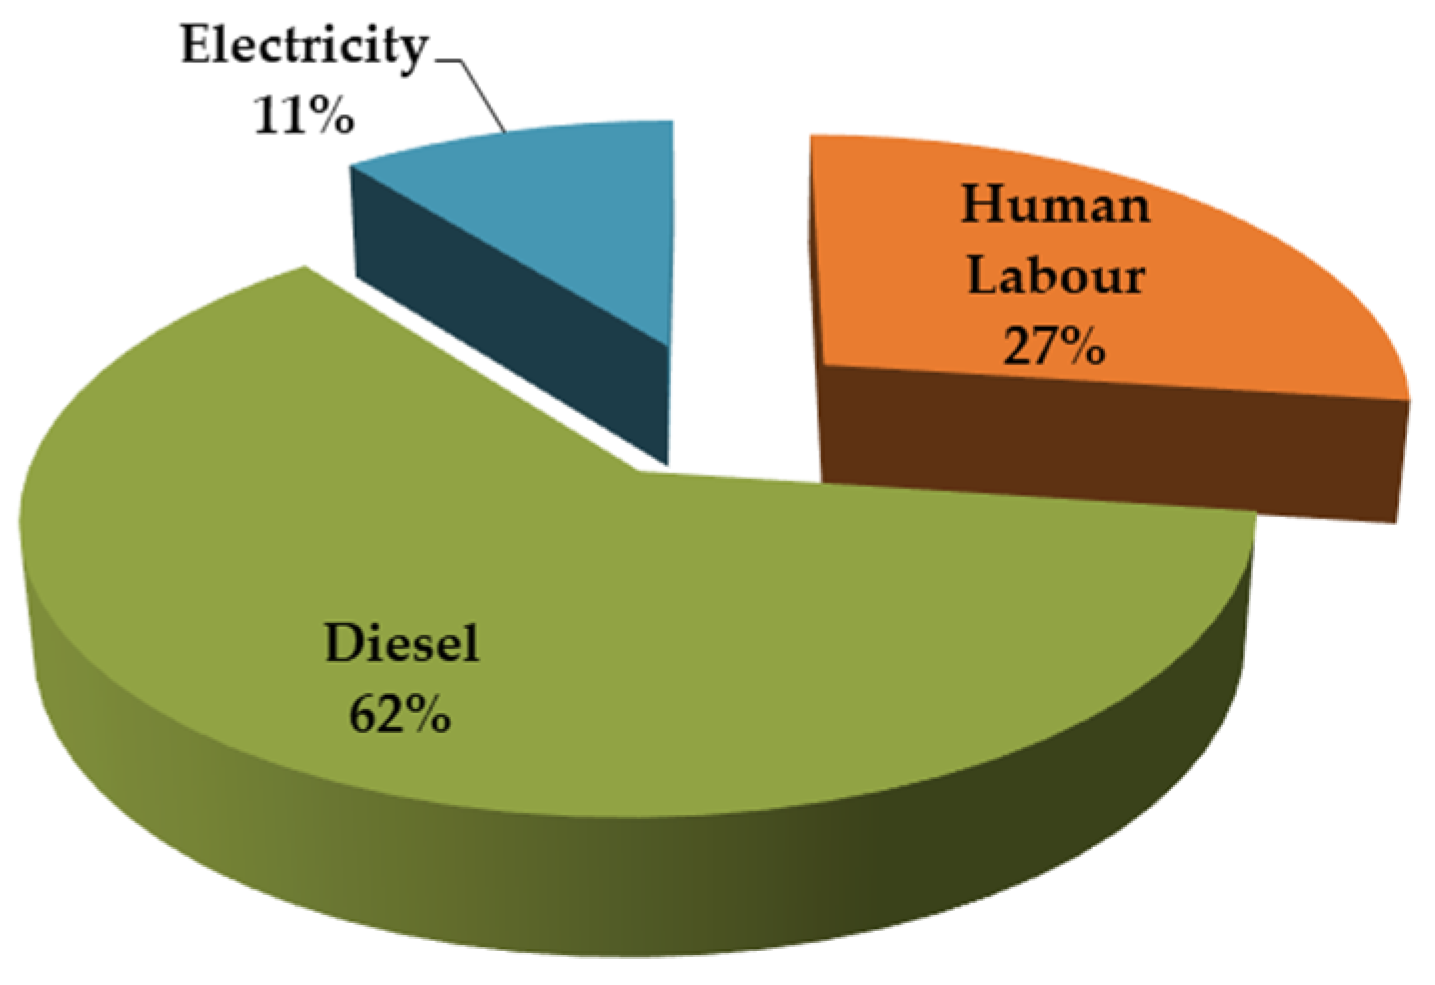
In addition to carbon and energy indices, we also computed the nutrient energy ratio and human energy profitability for different systems, as illustrated in Figure 5. A statistically higher nutrient energy ratio of 25.6 was witnessed with lucerne perennial fodder cropping systems. Further, it was closely followed by the sesbania monocropping and Bajra–Napier hybrid + legume (lucerne, cowpea and sesbania) cropping systems. However, due to higher fertilizer consumption and lower energy output, a significantly lower nutrient energy ratio was registered in annual cereal monocropping systems (maize, sorghum, oats and pearl millet) and ranged from 5.9 in oats to 7.8 in the sorghum system. With respect to human energy profitability, higher energy output resulted in significantly higher human energy profitability with the Bajra–Napier hybrid + legume (cowpea, sesbania and lucerne) cropping systems. Contrastingly, more human labor requirement for perennial lucerne and desmanthus cultivation led to statistically lower human energy profitability of 111.8 and 114.4, respectively.

3.6. Energy Sources

To identify the potential contributors to the total input energy, various input sources, viz., direct, indirect, renewable, and non-renewable energy, were quantified for the different fodder cropping systems (Figure 6). For the total input energy, direct sources contributed 18%, while indirect energy sources accounted for a major share of 82%. Among direct sources, diesel used as a fuel for agricultural operations was identified as the major contributor, followed by human labor and electricity utilized power for irrigating crops (Figure 7). On the other hand, fertilizers (NPK) alone accounted for 58%, followed by FYM (27%) with respect to indirect energy sources. However, the contribution from seed, irrigation, machinery, and chemicals was very meager, i.e., ≤6% (Figure 8). In the case of renewable and non-renewable energy sources, the former accounted for 31%, while the latter accounted for 69% of the total input energy in the present study. FYM was identified as the major renewable energy contributor, followed by human labor and irrigation components (Figure 9). With respect to non-renewable energy sources, fertilizers (NPK) contributed 67%, followed by 17% with diesel fuel. However, machinery, chemicals, seed, and electricity contributed 4, 2, 7 and 3%, respectively (Figure 10). Among the different treatments, annual intercropping systems viz., fodder maize + cowpea–fodder oat + cowpea-pearl millet + cowpea and fodder sorghum + cowpea–fodder maize + cowpea-pearl millet + cowpea accounted for higher direct and renewable energy consumption while the sesbania perennial system consumed less. Similarly, concerning indirect and non-renewable energy consumption patterns they ranged from 44,486 and 40,389 MJ ha−1 in the monocropped maize system to 11,093 and 6617 MJ ha−1 in the lucerne perennial cropping system, respectively.

4. Discussion

4.1. Carbon Input, Output and Its Indices

With increasing atmospheric carbon dioxide levels, identifying ideal fodder cropping systems with high biomass production and low carbon equivalent input consumption is a challenge for sustainable livestock production. In the present study, among the 15 fodder cropping systems, legume monocropping systems consumed less carbon than cereal monocropping systems (Table 5). This can be attributed to reduced fertilizer application, particularly nitrogenous fertilizers, due to the atmospheric nitrogen fixation capacity of legume crops. The adoption of legume fodder crops improves native soil fertility by enhancing the nutrient and organic carbon levels through nitrogen fixation and the addition of crop residues and thereby reducing the fertilizer requirement for crops [54]. A lower amount of carbon dioxide equivalents per unit amount of forage dry matter production was reported in alfalfa (0.21 kg CO2 kg−1) than in corn and sorghum crops in the governorate of Sousse, Tunisia [55]. Similarly, greenhouse gas emissions per hectare of land use and per ton of product produced were lower in alfalfa and silage maize than in grain maize, wheat, and apple crops in Pingliang and Qingyang, cities of northwest China [56]. Interestingly, approximately 373 kg-CE ha−1 of carbon input reduction was noticed under cereal (Bajra–Napier hybrid) + legume (cowpea, lucerne, desmanthus and sesbania) perennial cropping systems due to lower fertilizer application than monocropped cereal crops.
In the current study, we also identified nutrient sources such as fertilizers and FYM as the significant carbon input contributors among the different inputs computed. Reduced fuel (diesel) consumption was noticed under perennial intercropping systems, as they are sown once a year but not every season, as in the case of annual crops. That, in turn, led to reduced agricultural operations under those systems and thereby lowered carbon input consumption in their cultivation. Gong et al. [57] reported chemical fertilizers as the significant contributors to carbon footprint (27.5–56.7%) in agricultural production systems. Further, they revealed a reduction in total carbon footprint with decreasing fertilizers usage in China. Similarly, Jiang et al. [58] reported a 49.5% contribution from nitrogen fertilizer alone to the total carbon footprint in rice cultivation in China. In addition, they noticed a positive correlation between the nitrogen fertilizer application rate and the total carbon footprint. Similar to our current results, Ma et al. [59] noticed a lower carbon footprint under maize–soybean and maize–forage legume (alfalfa or red clover) biannual rotation supplied with 100 kg N ha−1 by 41 and 46%, respectively, over monoculture maize supplied with 200 kg N ha−1. Further, Liu et al. [60] stated that improving N fertilizer use efficiency can lower the carbon footprints of field crops as N fertilizer contributes 36 to 52% of the total emissions. Even in the USA, the application of both synthetic fertilizers and lime were identified as major contributors to carbon footprint in dairy feeds such as soybeans, alfalfa, corn and others [61]. Thus, GHG emissions can be effectively minimized by optimizing the N application rate, N form and fertilizer application method, and further using biochar, nitrification or urease inhibitors, as well as by adopting measures such as crop mulching, use of organic manures, green manuring crops and irrigation scheduling management [8,62,63]. Further, higher fruit yield, reduced input costs and reduced GHG emissions with higher carbon efficiency were reported in pomelo orchards when chemical fertilizers were combined and applied with organic manure in China [64].
The amount of carbon input consumption and carbon output production are key factors that determine the efficiency of different systems. Lower input consumption and higher output production aid in achieving higher efficiency. Higher total biomass (root + shoot) production resulted in significantly higher carbon output with Bajra–Napier hybrid + legume (cowpea, lucerne) systems. However, significantly higher carbon indices viz., CSI, CER and carbon efficiency, were observed with the lucerne monocropping system because of lower carbon input consumption. Similar to our results, higher carbon output and lower carbon input consumption led to higher carbon efficiency of 5.30, and CSI of 4.30 was previously reported in pigeonpea–wheat cropping systems [65]. On the other hand, Bajra–Napier hybrid + legume (cowpea, lucerne) systems also showed higher carbon indices mainly because of higher carbon output. Thus, these systems were identified as carbon-efficient systems as they consumed less carbon input per unit quantity of carbon output production in the current study.

4.2. Energy Input, Output and Its Indices

Currently, agri-food systems consume 30% of the world’s available energy, with more than 70% occurring beyond the farm gate, and are responsible for nearly 20% of global greenhouse gas emissions [66]. Improvement in energy efficiency is generally considered the best strategy to reduce CO2 emissions and further limit energy dependence in agriculture. In this regard, the identification of energy-efficient inputs and cropping systems is a primary concern in the current scenario of limited natural resource availability in the world. Similar to the carbon input and output, 30% higher energy output was noticed with perennial fodder cropping systems (both monocropping and intercropping) despite 43% lower energy input consumption over annual cropping systems. The above statement clearly indicates that perennial fodder cropping systems produced more output per unit quantity of input used and were identified as energy-efficient systems. Further, these results are evident by the higher energy use efficiency (9.5–13.6), energy productivity (4.1–5.9 kg MJ−1) and energy profitability (8.5–12.6) in perennial fodder cropping systems compared to 4.1–6.8, 1.8–3.1, and 3.1–5.8 kg MJ−1, respectively, in the case of annual fodder cropping systems. Perennial legume fodders have shown higher energy use efficiency and lower energy input requirement because of their lower demand for nitrogen fertilizers, as they meet part of their nitrogen requirement through the atmospheric nitrogen fixation process [67]. Similar to our study, Budzynski et al. [68] also reported energy use efficiency of 11.6 and 9.6 with perennial legume fodders of galega and alfalfa, respectively, at Olsztyn. Among the perennial systems, Bajra–Napier hybrid + legume (lucerne and cowpea) intercropping systems were identified as more energy efficient systems because of their higher net energy production along with higher green fodder production, which is much needed to meet India’s current fodder crisis in order to feed the increasing livestock population. Higher energy output and energy use efficiency was obtained by introducing legume fodder crops as an intercrop with rice in place of the rice monocropping system due to higher grain and fodder yield in Odisha, India [54]. Prajapat et al. [32] also reported higher energy output (370.7 × 10³ MJ ha−1), net energy (331.9 × 10³ MJ ha−1), energy use efficiency (9.56), energy productivity (179.0 g MJ−1) and profitability (8.6) with a soybean–chickpea–fodder sorghum cropping system due to higher biomass production. Even in an integrated farming system, green fodder cultivation (sorghum, cowpea, berseem and oats) showed higher energy use efficiency (7.66) followed by the field crops (5.06) and vegetables (1.51) than other components of the system [18].
External supply of nutrients in the form of fertilizers is a major source of plant nutrition and, to a certain extent, FYM in the present agricultural system. Further, the adoption of agricultural machinery for various tillage and transportation operations is consequently increasing the fuel consumption in agriculture production systems. In our study, we also identified fertilizers followed by FYM and diesel as major energy inputs to the total energy consumption by the cropping systems. Even Patel et al. [22] identified fuel, fertilizers and FYM as major contributors to the total input energy in kharif maize cultivation in the Panchmahal District of Gujarat, India. Mishra et al. [6] also reported fertilizer application as the highest energy consumption input (35.9%) in different fodder crops production in the Allahabad district of Utter Pradesh state. This signifies that by reducing these inputs by increasing their efficiency, we can further reduce the energy input required in any system and thereby achieve higher energy efficiency. The adoption of resource conservation practices, such as the introduction of in situ green manure crops (Sesbania rostrata) as part of integrated nutrient management in rice, have resulted in a decrease in energy input by 21% and, subsequently, an increase in energy productivity and energy use efficiency by 27 and 26%, respectively [69]. In Northwestern Italy, an increase in energy use efficiency by 31.4 and 32.7% was reported in integrated farming systems and low-input farming systems, respectively, compared to conventional farming systems in wheat–maize–soybean–maize rotation [70].

4.3. Nutrient Energy Ratio and Human Energy Profitability

To increase the productivity per unit land area under different cropping systems, it is imperative to supply nutrients externally through fertilizers in an adequate quantity to maintain the soil fertility along with organic sources [12,71]. Further, excess application of fertilizers leads to various adverse effects on the ecosystem besides increasing their contribution to carbon and energy input requirements in the production and thereby reducing the system’s efficiency in terms of carbon, energy, and nutrients. Perennial legume monocropping systems (lucerne, sesbania and desmanthus) and Bajra–Napier hybrid + legume intercropping systems have shown higher nutrient productivity over other systems. Reduced nutrient application, particularly regarding nitrogen due to the atmospheric nitrogen-fixing capacity of legume crops, leads to a better nutrient energy ratio in said cropping systems over cereal cropping systems. In the case of legume crops viz., soybean, chickpea and mungbean, the contribution from fertilizers to the total energy input was less (12.1–17.3%). In contrast, it was comparatively higher in the case of cereal crops viz., wheat, potato, and fodder sorghum (33.1–35.1%), due to higher nutrient requirements [31].
Mechanical energy in the form of human labor is one of the most valuable inputs in agricultural production in the Indian context [72,73]. In our study, a greater number of human laborers engaged with fodder harvesting due to a greater number of harvests per year in the case of perennial cereal (Bajra–Napier hybrid) + legume (cowpea, lucerne, sesbania) cropping systems coupled with higher biomass production led to higher human energy profitability. Similarly, Parajuli et al. [74] also found that a higher frequency of harvesting, loading and transportation is associated with the cultivation of perennial crops in Denmark. This clearly indicates that these systems are not only productive in terms of biomass, but they also create employment for agricultural labor in addition to maintaining their efficiency in the production process. Prajapat et al. [32] reported higher human energy profitability of 105.2 due to higher labor consumption as well as subsequent higher biomass production with the soybean–chickpea–fodder sorghum cropping system in New Delhi, India.

4.4. Energy Sources

Current agricultural practices mainly rely on indirect and non-renewable energy sources such as fertilizers, pesticides, machinery, and fuel which contribute to GHG emissions and further accelerate climate change [75]. The use of fertilizers and diesel is the primary energy input for field crops. The energy input for irrigation, drying and/or storage is often important, but it is dependent on geographical location and the associated climate, as well as the intensity of the production system [76]. Sustainable agriculture aims to minimize the use of non-renewable energy sources and further promote the adoption of renewable energy sources such as naturally available organic nutrients, solar/wind energy, hydropower, biofuels, integrated nutrients, pest management etc. [77]. Generally, the energy input requirement will vary according to the crop species, soil conditions, nutrient requirement, pesticide usage, irrigated/rainfed condition, cultivation method, number of harvests etc. Indirect and non-renewable energy sources were identified as the major energy input sources in the cultivation of different fodder cropping systems in the current study, with fertilizers as the major contributors. Thus, the effective management of these components by increasing the nutrient use efficiency of fertilizers using the four R principles (right quantity, right time, right method, and right place of application) or soil test-based fertilizer application, energy (fuel) efficient machinery and the use solar energy driven machinery can further reduce their quantity and ultimately reduce the carbon and energy input requirements. Patel et al. [22] also reported indirect energy sources (54.56%) as major contributors to input energy over direct energy sources (45.44%). In China, in a study conducted by Li et al. [78], all cropping systems were found to depend on indirect (56.68–67.58%) and non-renewable energy input sources (80.67–98.38%) to a great extent. Even in European countries such as Portugal, Poland, the Netherlands, Greece, Germany and Finland, indirect energy consumption sits in the range of 50–72% in wheat production, with synthetic fertilizers as significant contributors [76]. However, compared to cereal cropping systems, perennial monocropping and intercropping systems have shown 45 and 52% reductions in indirect and non-renewable energy source use, roughly 46% on average, owing to comparatively lower fertilizer consumption. Thus, to attain sustainability, the contribution of renewable energy sources to input energy needs to be maximized in place of non-renewable energy sources in agricultural cropping systems [79,80,81,82].

5. Conclusions

In the present study, perennial monocropping systems, as well as Bajra–Napier hybrid + legume cropping systems, outperformed monocropping annual cereal and cereal + legume cropping systems in terms of biomass, carbon output and energy output. Particularly, lower carbon and energy input consumption led to achieving higher carbon indices and energy indices with lucerne monocropping and Bajra–Napier hybrid + legume (lucerne and cowpea) cropping systems. Higher energy requirement (0.43–0.57 MJ kg−1) per unit quantity of fodder production was noticed in annual cereal crops compared to perennial monocropping as well intercropping systems (0.17–0.24 MJ kg−1). Lower fertilizer recommendation, specifically nitrogen in the case of the lucerne cropping system, resulted in a higher nutrient energy ratio (25.6), as legume crops are nitrogen fixers. More labor engagement with Bajra–Napier hybrid + legume (cowpea, sesbania and lucerne) cropping systems resulted in higher human energy profitability (174–191.8). It was observed that fertilizers (as an inorganic nutrient source), FYM (as an organic nutrient source) and diesel (as a fuel) presented as major carbon as well as energy input components/sources in the cultivation of different fodder cropping systems in the current study. Overall, the adoption of Bajra–Napier hybrid + legume (lucerne and cowpea) cropping systems will help to reduce the carbon footprint and maximize the energy use efficiency of systems while sustaining livestock production through higher productivity under the present scenario of climate change and limited resource availability.

Supplementary Materials

The following supporting information can be downloaded at: https://www.mdpi.com/article/10.3390/agronomy12081783/s1, Table S1: Quantity of manure and chemical fertilizers applied to each cropping systems.

Author Contributions

K.N.M.: Investigation, Formal analysis, Manuscript writing—original draft; B.G.S.: Conceptualization, Methodology, Supervision; S.S., M., N.M.C., P.G., P.V.V.P. and P.K.J.: Visualization, Writing—review and editing. All authors have read and agreed to the published version of the manuscript.

Funding

This research received no external funding.

Institutional Review Board Statement

Not applicable.

Informed Consent Statement

Not applicable.

Data Availability Statement

Data are available upon request from the corresponding author.

Acknowledgments

The authors are grateful to the Department of Science and Technology, New Delhi, for their support of this research program.

Conflicts of Interest

The authors declare no conflict of interest. The funders had no role in the design of the study; in the collection, analyses, or interpretation of data; in the writing of the manuscript, or in the decision to publish the results.

References

  1. Moraditochaee, M. Research energy indices of eggplant production in north of Iran. ARPN J. Agric. Biol. Sci. 2012, 7, 484–487. [Google Scholar]
  2. Soni, P.; Taewichit, C.; Salokhe, V.M. Energy consumption and CO2 emissions in rainfed agricultural production systems of Northeast Thailand. Agric. Syst. 2013, 116, 25–36. [Google Scholar] [CrossRef]
  3. Singh, R.J.; Meena, R.L.; Sharma, N.K.; Kumar, S.; Kumar, K.; Kumar, D. Economics, energy, and environmental assessment of diversified crop rotations in sub-Himalayas of India. Environ. Monit. Assess. 2016, 188, 1–13. [Google Scholar] [CrossRef] [PubMed]
  4. Chaudhary, V.P.; Gangwar, B.; Pandey, D.K.; Gangwar, K.S. Energy auditing of diversified rice–wheat cropping systems in Indo-Gangetic plains. Energy 2009, 34, 1091–1096. [Google Scholar] [CrossRef]
  5. Fadavi, R.; Keyhani, A.; Mohtasebi, S.S. An analysis of energy use, input costs and relation between energy inputs and yield of apple orchard. Res. Agric. Eng. 2011, 57, 88–96. [Google Scholar] [CrossRef]
  6. Mishra, P.K.; Sharma, S.; Tripathi, H.; Pandey, D. Energy input for fodder crop productions under different types of farming systems. Plant Arch. 2019, 19, 1358–1362. [Google Scholar]
  7. IPCC. Climate Change and Land: An IPCC Special Report on Climate Change, Desertification, Land Degradation, Sustainable Land Management, Food Security, and Greenhouse Gas Fluxes in Terrestrial Ecosystems; Shukla, P.R., Skea, J., Calvo Buendia, E., Masson-Delmotte, V., Pörtner, H.O., Roberts, D.C., Zhai, P., Slade, R., Connors, S., van Diemen, R., et al., Eds.; IPCC: Geneva, Switzerland, 2019; pp. 1–864, in press. [Google Scholar]
  8. Chen, X.; Ma, C.; Zhou, H.; Liu, Y.; Huang, X.; Wang, M.; Cai, Y.; Su, D.; Muneer, M.A.; Guo, M.; et al. Identifying the main crops and key factors determining the carbon footprint of crop production in China, 2001–2018. Resour. Conserv. Recycl. 2021, 172, 105661. [Google Scholar] [CrossRef]
  9. Srinivasarao, C. Programmes and Policies for Improving Fertilizer Use Efficiency in Agriculture. Indian J. Fertil. 2021, 17, 226–254. [Google Scholar]
  10. Annual Report, Government of India Ministry of Chemicals and Fertilizers, Department of Fertilizers, 2019–2020. Available online: https://fert.nic.in/sites/default/files/2020-09/Annual-Report-2019-20.pdf (accessed on 28 February 2022).
  11. Patra, S.; Mishra, P.; Mahapatra, S.C.; Mithun, S.K. Modelling impacts of chemical fertilizer on agricultural production: A case study on Hooghly district, West Bengal, India. Model. Earth Syst. Environ. 2016, 2, 180. [Google Scholar] [CrossRef]
  12. Usama, M.; Khalid, M.A. Fertilizer consumption in India and need for its balanced use: A review. Indian J. Environ. Protecn. 2018, 38, 564–577. [Google Scholar]
  13. Jha, D.; Sarin, R. Fertilizer Use in Semi-Arid Tropical India; Research Bulletin No. 9; International Crops Research Institute for Semi-Aarid Tropics: Patancheru, India, 1984. [Google Scholar]
  14. Tiwari, P.S.; Singh, K.K.; Sahni, R.K.; Kumar, V. Farm mechanization—Trends and policy for its promotion in India. Indian J. Agric. Sci. 2019, 89, 1555–1562. [Google Scholar]
  15. WRI CAIT 4.0, 2017-World Resources Institute Climate Analysis Indicators Tool. Greenhouse Gas Emissions in India, Emissions including Land-Use Change and Forestry. Global Warming Potentials are from the Intergovernmental Panel on Climate Change Second Assessment Report. September 2018. Available online: https://www.wri.org/data/cait-climate-data-explorer (accessed on 28 February 2022).
  16. Guignard, M.S.; Leitch, A.R.; Acquisti, C.; Eizaguirre, C.; Elser, J.J.; Hessen, D.O.; Jeyasingh, P.D.; Neiman, M.; Richardson, A.E.; Soltis, P.S.; et al. Impacts of nitrogen and phosphorus: From genomes to natural ecosystems and agriculture. Front. Ecol. Evol. 2017, 6, 70. [Google Scholar] [CrossRef]
  17. Sharma, N.; Singhvi, R. Effects of Chemical Fertilizers and Pesticides on Human Health and Environment: A Review. Int. J. Agric. Environ. Biotechnol. 2017, 10, 675–679. [Google Scholar] [CrossRef]
  18. Kumar, S.; Kumar, R.; Dey, A. Energy budgeting of crop-livestock-poultry integrated farming system in irrigated ecologies of eastern India. Indian J. Agric. Sci. 2019, 89, 1017–1022. [Google Scholar]
  19. Hitaj, C.; Suttles, S. Trends in U.S. Agriculture’s Consumption and Production of Energy: Renewable Power, Shale Energy, and Cellulosic Biomass, EIB-159; U.S. Department of Agriculture, Economic Research Service: Washington, DC, USA, 2016.
  20. Erdal, G.; Esengun, K.; Guduz, O. Energy use and economic analysis of sugar beet production in Tokat province of Turkey. Energy 2007, 32, 34–41. [Google Scholar] [CrossRef]
  21. Tuti, M.D.; Prakash, V.; Pandey, B.M.; Bhattacharyya, R.; Mahanta, D.; Bisht, J.K.; Kumar, M.; Mina, B.L.; Kumar, N.; Bhatt, J.C.; et al. Energy budgeting of Colocasia-based cropping systems in the Indian sub-Himalayas. Energy 2012, 45, 986–993. [Google Scholar] [CrossRef]
  22. Patel, P.G.; Bhut, A.C.; Gupta, P. Energy requirement for kharif maize cultivation in Panchmahal district of Gujarat. J. AgriSearch 2014, 1, 168–172. [Google Scholar] [CrossRef]
  23. Singh, H.N.; Kumar, M.R.; Magan, S.; Rakesh, K.; Hardev, R.; Kumar, M.V.; Manish, K. Evaluation of kharif forage crops for biomass production and nutritional parameters in Indo-Gangetic plains of India. Indian J. Anim. Nutr. 2019, 36, 25–29. [Google Scholar] [CrossRef]
  24. Patil, L.M.; Kauthale, V.K.; Bhalani, T.G.; Modi, D.J. Productivity, and economics of different forage production systems in south Gujarat conditions of India. Forage Res. 2018, 44, 14–18. [Google Scholar]
  25. Roy, A.K.; Agrawal, R.K.; Bhardwaj, N.R.; Mishra, A.K.; Mahanta, S.K. Revisiting national forage demand and availability scenario. In Indian Fodder Scenario: Redefining State Wise Status; Annual Report; ICAR-AICRP on Forage Crops and Utilization: Jhansi, India, 2019; pp. 1–21. [Google Scholar]
  26. Kaithwas, M.; Singh, S.; Prusty, S.; Mondal, G.; Kundu, S.S. Evaluation of legume and cereal fodders for carbohydrate and protein fractions, nutrient digestibility, energy and forage quality. Range Manag. Agrofor. 2020, 41, 126–132. [Google Scholar]
  27. Prajapati, B.; Tiwari, S.; Kewalanand. Effect of fodder based intercropping systems on quality of fodder. Forage Res. 2018, 43, 308–313. [Google Scholar]
  28. Hindoriya, P.S.; Meena, R.K.; Rakesh, K.; Singh, M.; Ram, H.; Meena, V.K.; Ginwal, D.; Dutta, S. Productivity, and profitability of cereal-legume forages vis-a-vis their effect on soil nutrient status in Indo-Gangetic Plains. Legume Res. 2019, 42, 812–817. [Google Scholar] [CrossRef]
  29. Zhang, J.; Yin, B.; Xie, Y.; Li, J.; Yang, Z.; Zhang, G. Legume-cereal intercropping improves forage yield, quality and degradability. PLoS ONE 2015, 10, e0144813. [Google Scholar] [CrossRef]
  30. Capstaff, N.M.; Miller, A.J. Improving the yield and nutritional quality of forage crops. Front. Plant Sci. 2018, 9, 535. [Google Scholar] [CrossRef]
  31. Abd Rabboh, A.M.; Zen El-Dein, A.A.; Ahmed, N.R. Forge yield and its quality of sudangrass and cowpea under different intercropping patterns. Al-Azhar J. Agric. Res. 2020, 45, 102–115. [Google Scholar]
  32. Prajapat, K.; Vyas, A.K.; Dhar, S.; Jain, N.K.; Hashim, M.; Choudhary, G.L. Energy input-output relationship of soybean-based cropping systems under different nutrient supply options. J. Environ. Biol. 2018, 39, 93–101. [Google Scholar] [CrossRef]
  33. Lal, R. Carbon emission from farm operations. Environ. Int. 2004, 30, 981–990. [Google Scholar] [CrossRef]
  34. West, T.O.; Marland, G. A synthesis of carbon sequestration, carbon emissions, and net carbon flux in agriculture: Comparing tillage practices in the United States. Agric. Ecosyst. Environ. 2002, 91, 217–232. [Google Scholar] [CrossRef]
  35. Sah, D. Estimation of Carbon Footprint in Cultivation of Major Agricultural Crops in India. Master’s Thesis, Submitted to University Agriculture Science Bangalore, Karnataka, India, 2017. [Google Scholar]
  36. Chaudhary, V.P.; Singh, K.K.; Pratibha, G.; Bhattacharyya, R.; Shamim, M.; Srinivas, I.; Patel, A. Energy conservation and greenhouse gas mitigation under different production systems in rice cultivation. Energy 2017, 130, 307–317. [Google Scholar] [CrossRef]
  37. Basavalingaiah, K.; Ramesha, Y.M.; Paramesh, V.; Rajanna, G.A.; Jat, S.L.; Dhar Misra, S.; Kumar Gaddi, A.; Girisha, H.C.; Yogesh, G.S.; Raveesha, S.; et al. Energy budgeting, data envelopment analysis and greenhouse gas emission from rice production system: A case study from puddled transplanted rice and direct-seeded rice system of Karnataka, India. Sustainability 2020, 12, 6439. [Google Scholar] [CrossRef]
  38. Sah, D.; Devakumar, A.S. The carbon footprint of agricultural crop cultivation in India. Carbon Manag. 2018, 9, 213–225. [Google Scholar] [CrossRef]
  39. Lu, F.; Wang, X.K.; Han, B. Assessment on the availability of nitrogen fertilization in improving carbon sequestration potential of China’s cropland soil. Chin. J. App. Ecol. 2008, 19, 2239–2250. [Google Scholar]
  40. Dubey, A.; Lal, R. Carbon footprint and sustainability of agricultural production systems in Punjab, India, and Ohio, USA. J. Crop Improv. 2009, 23, 332–350. [Google Scholar] [CrossRef]
  41. IPCC. Guidelines for National Greenhouse Gas Inventories; National Greenhouse Gas Inventories Programme: Tokyo, Japan, 2016. [Google Scholar]
  42. Rao, K.V.R.; Gangwar, S.; Bajpai, A.; Chourasia, L.; Soni, K. Energy assessment of rice under conventional and drip irrigation systems. In Water Resources Management; Springer: Singapore, 2018; pp. 19–29. [Google Scholar] [CrossRef]
  43. Sudhakara, T.M.; Srinvas, A.; Kumar, R.M.; Prakash, T.R.; Rajanna, G.A. Energy saving and profitability of rice (Oryza sativa) under mechanized and conventional system of rice intensification. Indian J. Agron. 2017, 62, 174–179. [Google Scholar]
  44. Paramesh, V.; Parajuli, R.; Chakurkar, E.B.; Sreekanth, G.B.; Chetan Kumar, H.B.; Gokuldas, P.P.; Mahajan, G.R.; Manohara, K.K.; Viswanatha, R.K.; Ravisankar, N. Sustainability, energy budgeting, and life cycle assessment of crop-dairy-fish-poultry mixed farming system for coastal lowlands under humid tropic condition of India. Energy 2019, 188, 116101. [Google Scholar] [CrossRef]
  45. Singh, K.P.; Prakash, V.; Srinivas, K.; Srivastva, A.K. Effect of tillage management on energy use efficiency and economics of soybean (Glycine max) based cropping systems under the rainfed condition in North-West Himalayan region. Soil Tillage Res. 2008, 100, 78–82. [Google Scholar] [CrossRef]
  46. Canakci, M.; Topakci, M.; Akinci, I.; Ozmerzi, A. Energy use pattern of some field crops and vegetable production: Case study for Antalya region, Turkey 2005. Energy Convers. Manag. 2005, 46, 655–666. [Google Scholar] [CrossRef]
  47. Singh, S.; Mittal, J.P. Energy in Production Agriculture; Mittal Publications: New Delhi, India, 1992. [Google Scholar]
  48. Rafiee, S.; Mousavi Avval, S.H.; Mohammadi, A. Modeling and sensitivity analysis of energy inputs for apple production in Iran. Energy 2010, 35, 3301–3306. [Google Scholar] [CrossRef]
  49. Mandal, K.G.; Saha, K.P.; Ghosh, P.K.; Hatik, M.; Bandyopadhyay, K.K. Bio-energy and economic analysis of soybean-based crop production systems in central India. Biomass Bioenergy 2002, 23, 337–345. [Google Scholar] [CrossRef]
  50. Taki, M.; Ajabshirchi, Y.; Mobtaker, H.G.; Abdi, R. Energy consumption, input–output relationship and cost analysis for green house productions in Esfahan province of Iran. Am. J. Exp. Agric. 2012, 2, 485–501. [Google Scholar] [CrossRef]
  51. Ozkan, B.; Akcaoz, H.; Fert, C. Energy input-output analysis in Turkish agriculture. Renew Energy 2004, 29, 39–51. [Google Scholar] [CrossRef]
  52. Lal, B.; Rajput, D.S.; Tamhankar, M.B.; Agarwal, I.; Sharma, M.S. Energy use and output assessment of food-forage production system. J. Agron. Crop Sci. 2003, 189, 57–62. [Google Scholar] [CrossRef]
  53. Sheoran, O.P.; Tonk, D.S.; Kaushik, L.S.; Hasija, R.C.; Pannu, R.S. Statistical Software Package for Agricultural Research Workers. In Recent Advances in Information Theory; Hasija Department of Mathematics Statistics: Hisar, India, 1998; pp. 139–143. [Google Scholar]
  54. Bastia, D.K.; Behera, S.K.; Panda, M.R. Impacts of soil fertility management on productivity and economics of rice and fodder intercropping systems under rainfed conditions in Odisha, India. J. Integr. Agric. 2021, 20, 3114–3126. [Google Scholar] [CrossRef]
  55. Ghazouani, A.; Mhamdi, N.; Znaidi, I.E.; Darej, C.; Guoiaa, N.; Hasnaoui, M.; Bouraoui, R.; Mhamdi, H. Life cycle analysis of raw milk production in Tunisia. Braz. J. Biol. Sci. 2018, 5, 249–258. [Google Scholar] [CrossRef]
  56. Luo, D.; Xu, G.; Luo, J.; Cui, X.; Shang, S.; Qian, H. Integrated Carbon Footprint and Economic Performance of Five Types of Dominant Cropping Systems in China’s Semiarid Zone. Sustainability 2022, 14, 5844. [Google Scholar] [CrossRef]
  57. Gong, H.; Li, J.; Sun, M.; Xu, X.; Ouyan, Z. Lowering carbon footprint of wheat-maize cropping system in North China Plain: Through microbial fertilizer application with adaptive tillage. J. Clean. Prod. 2020, 268, 122255. [Google Scholar] [CrossRef]
  58. Jiang, Z.; Zhong, Y.; Yang, J.; Wu, Y.; Li, H.; Zheng, L. Effect of nitrogen fertilizer rates on carbon footprint and ecosystem service of carbon sequestration in rice production. Sci. Total Environ. 2019, 670, 210–217. [Google Scholar] [CrossRef]
  59. Ma, B.L.; Liang, B.C.; Biswas, D.K.; Morrison, M.J.; McLaughlin, N.B. The carbon footprint of maize production as affected by nitrogen fertilizer and maize-legume rotations. Nutr. Cycl. Agroecosyst. 2012, 94, 15–31. [Google Scholar] [CrossRef]
  60. Liu, C.; Cutforth, H.; Chai, Q.; Gan, Y. Farming tactics to reduce the carbon footprint of crop cultivation in semiarid areas. A review. Agron. Sustain. Dev. 2016, 36, 1–16. [Google Scholar] [CrossRef]
  61. Adom, F.; Maes, A.; Workman, C.; Clayton-Nierderman, Z.; Thoma, G.; Shonnard, D. Regional carbon footprint analysis of dairy feeds for milk production in the USA. Int. J. Life Cycle Assess. 2012, 17, 520–534. [Google Scholar] [CrossRef]
  62. Nan, Q.; Wang, C.; Wang, H.; Yi, Q.Q.; Wu, W.X. Mitigating methane emission via annual biochar amendment pyrolyzed with rice straw from the same paddy field. Sci. Total Environ. 2020, 746, 141351. [Google Scholar] [CrossRef]
  63. Recio, J.; Montoya, M.; Gin´es, C.; Sanz-Cobena, A.; Vallejo, A.; Alvarez, J.M. Joint mitigation of NH3 and N2O emissions by using two synthetic inhibitors in an irrigated cropping soil. Geoderma 2020, 373, 114423. [Google Scholar] [CrossRef]
  64. Chen, X.; Xu, X.; Lu, Z.; Zhang, W.; Yang, J.; Hou, Y.; Wang, X.; Zhou, S.; Li, Y.; Wu, L.; et al. Carbon footprint of a typical pomelo production region in China based on farm survey data. J. Clean. Prod. 2020, 277, 124041. [Google Scholar] [CrossRef]
  65. Kumar, A.; Rana, K.S.; Choudhary, A.K.; Bana, R.S.; Sharma, V.K.; Prasad, S.; Gupta, G.; Choudhary, M.; Pradhan, A.; Rajpoot, S.K.; et al. Energy budgeting and carbon footprints of zero-tilled pigeonpea—Wheat cropping system under sole or dual crop basis residue mulching and Zn-fertilization in a semi-arid agro-ecology. Energy 2021, 231, 120862. [Google Scholar] [CrossRef]
  66. Vourdoubas, J. Energy and agri-food systems: Production and consumption. In Zero Waste in the Mediterranean; International Centre for Advanced Mediterranean Agronomic Studies (CIHEAM)/Food and Agriculture Organization of the United Nations (FAO); Presses de Sciences Po: Paris, France, 2016; p. 155. [Google Scholar]
  67. Povilaitis, V.; Slepetiene, A.; Slepetys, J.; Lazauskas, S.; Tilvikiene, V.; Amaleviciute, K.; Feiziene, D.; Feiza, V.; Liaudanskiene, I.; Ceseviciene, J.; et al. The productivity and energy potential of alfalfa, fodder galega and maize plants under the conditions of the nemoral zone. Acta Agric. Scand. Sect. B Soil Plant Sci. 2016, 66, 259–266. [Google Scholar] [CrossRef]
  68. Budzynski, W.; Szemplinski, W.; Parzonka, A.; Sałek, T. Agricultural productivity, energy efficiency and costs associated with growing selected energy crops for biogas production. In Production and Processing of Agricultural and Aquatic Biomass for Biogas Plants and Gasification Units; Gołaszewski, J., Ed.; University Warmia and Mazury in Olsztyn: Olsztyn, Poland, 2014; pp. 11–282. [Google Scholar]
  69. Rautaray, S.K.; Mishra, A.; Verma, O.P. Energy efficiency, productivity and profitability of rice (Oryza sativa L.) based cropping systems for selected conservation practices. Arch. Agron. Soil Sci. 2017, 63, 1993–2006. [Google Scholar] [CrossRef]
  70. Alluvione, F.; Moretti, B.; Sacco, D.; Grignani, C. EUE (energy use efficiency) of cropping systems for a sustainable agriculture. Energy 2011, 36, 4468–4481. [Google Scholar] [CrossRef]
  71. Pandey, M. Effect of integrated nutrient management on yield, quality and uptake of nutrients in oat (Avena sativa) in alluvial soil. Ann. Plant Soil Res. 2018, 20, 1–6. [Google Scholar]
  72. Baba, S.H.; Wani, M.H.; Shaheen, F.A.; Zargar, B.A.; Kubrevi, S.S. Scarcity of Agricultural Labour in Cold-Arid Ladakh: Extent, Implications, Backward Bending and Coping Mechanism. Agric. Econ. Res. Rev. 2011, 24, 391–400. [Google Scholar]
  73. Singh, R.J.; Ahlawat, I.P.S. Energy budgeting and carbon footprint of transgenic cotton-wheat production system through peanut intercropping and FYM addition. Environ. Monit. Assess. 2015, 187, 1–16. [Google Scholar] [CrossRef] [PubMed]
  74. Parajuli, R.; Knudsen, M.T.; Djomo, S.N.; Corona, A.; Birkved, M.; Dalgaard, T. Environmental life cycle assessment of producing willow, alfalfa and straw from spring barley as feedstocks for bioenergy or biorefinery systems. Sci. Total Environ. 2017, 586, 226–240. [Google Scholar] [CrossRef] [PubMed]
  75. Woods, J.; Williams, A.; Hughes, J.K.; Black, M.; Murphy, R. Energy and the food system. Phil. Trans. R. Soc. B 2010, 365, 2991–3006. [Google Scholar] [CrossRef] [PubMed]
  76. Golaszewski, J.; De Visser, C.; Brodzinski, Z.; Myhan, R.; Olba-Ziety, E.; Stolarski, M.; Buisonjé, F.; Ellen, H.; Stanghellini, C.; Van der Voort, M.; et al. State of the art on Energy Efficiency in Agriculture. Country data on energy consumption in different agro-production sectors in the European countries. Energy Effic. 2012, 1–68. [Google Scholar]
  77. Chel, A.; Kaushik, G. Renewable energy for sustainable agriculture. Agronomy for Sustainable Development. Agron. Sustain. Dev. 2011, 31, 91–118. [Google Scholar] [CrossRef]
  78. Li, J.; Cui, J.; Sui, P.; Yue, S.; Yang, J.; Ziqing, L.; Wang, D.; Chen, X.; Sun, B.; Ran, M.; et al. Valuing the synergy in the water-energy-food nexus for cropping systems: A case in the North China Plain. Ecol. Indic. 2021, 127, 107741. [Google Scholar] [CrossRef]
  79. Moreno, M.M.; Lacasta, C.; Meco, R.; Moreno, C. Rainfed crop energy balance of different farming systems and crop rotations in a semi-arid environment: Results of a long-term trial. Soil Tillage Res. 2011, 114, 18–27. [Google Scholar] [CrossRef]
  80. Zarini, R.L.; Loghmanpour, M.H.; Ramezani, M.A.; Afrouzi, H.N.; Tabatabaekoloor, R. Relationship between energy consumption and egg production in poultry in Iran. Biol. Forum Int. J. 2015, 7, 296–299. [Google Scholar]
  81. Manoj, K.N.; Shekara, B.G.; Sridhara, S.; Jha, P.K.; Prasad, P.V.V. Biomass Quantity and Quality from Different Year-Round Cereal–Legume Cropping Systems as Forage or Fodder for Livestock. Sustainability 2021, 13, 9414. [Google Scholar] [CrossRef]
  82. Sridhara, S.; Gopakkali, P.; Manoj, K.N.; Patil, K.K.R.; Paramesh, V.; Jha, P.K.; Prasad, P.V.V. Identification of Sustainable Development Priorities for Agriculture through Sustainable Livelihood Security Indicators for Karnataka, India. Sustainability 2022, 14, 1831. [Google Scholar] [CrossRef]
Figure 1. Overall mean share (%) of inputs used in the carbon footprint estimation of different fodder cropping systems.
Agronomy 12 01783 g001
Figure 2. Box and Whisker plot of overall mean carbon indices under different fodder cropping systems. CSI, Carbon Sustainability Index; CER, Carbon Efficiency Ratio; CE, Carbon Efficiency. X-axis indicates carbon indices; the error bar is the range of respective values of the indices.
Agronomy 12 01783 g002
Figure 3. Overall mean share (%) of inputs in energy budgeting of different fodder cropping systems.
Agronomy 12 01783 g003
Figure 4. Box and Whisker plot of overall mean energy indices under different fodder cropping systems. Energy efficiency, energy productivity, specific productivity and energy profitability.
Agronomy 12 01783 g004
Figure 5. Nutrient energy ratio and human energy profitability under different fodder cropping systems. The bars in the figure indicate the standard error.
Agronomy 12 01783 g005
Figure 6. Overall mean energy sources of different fodder cropping systems. Direct energy, indirect energy, renewable energy, and non-renewable energy.
Agronomy 12 01783 g006
Figure 7. Overall mean share (%) of direct energy components under different fodder cropping systems.
Agronomy 12 01783 g007
Figure 8. Overall mean share (%) of indirect energy components under different fodder cropping systems.
Agronomy 12 01783 g008
Figure 9. Overall mean share (%) of renewable energy components under different fodder cropping systems.
Agronomy 12 01783 g009
Figure 10. Overall mean share (%) of non-renewable energy components under different fodder cropping systems.
Agronomy 12 01783 g010
Table 1. Chemical properties and weather conditions of the experimental site during the study.
ParameterValues Recorded
Soil typeRed sandy loam
pH7.45
Electrical conductivity (EC)0.38 ds m−1
Organic carbon5.5 g kg−1
Available Nitrogen118.5 mg kg−1
Available Phosphorus22 mg kg−1
Available Potassium72.5 mg kg−1
Prevailed weather conditions
During 2018–2019During 2019–2020
Rainfall520.7 mm912.7 mm
Temperature
Maximum35.5 °C (May)36 °C (June)
Minimum17 °C (January)16.3 °C (December)
Relative humidity
Maximum95% (August)92% (October)
Minimum53% (May)35% (March)
Table 2. Different fodder cropping systems adopted in the experiment.
TreatmentsSystem TypeTreatment DetailsVariety/HybridSpacing
T1Annual monocroppingMaize–Maize–MaizeAfrican Tall30 × 10 cm
T2Sorghum–Sorghum–SorghumSudex Chari-1
T3Oat–Oat–OatOS-6
T4Pearl millet–Pearl millet–Pearl milletBAIF bajra-1
T5Cowpea–Cowpea–CowpeaMFC-09-1
T6Perennial monocroppingBajra–Napier hybridBNH-1090 × 60 cm
T7LucerneRL-8830 × 10 cm
T8DesmanthusCo-1
T9SesbaniaLocal
T10Annual
cereal + legume intercropping (3:1 row proportion)
Maize + Cowpea–Oat + Cowpea–Pearl millet + Cowpea-30 × 10 cm
T11Sorghum + Cowpea–Maize + Cowpea–Pearl millet + Cowpea-
T12Perennial
cereal + legume intercropping (2:8 row proportion)
Bajra–Napier hybrid + Cowpea-Main crop-90 × 45 cm, intercrop-30 × 10 cm
T13Bajra–Napier hybrid + Lucerne-
T14Bajra–Napier hybrid + Desmanthus-
T15Bajra–Napier hybrid + Sesbania-
Note: Same varieties/hybrids were used under intercropping systems as that of monocropping.
Table 3. Emission factor of different inputs used in the estimation of total carbon input.
Input SourceEmission FactorReference
FertilizersNitrogen: 1.74 t-CE t−1 N fertilizer
Phosphorus: 0.2 t-CE t−1 P fertilizer
Potash: 0.15 t-CE t−1 K fertilizer
[39,40]
N fertilizer induced N2O1.28 t-CE t−1 N fertilizer[41]
Farmyard Manure (FYM)0.007 × 10³ t-CE t−1 FYM[33]
Pesticides6.3 × 10−3 t-CE t−1 herbicide
5.1 × 10⁻³ t-CE t−1 insecticide
3.9 × 10⁻³ t-CE t−1 fungicide
Electricity7.25 × 10−5 t-CE kWh−1 energy
Diesel7.17 × 10−4 t-CE L−1 diesel[34]
Table 4. Energy equivalents of inputs and outputs of forage cultivation.
InputUnitEquivalent Energy
(MJ Unit−1)
Reference
Labor
a.
Male labor
Hour1.96[45]
b.
Female labor
Hour1.57[45]
Diesel fuelLiter56.31[46]
MachineryHour62.7[47]
ChemicalsKilogram120[4]
ChemicalsLiter102[4]
FertilizersKilogram
a.
Nitrogen
66.14[48]
b.
Phosphorus
12.44[48]
c.
Potassium
11.15[48]
d.
Micronutrients
120[49]
Farmyard manureKilogram0.3[50]
IrrigationCubic meter1.02[21]
ElectricityKilowatt hour3.6[51]
SeedsKilogram15.7[51]
Output
Green fodder yieldKilogram2.30[52]
Table 5. Carbon input, output and its indices under different cropping systems involving annual and perennial fodder crops. For treatment details see Table 2.
TreatmentsGFY
(kg ha−1 Year−1)
Carbon Input
(kg-CE ha−1 Year−1) *
Carbon Output
(kg-CE ha−1 Year−1)
CSICERCarbon Efficiency
(kg kg-CE−1)
T1104,658 fgh1419.550,236 fgh34.4 g35.4 g73.7 g
T290,650 ghi1010.343,512 ghi42.1 g43.1 g89.7 g
T382,658 i1247.539,676 i30.8 g31.8 g66.3 g
T485,358 hi1247.540,972 hi31.8 g32.8 g68.4 g
T577,817 i511.137,352 i72.1 f73.1 f152.2 f
T6126,150 cde760.760,552 cde78.6 ef79.6 ef165.8 ef
T795,217 fghi274.045,704 fghi165.8 a166.8 a347.5 a
T879,608 i400.938,212 i94.3 cde95.3 cde198.6 cde
T995,992 fghi397.746,076 fghi114.9 b115.9 b241.4 b
T10110,268 efg1412.952,928 efg36.5 g37.5 g78.0 g
T11115,325 def1380.755,356 def39.1 g40.1 g83.5 g
T12155,222 ab763.974,507 ab96.5 cd97.5 cd203.2 cd
T13163,628 a763.978,542 a101.8 bc102.8 bc214.2 bc
T14131,059 cd763.962,908 cd81.3 def82.3 def171.6 def
T15144,002 bc763.969,121 bc89.5 cde90.5 cde188.5 cde
Note: GFY, Green fodder yield; CSI, Carbon sustainability index; CER, Carbon efficiency ratio; *, Statistically not analyzed. Values with different alphabets are significantly different from each other as per the DMRT at p < 0.05.
Table 6. Energy input, output and its indices under different cropping systems involving annual and perennial fodder crops.
TreatmentsEnergy Input *
(MJ ha−1 Year−1)
Energy Output
(MJ ha−1 Year−1)
Energy Use EfficiencyEnergy Productivity (kg MJ−1)Specific Productivity (MJ kg−1)Net Energy (MJ ha−1 Year−1)Energy Profitability
T152,466240,714 fgh4.6 f2.0 f0.5 ab1,882,481 def3.61 f
T238,606208,495 ghi5.4 ef2.3 ef0.43 bc1,698,891 def4.41 ef
T346,550190,114 i4.1 f1.8 f0.57 a1,435,641 f3.11 f
T442,912196,324 hi4.6 f2 f0.5 ab1,534,121 f3.61 f
T526,230178,978 i6.8 e3.0 e0.36 c1,527481 f5.81 e
T629,030290,145 cde10.0 cd4.3 cd0.23 d2,611,151 c9.01 cd
T716,106218,998 fghi13.6 a5.9 a0.17 d2,028,931 de12.61 a
T819,276183,099 i9.5 d4.1 d0.24 d1,638,231 ef8.51 d
T919,466220,781 fghi11.3 bc4.9 bc0.21 d2,013,141 de10.31 bc
T1050,272253,616 efg5.0 f2.2 f0.46 b2,033,431 de4.01 f
T1148,935265,247 def5.4 ef2.4 ef0.431 bc2,163,121 d4.41 ef
T1229,200357,011 ab12.2 ab5.3 ab0.191 d3,278,111 ab11.21 ab
T1328,384376,345 a13.3 a5.8 a0.171 d3,479,611 a12.31 a
T1428,408301,435 cd10.6 bcd4.6 bcd0.221 d2,730,271 c9.61 bcd
T1528,552331,204 bc11.6 bc5.0 bc0.201 d3,026,521 bc10.61 bc
Note: *—Statistically not analyzed. Values with different alphabets are significantly different from each other as per the DMRT at p < 0.05.
Publisher’s Note: MDPI stays neutral with regard to jurisdictional claims in published maps and institutional affiliations.

