Article

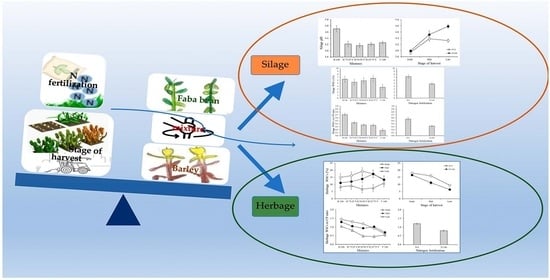
Herbage and Silage Quality Improved More by Mixing Barley and Faba Bean Than by N Fertilization or Stage of Harvest

1
Department of Veterinary Science, University of Pisa, Viale Delle Piagge 2, 56124 Pisa, Italy
2
Department of Agriculture, Food and Environment, University of Pisa, 56124 Pisa, Italy
*
Author to whom correspondence should be addressed.
Agronomy 2022, 12(8), 1790; https://doi.org/10.3390/agronomy12081790
Submission received: 1 July 2022 / Revised: 25 July 2022 / Accepted: 26 July 2022 / Published: 29 July 2022
(This article belongs to the Special Issue Mixed Cropping—a Low Input Agronomic Approach to Sustainability)

Abstract

:
Legume–cereal mixtures are pivotal in yielding a more balanced forage composition compared to the sole crops, due to the well-adjusted equilibrium of carbohydrate and protein. However, great attention is required in choosing the optimal ratio of the components for the mixtures and other agronomic practices (including N fertilization and stage of harvest), because they can sharply change the forage composition and quality. To fill this gap, the present research compared the herbage and silage qualities and key fermentative and nutritional traits of biomasses obtained by: (i) five mixtures (i.e., 100:0; 75:25, 50:50, 25:75, and 0:100) of hybrid barley (Hordeum vulgare L.) and faba bean (Vicia faba var. minor); (ii) two N barley fertilization rates (0 vs. 140 kg N ha−1); and (iii) three stages of harvest (milky, early dough and soft dough). We found that the presence of faba bean improved the forage quality, either herbage or silage, through different mechanisms. In the herbage mixtures, faba bean inclusion increased crude protein (CP), and, when compared to the fertilized barley, also water-soluble sugar (WSCs) concentration, with small effects on the relative feed values (RFV) and total digestible nutrients (TDN). In the silage, the higher the faba bean share in the mixture, the higher the RFV, the non-fibrous carbohydrates, and total and lactic acid concentrations, and the lower the pH and the hemicellulose and cellulose concentrations, particularly at the early and mid stages of harvest. These improvements were likely due to the high ability of faba bean to attain a vegetative status (i.e., low dry matter concentration) by the end of the cropping season, and to improve the organic acid production. Our results suggest that the inclusion of faba bean in a barley-based silage system can widen the window for silage harvesting, thanks to its ability to sustain the fermentation process, despite a lower WSC to CP ratio compared to the unfertilized barley. These results occurred almost irrespectively of the faba bean share in the mixture and barley fertilization. This implies that when designing intercrop mixtures, the effect of crop densities on yield should be considered more than on quality.

Graphical Abstract

1. Introduction

The mixed cropping (MC) of Poaceae and Fabaceae is a paramount agricultural practice in a wealth of conditions, including both low-input and organic farming, because it can augment the overall resource-use efficiency and foster sustainability by increasing productivity and yield stability [1,2,3,4,5,6,7]. Consequently, MC is also a key sustainable strategy to cope with climate changes (CC) [7]; additionally, the severity of the environmental stresses due to CC are predicted to remarkably affect forage production. In regions with uneven precipitation patterns, hay production can encounter various stresses, including both excessive drought, limiting yields, and rainfall during haying activities, dramatically reducing hay quality. Ensiling is an important method to preserve fresh forages for feeding ruminants. This particularly occurs in the Mediterranean region, which has mild and wet winters and hot and dry summers and has also been identified as a major “Hot-Spot” in future climate change projections [8].
The process of ensiling is based on biomass conversion under anaerobic conditions after the fermentation of the water-soluble carbohydrates (WSCs) of the fresh forage into organic acids. Epiphytic lactic acid bacteria (LAB) convert WSCs to lactic acid and, to a lesser extent, to acetic acid. As a result, the pH decreases and stabilizes the forage, allowing its preservation from spoilage microorganisms for a long period [9].
Pure stands of cereals, e.g., maize (Zea mais L.), wheat (Triticum spp.), oat (Avena spp.) and barley (Hordeum vulgare L.), are widely used in ruminant feeding thanks to their excellent dry matter (DM) production and low cost. Additionally, these cereals can be easily ensiled thanks to the high concentration of WSCs. However, cereal forages usually show a low crude protein (CP) content, which limits their forage values, and is usually compensated for by supplying proteins from other sources [10,11]. In addition, the ability of cereal to maintain a high quality declines sharply with time by the end of the growing season [12,13], thus posing problems in the choice of the time of harvest.
Legumes have a high CP concentration, but their bromatological traits, and thus their suitability to be ensiled, depend on the species, cultivar, harvest date and environmental and management conditions [14,15,16,17]. Moreover, legume forages have a lower neutral detergent fiber (NDF) concentration and NDF particles with higher physical fragility compared to cereals, which corresponds to a high dry matter intake, which is a desirable feature [11,18]. Despite these valuable characteristics, legume crops produce a low DM and have a high moisture content that, together with a high buffering capacity and low WSC content, makes them difficult to be ensiled [19]. Furthermore, they are weak competitors against weeds [3,20,21], which can dramatically limit the quality of the legume stand for forage production.
Mixing cereals and legumes can thus be a valuable strategy to obtain high-quality forages, especially for ensiling production. Several studies have described the improvement in CP content in the forages by cereal/legume intercropping, compared to the cereal alone, e.g., [10,22,23]. In addition, when aiming to ensile a biomass mixture, the presence of cereal crops can increase the total contents of WSCs and DM in the fresh forage, enhancing fermentation during ensiling [19]. However, the dry matter, CP, and pH of silages can vary depending on the ratio of the crops in the mixtures and the environment and agronomic management can modify the components of the mixtures, altering the composition of the feed [12,13,24]. Consequently, designing and cultivating mixed cropping for silage purposes implies the ability to modulate the biomass share of each crop in the mixture, their bromatological traits and the choice of the optimal time of harvest. In addition, the choice of the ideal species combination and agronomic management are fundamental to avoid competition effects, improve yield and profit, and to provide a good energy/protein balance in forages [25,26].
Faba bean (Vicia faba var. minor) is an annual legume predominantly used for grain production as alternative protein source to soybean in organic farming [17,27]. Whole-crop faba bean can produce an excellent silage [28] if some of its traits, including lactic acid fermentation or eventual wilting, as can the application of additives, are controlled. In theory, most of these traits could be improved by mixing faba bean with other biomasses with high WSCs, such as cereals [29,30,31,32]. In Central Italy, barley (Hordeum vulgare L.) could be an interesting companion crop for faba bean [25]. Usually, barley forage has an elevated amount of WSC, providing abundant substrate for lactate production, which is needed to ensure the preservation of silage [33]. However, the characteristics of the fermentation process are influenced by the type and number of lactic acid bacteria.
Barley and faba bean are usually sown and harvested in the same period and thus potentially represent a valid option for silage as a mixture in Mediterranean environments. However, although the fermentation characteristics and the nutritive value of barley and faba bean ensiled as sole crops have been studied [29,30,34,35,36,37], their role in mixture for silage is scarcely known [38].
In addition, forage for silage is commonly harvested at the early to mid dough stage of maturity, as this stage is considered as optimal from the point of view of balancing the DM yield with acceptable nutrient quality [39]. In Mediterranean environments, hybrid barley genotypes have shown high yield potential as well as great tolerance to abiotic stress and disease resistance due to a higher vegetative vigor and their ability to stay green for longer [40]. Furthermore, they showed a high nitrogen-use efficiency, allowing the reduction in the N inputs in their cultivation.
However, when growing barley and faba bean in an intercrop, the optimal stage for silage may differ between species. In particular, no information is available on the hybrid barley/faba bean ratio required to combine the optimal forage quality with a good shelf life.
To fill this gap, the aim of this research was to study the characteristics of herbage and silage obtained from different ratios of faba bean and hybrid barley, either fertilized with N or unfertilized, and harvested at three different phenological stages.
We hypothesized that different mixture ratios of faba bean and hybrid barley might exhibit varying impacts on the nutritional quality of preserved fodder as herbage or silage and that N fertilization for barley and the harvesting stage of the crops could interact in terms of bromatological composition and fermentation process.

2. Materials and Methods

2.1. Plant Materials and Experimental Design

The field experiment was carried out under rainfed conditions in 2020 at the “Enrico Avanzi” Interdepartmental Centre of Agro-Environmental Research (CIRAA) of the University of Pisa (43°40′ N, 10°18′ E, 1 m a.s.l., approximately 5 km from the sea). According to Köppen, the climate is classified as Csa, with mean annual maximum and minimum daily air temperatures of 20.2 and 9.5 °C, respectively, and precipitation of 971 mm per year. The treatments consisted of sole crop biomasses and their mixtures to be ensiled, two nitrogen (applied as urea) fertilizations to barley, and three growth stages of crop harvest. Three replicates for each treatment were established. Barley (H. vulgare, cultivar Tecktoo, a hybrid genotype, hereafter referred to as H) and faba bean (Vicia faba var. minor, cultivar Vesuvio, an open pollinated genotype, hereafter referred to as V) biomasses were tested as 100:0, 75:25, 50:50, 25:75 and 0:100 barley:faba bean ratios. Ratios were obtained in terms of dry weights measured one day before ensiling. Tecktoo is a six-row hybrid, with a winter habit, and medium late cycle. We selected this genotype because it is exceptionally well performing in Central-North Italy and has an excellent silage quality. Barley was either unfertilized or fertilized with 140 kg N ha−1 (i.e., 304 kg urea ha−1), so that N fertilization was nested in the species ratio and produced a total of 9 biomasses (2 of sole barley, 6 of barley–faba bean mixture, and a sole faba bean). This N rate was chosen because in previous experiments in the same environment, we found that it was appropriate for forage production [24].
Pure forages were harvested at three growth stages, named early (4 May, when barley was in the milk stage (stage 75 of the BBCH scale for crops [41])), mid (28 May, at the beginning of the barley dough stage (BBCH 83])) and late (4 June, at the barley soft dough stage (BBCH 85)). At these dates, faba bean first had visible pods (BBCH 70), which were well developed even in the highest inflorescences (BBCH 76), and had pods with clearly distinguishable seeds (BBCH 79). Thus, the whole experiment consisted of 27 treatments and 3 factors.
The main soil physical and chemical properties were: 43.4% sand, 38.8% silt, 17.8% clay, pH 7.5 (1:2.5 soil:deionized water suspension), 21.1 g kg−1 organic matter (Walkley and Black method), 1.71 g kg−1 total N (Kjeldhal method), 6.6 mg kg−1 available P (Olsen method), and 128.1 mg kg−1 available K (ammonium acetate method).
On 16 January 2020, three adjacent plots of 400 m2 each were sown with faba bean, unfertilized barley and fertilized barley. The sowing rates were 400 viable seeds m−2 with 16 cm row spacing for both hybrid barley stands and 70 viable seed m−2 with 32 cm row spacing for the faba bean stand. Seeds were not inoculated with commercial inoculants because the soil had long previous faba bean cultivation history.
Phosphorus, as triple superphosphate, and potassium, as potassium sulphate, were applied before ploughing, at rates of 44 kg ha−1 of P and 83 kg ha−1 of K, both to faba bean and to barley, either N fertilized or not. The N fertilizer to barley, when foreseen by the experimental design, was applied as urea and split into 2 applications of 70 kg N ha−1 each at the beginning of the stem elongation (BBCH 30) and at the 2nd detectable node (BBCH 32), respectively.
Plants of three contiguous rows, 100 cm long, were manually cut approximately at 5 cm above the ground using a sickle and weighed on a field scale in microplots within each stand. Subsamples were then merged. DM was detected using a microwave oven and an electronic scale [42].
Then, faba bean and unfertilized and fertilized hybrid barley were chopped separately, using a forage chopper, to a length of approximately 4 cm, and then mixed using the cereal:legume ratios on a DM basis, as explained above. Herbages were then ensiled in 1 L glass jars, to a density of 140 kg DM m−3. Three replicates were performed for each forage ratio for a total of 81 jars. Once sealed with a screw top and plastic tape, jars were immediately weighed and stored in dark at 23.5 °C (min–max = 22–25 °C) for four months before opening. In addition, before ensiling, two additional subsamples of the fresh herbage for each replication were taken. One was immediately frozen for the determination of the WSC content; the other was oven-dried at 65 °C to constant weight for DM determination. Dried samples were ground to pass a 1 mm sieve and analyzed for chemical composition of herbages before the ensiling process. The ensiling process was conducted at the Department of Veterinary Science, University of Pisa.

2.2. Analyses and Variables Measured on Both the Herbage and the Silage

Once milled, dried herbage samples were analyzed to determine CP, ash (AS), ether extract (EE), neutral-detergent fiber (NDF), acid-detergent fiber (ADF) and acid-detergent lignin (ADL), according to [43]. Hemicellulose and cellulose contents were estimated as the difference between NDF and ADF and between ADF and ADL, respectively, while truly digestible non-fibrous carbohydrates (tdNFC) and total digestible nutrients (TDNs) were determined as recommended by National Research Council [44].
To estimate fiber quality, the relative feed value (RFV) was calculated. Such an index provides an estimation of the nutritional value of forage compared with a full bloom alfalfa which has RFV = 100. RFV is calculated from the estimates of dry matter intake (DMI) and digestible dry matter (DDM) as follows [45]:
RFV = (DMI × DDM)/1.29
where DMI (% of body weight) = 120/NDF% and DDM = 88.9 − (0.779 × ADF%).
The WSC content in frozen herbage samples was obtained using the Luff–Schoorl method, as proposed by the European Commission [46].
Just before opening for the silage analyses, jars were weighed in order to calculate the percentage loss of mass.
On the silage samples, the same analyses as used for the herbage samples were performed. In addition, the pH and the concentrations of lactic, acetic, propionic, butyric, isovaleric and valeric acids were also assessed in the silage samples. The pH values were detected immediately after opening the jars for the aqueous silage extract using a pH meter (Eutech instruments pH510, Thermo Fischer Scientific, Milan, Italy). The lactic and monocarboxylic acids (acetic, propionic and butyric) and isovaleric and valeric acids were determined by HPLC according to [47].

2.3. Computations and Statistical Analyses

The experimental design in the lab was a randomized block design with 3 factors: the stage of harvest, the ratios of faba bean and barley mixtures, and the N fertilization. However, such a design depends on the split design of the plant species. In addition, since the faba bean fertilized with N was not present, the experimental design was unbalanced. Both conditions were considered when analyzing the data. Data were analyzed with a general linear mixed model (Glimmix procedure in SAS/STAT 9.2 statistical package; SAS Institute Inc., Cary, NC, USA). The model used was designed for unbalanced designs and was similar to that shown in the supplementary material in [48], together with a description of the procedure and the SAS procedure applied.
In particular, the N fertilization was nested into the mixture ratio and the replicate in the plant species was added as a random factor. Additionally, a heterogeneous autoregressive covariance structure was applied to the time of sampling to take into account the repeated measurements, as applied in [49]. The dates of sampling were considered ordinal (i.e., first, second and third) without taking into account the variation of the growing degree days or time between each pair of data, since the biomass traits (and especially the dry matter content) strongly varied among the sampling moments, and 3 temporal moments do not allow one to correct for the temporal structure of the design. Thus, the heterogeneous autoregressive covariance structure was applied to the sampling only for the purpose of correcting the LSmeans, as is further explained.
The main factors analyzed were stage of harvest (SH) (early, mid and late), mixtures (MX) (barley–faba bean 100:0, i.e., sole barley; 75:25; 50:50; 25:75, and 0:100, i.e., sole faba bean) and N fertilization (NF) (N 0 and N 140 only to barley, so that NF was nested into the MX). Interactions among factors were assayed. Such an analysis was applied using unbiased estimates of variance and covariance parameters assessed by restricted maximum likelihood (REML). The denominator degrees of freedom of each error were estimated by the Kenward–Roger approximation (according to which, null covariance parameters do not contribute to the degrees of freedom of the model) and interaction specific error terms were applied to the highest order interaction, i.e., on the SH × NF.
The least square means (LSMEANS) of the treatment distributions were computed. Differences among LSMEANS were compared by applying Tukey–Kramer grouping at the 5% probability level to the LSMEANS p-differences. When the denominator degrees of freedom were not constant and in the presence of heteroscedasticity, the “ADJDFE = ROW” statement was used to adjust for multiple comparisons. The analysis was performed on the herbage and silage traits and on the relative (as a percentage change) and absolute variations of common traits from herbage to silage. The means of herbage and silage traits and absolute and relative variations from herbage to silage were provided in Supplementary Materials Table S1, along with the standard error, and Supplementary File S1.
The mean effect of treatments on the biomass traits (as herbage and silage) were also studied through a canonical discriminant analysis (CDA, Candisc procedure in SAS/STAT 9.2). To do so, the correlation between each trait pair was determined by means of the CORR procedure in SAS/STAT 9.2. To select the variables to be included in the CDA, when two or more variables were highly correlated (|r| > 0.70), one was discarded to avoid element weighting distortion, as suggested by [50]. Data included in the CDA were standardized (mean equal to 0 and standard deviation equal to 1) before analysis to avoid a distortion of the analyses by the variable ranges and units of measurements. Standardized raw data were used as vectors to determine among-treatment variation. Treatments on the CDA were separated by computing the probability that their distance on the hyperspace composed by only the canonical axes was higher than the Mahalanobis distance at a p < 0.05. Total sample size, variables and classes were 80, 16, and 27, respectively. NDF = 16; DDF = 38.

3. Results

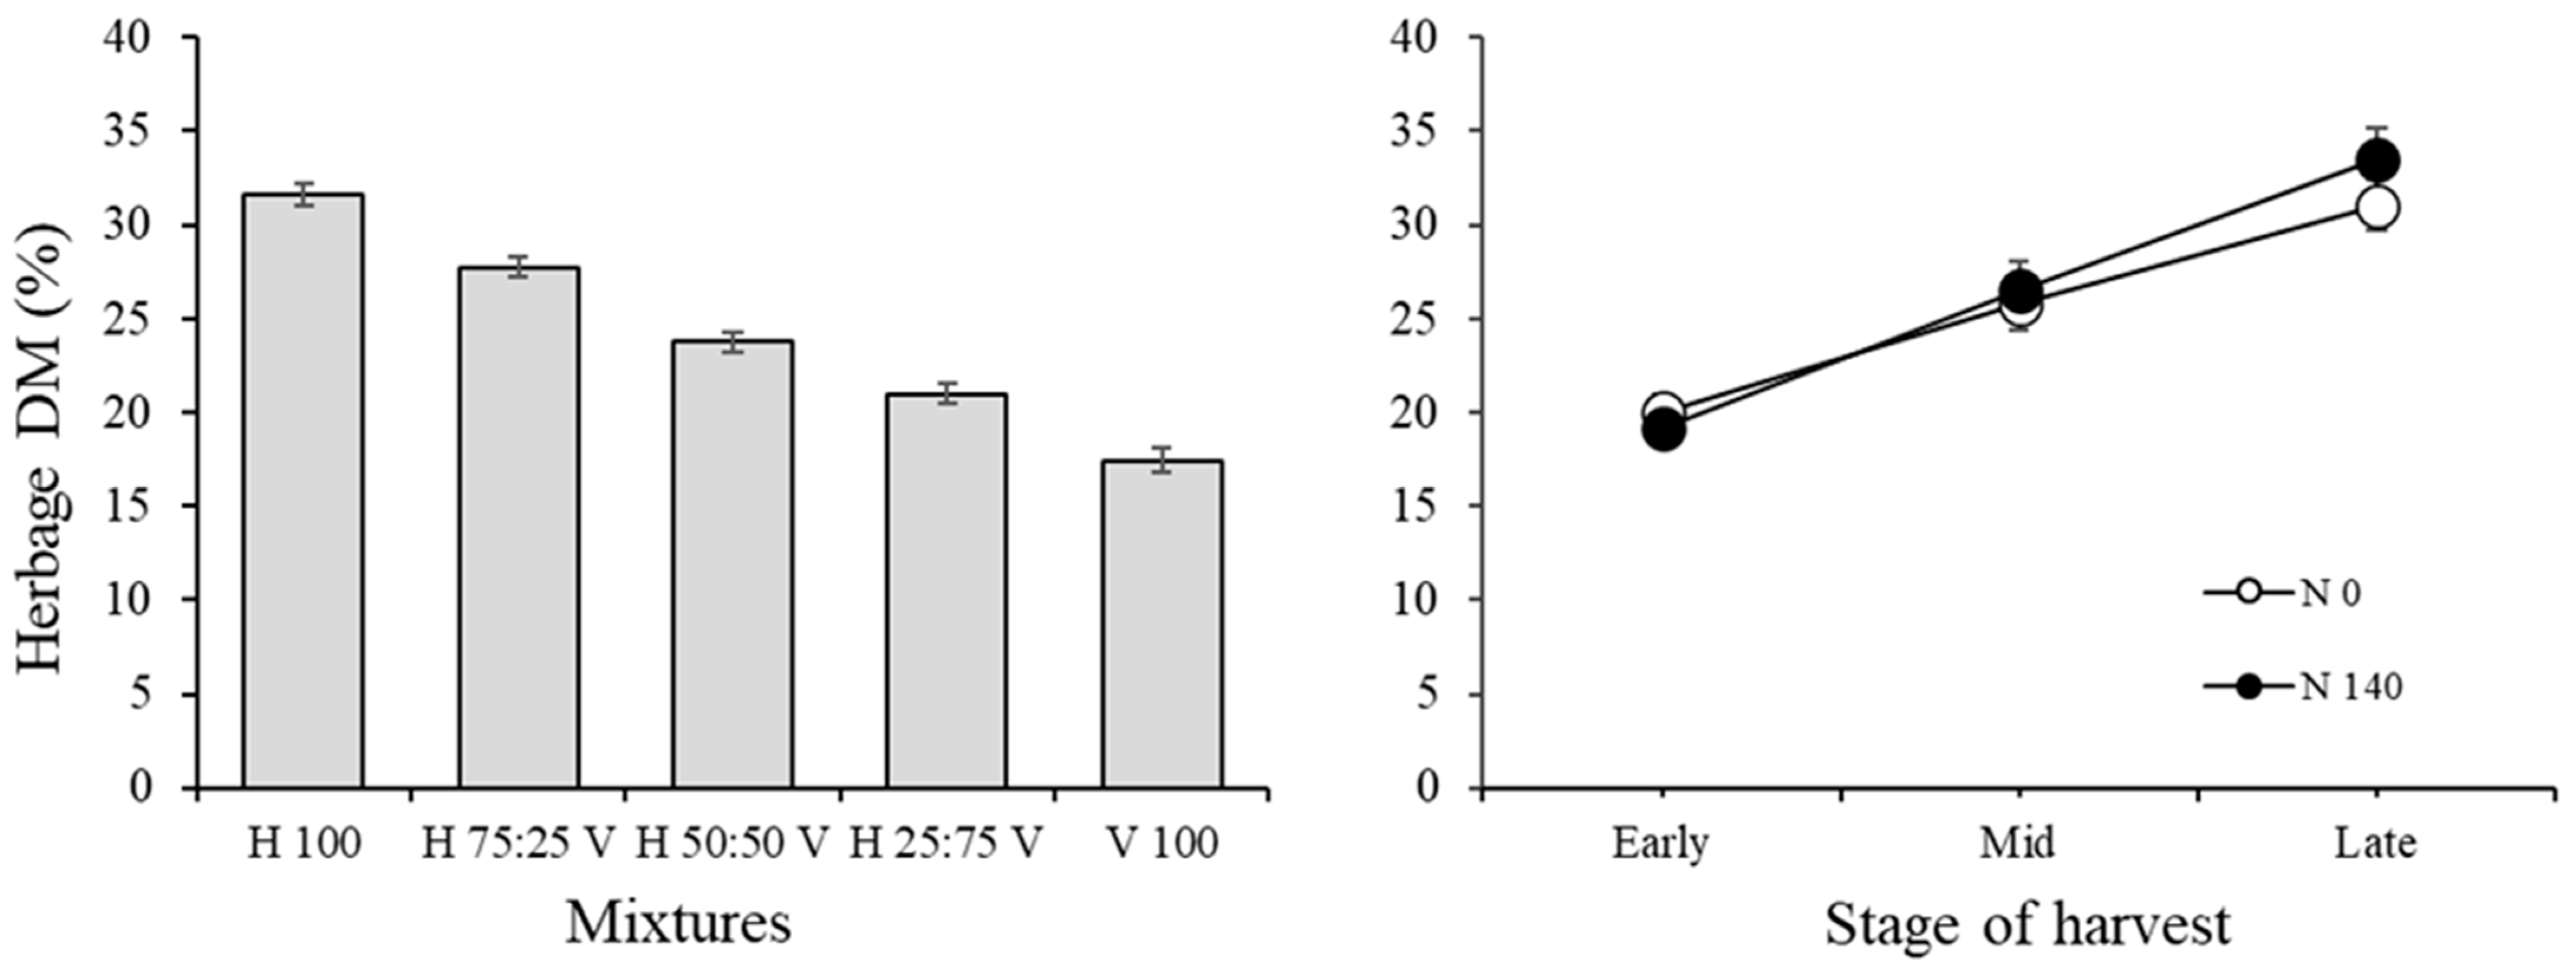
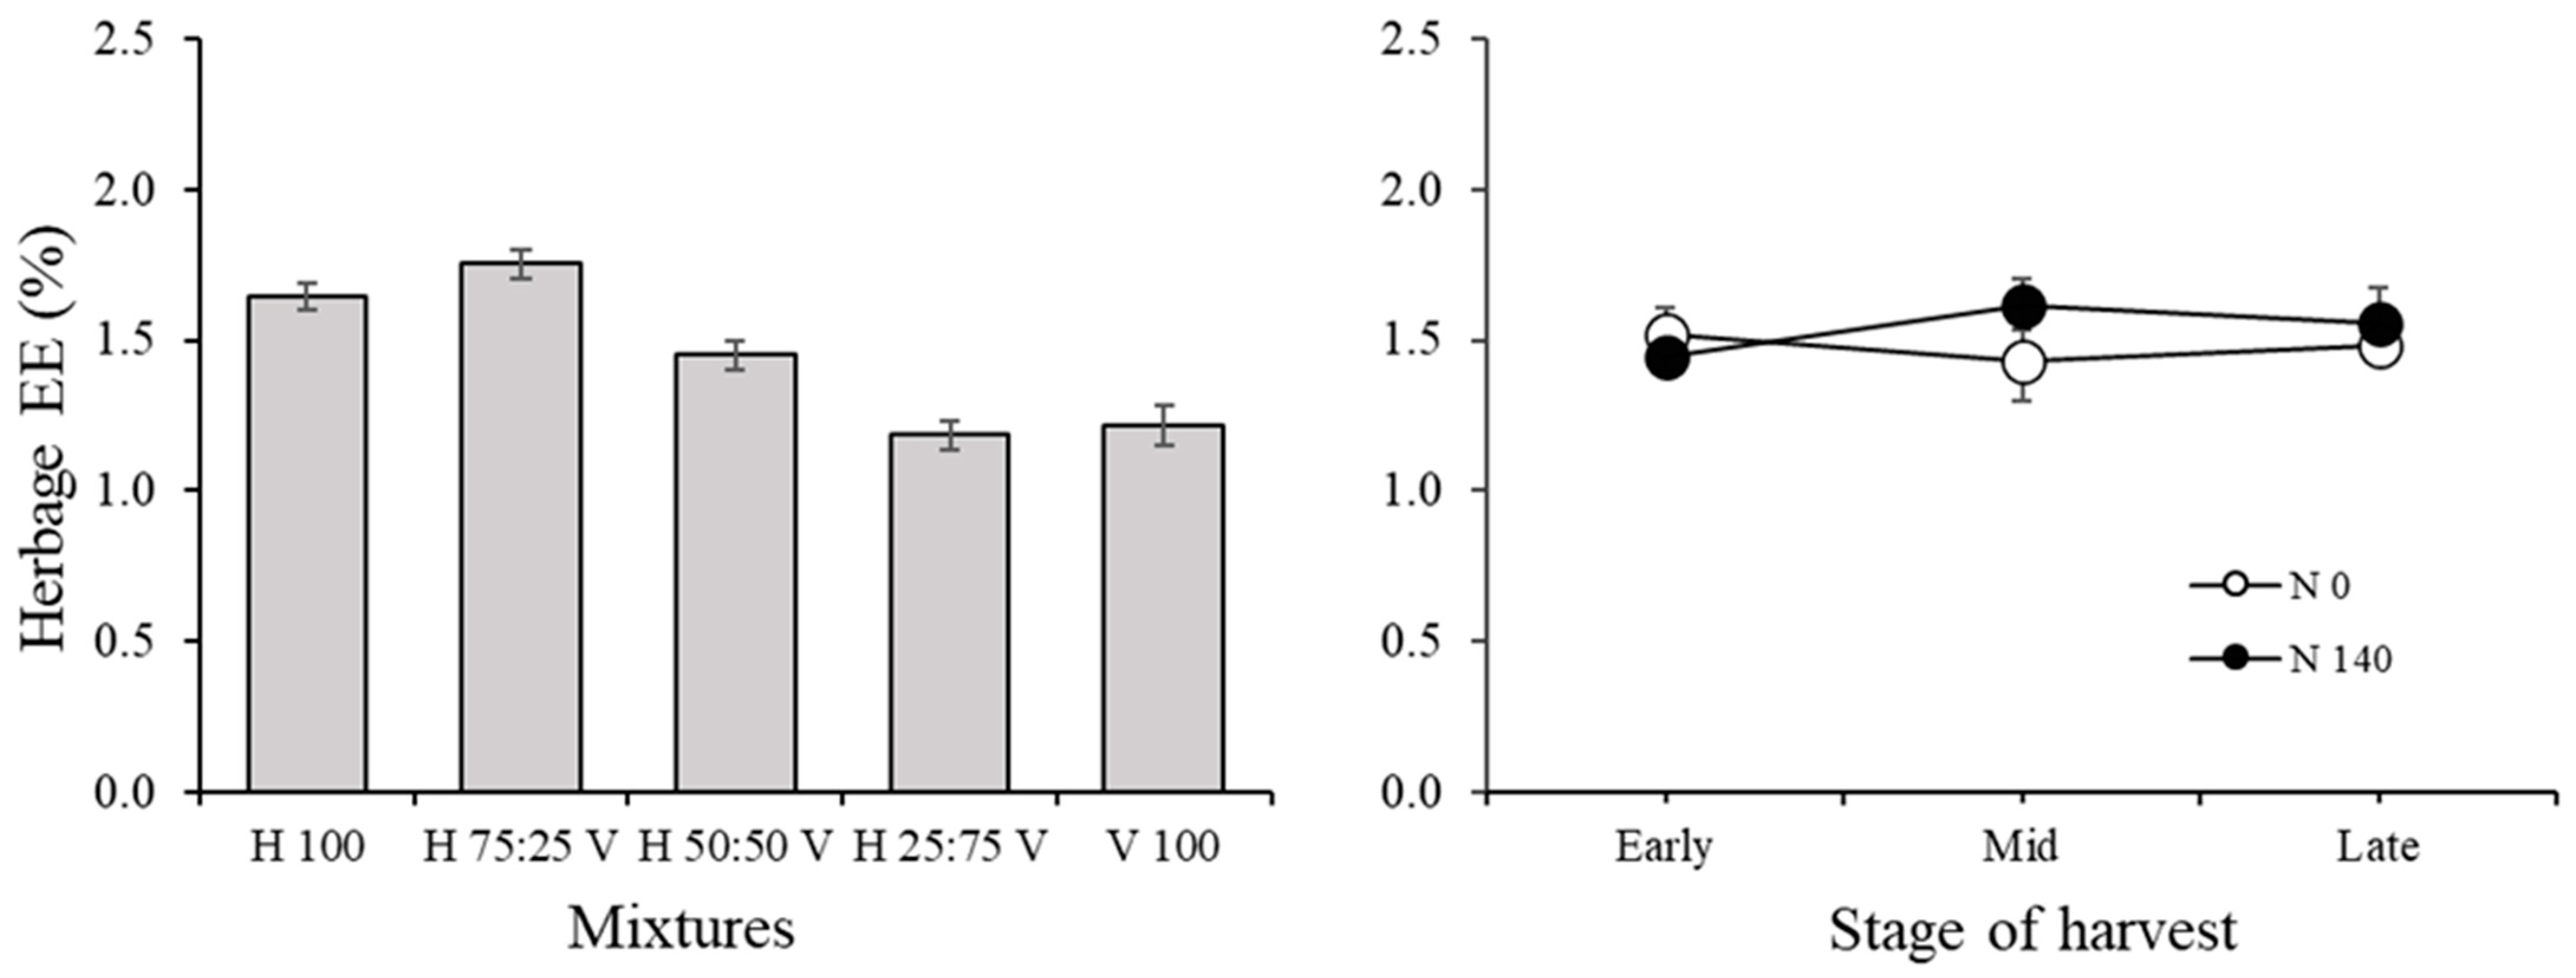
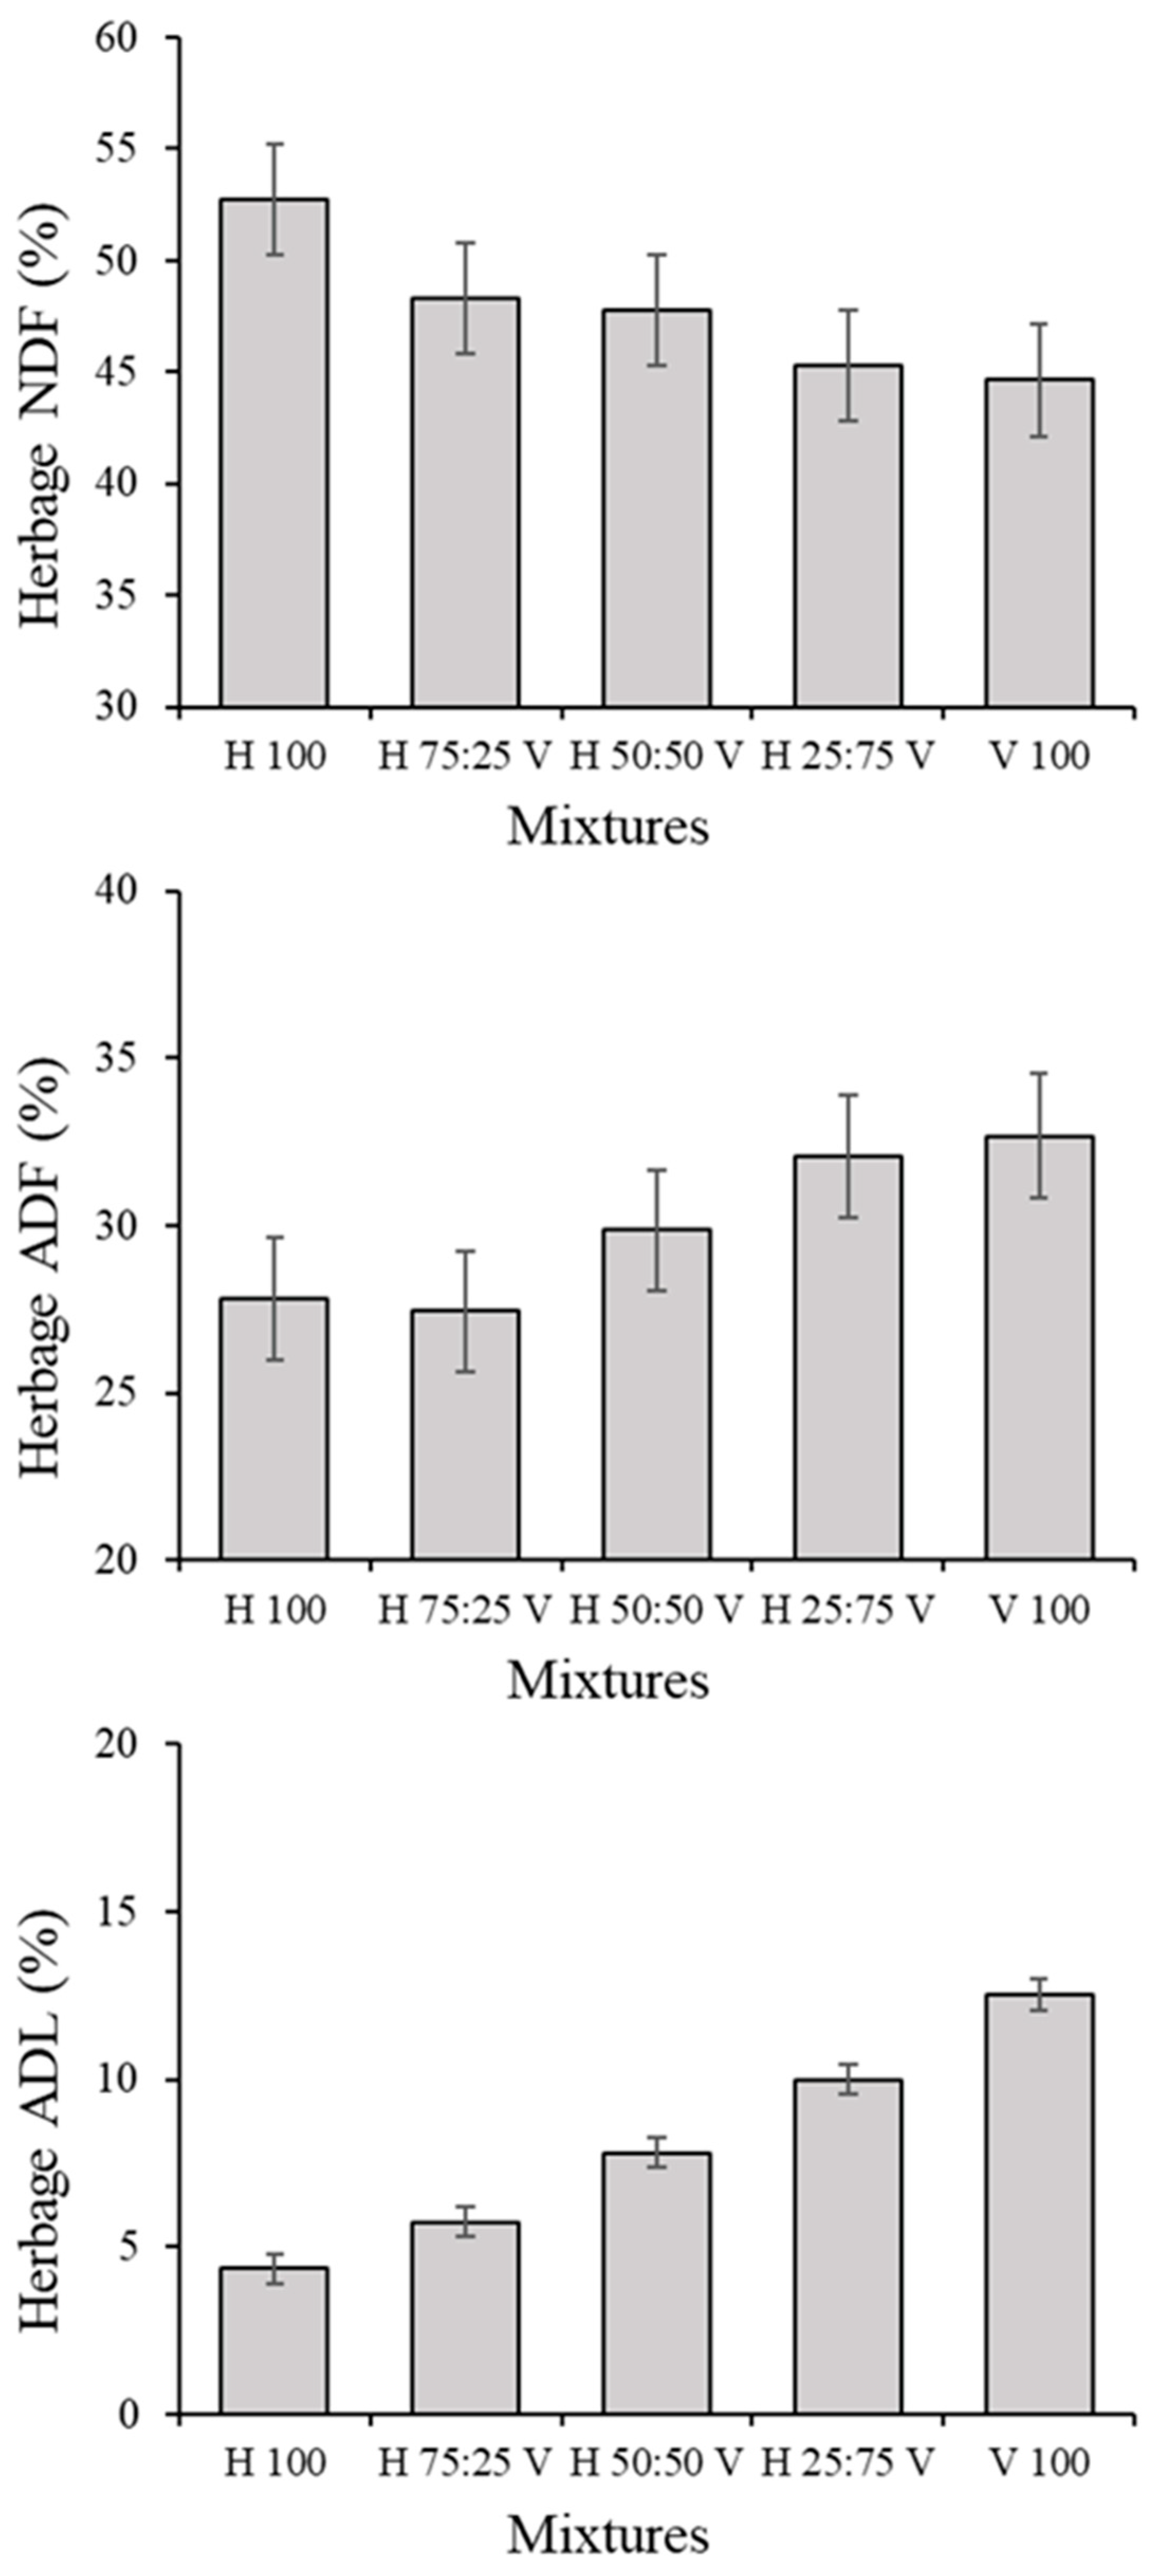
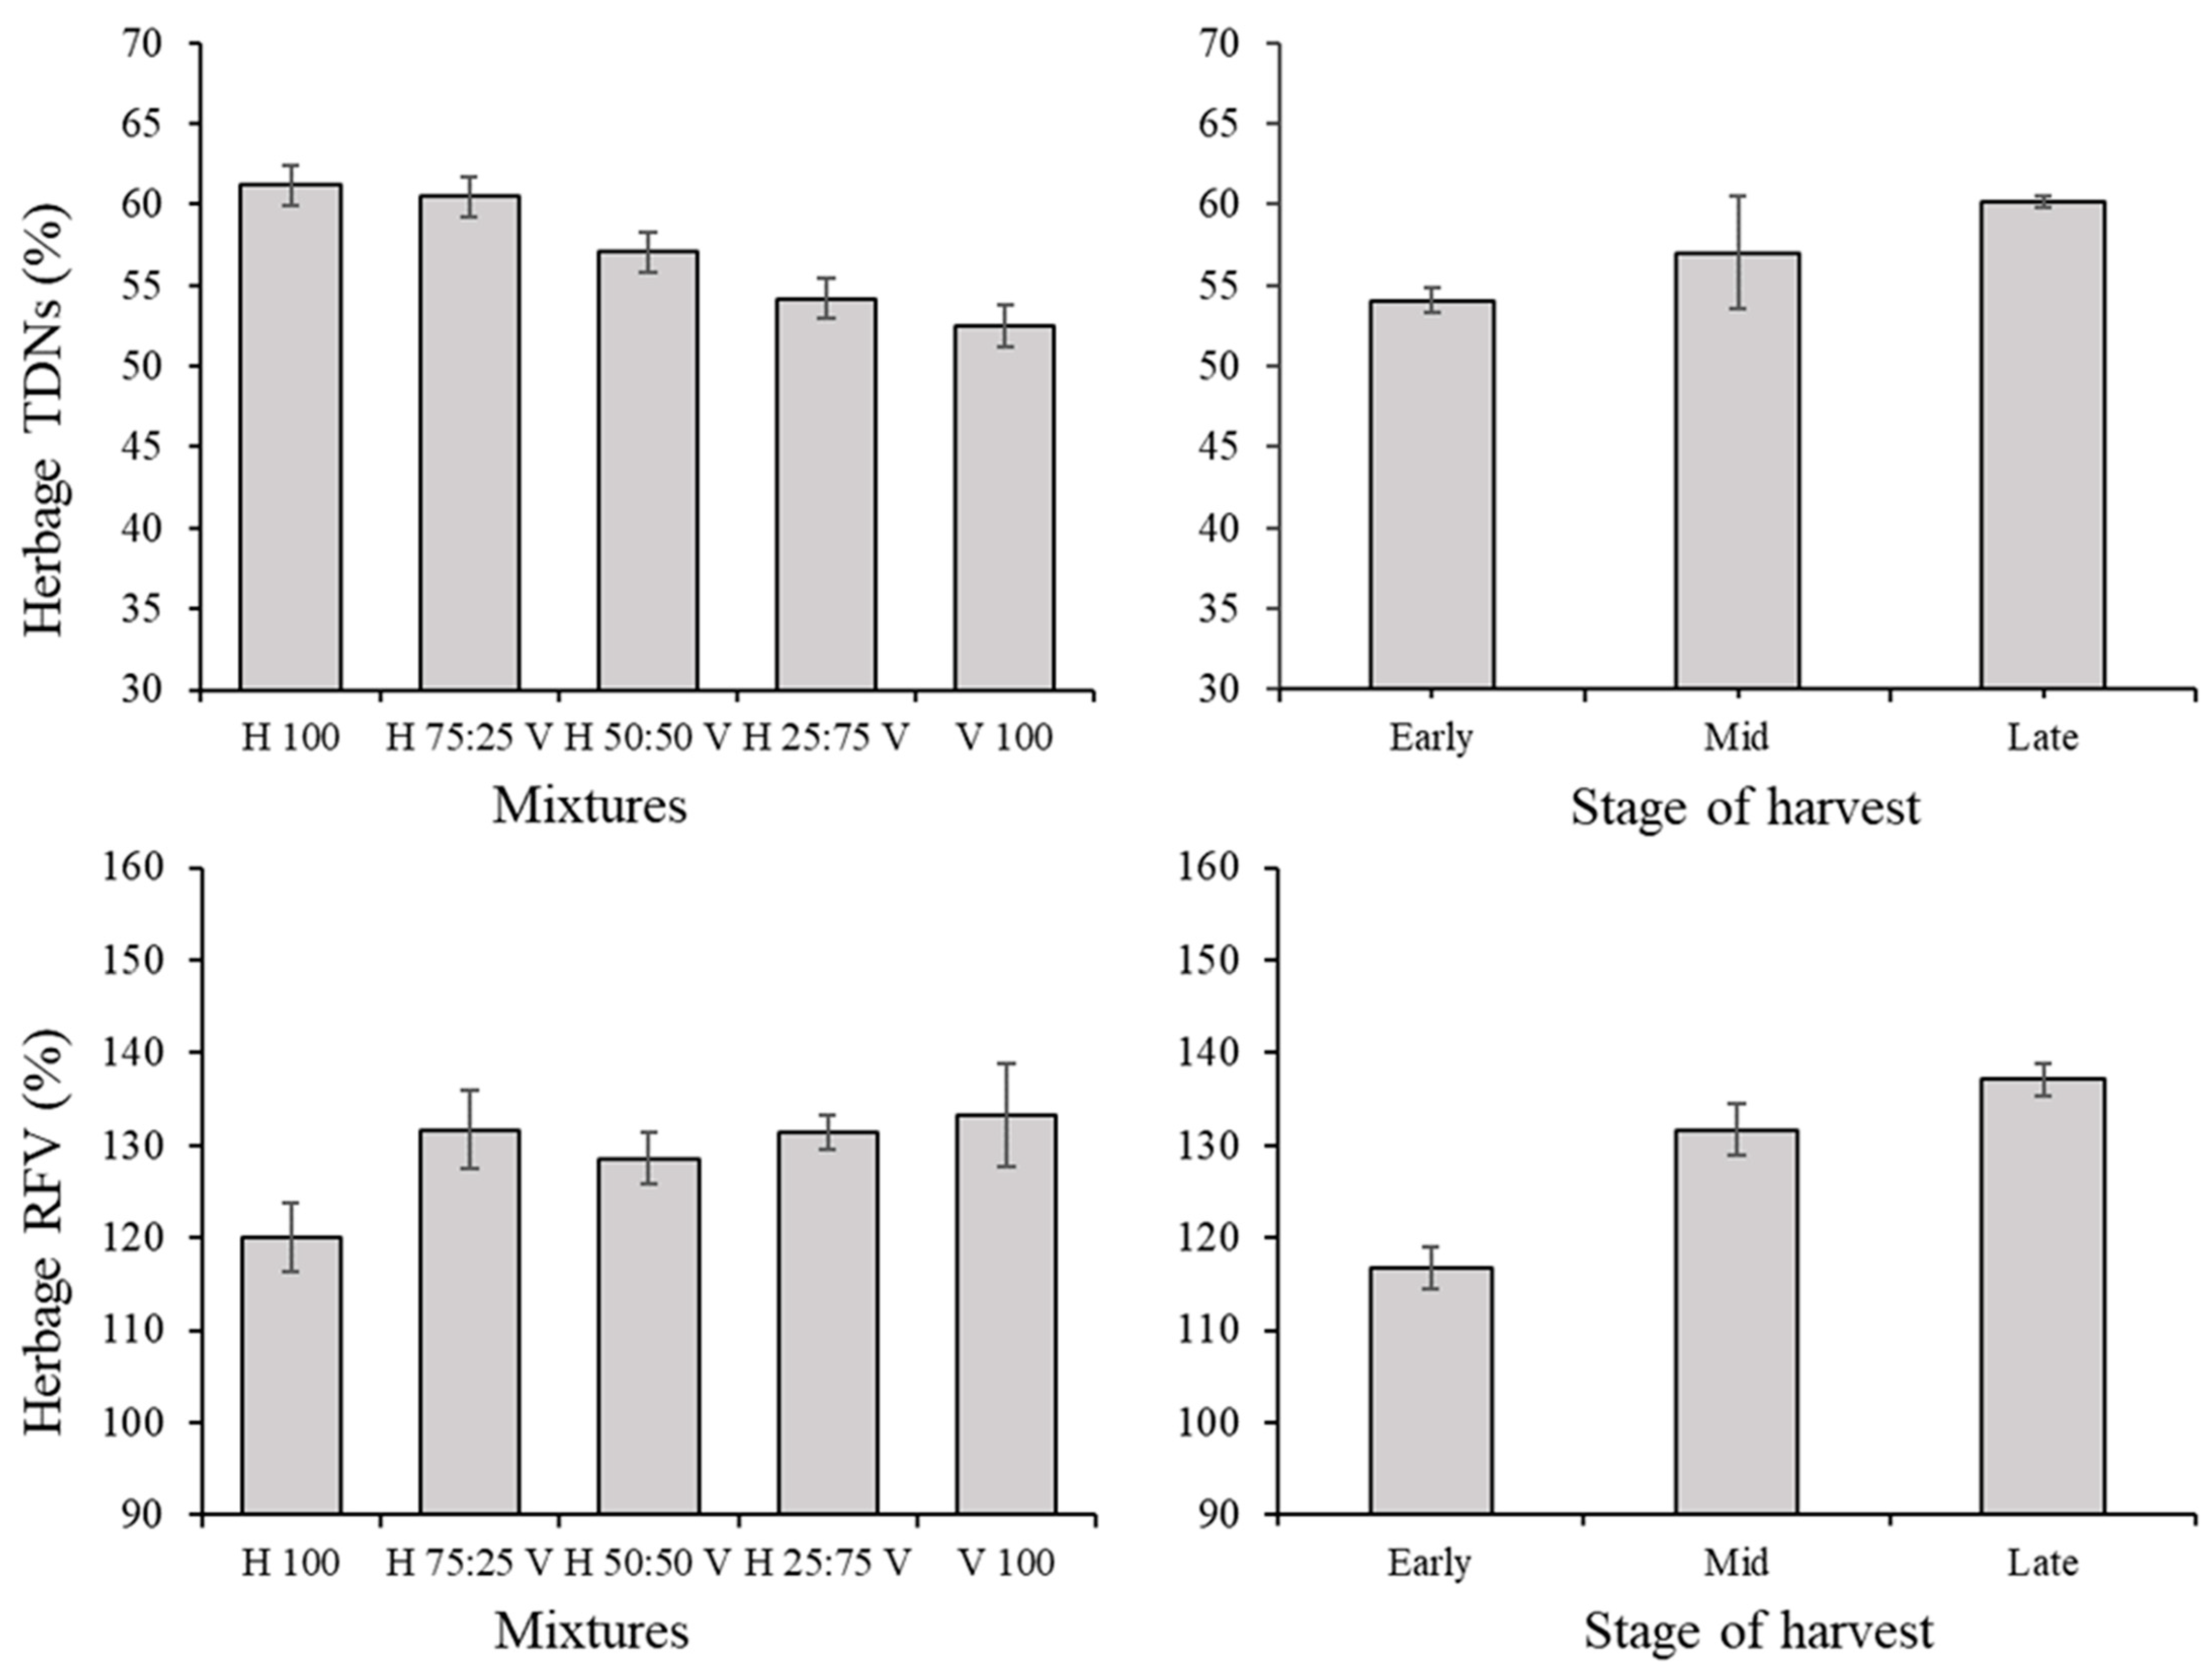
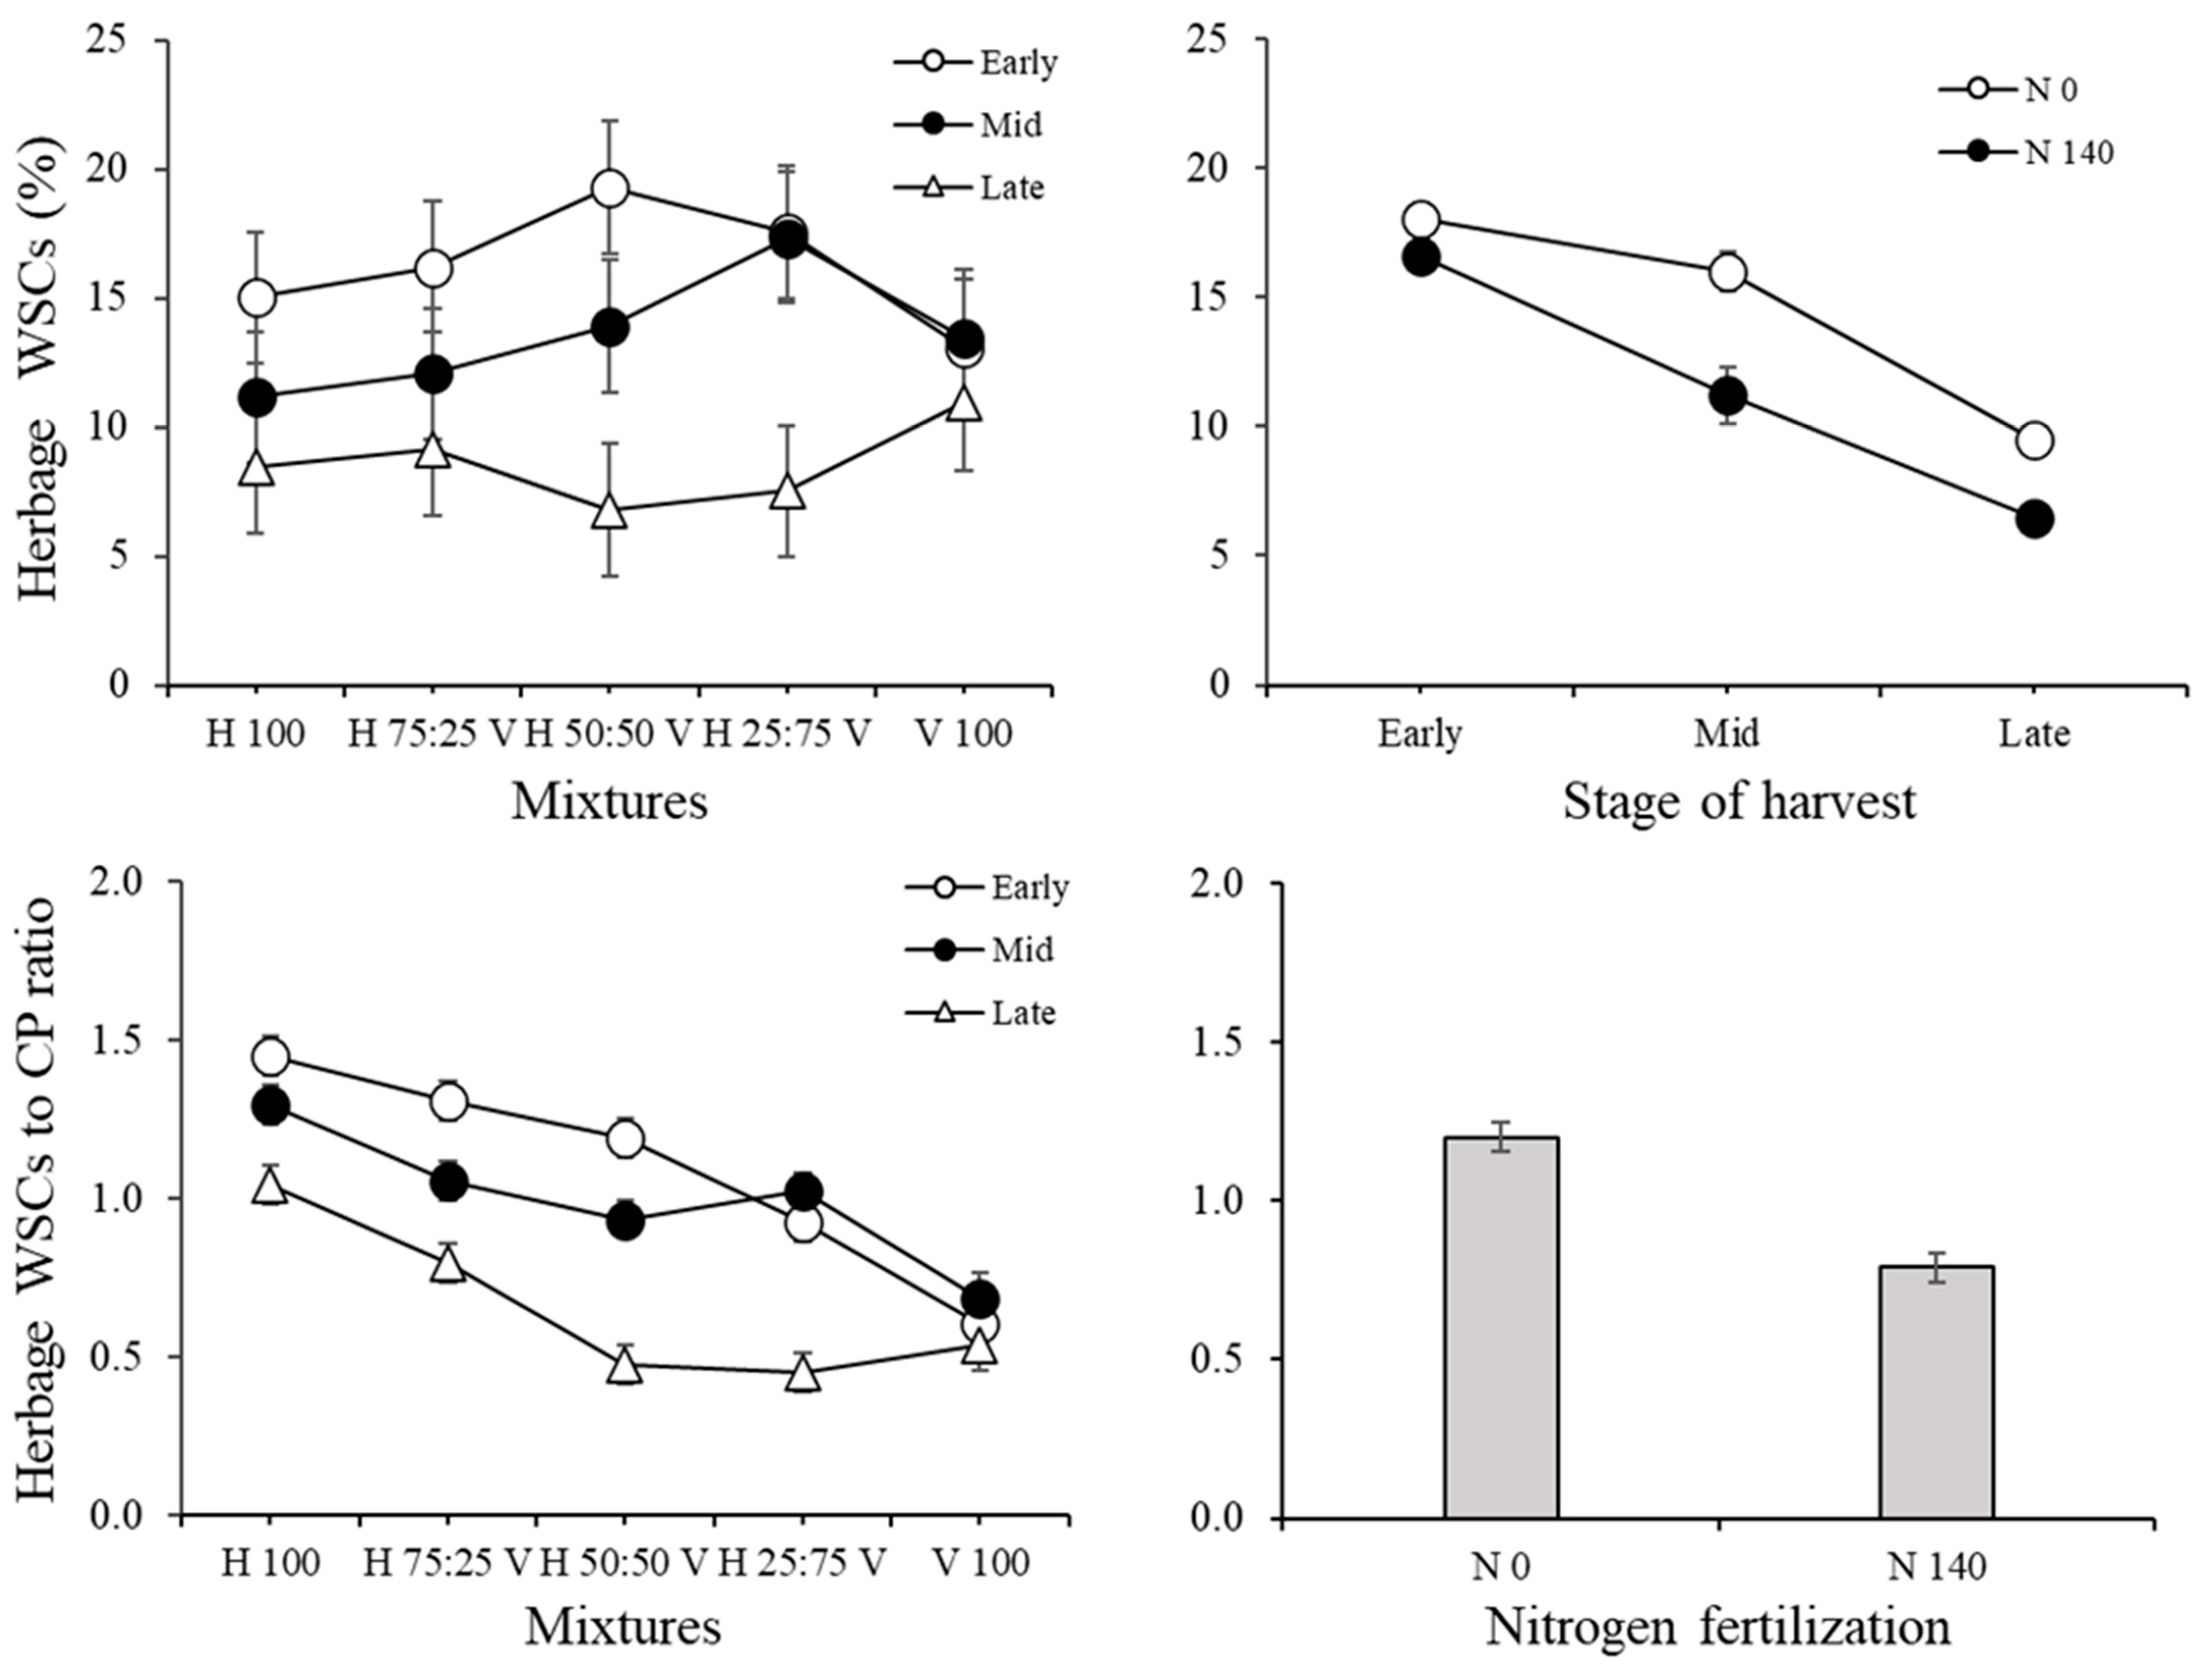
3.1. Herbage Traits and Correlations among Variables in the Herbage

The effects of the treatments applied on the herbage traits were strong and mostly seen for the SH × MX interaction (Table 1, as the SH × MX interaction usually showed higher F than SH × NF).
As expected, the mixtures showed the mean DM concentration depending on the barley to faba bean ratio (Figure 1). Pure barley showed a higher DM (31.6%) compared to sole faba bean (17.5%) and, on average, the value decreased by 3.5% points in absolute value when increasing the amount of legume and reducing the amount of cereal between one treatment and the following (Figure 1; see also Supplementary Material Figure S1A for the interaction of treatments). DM concentration was also affected by the SH × NF interaction: the DM of both the fertilized and unfertilized treatments increased with the stage of harvest, although the increase was higher with N140 (+14%) than with N0 (+11%).
As shown in Figure 2, the CP concentration increased progressively with the increase in faba bean from about 9% of the barley to about 21% of legume (see also Supplementary Material Figure S1B for the interaction of treatments). Moreover, it was higher in the early (16%) stage than in the mid and late stages of harvest (about 14%).
Nitrogen fertilizer, in the treatments where it was distributed, increased the CP concentration of the herbage from 12.9% for the unfertilized treatment to 14.2% for the fertilized one, with other treatments being around the mean value (data not shown).
Barley showed from 0.3% to 0.6% more EE than faba bean (Figure 3; see also Supplementary Material Figure S1C, and Supplementary Material Figure S2 for the interaction of treatments). However, in contrast to the DM and CP concentrations, its content in the mixtures was less clearly related to the plant fraction. EE appeared to increase slightly with the stage of harvest, although only with nitrogen fertilization.
Ash concentration (Figure 4; see also Supplementary Material Figure S1D for the interaction of treatments) resulted higher in faba bean and was reduced as the cereal fraction increased in the mixture. Its concentration varied also as a consequence of the SH × NF interaction. Indeed, crop ripening reduced ash concentration, especially in presence of the N fertilization. From early to late SH, the ash concentration of the fertilized and the unfertilized treatments decreased by 23% and 11%, respectively.
In Figure 5, the mean effects of MX over NDF, ADF and ADL concentrations in the herbage are illustrated (see Supplementary Material Figures S3–S5 for the treatments interaction). The highest NDF concentration value was recorded with the pure barley (57.7%) and as the faba bean fraction increased, the mixtures’ values gradually decreased. Compared to the pure legume, it showed 15.4% less NDF. By contrast, the ADF concentration was lower in the pure barley (27.8%) and increased adding the faba bean to the mixture. The pure faba bean showed 15% more ADF than pure cereal. ADL followed the same trend showed by ADF and ranged from 4.4% of pure barley to 12.5% of pure faba bean. Notably, both ADL and ADF strongly correlated with dry matter concentration (R = −0.78 and R = −0.73, respectively) and ADL also correlated with CP (R = +0.88, Supplementary Material Table S2).
The TDN concentration and RFV of the herbage are shown in Figure 6 and Supplementary Material Figures S6 and S7. Both variables were affected by MX and SH. The highest TDN values were recorded when the cereal fraction was higher and depleted by increasing the faba bean amount. Values ranged from 61.2% of the pure barley to 52.5% of the legume. SH affected TDN concentration, increasing it by 11.3% from the early to the late stage (61.2.%). Concerning the mean effect of the mixture, the RFV showed an inverse trend when compared to TDNs and the pure faba bean showed 13.3% more than the sole barley (120%). By contrast, the mean effect of SH on the RFV increased it (+17.4%) from the early (116.8%) to the late stage.
The WSC concentration and the WSC to CP ratio are shown in Figure 7 and Supplementary Material Figures S8 and S9. The WSC concentration was influenced by both the SH × MX and SH × NF interactions. In the first case, the highest WSC value, 19.3%, was observed with the H50:50V mixture from plants harvested in the early stage. In this phase, pure barley showed a content of WSCs of 15%, whereas pure field bean reached 13.1%. With the ageing of crops, pure barley recorded, on average, a drop in WSCs equal to 24% between one stage and the next. By contrast, sole faba bean showed a slighter decrease, equal to 15%, only in the late phase. Concerning the SH × NF interaction, the variable decreased with the progress of the harvesting stage but in a more evident way in the presence of N fertilization. In fact, while in the early stage, the difference in WSCs between fertilized and non-fertilized herbages was at least 7.9%; in the mid and late phases it increased to 30% and 31.5%, respectively.
The herbage WSC to CP ratio was affected by SH × MX and NF. Ratio reductions were enhanced by increasing the faba bean fraction in mixture, even if an unclear trend was shown in the mid stage in correspondence to H25:75V. Moreover, the ageing of plants depleted the WSC to CP ratio in mixtures where hybrid barley was included, while no particular reduction effects were reported in the case of pure faba bean. Concerning the fertilization, it decreased the ratio value by 34.1% on average.
The tdNFC concentration in the herbage was lower in the pure barley (30.8%), while no particular differences were revealed between the other treatments (34% as mean value) (Supplementary Material Figure S10).
The hemicellulose concentration was markedly higher in barley compared to faba bean (+15.6%, +13.5%, and +8.9% in the early, mid and late harvests, respectively; Supplementary Figure S11), with differences among mixtures reflecting the fraction of barley in the mixture, but with no effect of the fertilization. Similar results were found for the cellulose concentration in the early harvest, which conversely did not differ among treatments in the mid and late samplings (Supplementary Figure S12).

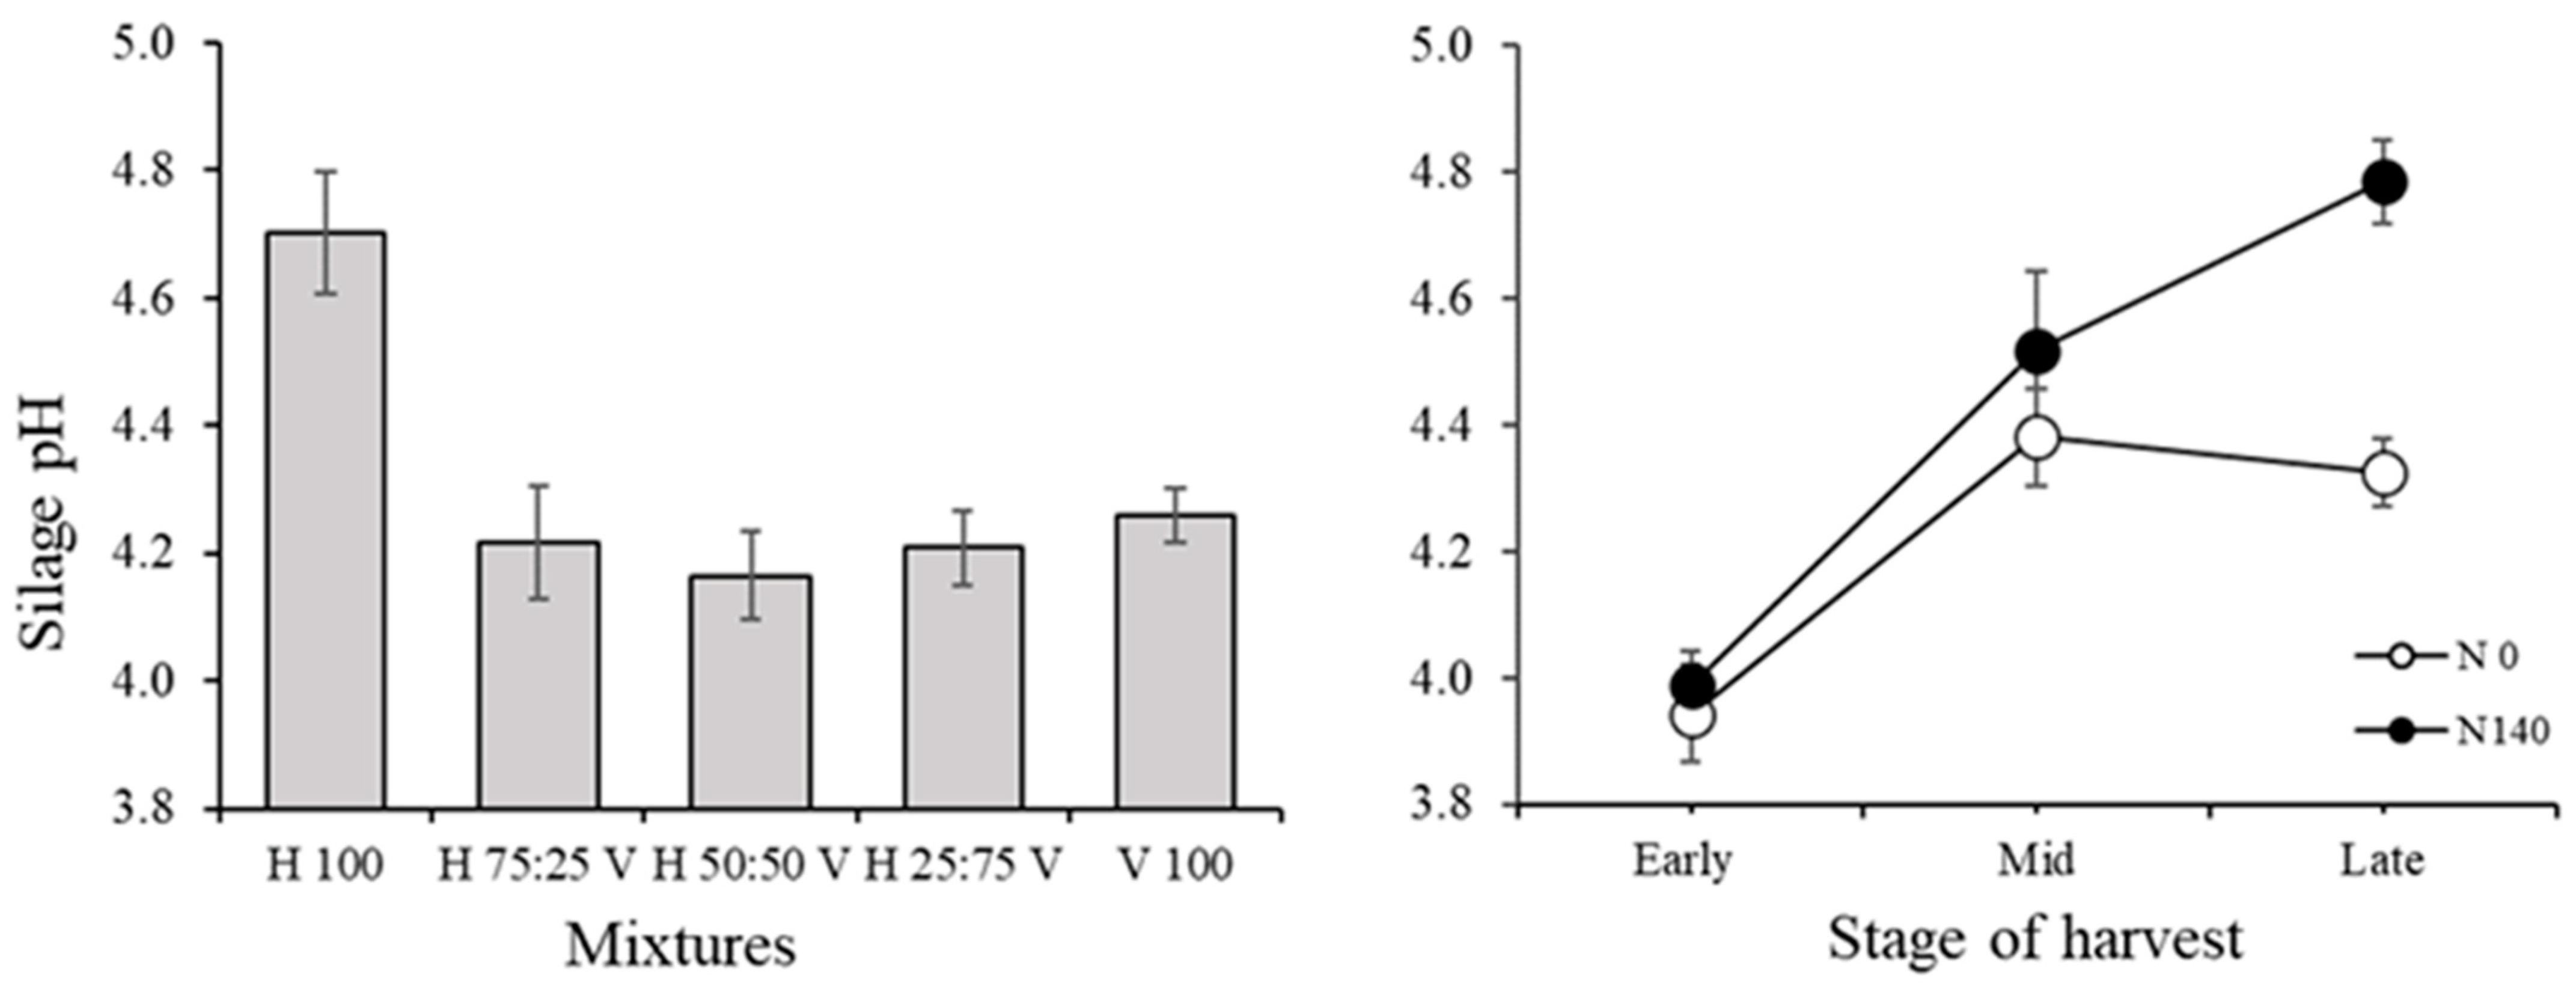
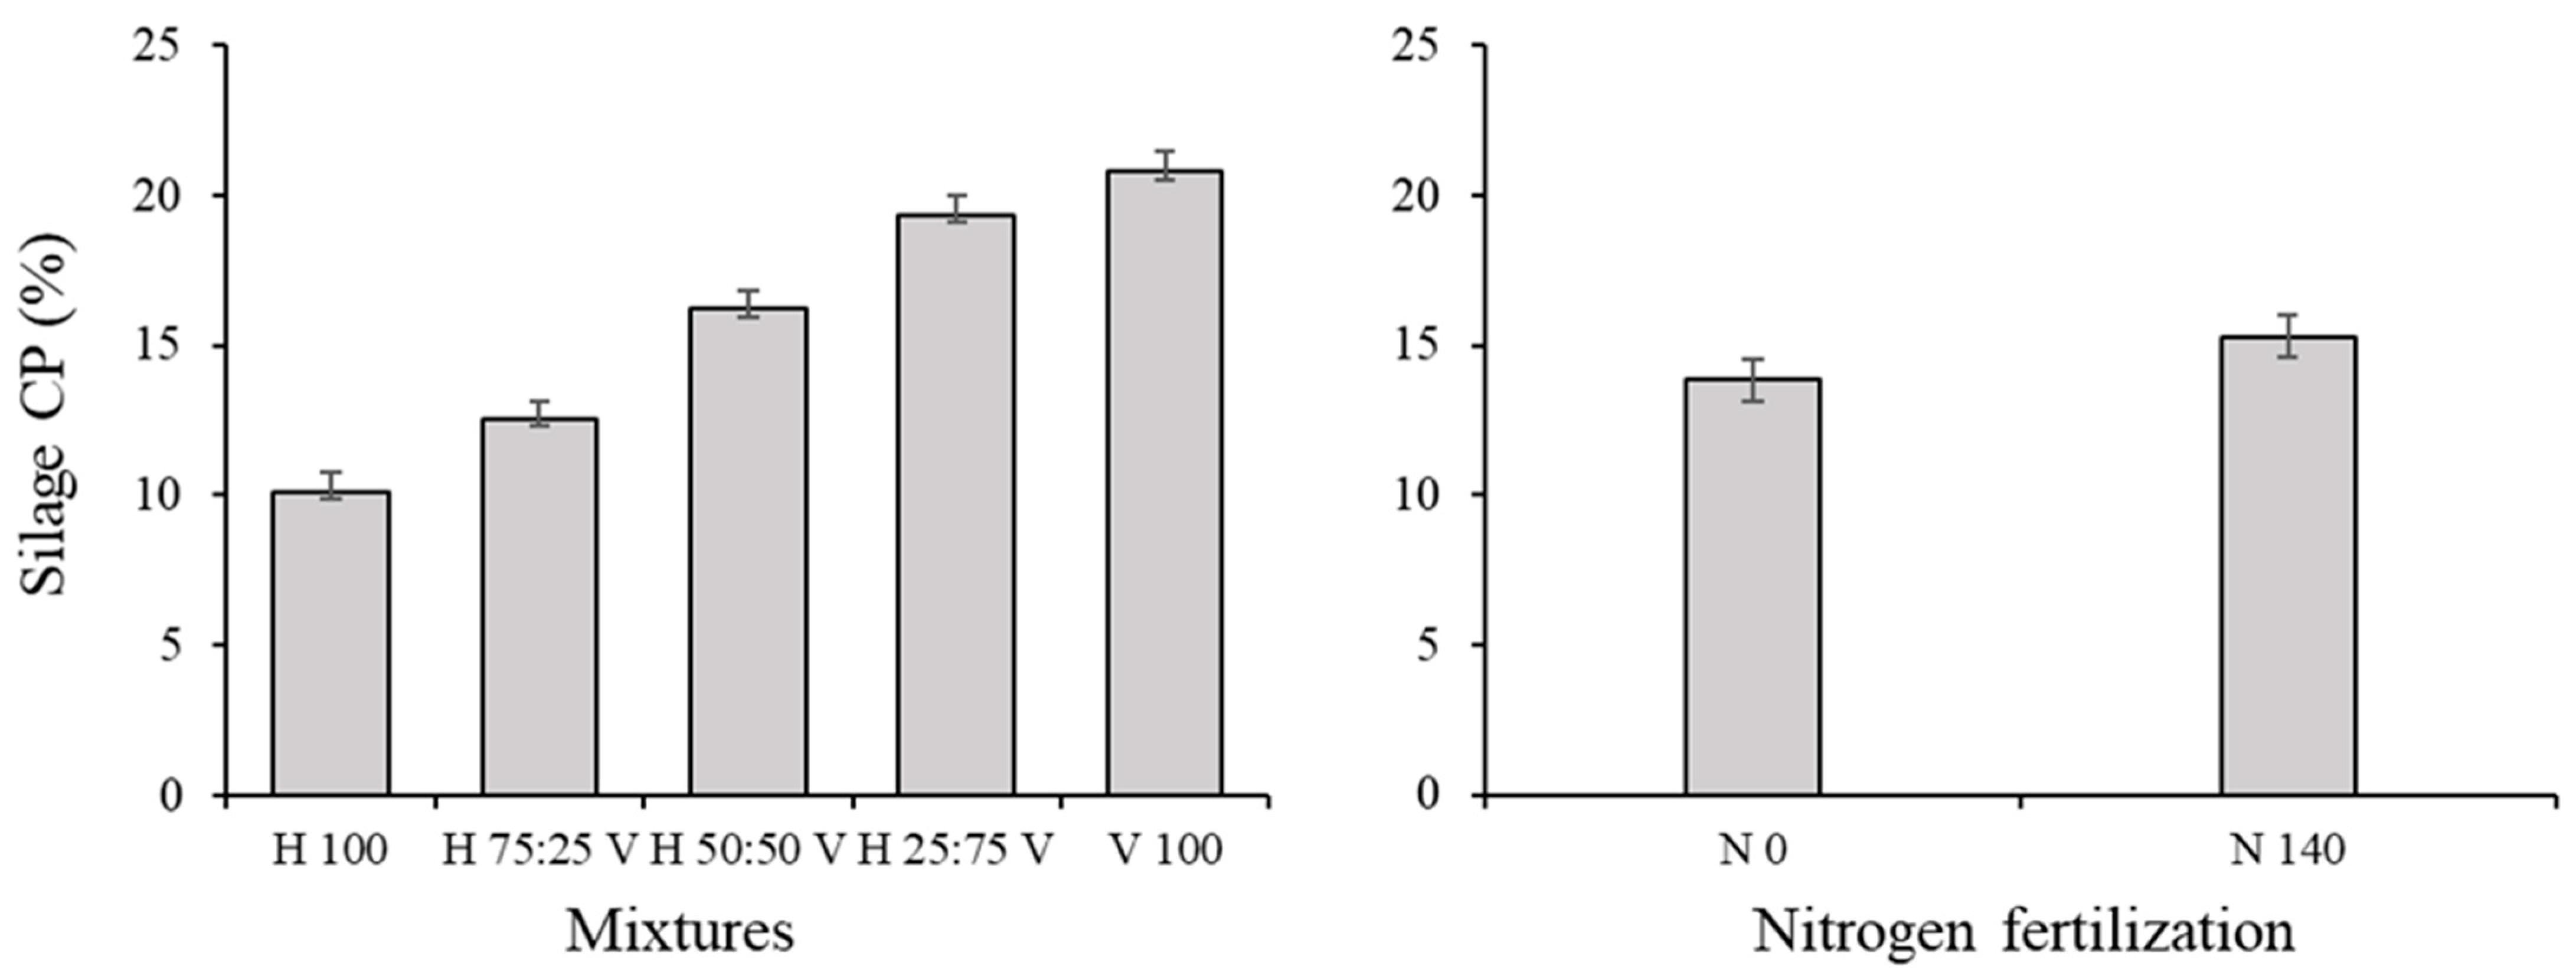
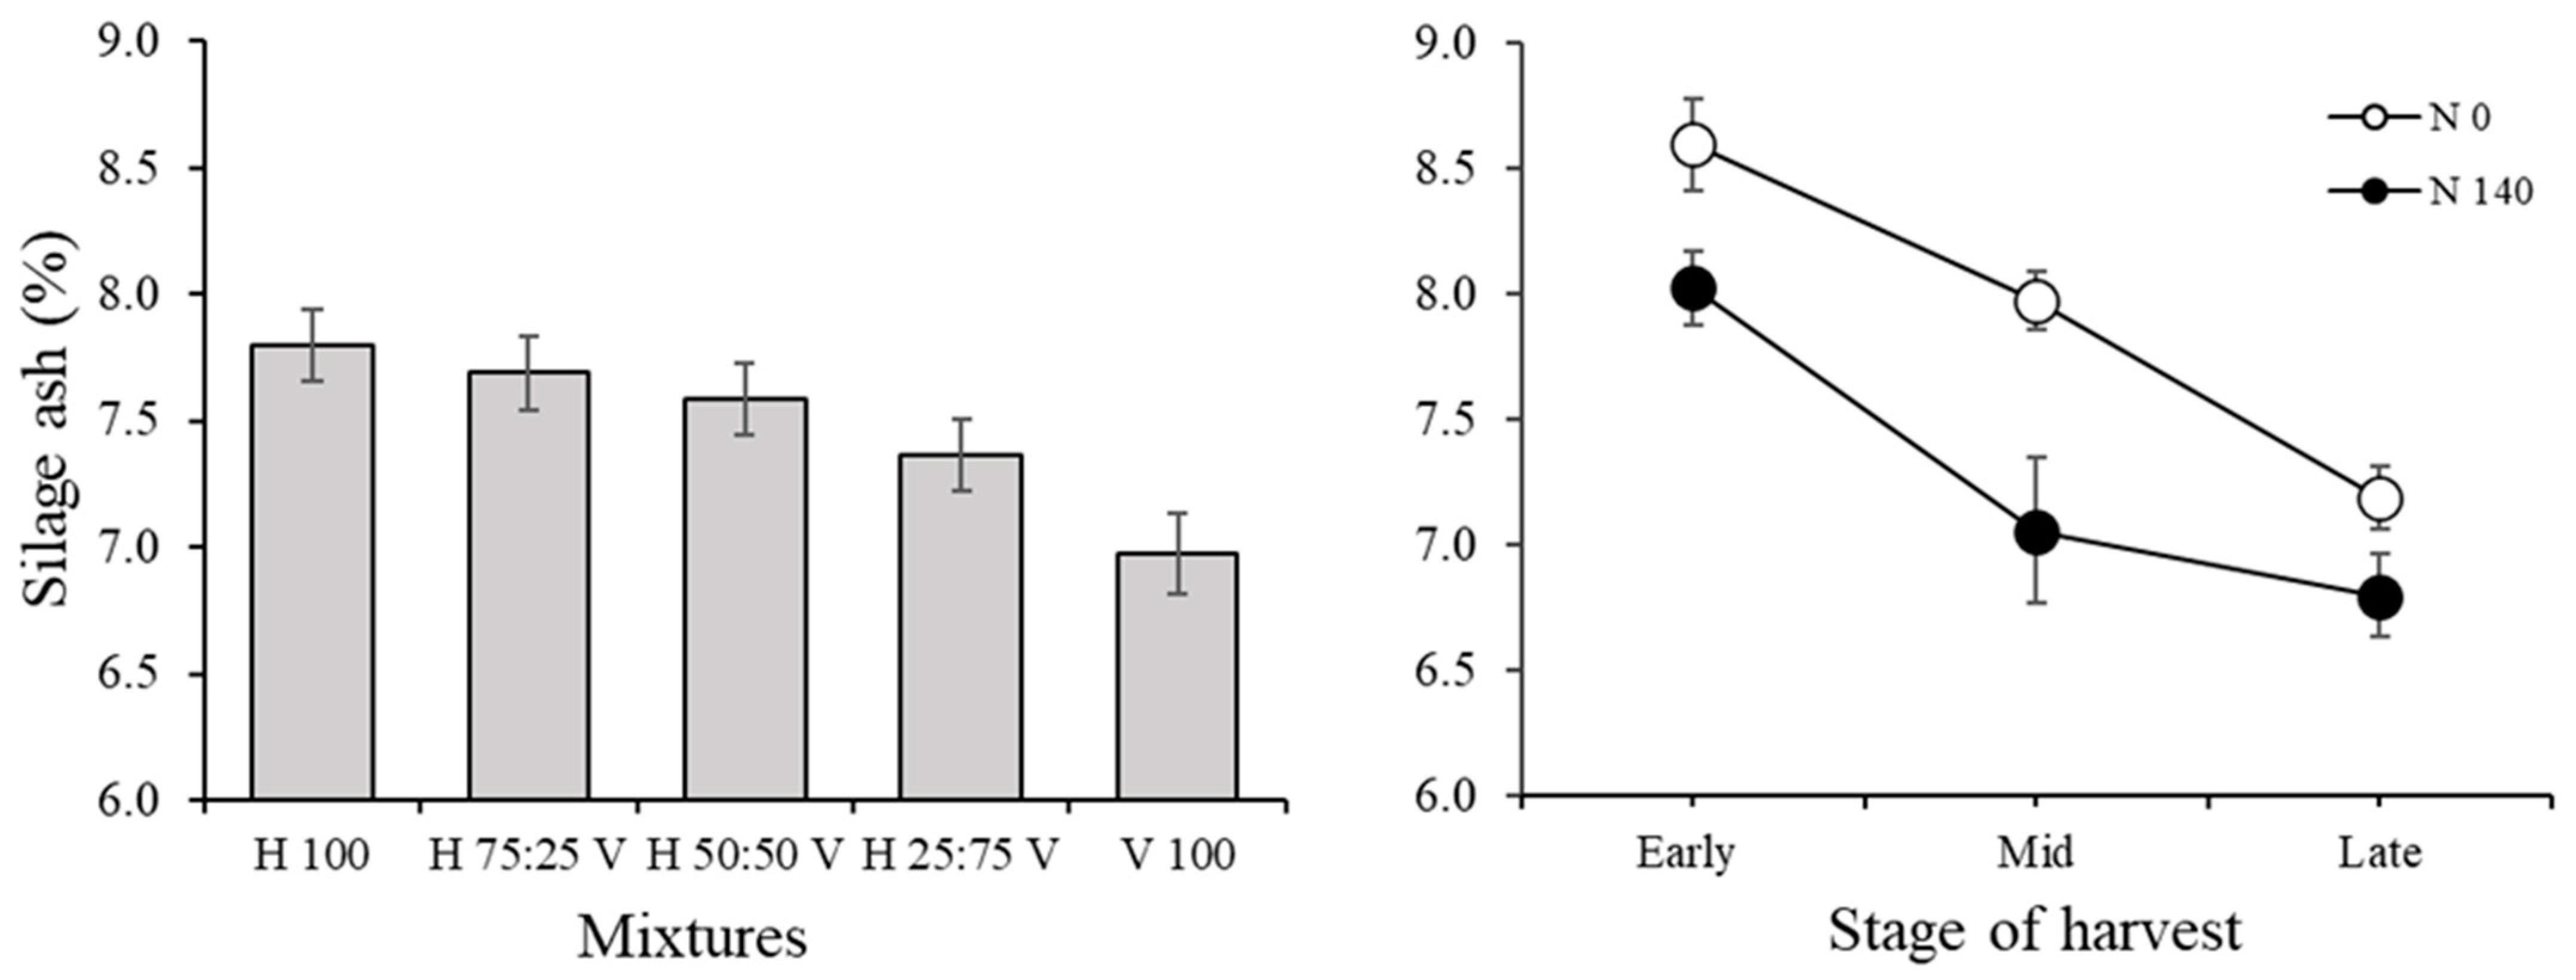
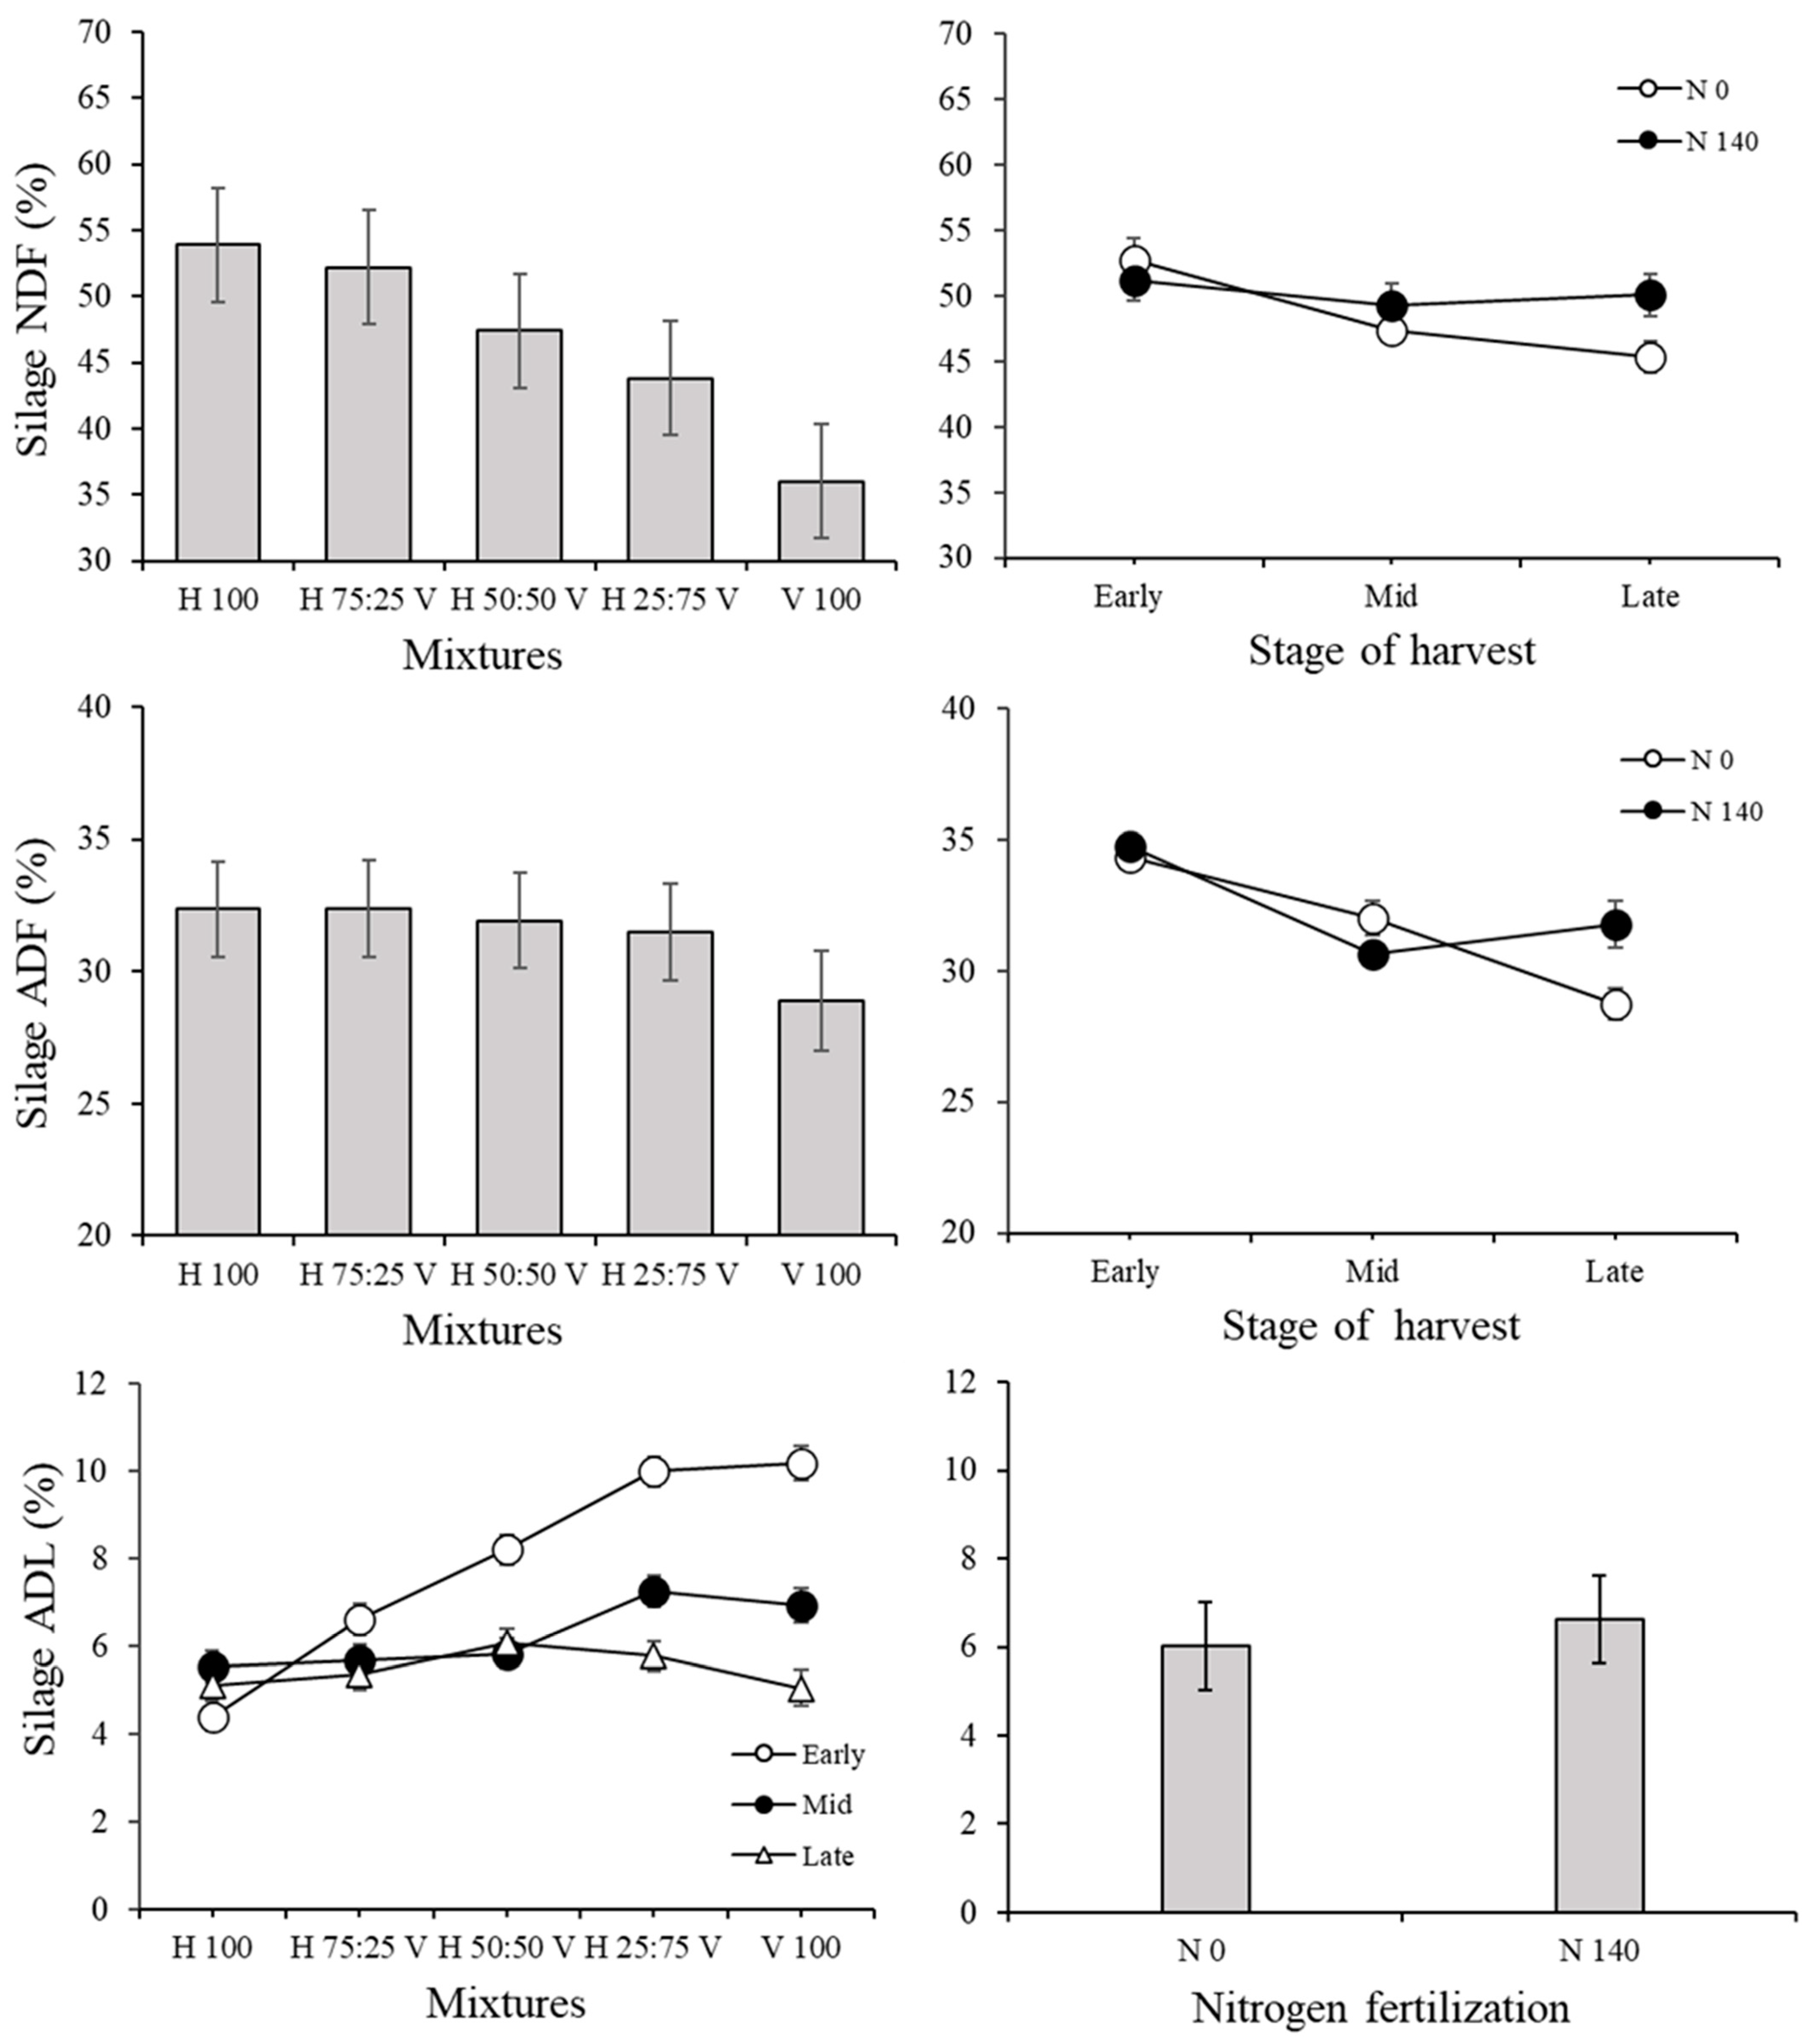
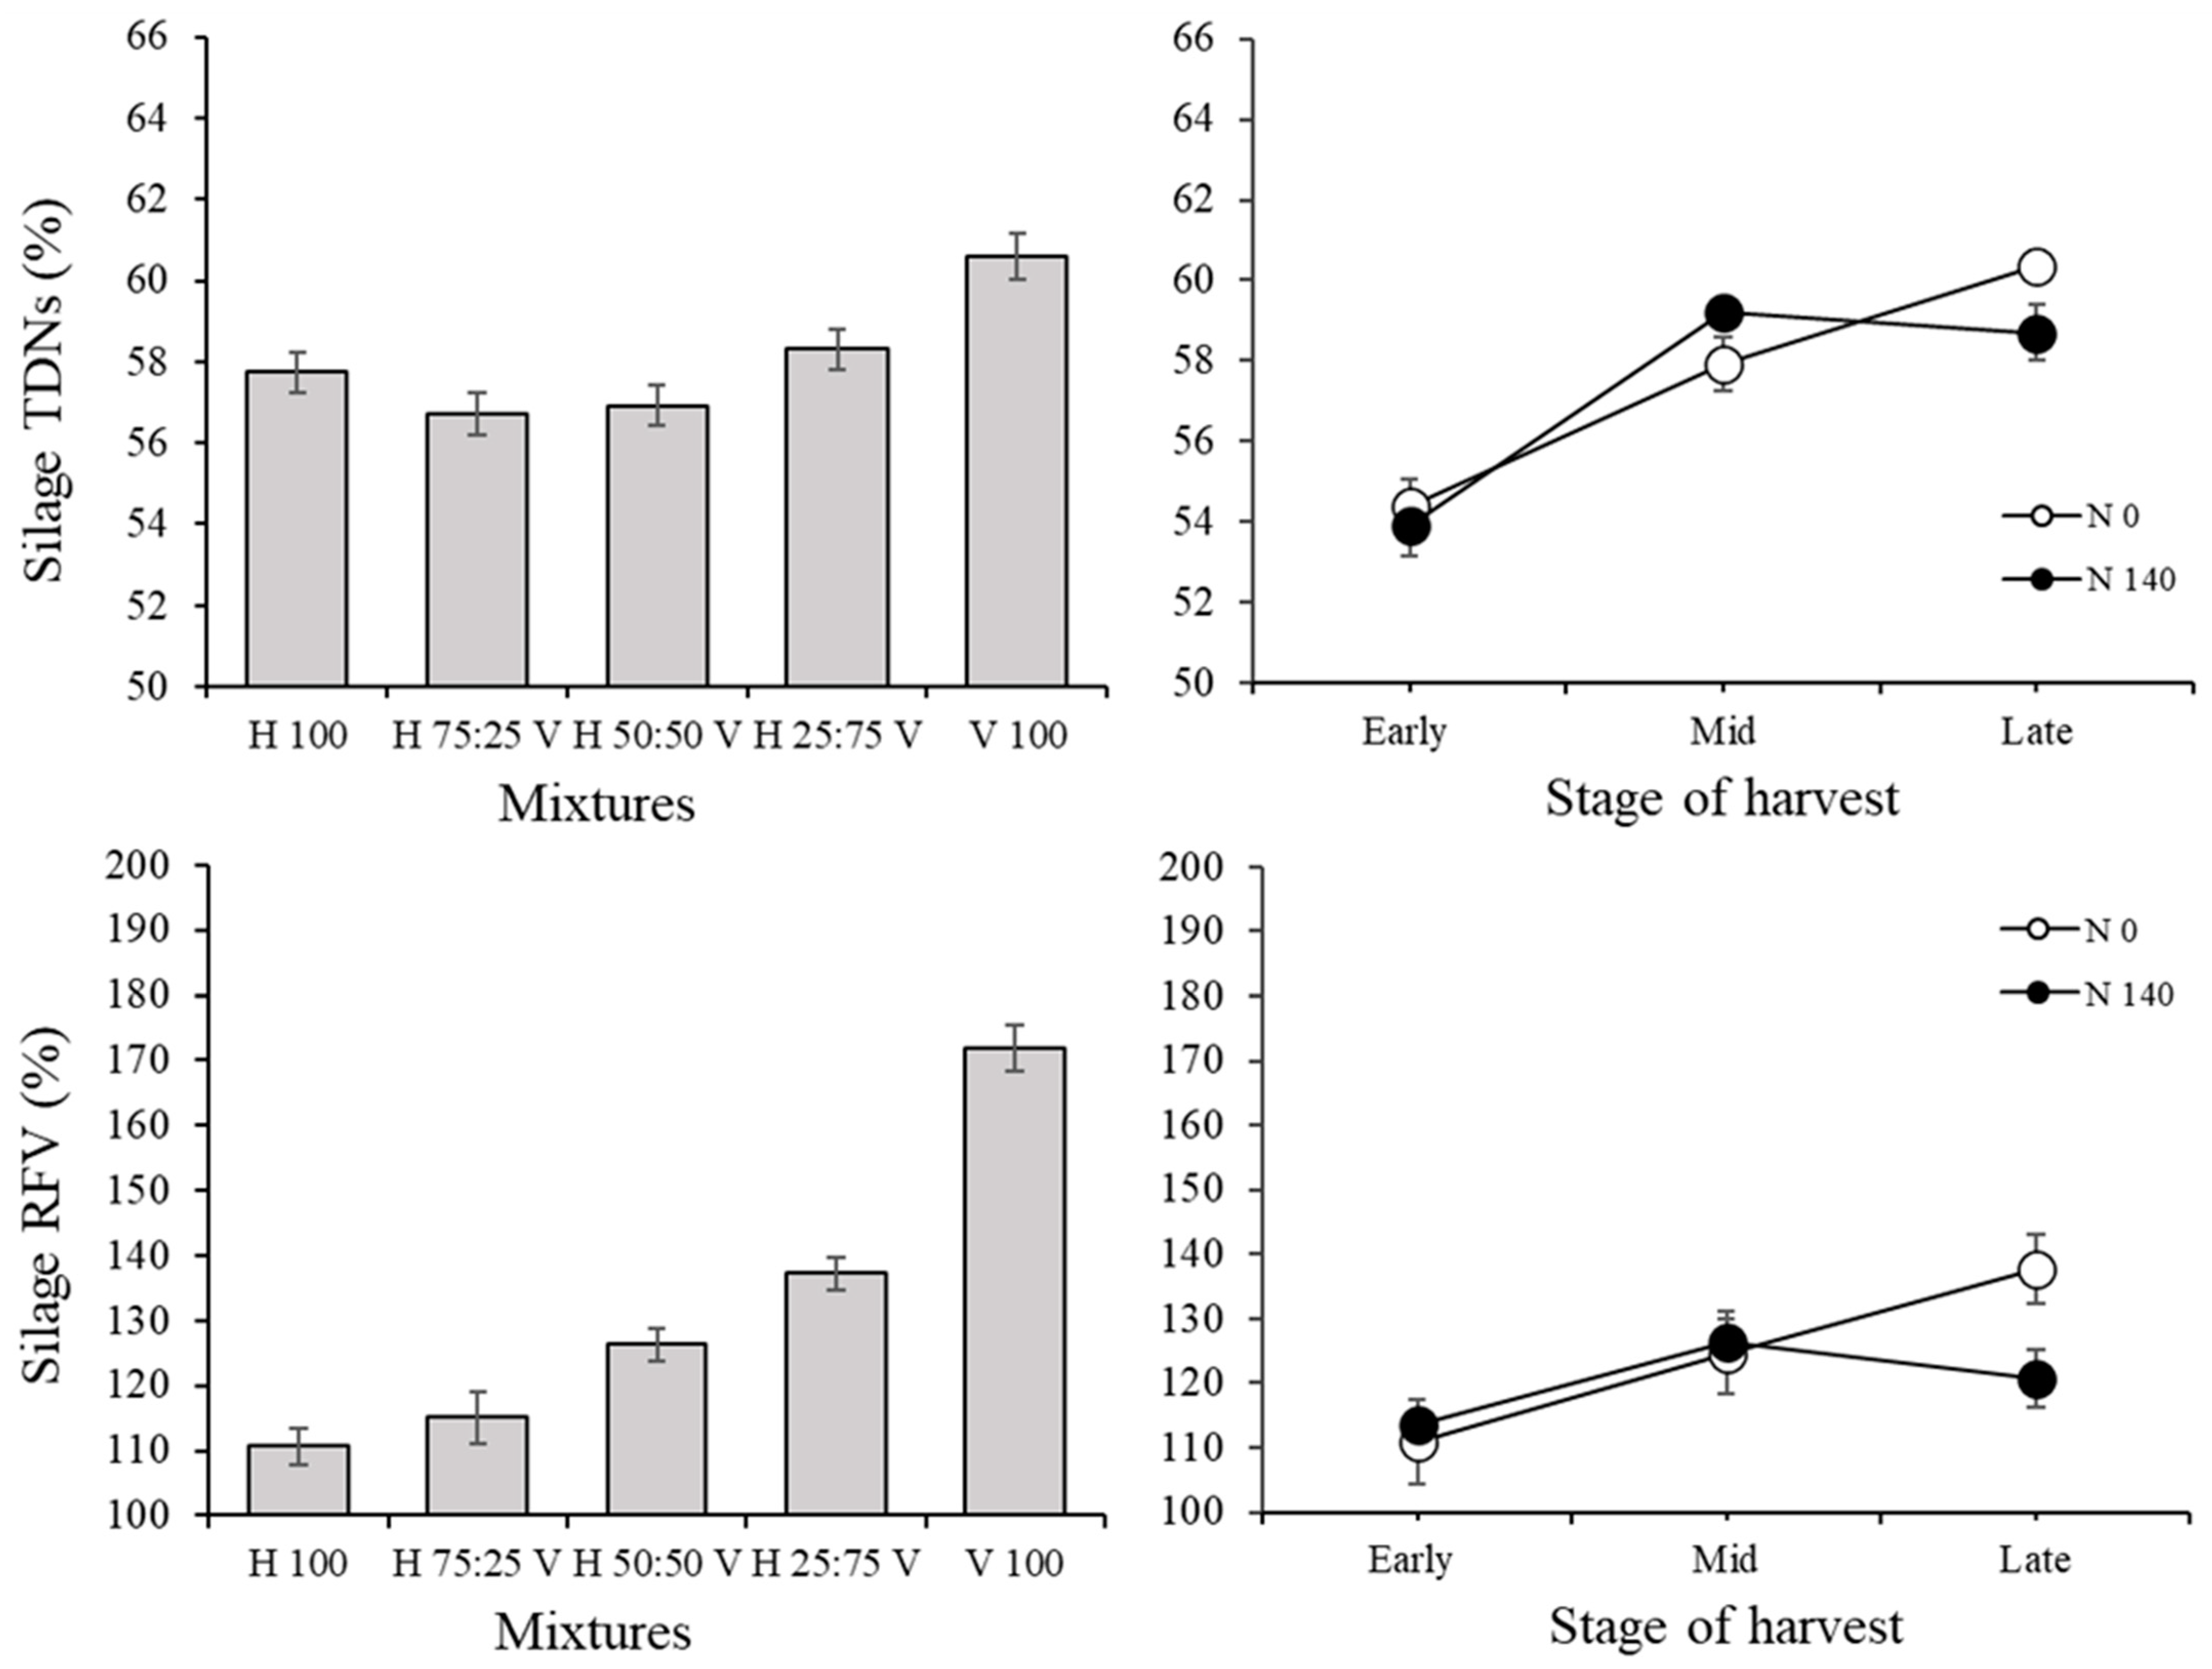
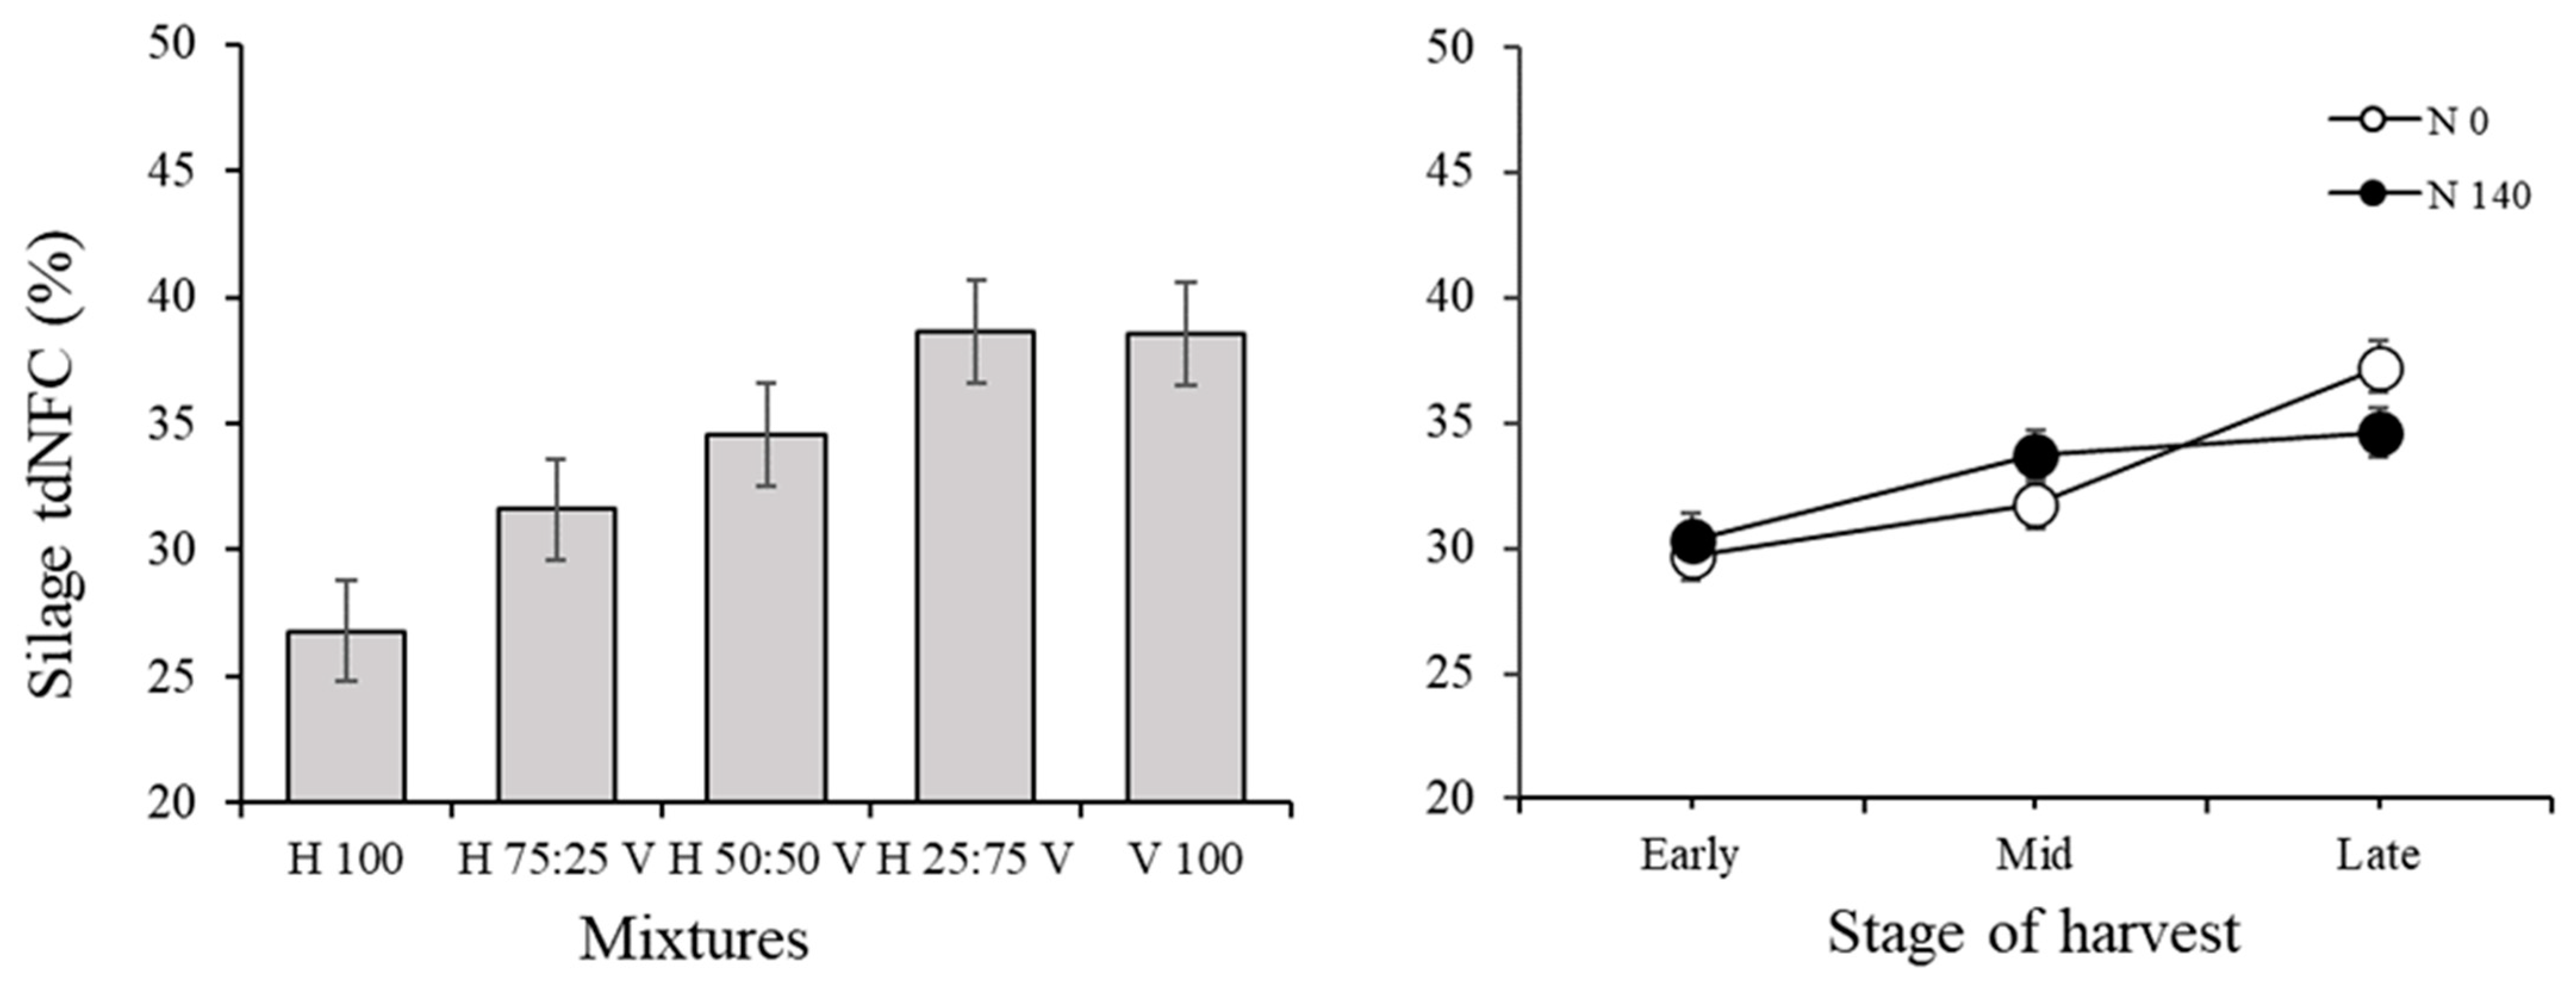
3.2. Silage Traits and Correlations among Variables in the Silage

Most of the interactions among factors in the variables measured on the silage showed a p < 0.05, with few exceptions (Table 2).
As shown in Figure 8, the highest pH was recorded in the silage obtained from the pure barley (4.7), while the pure faba bean and the mixtures showed significantly lower values (4.3 and 4.2, respectively) (see Supplementary Material Figure S13 for interactions). The pH value was also affected by the SH × NF interaction: from the early to the late stage, both treatments increased, but the final increase in the fertilized one (+9%) was higher than the unfertilized one (final pH value equal to 4.3).
Regarding the CP concentration (Figure 9), the silage showed the same values and trend of the herbage, and this contrasted to those of the DM concentrations (Supplementary Material Figures S14 and S15, respectively). As expected, nitrogen fertilization increased CP concentration: on average, the fertilized treatment showed 9.6% more CP than the unfertilized treatments (13.9%).
The EE of the silage showed no difference between mixtures where faba bean was included and the mean concentration recorded was 1.8%. By contrast, the EE concentration increased strongly in pure barley (+22.2%) (Supplementary Material Figure S16).
In contrast to the herbage, the ash concentration in the silage (Figure 10 and Supplementary Material Figure S17) was higher in pure barley (7.8%) and decreased by reducing its fraction in the mixture. From pure barley to pure faba bean, the reduction was on average 10.6%. Ash concentration was also affected by the SH × NF interaction: from the early to the late stage, both fertilized and unfertilized treatments decreased by 16.4% and 15.3%. In all the SH, the ash concentration was always higher in the unfertilized treatment.
NDF, ADF and ADL concentrations in the silage are illustrated in Figure 11 and Supplementary Material Figures S18–S20.
The NDF concentration decreased from the early (52.7%) to the late harvest stage (−14%), while the fertilized treatment showed no relevant variation (−2%). Among the pure barley and the mixtures where it was included, no particular difference in the ADF concentration was recorded and, on average, its reached 32%. In comparison, the pure faba bean showed a significantly lower concentration (−9.8%). Regarding the SH × NF interaction, from the early to the late stage of harvest, unfertilized and fertilized treatments decreased by 16.4% and 8.6%, respectively. The ADL concentration was affected both from the interaction SH × MX and NF. Concerning the first case, it increased significantly in the early stage as the faba bean fraction increased. By contrast, in the mid stage, relevant increases in the variable were recorded only in mixtures H25:V75 and V100, while no significant differences between treatments were observed in the late stage of harvest. Regarding NF, the silage obtained from fertilized crops showed a higher concentration in ADL (+10%) compared to the one derived from the unfertilized treatment (6%).
The concentrations of TDNs and RFV in the silage are shown in Figure 12 and Supplementary Material Figures S21 and S22. In contrast to the herbage, in the silage, TDNs were higher for the pure faba bean (60.6%), while the pure barley concentration decreased slightly (5.6%). Fertilization increased the amount of TDNs in the silage from the early (53.9%) to the late stage (58.7%), but in comparison a higher increase (11%) was found in the unfertilized treatment. RFV sharply increased as the barley fraction in the mixture diminished. Compared to faba bean RFV (171.8%), the pure cereal showed 61% less.
Concerning the WSC concentration of the silage (Figure 13 and Supplementary Material Figure S23), the fermentation process reduced by at least 46% of the initial amount contained in the mixtures. The lowest concentration was recorded in the pure faba bean (3.7%), while the highest was in the mixture H 25:V 75 (6.7%). The WSC concentration was affected by NF: compared to the unfertilized treatment, where WSCs represented 7.3% of the silage dry matter, the fertilized one showed 34.4% less.
The WSC to CP ratio was affected by both MX and NF (Supplementary Material Figure S24). The highest ratio was recorded in the pure barley and was equal to 0.71 due to the low CP content. In the pure faba bean, this was 3.9 times lower. As expected, the fertilization strongly reduced the value of the ratio (−42%).
The tdNFC concentration in the silage (Figure 14 and Supplementary Material Figure S25) was higher in the faba bean (+43.8%) than in the pure barley (26.8%). From the early to the late stage of harvest, the tdNFC concentration increased more in the unfertilized treatment (+25.4%) than in the fertilized one (+14%).
The results for the cellulose and hemicellulose fractions in the silage are shown in Supplementary Material Figures S26 and S27, respectively.
Silage lactic and acetic acid concentrations and the acetic to lactic ratio (Figure 15) were affected by the interactions SH × MX and SH × NF. Independently from the stage of harvest, the pure faba bean silage showed a higher amount of lactic acid (+78.1%) when compared to silage obtained with the pure cereal. The highest concentrations, however, were observed in the mixtures H25:V75 (14.2%) and H50:V50 (13.4%) obtained from the crops collected in the early stage. Advancing with the stage of harvest, the acid concentration decreased.
Concerning the acetic acid amount, it increased with the increase in the faba bean fraction in the mixtures. The pure legume showed the highest concentration in all the three harvests, particularly in the early stage (0.53%), when pure barley recorded 82.4% less. As regards the SH × NF interaction, while the unfertilized treatment was not subjected to particular variations, the fertilized one recorded an important decrease (−51.8%) from the early (0.26%) to the late stage of harvest. Irrespective of SH, the acetic to lactic acid ratio appeared to always be higher in the pure barley and was depleted by the addition of faba bean.
The mean effects of MX and SH on the concentration of butyric acid, isovaleric acid and valeric acid are reported in Table 3.
The propionic acid was not affected by the applied treatments and presented a mean value of 0.02% (data not shown).
Butyric acid‘s concentration was significantly higher in pure faba bean and H 25:V 75 compared to the remaining mixtures. Moreover, from the early to the late stage, it clearly decreased (−38.6%).
By contrast, the isovaleric acid showed an inverse trend both for MX and SH.
Lastly, the valeric acid concentration was higher in the pure faba bean (+53.9%) compared to the pure barley and decreased gradually over the different stage of harvest.
In general, the pure faba bean showed a definitively higher concentration in total volatile fatty acids compared to the pure barley independently of the stage of harvest (Figure 16). In the early stage of harvest, the total volatile fatty acids concentration was higher in the fertilized treatment (+21.4%) compared to the unfertilized one (13.9%). However, this difference became irrelevant in the last two stages, and both the fertilized and unfertilized treatments decreased to 6% and 7%, respectively.
In silage, unexpected correlations among variables were found (Supplementary Material Table S2). These include a strong and positive correlation between pH and dry matter concentration and a negative correlation between pH and CP concentration. In general, most organic acids in the silage negatively correlated with dry matter concentration and positively correlated with CP concentration, with the exception of isovaleric acid.

3.3. Variation of Traits from Herbage to Silage

Variation of traits from the herbage to the silage was computed both from absolute and relative points of view (Supplementary Material Table S1 and Supplementary File S1).
The relative reductions in ashes, NDF, ADF, and ADL negatively correlated with dry matter concentration and with CP concentration.
Nonetheless, when computing the absolute loss from herbage to silage, the former traits (ash, NDF, ADF, and ADL) negatively correlated with dry matter concentration and positively with CP. The opposite results were found for TDNs and RFV.
As expected, the higher the pH of the silage, the higher the relative reduction in both the WSCs and the WSC to CP ratio, but not the absolute reduction, which showed a strongly negative correlation with silage pH for both of these latter traits.

3.4. Choice of the Variables and Results from the Canonical Discriminant Analysis

The choice of the non-mutually correlated variables included the jars’ relative weight loss due to the fertilization phase and additional 15 measured variables, excluding the absolute and relative reductions from the herbage to the silage during the silage maintenance in the jars (Supplementary Material Table CORR 1). Beyond the relative loss of jars’ weight (% FM), these variables were: DM, EE, NDF, WSCs and WSC to CP ratio of the herbage; EE, ash, NDF, ADF, ADL, WSCs, propionic acid, butyric acid, isovaleric acid and acetic acid to lactic acid ratio of the silage.
All treatments were included in the CDA (see Supplementary Materials Table S3 for the complete results from the CDA analysis).
The CDA fitted the data and all the multivariate statistics and F approximations computed showed a p < 0.001 (Supplementary Materials Table Raw Results CDA).
In total, 11 canonical axes (CAs) a p for the H0 test lower than 0.05 with 88.5% of the total variance captured by the first three CA. Most of the variance was explained by CA1 (0.66), whereas CA2 and CA3 only explained 0.14 and 0.09 of the variance, respectively.
The correlation between CA1 and the original variables was high for jars’ relative weight loss (% FM) (variable A in Figure 17; r = 0.68); DM of the herbage (B, r = 0.94); ADL of the silage (M, r = −0.76); and butyric acid, (P, r = −0.67). However, CA1 was mostly affected by the DM of the herbage (B); WSC to CP ratio of the herbage (F); WSCs of the herbage (E); NDF of the herbage (D); and isovaleric acid (Q), whose projection on CA1 was dramatically higher than any other traits. Similarly, variables B, F, and D also affected CA2 more than any other variable. Lastly, the probability of rejecting the null hypothesis for no differences according to the Mahalanobis distance for the squared distance to treatment was higher than p = 0.05 only for the unfertilized mixture with 75% barley in the late sampling compared to the unfertilized mixture with 50% barley (p = 0.063), whereas all the other pairs showed a p value lower than this threshold.
In general, the weight loss from the herbage to the silage (variable A in Figure 17) only showed minimal effects on the CDA distribution, mostly affecting CA2 and 3 (Figure 17). Crop phase and mixes were captured by different, and contrasting patterns in CA1vs2 hyperspace. In particular, the progression of the crop phase was positively highlighted by an increase in DM of the herbage (B); NDF of the herbage (D); ADF of the silage (L) in the CA1vs2 hyperspace and negatively by the ADL of the silage (M) in both the CA1vs2 and CA1vs3 hyperspaces. In contrast, the fraction of barley in the mixture (including the pure faba bean as a reference) was seen due to differences in the WSCs of the herbage (E) and WSC to CP ratio of the herbage (F) in both hyperspaces, with very mild effects of the other variables. Lastly, fertilized treatments were differentially classified by the unfertilized ones in almost all comparisons, but the differences between fertilized and unfertilized treatments was mostly seen for those including pure barley or mixtures with 75% barley and were due similarly due to the water-soluble carbohydrates of the herbage (E) and WSC to CP ratio of the herbage (F). Regarding CA3, the axis highlighted a differential effect of the combination of the above-mentioned variables (B, D, L, M, E, and F) by the crop phase of collection and fraction of barley in the mixture, with a role of the variables E and F, which reduced when the fraction of barley in the mixture increased.

4. Discussion

Silage is usually obtained after the biomass fermentation of a single crop, whose traits can be easily predicted according to the growth stage at the time of harvest, and the environmental and agronomic management [51,52]. Intercrops for hay or dry biomass production have been long studied and can bring a range of benefits from both agronomic and environmental points of view [1,53]. However, when used for silage production, the variable traits of the intercropped components can cause problems for the fermentation procedure [54]. When species with asynchronous growth rates are intercropped, these traits are, in turn, linked to both the likely different growth stage of each component at the time of harvest, their own specific traits, their response to the environmental and agronomic variables (e.g., N availability) and their complementarity. The sum of these issues thus poses a wealth of problems in choosing the correct time of harvest for intercrops intended for silage production.
Up until now, the studies on the effect of intercropping on the silage performances are usually performed by directly ensiling the intercrops, e.g., [55,56,57,58,59,60,61,62,63]. However, the composition of each species and thus its suitability for the silage process can strongly vary in the sole cropped compared to its intercropped counterpart. Thus, directly ensiling the intercrop biomass depends on the component ratio in the intercrop (and the corresponding biomass mixture) and on the bromatological traits of each component. Indeed, such a method is only indirectly indicative of each species’ contribution to the silage trait. In contrast, a direct comparison of the mixture was seldom assessed, e.g., [64,65], despite being able to better and directly highlight the role of each species in the mixture. In particular, legume–cereal mixtures have been indicated to improve the forage quality in comparison to the sole–cereal or sole–legume forages, including the use of grain legumes as forages [66].
In the present work, we illustrated the role of the composition of the mixture through the forage of two cool-season species, faba bean and barley, the latter being either N-fertilized or not, and all of them collected at three stages of growth in order to provide both scientific and practical indications for the optimal time of crop collection for various use, both the dry forage (simulating the hay and hereafter referred as herbage) or the silage (obtained through a microensiling process).
At all stages of harvest, faba bean showed a lower dry matter (DM), a lower ether extract (EE), and a higher crude protein (CP) concentration than the barley. In the cereal the effect of the fertilization was evident mostly in the later stages of growth. Similarly, all mixtures showed DM and CP proportional to the component share in the mixture. These results matched for both the herbage and the silage. Barley–faba bean intercrop for silage production is an understudied system, despite its potential to provide high yields and forage quality [25,67] and this mostly occurs when faba bean is predominant in the mixture [68]. The authors of [68] highlighted, as confirmed by the present study, that faba bean has a higher potential than barley to maintain a vegetative status, which often corresponds to a lower total yield in the later growth phases, especially when the crop is grown under intercrop conditions, while concurrently improving the mixture quality.
In our work, we also noticed that faba bean herbage showed 1% lower water-soluble carbohydrates (WSC) than the unfertilized barley but 2.9% higher than the fertilized barley. This indicates a good suitability of the faba bean biomass for silage purposes and indeed this corresponded to both a higher WSC concentration and RFV value of the silage in the mixtures compared to the sole barley (either fertilized or not). This result has also been confirmed in the dairy products when including faba bean in cereal-based silages [69,70]; conversely, inconsistent results were found for the meat quality when including a faba bean–wheat silage compared to a sole wheat silage [71].
The role of the faba bean percentage in the silage mixture and the time of harvest on the DM, CP, and NDF concentrations and CP to WSC ratio matched those of the herbage mixtures. In contrast to the previous results matching between herbages and silages, ADL increased with increasing proportions of faba bean in the mixture in all the harvests, but this did not occur in the silage obtained by the late harvest, when DM and PC concentrations in the biomasses were higher and NDF lower than the early and mid stage. This suggests a preferential degradation of the ADL in the mixture compared to the sole crop forages.
In a barley–pea mixture [63], a number of quality traits decreased, while digestibility increased in both the forage and the silage at increasing the legume share. These traits included WSCs, NDF, and ADF [63]. In contrast, we found that the inclusion of faba bean in the mixture improved most of the quality traits without affecting the total digestible nutrients of the mixture. We thus argued that the role of the legume mixture with cereals in the silage quality may depend on contrasting determinants of the quality. In particular, differences between the present study (on barley–faba bean) and the one by Soufan et al. [63] (on barley–pea) in terms of potential effects on the animals that could be due to different DM in mixtures, as clearly shown by Castro-Montoya and Dickhoefer [72].
Nonetheless, differences in other biomass bromatological traits may have been responsible for the changes that occurred between the fresh and the silage biomass in the present study. In particular, NDF, hemicellulose, EE, and, to a certain extent, cellulose, especially at early and mid sampling, decreased, while the ADF, ADL, lactic acid concentration, lactic to acetic acid ratio, and total fatty acids of the mixture increased when increasing the faba bean share in the mixture, but such an effect strongly depended on the harvest stage. These traits and the low buffering capacity of faba bean [29] may have also contributed to the decreased pH in the mixture and faba bean silage compared to the barley silage [13] and improved the total quality of silage [12], especially when compared to the fertilized barley in the late sampling, and thus to the improvement of the silage quality due to the presence of legume. Indeed, cereals, especially at a higher DM concentration, may contain Proteobacteria and Clostridium species, whose activities can be counterbalanced by the lactic acid-producing bacteria from legumes [12,73], despite the differences in the epiphytic bacterial composition that can occur among various grasses or cereals [74].
When comparing the bromatological characteristics of the herbage to those of the silage, we noticed that the loss of DM and hemicellulose was lower when the faba bean share in the mixture was increased (Supplementary File S1), while the opposite results were found for ADF, EE, and TDN, with special emphasis on the mid harvesting stage. This suggests that the inclusion of faba bean may have altered the ensiling condition though both changing the mean composition of the herbage and prompting an increase in the ratio between Lactobacillus and inhibitory microbes. Notably, these improvements by faba bean inclusion occurred irrespectively of the faba bean percentage in the mixture.
This was also reported by a recent work on the faba bean–oat and faba bean–wheat silages [75], which showed that the presence of faba bean may increase lactic acid production in the silage through the mixture compared to the sole crop silage. Similar results were also found when studying other legumes’ epiphytic bacterial communities [76].
The distribution of the N fertilization to barley scarcely influenced the studied traits, with few exceptions (i.e., DM and ash concentrations of the herbage). This unresponsiveness to the nitrogen availability could be likely due to the remarkable vegetative and root development and the hybrid staying green, which also displayed an improved NUE [40].
This was further confirmed by the fact that the N fertilization treatment primarily interacted with the stage of harvest but not with the mixture ratios, affecting the silage quality.
The canonical discriminant analysis (CDA) applied in the present study to the herbage and silage traits further clarified that few traits may be used to catch the whole variability of the systems (see Supplementary Material Tables S2 and S3). These traits include DM, WSCs and WSC to CP ratio in the herbage and, to a lesser extent, the NDF, the WSC to CP ratio and the butyric acid in the silage. In addition, the CDA showed that, on average, the mixture and barley fertilization was arranged according to the canonical axis (CA) 1 (65.7% of the total variance explained), whereas the harvest date arranged according to both CA1 and CA2, thus suggesting the need to modulate the fertilization and the component ratio depending on the planned phenological phase for harvesting the biomass, further confirming our previous findings [24]. Notably, the factors applied were similarly distributed in the treatments in the Ca 1 vs. CA2 panel in terms of distances, but this did not occur in the Ca 1 vs. CA3 panel, where the barley sole crop (both fertilized and not) showed dramatic decreases in the quality traits.
These results imply that the presence of faba bean can strongly help to increase the silage quality of barley, especially in the late harvest when barley quality is likely lower. Such improvements may depend on the earlier stage of growth of the faba bean compared to barley and its different bromatological traits, especially the relatively high WSC concentration. Similar results were found for a number of legumes and Poaceae species [55,77], indicating that the digestibility of cereals decreased more sharply than in legumes. Legume addition may thus strongly improve the silage quality of mixtures from later-harvested crops thanks to its ability to maintain high-quality traits for silage throughout the growing season.

5. Conclusions

Our findings support the hypothesis that varying the ratio between hybrid barley and faba bean affects the quality of herbage and silage through different mechanisms. In the herbage, such an improvement was mostly due to the augmented CP and WSC concentrations. In the silage, this improvement was mostly due to the ability of faba bean to support organic and, in particular, lactic acid production and sustain the fermentation process thanks to its relatively high concentration of WSCs, which also contributed to strongly lower the silage pH. Additionally, we noticed that the bacterial fermentation process, as inferred by the organic acid and WSC differences among treatments between herbage and silage, was improved in the mixtures compared to the sole crops. These improvements occurred almost irrespectively of the barley fertilization or stage of harvest.
Conversely, the N fertilization of the barley scarcely affected the herbage and silage traits, with the exception of some variables, including the DM and ash concentrations of the herbage, while primarily interacting with the stage of harvest and not with mixture ratios.
Thus, the results from the present study suggest that under similar Mediterranean conditions, mixing faba bean with hybrid barley at whatever mixing rate would produce herbage and silage with more balanced nutritional characteristics. Furthermore, we highlighted that mixing cereals and legumes may increase the optimal window for the crop harvest for both herbage and silage.
In conclusion, our results may have practical implications for selecting the optimal management strategies in the hybrid barley–faba bean intercropping, as we demonstrated that this genotype is well adapted for silage production and the mixture with faba bean could represent a low input technology for rainfed Mediterranean forage systems

Supplementary Materials

The following supporting information can be downloaded at: https://www.mdpi.com/article/10.3390/agronomy12081790/s1. Table S1: Means and standard errors (n = 3) of the complete dataset; Table S2: Correlation among variables; Table S3: Raw results of the canonical discriminant analysis; Figure S1: Dry matter, crude protein, ether extract, and ash concentration in the herbage; Figure S2: Ether extract in the herbage; Figure S3: Neutro detergent fiber in the herbage; Figure S4: Acid detergent fiber in the herbage; Figure S5: Acid detergent lignin in the herbage; Figure S6: Total digestible nutrients in the herbage; Figure S7: Relative feed value in the herbage; Figure S8: Water-soluble carbohydrates in the herbage; Figure S9: Water-soluble carbohydrate to crude protein ratio in the herbage; Figure S10: Total digestible nutrients in the herbage; Figure S11: Hemicellulose concentration in the herbage; Figure S12: Cellulose concentration in the herbage; Figure S13: pH of the silage; Figure S14: Crude protein concentration in the silage; Figure S15: Dry matter of the silage; Figure S16: Ether extract in the silage; Figure S17: Ash in the silage; Figure S18: Neutro detergent fiber in the silage; Figure S19: Acid detergent fiber in the silage; Figure S20: Acid detergent lignin in the silage; Figure S21: Total digestible nutrients in the silage; Figure S22: Relative feed value of the silage (second order interaction); Figure S23: Relative feed value of the silage first order interaction; Figure S24: Water-soluble carbohydrates to crude protein ratio in the silage; Figure S25: Truly digestible non-fibrous carbohydrates in the silage; Figure S26: Cellulose concentration of the silage; Figure S27: Hemicellulose concentration of the silage. File S1: Raw Results of the Statistical Analysis.

Author Contributions

Conceptualization, F.G.S.A. and M.M.; methodology, F.G.S.A. and M.M.; software, S.S.; formal analysis, F.G.S.A. and S.S.; investigation, F.G.S.A., M.M. and B.T.; resources, M.M. and B.T.; data curation, F.G.S.A. and S.S.; writing—original draft preparation, F.G.S.A., S.P. and S.S.; writing—review and editing, F.G.S.A., M.M., S.P. and S.S.; visualization, F.G.S.A., S.P. and S.S.; supervision, M.M.; project administration, F.G.S.A. and M.M.; funding acquisition, M.M. All authors have read and agreed to the published version of the manuscript.

Funding

This research received no external funding.

Institutional Review Board Statement

Not applicable.

Informed Consent Statement

Not applicable.

Data Availability Statement

The data presented in this study are available on request from the corresponding author.

Conflicts of Interest

The authors declare no conflict of interest.

References

  1. Yu, Y.; Stomph, T.-J.; Makowski, D.; van der Werf, W. Temporal niche differentiation increases the land equivalent ratio of annual intercrops: A meta-analysis. Field Crop. Res. 2015, 184, 133–144. [Google Scholar] [CrossRef]
  2. Yu, Y.; Makowski, D.; Stomph, T.-J.; van der Werf, W. Robust Increases of Land Equivalent Ratio with Temporal Niche Differentiation: A Meta-Quantile Regression. Agron. J. 2016, 108, 2269–2279. [Google Scholar] [CrossRef]
  3. Saia, S.; Urso, V.; Amato, G.; Frenda, A.S.; Giambalvo, D.; Ruisi, P.; Di Miceli, G. Mediterranean forage legumes grown alone or in mixture with annual ryegrass: Biomass production, N2 fixation, and indices of intercrop efficiency. Plant Soil 2016, 402, 395–407. [Google Scholar] [CrossRef]
  4. Yu, Y.; Stomph, T.-J.J.; Makowski, D.; Zhang, L.; van der Werf, W. A meta-analysis of relative crop yields in cereal/legume mixtures suggests options for management. Field Crop. Res. 2016, 198, 269–279. [Google Scholar] [CrossRef] [Green Version]
  5. Lithourgidis, A.S.; Dordas, C.A.; Damalas, C.A.; Vlachostergios, D.N. Annual intercrops: An alternative pathway for sustainable agriculture. Aust. J. Crop Sci. 2011, 5, 396–410. [Google Scholar]
  6. Willey, R.W. Resource use in intercropping systems. Agric. Water Manag. 1990, 17, 215–231. [Google Scholar] [CrossRef]
  7. Olesen, J.E.; Trnka, M.; Kersebaum, K.C.; Skjelvåg, A.O.; Seguin, B.; Peltonen-Sainio, P.; Rossi, F.; Kozyra, J.; Micale, F. Impacts and adaptation of European crop production systems to climate change. Eur. J. Agron. 2011, 34, 96–112. [Google Scholar] [CrossRef]
  8. Giorgi, F.; Lionello, P. Climate change projections for the Mediterranean region. Glob. Planet. Change 2008, 63, 90–104. [Google Scholar] [CrossRef]
  9. Elferink, S.O.; Driehuis, F.; Gottschal, J.; Spoelstra, S. Silage fermentation processes and their manipulation. In Proceedings of the FAO Electronic Conference on Tropical Silage. Silage Making in the Tropics with Particular Emphasis on Smallholders. 1 September–15 December 1999; Mannetje, L., Ed.; FAO Plant Production and Protection Paper; Food and Agriculture Organization: Rome, Italy, 2000; Available online: http://www.fao.org/docrep/005/x8486e/x8486e09.htm (accessed on 28 July 2022).
  10. Anil, L.; Park, J.; Phipps, R.H.; Miller, F.A. Temperate intercropping of cereals for forage: A review of the potential for growth and utilization with particular reference to the UK. Grass Forage Sci. 1998, 53, 301–317. [Google Scholar] [CrossRef]
  11. Eskandari, H.; Ghanbari, A.; Javanmard, A. Intercropping of cereals and legumes for forage production. Not. Sci. Biol. 2009, 1, 7–13. [Google Scholar] [CrossRef] [Green Version]
  12. Kung, L.; Shaver, R.D.; Grant, R.J.; Schmidt, R.J. Silage review: Interpretation of chemical, microbial, and organoleptic components of silages. J. Dairy Sci. 2018, 101, 4020–4033. [Google Scholar] [CrossRef]
  13. Buxton, D.R.; O’Kiely, P. (Eds.) Preharvest plant factors affecting ensiling. In Silage Science and Technology; American Society of Agronomy, Madison (US); American Society of Agronomy: Madison, WI, USA, 2015; pp. 199–250. ISBN 9780891182344. [Google Scholar]
  14. Berkenkamp, B.; Meeres, J. Mixtures of Annual Crops for Forage in Central Alberta. Can. J. Plant Sci. 1987, 67, 175–183. [Google Scholar] [CrossRef]
  15. Kirchhof, S.; Eisner, I.; Gierus, M.; Südekum, K.-H. Variation in the contents of crude protein fractions of different forage legumes during the spring growth. Grass Forage Sci. 2010, 65, 376–382. [Google Scholar] [CrossRef]
  16. Liu, Y.; Wu, Q.; Ge, G.; Han, G.; Jia, Y. Influence of drought stress on afalfa yields and nutritional composition. BMC Plant Biol. 2018, 18, 13. [Google Scholar] [CrossRef] [Green Version]
  17. Mariotti, M.; Andreuccetti, V.; Arduini, I.; Minieri, S.; Pampana, S. Field bean for forage and grain in short-season rainfed mediterranean conditions. Ital. J. Agron. 2018, 13, 208–215. [Google Scholar] [CrossRef] [Green Version]
  18. Steinshamn, H. Effect of forage legumes on feed intake, milk production and milk quality–A review. Anim. Sci. Pap. Rep. 2010, 28, 195–206. [Google Scholar]
  19. McDonald, P.; Henderson, A.R.; Heron, S.J.E. The Biochemistry of Silage; Chalcombe Publications: Southampton, UK, 1991; ISBN 0948617225. [Google Scholar]
  20. Mohler, C.L.; Liebman, M. Weed Productivity and Composition in Sole Crops and Intercrops of Barley and Field Pea. J. Appl. Ecol. 1987, 24, 685–699. [Google Scholar] [CrossRef]
  21. Frenda, A.S.; Ruisi, P.; Saia, S.; Frangipane, B.; Di Miceli, G.; Amato, G.; Giambalvo, D. The Critical Period of Weed Control in Faba Bean and Chickpea in Mediterranean Areas. Weed Sci. 2013, 61, 452–459. [Google Scholar] [CrossRef]
  22. Herbert, S.J.; Putnam, D.H.; Poos-Floyd, M.I.; Vargas, A.; Creighton, J.F. Forage Yield of Intercropped Corn and Soybean in Various Planting Patterns1. Agron. J. 1984, 76, 507–510. [Google Scholar] [CrossRef]
  23. Strydhorst, S.M.; King, J.R.; Lopetinsky, K.J.; Harker, K.N. Forage Potential of Intercropping Barley with Faba Bean, Lupin, or Field Pea. Agron. J. 2008, 100, 182–190. [Google Scholar] [CrossRef]
  24. Pampana, S.; Arduini, I.; Andreuccetti, V.; Mariotti, M. Fine-Tuning N Fertilization for Forage and Grain Production of Barley–Field Bean Intercropping in Mediterranean Environments. Agronomy 2022, 12, 418. [Google Scholar] [CrossRef]
  25. Mariotti, M.; Masoni, A.; Ercoli, L.; Arduini, I. Forage potential of winter cereal/legume intercrops in organic farming. Ital. J. Agron. 2006, 1, 403–412. [Google Scholar] [CrossRef] [Green Version]
  26. Mariotti, M.; Masoni, A.; Ercoli, L.; Arduini, I. Optimizing forage yield of durum wheat/field bean intercropping through N fertilization and row ratio. Grass Forage Sci. 2012, 67, 243–254. [Google Scholar] [CrossRef]
  27. Liponi, G.B.; Casini, L.; Gatta, D. Valutazione nutrizionale del favino (vicia faba minor) quale principale fonte proteica in diete per ovini: Risultati preliminari. Ann. Della Fac. Di Med. Vet. 2004, 57, 291–296. [Google Scholar]
  28. Louw, A.W. The Nutritive Value of Faba Bean Silage for Lactating Dairy Cows. Master’s Thesis, University of Stellenbosch, Stellenbosch, South Africa, 2009. Available online: http://hdl.handle.net/10019.1/4051 (accessed on 28 July 2022).
  29. Pursiainen, P.; Tuori, M. Effect of ensiling field bean, field pea and common vetch in different proportions with whole-crop wheat using formic acid or an inoculant on fermentation characteristics. Grass Forage Sci. 2008, 63, 60–78. [Google Scholar] [CrossRef]
  30. Borreani, G.; Chion, A.R.; Colombini, S.; Odoardi, M.; Paoletti, R.; Tabacco, E. Fermentative profiles of field pea (Pisum sativum), faba bean (Vicia faba) and white lupin (Lupinus albus) silages as affected by wilting and inoculation. Anim. Feed Sci. Technol. 2009, 151, 316–323. [Google Scholar] [CrossRef]
  31. Pisponen, A.; Pajumägi, S.; Mootse, H.; Karus, A.; Poikalainen, V. The lactose from Ricotta cheese whey: The effect of pH and concentration on size and morphology of lactose crystals. Dairy Sci. Technol. 2013, 93, 477–486. [Google Scholar] [CrossRef] [Green Version]
  32. Mariotti, M.; Fratini, F.; Cerri, D.; Andreuccetti, V.; Giglio, R.; Angeletti, F.G.S.; Turchi, B. Use of fresh scotta whey as an additive for alfalfa silage. Agronomy 2020, 10, 365. [Google Scholar] [CrossRef] [Green Version]
  33. Hargreaves, A.; Hill, J.; Leaver, J.D. Effect of stage of growth on the chemical composition, nutritive value and ensilability of whole-crop barley. Anim. Feed Sci. Technol. 2009, 152, 50–61. [Google Scholar] [CrossRef]
  34. Kung, L.; Ranjit, N.K. The Effect of Lactobacillus buchneri and Other Additives on the Fermentation and Aerobic Stability of Barley Silage. J. Dairy Sci. 2001, 84, 1149–1155. [Google Scholar] [CrossRef]
  35. Acosta, Y.M.; Stallings, C.C.; Polan, C.E.; Miller, C.N. Evaluation of Barley Silage Harvested at Boot and Soft Dough Stages. J. Dairy Sci. 1991, 74, 167–176. [Google Scholar] [CrossRef]
  36. Raffaella, T.; Calabrò, S.; Terzi, V.; Piccolo, V.; Guglielmelli, A.; Infascelli, F. In vitro fermentation of ten cultivars of barley silage. Ital. J. Anim. Sci. 2009, 8, 343–345. [Google Scholar] [CrossRef]
  37. Seppälä, A.; Rinne, M.; Huuskonen, A. Efficacy of different additives in ensiling faba bean and field pea based whole crop silages. Agric. Food Sci. 2019, 28, 165–175. [Google Scholar] [CrossRef] [Green Version]
  38. Nadeau, E.; Hallin, O.; Jansson, J. Whole-crop legume/barley silages ensiled with different additives. In Proceedings of the XVth International Silage Conference, Madison, WI, USA, 27–29 July 2009; pp. 27–29. [Google Scholar]
  39. McAllister, T.A.; Hristov, A.N. The Fundamentals of Making Good Quality Silage. Adv. Dairy Technol. 2000, 12, 381–399. [Google Scholar]
  40. Preiti, G.; Calvi, A.; Romeo, M.; Badagliacca, G.; Bacchi, M. Seeding Density and Nitrogen Fertilization Effects on Agronomic Responses of Some Hybrid Barley Lines in a Mediterranean Environment. Agronomy 2021, 11, 1942. [Google Scholar] [CrossRef]
  41. Meier, U. Growth Stages of Mono- and Dicotyledonous Plants; BBCH Monograph, Federal Biological Research Centre for Agriculture and Forestry: Bonn, Germany; Julius Kühn-Institut (JKI): Quedlinburg, Germany, 2018; ISBN 978-3-95547-071-5. [Google Scholar]
  42. Griggs, T.C. Determining Forage Dry Matter Concentration with a Microwave Oven; AG/Forage Pasture/2005-01; Coop. Extention, Utah State University: Logan, UT, USA, 2005; pp. 1–2. [Google Scholar]
  43. Martillotti, F.; Antongiovanni, M.; Rizzi, L.; Santi, E.B.G. Metodi di analisi per gli alimenti d’impiego zootecnico. In Quaderni Metodologici; CNR-IPRA, Angeli: Milano, Italy, 1987; Volume 8. [Google Scholar]
  44. NRC. Nutrient Requirements of Dairy Cattle: Seventh Revised Edition, 2001; The National Academies Press: Washington, DC, USA, 2001; ISBN 978-0-309-06997-7. [Google Scholar]
  45. Rohweder, D.A.; Barnes, R.F.; Jorgensen, N. Proposed Hay Grading Standards Based on Laboratory Analyses for Evaluating Quality. J. Anim. Sci. 1978, 47, 747–759. [Google Scholar] [CrossRef]
  46. European Commission. Commission regulation (EC) No 152/2009 of 27 January 2009 laying down the methods of sampling and analysis for the official control of feed. Off. J. Eur. Union 2009, 54, 2–54. [Google Scholar]
  47. Canale, A.; Valente, M.E.; Ciotti, A. Determination of volatile carboxylic acids (C1–C5i) and lactic acid in aqueous acid extracts of silage by high performance liquid chromatography. J. Sci. Food Agric. 1984, 35, 1178–1182. [Google Scholar] [CrossRef]
  48. Suardi, A.; Saia, S.; Alfano, V.; Rezaei, N.; Cetera, P.; Bergonzoli, S.; Pari, L. Pruning harvesting with modular towed chipper: Little effect of the machine setting and configuration on performance despite strong impact on wood chip quality. PLoS ONE 2021, 16, e0261810. [Google Scholar] [CrossRef]
  49. Bergonzoli, S.; Brambilla, M.; Romano, E.; Saia, S.; Cetera, P.; Cutini, M.; Toscano, P.; Bisaglia, C.; Pari, L. Feeding Emitters for Microirrigation with a Digestate Liquid Fraction up to 25 % Dilution Did Not Reduce Their Performance. Agronomy 2020, 10, 1150. [Google Scholar] [CrossRef]
  50. Pengelly, B.C.; Maass, B.L. Lablab purpureus (L.) Sweet—Diversity, potential use and determination of a core collection of this multi-purpose tropical legume. Genet. Resour. Crop Evol. 2001, 48, 261–272. [Google Scholar] [CrossRef]
  51. Goeser, J.P.; Heuer, C.R.; Crump, P.M. Forage fermentation product measures are related to dry matter loss through meta-analysis. Prof. Anim. Sci. 2015, 31, 137–145. [Google Scholar] [CrossRef] [Green Version]
  52. García-Chávez, I.; Meraz-Romero, E.; Castelán-Ortega, O.; Zaragoza Esparza, J.; Osorio Avalos, J.; Robles Jimenez, L.E.; González-Ronquillo, M. Corn Silage, Meta-Analysis of The Quality and Yield of Different Regions in the World. Preprints 2020, 2020100094. [Google Scholar] [CrossRef]
  53. Raseduzzaman, M.; Jensen, E.S. Does intercropping enhance yield stability in arable crop production? A meta-analysis. Eur. J. Agron. 2017, 91, 25–33. [Google Scholar] [CrossRef]
  54. de Rezende, R.P.; de Oliveira Golin, H.; de Abreu, V.L.D.S.; de Faria Theodoro, G.; Franco, G.L.; Brumatti, R.C.; Fernandes, P.B.; de Lucca Bento, A.L.; Rocha, R.F.A.T. Does intercropping maize with forage sorghum effect biomass yield, silage bromatological quality and economic viability? Res. Soc. Dev. 2020, 9, e46942818. [Google Scholar] [CrossRef] [Green Version]
  55. Kaiser, A.G.; Dear, B.S.; Morris, S.G. An evaluation of the yield and quality of oat–legume and ryegrass–legume mixtures and legume monocultures harvested at three stages of growth for silage. Aust. J. Exp. Agric. 2007, 47, 25–38. [Google Scholar] [CrossRef]
  56. Shoaib, M.; Ayub, M.; Shehzad, M.; Akhtar, N.; Tahir, M.; Arif, M. Dry matter yield and forage quality of oat, barley and canola mixture. Pakistan J. Agric. Sci. 2014, 51, 443–449. [Google Scholar]
  57. Jacobs, J.L.; Ward, G.N. Effect of intercropping forage peas (Pisum sativum L.) with winter wheat (Tritium vulgare L.) or triticale (Triticale hexaploide Lart.) on DM yield, nutritive characteristics when harvested at different stages of growth. Anim. Prod. Sci. 2012, 52, 949–958. [Google Scholar] [CrossRef]
  58. Hernández-Ortega, M.; Heredia-Nava, D.; Espinoza-Ortega, A.; Sánchez-Vera, E.; Arriaga-Jordán, C.M. Effect of silage from ryegrass intercropped with winter or common vetch for grazing dairy cows in small-scale dairy systems in Mexico. Trop. Anim. Health Prod. 2011, 43, 947–954. [Google Scholar] [CrossRef]
  59. Maxin, G.; Andueza, D.; Le Morvan, A.; Baumont, R. Effect of intercropping vetch (Vicia sativa L.), field pea (Pisum sativum L.) and triticale (X Triticosecale) on dry-matter yield, nutritive and ensiling characteristics when harvested at two growth stages. Grass Forage Sci. 2017, 72, 777–784. [Google Scholar] [CrossRef]
  60. Prithiviraj, B.; Carruthers, K.; Fe, Q.; Cloutier, D.; Martin, R.C.; Smith, D.L. Intercropping of corn with soybean and lupin for silage: Effect of seeding date on yield and quality. J. Agron. Crop Sci. 2000, 185, 129–136. [Google Scholar] [CrossRef]
  61. Brown, A.N.; Ferreira, G.; Teets, C.L.; Thomason, W.E.; Teutsch, C.D. Nutritional composition and in vitro digestibility of grass and legume winter (cover) crops. J. Dairy Sci. 2018, 101, 2037–2047. [Google Scholar] [CrossRef] [PubMed]
  62. Titterton, M.; Maasdorp, B.V. Nutritional improvement of maize silage for dairying: Mixed crop silages from sole and intercropped legumes and a long season variety of maize. 2. Ensilage. Anim. Feed Sci. Technol. 1997, 69, 263–270. [Google Scholar] [CrossRef]
  63. Soufan, W.; Al-Suhaibani, N.A. Optimizing yield and quality of silage and hay for pea–barley mixtures ratio under irrigated arid environments. Sustainability 2021, 13, 13621. [Google Scholar] [CrossRef]
  64. Wang, S.; Yuan, X.; Dong, Z.; Li, J.; Shao, T. Effect of ensiling corn stover with legume herbages in different proportions on fermentation characteristics, nutritive quality and in vitro digestibility on the Tibetan Plateau. Grassl. Sci. 2017, 63, 236–244. [Google Scholar] [CrossRef]
  65. Goyal, M.; Tiwana, U.S. Ensiling Legume with Cereal Fodder Influences Quality of Silage Mixtures. Indian J. Anim. Nutr. 2016, 33, 228–232. [Google Scholar] [CrossRef]
  66. Halmemies-Beauchet-Filleau, A.; Rinne, M.; Lamminen, M.; Mapato, C.; Ampapon, T.; Wanapat, M.; Vanhatalo, A. Review: Alternative and novel feeds for ruminants: Nutritive value, product quality and environmental aspects. Animal 2018, 12, s295–s309. [Google Scholar] [CrossRef] [Green Version]
  67. Pampana, S.; Masoni, A.; Mariotti, M.; Ercoli, L.; Arduini, I. Nitrogen fixation of grain legumes differs in response to nitrogen fertilisation. Exp. Agric. 2018, 54, 66–82. [Google Scholar] [CrossRef]
  68. Galanopoulou, K.; Lithourgidis, A.S.; Dordas, C.A. Intercropping of faba bean with barley at various spatial arrangements affects dry matter and N Yield, Nitrogen Nutrition Index, and interspecific competition. Not. Bot. Horti Agrobot. Cluj-Napoca 2019, 47, 1116–1127. [Google Scholar] [CrossRef]
  69. Guevara-Oquendo, V.H.; Christensen, D.A.; Refat, B.; Rodriguez-Espinosa, M.E.; Feng, X.; Yu, P. Production performance and metabolic characteristics of cows fed whole plant faba bean silage in comparison with barley and corn silage. Can. J. Anim. Sci. 2022, 102, 145–154. [Google Scholar] [CrossRef]
  70. Dewhurst, R. Milk production from silage: Comparison of grass, legume and maize silages and their mixtures. Agric. Food Sci. 2013, 22, 57–69. [Google Scholar] [CrossRef] [Green Version]
  71. Huuskonen, A.; Pesonen, M. Performance and meat quality of Nordic Red and Aberdeen Angus bulls offered faba bean or field pea based whole crop legumecereal silages. Agric. Food Sci. 2016, 25, 1–12. [Google Scholar] [CrossRef]
  72. Castro-Montoya, J.; Dickhoefer, U. Effects of tropical legume silages on intake, digestibility and performance in large and small ruminants: A review. Grass Forage Sci. 2018, 73, 26–39. [Google Scholar] [CrossRef]
  73. Li, P.; Zhang, Y.; Gou, W.; Cheng, Q.; Bai, S.; Cai, Y. Silage fermentation and bacterial community of bur clover, annual ryegrass and their mixtures prepared with microbial inoculant and chemical additive. Anim. Feed Sci. Technol. 2019, 247, 285–293. [Google Scholar] [CrossRef]
  74. Wang, S.; Li, J.; Zhao, J.; Dong, Z.; Shao, T. Exploring the ensiling characteristics and bacterial community of red clover inoculated with the epiphytic bacteria from temperate gramineous grasses. J. Appl. Microbiol. 2022, 132, 177–188. [Google Scholar] [CrossRef]
  75. Li, H.; Zeng, T.; Du, Z.; Dong, X.; Xin, Y.; Wu, Y.; Huang, L.; Liu, L.; Kang, B.; Jiang, D.; et al. Assessment on the Fermentation Quality and Bacterial Community of Mixed Silage of Faba Bean With Forage Wheat or Oat. Front. Microbiol. 2022, 13, 875819. [Google Scholar] [CrossRef]
  76. Wang, S.; Shao, T.; Li, J.; Zhao, J.; Dong, Z. Fermentation Profiles, Bacterial Community Compositions, and Their Predicted Functional Characteristics of Grass Silage in Response to Epiphytic Microbiota on Legume Forages. Front. Microbiol. 2022, 13, 830888. [Google Scholar] [CrossRef]
  77. Nykänen, A.; Jauhiainen, L.; Rinne, M. Biomass production and feeding value of whole-crop cereal-legume silages. Agron. Res. 2009, 7, 684–690. [Google Scholar]
Figure 1. Herbage DM concentration as affected by MX mean effect (left) and SH × NF interaction (right). On the left, values are LSmeans across all treatments along with standard error estimate of the LSmeans since the design was unbalanced between the faba bean crop (n = 9) compared to the mixtures and the barley crops (n = 18). On the right, only data of the barley-containing treatments were used. Each point represents the arithmetic mean (n = 24) and its computed standard error.
Agronomy 12 01790 g001
Figure 2. Herbage CP concentration as affected by MX (left) and SH (right) mean effect. Values are LSmeans across all treatments along with standard error estimate of the LSmeans since the design was unbalanced between the faba bean crop (n = 9) compared to the mixtures and the barley crops (n = 18).
Agronomy 12 01790 g002
Figure 3. Herbage EE concentration as affected by MX mean effect (left) and SH × NF interaction (right). On the left, values are LSmeans across all treatments along with standard error estimate of the LSmeans since the design was unbalanced between the faba bean crop (n = 9) compared to the mixtures and the barley crops (n = 18). On the right, only data of the barley-containing treatments were used. Each point represents the arithmetic mean (n = 24) and its computed standard error.
Agronomy 12 01790 g003
Figure 4. Herbage ash concentration as affected by MX mean effect (left) and SH × NF interaction (right). On the left, values are LSmeans across all treatments along with standard error estimate of the LSmeans since the design was unbalanced between the faba bean crop (n = 9) compared to the mixtures and the barley crops (n = 18). On the right, only data of the barley-containing treatments were used. Each point represents the arithmetic mean (n = 24) and its computed standard error.
Agronomy 12 01790 g004
Figure 5. Herbage NDF (above), ADF (middle) and ADL (below) concentrations as affected by mean effect MX. Values are LSmeans across all treatments along with standard error estimate of the LSmeans since the design was unbalanced between the faba bean crop (n = 9) compared to the mixtures and the barley crops (n = 18).
Agronomy 12 01790 g005
Figure 6. Herbage TDN concentration (above) and RFV (below) as affected by MX (left) and SH (right) mean effect. Values are LSmeans across all treatments along with standard error estimate of the LSmeans since the design was unbalanced between the faba bean crop (n = 9) compared to the mixtures and the barley crops (n = 18).
Agronomy 12 01790 g006
Figure 7. Herbage WSC concentration (above) as affected by SH × MX interaction (left) and SH × NF interaction (right). Herbage WSC to CP ratio (below) as affected by SH × MX interaction (left) and NF mean effect (right). On the left, values are LSmeans across all treatments along with standard error estimate of the LSmeans since the design was unbalanced between the faba bean crop (n = 9) compared to the mixtures and the barley crops (n = 18). On the right, only data of the barley-containing treatments were used. Each point represents the arithmetic mean (n = 24) and its computed standard error.
Agronomy 12 01790 g007
Figure 8. Silage pH as affected by MX (left) mean effect and SH × NF interaction (right; values refer to the treatments with N fertilization). On the left, values are LSmeans across all treatments along with standard error estimate of the LSmeans since the design was unbalanced between the faba bean crop (n = 9) compared to the mixtures and the barley crops (n = 18). On the right, only data of the barley-containing treatments were used. Each point represents the arithmetic mean (n = 24) and its computed standard error.
Agronomy 12 01790 g008
Figure 9. Silage CP as affected by MX mean effect (right) and NF mean effect (left). On the left, values are LSmeans across all treatments along with standard error estimate of the LSmeans since the design was unbalanced between the faba bean crop (n = 9) compared to the mixtures and the barley crops (n = 18). On the right, only data of the barley-containing treatments were used. Each point represents the arithmetic mean (n = 24) and its computed standard error.
Agronomy 12 01790 g009
Figure 10. Silage ash concentration as affected by MX mean effect (left) and SH × NF interaction (right). On the left, values are LSmeans across all treatments along with standard error estimate of the LSmeans since the design was unbalanced between the faba bean crop (n = 9) compared to the mixtures and the barley crops (n = 18). On the right, only data of the barley-containing treatments were used. Each point represents the arithmetic mean (n = 24) and its computed standard error.
Agronomy 12 01790 g010
Figure 11. Silage NDF concentration (above) as affected by MX mean effect (left) and SH × MX interaction (right). Silage ADF concentration (middle) as affected by MX mean effect and SH × MX interaction. Silage ADL concentration (below) as affected by SH × MX interaction (left) and NF mean effect (right). On the left, values are LSmeans across all treatments along with standard error estimate of the LSmeans since the design was unbalanced between the faba bean crop (n = 9) compared to the mixtures and the barley crops (n = 18). On the right, only data of the barley-containing treatments were used. Each point represents the arithmetic mean (n = 24) and its computed standard error concentration was mostly reduced by reducing the fraction of barley in the mixture. Moreover, the variable was affected by the interaction SH × NF: unfertilized treatment.
Agronomy 12 01790 g011
Figure 12. Silage TDN concentration (above) and RFV (below) as affected by MX mean effect (left) and SH × NF interaction (right). On the left, values are LSmeans across all treatments along with standard error estimate of the LSmeans since the design was unbalanced between the faba bean crop (n = 9) compared to the mixtures and the barley crops (n = 18). On the right, only data of the barley-containing treatments were used. Each point represents the arithmetic mean (n = 24) and its computed standard error.
Agronomy 12 01790 g012
Figure 13. Silage WSC concentration (above) and WSC to CP (below) as affected by MX mean effect (left) and NF mean effect (right). On the left, values are LSmeans across all treatments along with standard error estimate of the LSmeans since the design was unbalanced between the faba bean crop (n = 9) compared to the mixtures and the barley crops (n = 18). On the right, only data of the barley-containing treatments were used. Each point represents the arithmetic mean (n = 24) and its computed standard error.
Agronomy 12 01790 g013
Figure 14. Silage tdNFC concentration as affected by MX mean effect (left) and SH × NF interaction (right). On the left, values are LSmeans across all treatments along with standard error estimate of the LSmeans since the design was unbalanced between the faba bean crop (n = 9) compared to the mixtures and the barley crops (n = 18). On the right, only data of the barley-containing treatments were used. Each point represents the arithmetic mean (n = 24) and its computed standard error.
Agronomy 12 01790 g014
Figure 15. Silage lactic acid concentration (above), acetic acid concentration (middle) and acetic to lactic acid ratio (below) as affected by SH × MX interaction (left) and SH × NF interaction (right). On the left, values are LSmeans across all treatments along with standard error estimate of the LSmeans since the design was unbalanced between the faba bean crop (n = 9) compared to the mixtures and the barley crops (n = 18). On the right, only data of the barley-containing treatments were used. Each point represents the arithmetic mean (n = 24) and its computed standard error.
Agronomy 12 01790 g015
Figure 16. Silage total volatile fatty acids concentration as affected by MX mean effect (left) and SH × NF interaction (right). On the left, values are LSmeans across all treatments along with standard error estimate of the LSmeans since the design was unbalanced between the faba bean crop (n = 9) compared to the mixtures and the barley crops (n = 18). On the right, only data of the barley-containing treatments were used. Each point represents the arithmetic mean (n = 24) and its computed standard error.
Agronomy 12 01790 g016
Figure 17. Canonical discriminant analysis (CDA) using standardized data with reciprocal correlation between −0.7 and +0.7 of traits studied in the herbage and silage mixtures and pure crops, fertilized (green) or not (red). Data on the left-handed panels report points as centroid mean across replicates (±S.E.) on the canonical axes (CA) 1 and 2 (upper panels) and CA1 and CA3 (lower panels). Projection of the original variables on the CAs are reported in right-hand panels and indicated with letters as follows: weight loss from the herbage to the silage (A); dry matter (DM) (g (100 g FM)−1) of the herbage (B); ether extracts (EE) (g (100 g DM)−1) of the herbage (C); neutral-detergent fiber (NDF) (g (100 g DM)−1) of the herbage (D); water-soluble carbohydrates (WSCs) (g (100 g DM)−1) of the herbage (E); WSC to CP ratio of the herbage (F); ether extracts (EE) (g (100 g DM)−1) of the silage (G); ash (g (100 g DM)−1) of the silage (H); neutral-detergent fiber (NDF) (g (100 g DM)−1) of the silage (I); acid-detergent fiber (ADF) (g (100 g DM)−1) of the silage (L); acid-detergent lignin (ADL) (g (100 g DM)−1) of the silage (M); water-soluble carbohydrates (WSCs) (g (100 g DM)−1) of the silage (N); propionic acid (g (100 g DM)−1) (O); butyric acid (g (100 g DM)−1) (P); isovaleric acid (g (100 g DM)−1) (Q); acetic acid to lactic acid ratio (R). The percentages of the total variance explained by each canonical axis are shown in brackets. Lines starting from “0;0” represent the vectors of each determinant (blue and continuous or hatched only for visualization purposes). Please note that the CDA vectors do not represent perpendicular directions through the space of the original variables. The unit of measure is the same for both axes (3.0 units) in all panels.
Agronomy 12 01790 g017
Table 1. F statistic and p-values of the general linear mixed model applied to the variables measured in the herbage. Factors were the stage of harvest (SH): early, mid and late; the mixtures (MX): pure fertilized or unfertilized barley and pure faba bean whole biomasses and their 75:25, 50:50, and 25:75 mixtures (MX); and the barley N fertilization (NF), either fertilized or not, nested into the mixtures since the pure faba bean was not fertilized.
SHMXSH × MXNFSH × NF
FpFpFpFpFp
Dry matter (DM) (g (100 g FM)−1)42.05<0.0001488.67<0.000122.63<0.00014.360.0046.58<0.0001
Crude protein (CP) (g (100 g DM)−1)8.230.0008794.19<0.00012.690.014531.72<0.000110.98<0.0001
Ether extracts (EE) (g (100 g DM)−1)0.110.900230.92<0.00012.060.05621.590.18923.980.0009
Ash (g (100 g DM)−1)19.1<0.00016.980.00011.920.075419.81<0.00016.06<0.0001
Neutral-detergent fiber (NDF)
(g (100 g DM)−1)
0.470.628129.760.00029.69<0.00011.310.28262.060.0649
Acid-detergent fiber (ADF)
(g (100 g DM)−1)
0.580.562927.66<0.00018.73<0.00012.720.03891.710.1178
Acid-detergent lignin (ADL)
(g (100 g DM)−1)
2.470.0942141.78<0.000113.52<0.00012.850.03431.740.1144
Total digestible nutrients (TDNs)
(g (100 g DM)−1)
28.34<0.000161.04<0.00015.77<0.00012.50.05332.370.0288
Relative Feed Value (RFV) (%)016.680.00027.77<0.00011.710.16181.910.0768
Water-soluble carbohydrates (WSCs) (g (100 g DM)−1)2.790.07053.950.019210.85<0.000122.4<0.00013.070.007
WSC to CP ratio76.690.072433.04<0.00015.86<0.000170.74<0.00016.65<0.0001
Hemicellulose (g (100 g DM)−1)0.330.718166.44<0.00015.5<0.00011.440.23260.860.5583
Cellulose (g (100 g DM)−1)0.210.810913.69<0.00019.35<0.00012.330.06801.570.1551
Truly digestible non-fibrous carbohydrates (tdNFC) (g (100 g DM)−1)0.860.43075.530.00699.25<0.00011.920.12392.720.0154
Table 2. F statistic and p-values of the general linear mixed model applied to the variables measured in the silage. Factors were the time of sampling (SH): early, mid and late; the mix (MX): pure fertilized or unfertilized barley and pure faba bean whole biomasses and their 75:25, 50:50, and 25:75 mixes (MX); and the barley fertilization (NF), either fertilized or not, nested into the mixture since the pure faba bean was not fertilized.
SHMXSH × MXNFSH × NF
FpFpFpFpFp
pHn.a <0.0001n.a <0.0001n.a<0.000135.69<0.000141.1<0.0001
Dry matter (DM) (g (100 g FM)−1)13.8<0.0001157.11<0.00014.410.00045.730.00073.680.002
Crude protein (CP) (g (100 g DM)−1)1.350.267307.53<0.00012.630.016410.68<0.00012.320.0321
Ether extracts (EE) (g (100 g DM)−1)4.630.01412.26<0.00012.160.04510.880.47950.490.8581
Ash (g (100 g DM)−1)16.540.17138.180.001118.53<0.000135.21<0.00015.96<0.0001
Neutral-detergent fiber (NDF) (g (100 g DM)−1)0.070.928687.6<0.00012.10.05213.610.01112.810.0112
Acid-detergent fiber (ADF) (g (100 g DM)−1)0.530.58996.340.0011.450.20024.270.00472.960.0085
Acid-detergent lignin (ADL) (g (100 g DM)−1)16.59<0.000173.41<0.000128.9<0.00017.52<0.00011.870.0837
Total digestible nutrients (TDNs) (g (100 g DM)−1)0.320.72656.340.0011.450.20024.270.00472.960.0085
Relative Feed Value (RFV) (%)0184.44<0.00011.140.3544.080.00592.550.0197
Water-soluble carbohydrates (WSCs) (g (100 g DM)−1)0.080.91934.160.00535.060.00016.540.00021.420.2109
WSC to CP ratio4.420.016819.45<0.00016.32<0.000111.32<0.00011.920.0762
Hemicellulose (g (100 g DM)−1)0.010.9864119.16<0.00013.520.00261.860.13215.95<0.0001
Cellulose (g (100 g DM)−1)0.040.962621.25<0.00015.6<0.00013.680.01062.450.0257
Truly digestible non-fibrous carbohydrates (tdNFC) (g (100 g DM)−1)0.320.72619.69<0.00014.410.00046.720.00022.90.0092
Lactic acid (g (100 g DM)−1)2.660.079232.6<0.00013.160.00565.410.00117.66<0.0001
Acetic acid (g (100 g DM)−1)1.360.451669.88<0.00017.25<0.00014.090.00636.99<0.0001
Propionic acid (g (100 g DM)−1)28.050.13233.160.05427.01<0.00010.310.86773.30.0046
Butyric acid (g (100 g DM)−1)26.31<0.000115.97<0.00012.130.04941.260.2983.480.0029
Isovaleric acid (g (100 g DM)−1)33.34<0.000149.66<0.000125.42<0.000110.62<0.00012.250.0376
Valeric acid (g (100 g DM)−1)324.83<0.000116.33<0.00019.2<0.00010.890.47751.340.2443
Acetic Acid to Lactic Acid ratio017.84<0.00010.880.53613.70.00983.590.0021
Total Volatile Fatty Acids (TVFA) (g (100 g DM)−1)2.360.10433.02<0.00012.360.03064.920.0026.7<0.0001
Table 3. Concentration (%) of butyric, isovaleric and valeric acids in silage as affected by MX and SH mean effects.
TreatmentButyric AcidIsovaleric AcidValeric Acid
Mixtures
H 1000.622 b0.244 a0.026 d.
H 75:25 V0.628 b0.189 b0.033 bc
H 50:50 V0.712 b0.050 c0.032 c.
H 25:75 V0.907 a0.026 c0.037 ab
V 1000.958 a0.032 c0.040 a.
Stage of harvest
Early 0.896 a0.181 a0.050 a
Mid0.849 a0.084 b0.037 b
Late0.551 b0.059 b0.014 c
Within a column, mean values followed by the same letter are not statistically different for p ≤ 0.05.
Publisher’s Note: MDPI stays neutral with regard to jurisdictional claims in published maps and institutional affiliations.

