Article

Remote Sensing Prescription for Rice Nitrogen Fertilizer Recommendation Based on Improved NFOA Model

1
Key Laboratory of Quantitative Remote Sensing in Agriculture of Ministry of Agriculture and Rural Affairs, Beijing 100097, China
2
Information Technology Research Center, Beijing Academy of Agriculture and Forestry Sciences, Beijing 100097, China
3
Faculty of Resources and Environmental Science, Hubei University, Wuhan 430062, China
*
Author to whom correspondence should be addressed.
Agronomy 2022, 12(8), 1804; https://doi.org/10.3390/agronomy12081804
Submission received: 23 June 2022 / Revised: 26 July 2022 / Accepted: 27 July 2022 / Published: 29 July 2022

Abstract

:
Precise fertilization of rice depends on the timely and effective acquisition of fertilizer application recommended by prescription maps in large-scale cropland, which can provide fertilization spatial information reference. In this paper, the prescription map was discussed based on the improved nitrogen fertilizer optimization algorithm (NFOA), using satellite and unmanned aerial vehicle (UAV) imagery, and supplemented by meteorological data. Based on the principles of NFOA, firstly, remote sensing data and meteorological data were collected from 2019 to 2021 to construct a prediction model for the potential yield of rice based on the in-season estimated yield index (INSEY). Secondly, based on remote sensing vegetation indices (VIs) and spectral features of bands, the grain nitrogen content (GNC) prediction model constructed using the Random Forest (RF) algorithm was used to improve the values of GNC taken in the NFOA. The nitrogen demand for rice was calculated according to the improved NFOA. Finally, the nitrogen fertilizer application recommended prescription map of rice in large-scale cropland was generated based on UAV multispectral images, and the economic cost-effectiveness of the prescription map was analyzed. The analysis results showed that the potential yield prediction model of rice based on the improved INSEY had a high fitting accuracy (R2 = 0.62). The accuracy of GNC estimated with the RF algorithm reached 96.3% (RMSE = 0.07). The study shows that, compared with the non-directional and non-quantitative conventional tracking of N fertilizer, the recommended prescription map based on the improved NFOA algorithm in large-scale cropland can provide accurate information for crop N fertilizer variable tracking and provide effective positive references for the economic benefits of rice and ecological benefits of the field environment.

1. Introduction

Rice cultivation occupies a crucial position in China’s food production. The area under rice cultivation in China is about 30 million ha, ranking the second largest in the world; rice production is the largest in the world and the second largest grain crop in China [1,2], accounting for 34% of the country’s total grain production. As the population increases and living standards improve, the demand for agricultural products continues to rise. More and more fertilizers are being used in China to obtain high yields [3]. Too much or too little inputs of nitrogen (N) fertilizer not only affects the yield and quality of rice but also causes a series of environmental problems such as water eutrophication and soil consolidation [4,5]. Therefore, how to achieve high-yield, high-quality rice through precise and efficient fertilization is a critical issue that needs to be urgently addressed in current rice cultivation and production.
Conventional N fertilizer management is often based on indoor chemical analysis and diagnosis, which requires a significant investment of human, material, and financial resources and is not conducive to widespread use. Remote sensing spectral detection technology, with its advantages of large detection range, non-destructive and timely monitoring, is increasingly used in the diagnostic analysis of crop N status and has played a major role in the accurate N fertilizer management [6,7]. Remote sensing imagery to obtain the spatial distribution of crop nutrient abundance and deficiency in the field is a prerequisite for implementing precision fertilization. Using remote sensing information to monitor the growth stress information of crops in the field, combined with crop fertilizer requirement models, a spatial map of fertilizer can be obtained. The current research on monitoring and prediction of N using satellite and UAV (Unmanned aerial vehicle) imagery is becoming more and more well-developed [8,9,10]. In recent years, there has been an increasing shift in fertilizer application models from active canopy sensors to imaged remote sensing imagery. Song et al. [11] used the imaging spectrometer PHI (Pushbroom Hyperspectral Imager) to study variable fertilizer application to wheat; Bonfil et al. [12] used VENμS and Sentinel-2 data for fertilizer tracking studies on wheat based on GEE (Google Earth Engine) platform.
Remote sensing-based fertilizer recommendation methods mainly include the leaf area index (LAI) N fertilizer management method, the N fertilizer regulation methods based on nitrogen nutrition index (NNI) [13], and the nitrogen fertilizer optimization algorithm (NFOA), etc. Wood et al. [14] first proposed the LAI N fertilizer management method for N fertilizer in wheat in 2003. In 2019, Li et al. [15] used the normalized difference vegetation index (NDVI) at the pulling stage for real-time estimation of LAI to calculate the amount of N chased for ear fertilization in double-season rice in Jiangxi (Southeast China). The amount of N applied by this method mainly depends on the difference between the measured value and the target value of LAI. Its uniformity is not high due to the influence of different soil types, soil fertility, climate, and ecological points of varieties. Justes et al. [16] established a critical N dilution curve for winter wheat in 1994 to determine the critical value of the N content of the plant, which was used to construct NNI to determine N content. Xue et al. [17] proposed in 2008 to calculate NNI by dividing the NDVI of the N application area by the NDVI of the optimal N application area for N fertilizer management in rice. Zhang et al. [18] constructed a model for predicting NNI based on vegetation indices (VIs) using a non-linear machine learning approach based on UAV imagery to accurately evaluate the N conditions of crops and provide a basis for guiding crop fertilization recommendations in different seasons. The above method of NNI is estimated based on crop growth and N concentration, the sensitivity of the test decreases significantly when the optimum N application is approached. Currently, most growth monitoring methods use spectroscopy. However, the application of this above method is not mature in the field of recommended fertilization and does not work well for the target crop species.
The NFOA algorithm uses NDVI measurements to predict potential crop yields and estimate crop N requirements and derives fertilizer applications based on the difference in potential yield before and after fertilizer application [19,20,21]. Initially, the NFOA algorithm was widely used for N fertilizer management in wheat [21,22,23], and subsequently in rice, maize, and cotton [24,25,26,27]. Now, the NFOA algorithm is widely used for accurate N fertilizer management. According to previous studies in rice, Xue et al. [17] found that the NFOA algorithm slightly increased yield by 0.4 t/ha with a 33.6% reduction in total N; Yao et al. [24] used GreenSeeker active sensors to calculate yield potential at the elongation and ears stages of rice to improve the productivity of some factors for farmers; Cao et al. [28] used Crop Circle ACS-470 to obtain NDVI to estimate in rice the predicted potential grain yield and the fertilizer response index (RI); and Lu [29] showed that the in-season estimated yield index and RI were able to explain 74–78% and 68–79% of the variation in the predicted potential grain yield and RI for harvested crops, respectively, using optimal rice VIs obtained from the RapidSCAN sensor in cold northeast China. The NFOA algorithm is one of the classic and most applied of the various remote sensing recommendation algorithms [29]. Most of the research that has been completed to apply the NFOA algorithm to accurate N fertilizer management in rice is based on the use of portable positive spectrometers and chlorophyll meters that is mainly based on active sensors, which obtain information about the crop at the point. Although the above method achieves non-destructive monitoring, it is still labor-intensive and difficult to apply on a large scale. Combining the classic and most applied NFOA model with UAV imagery, the flexibility of UAV to acquire imagery can be used effectively. Additionally, the principle is clear, simple to operate, and capable of generating fertilizer prescription maps, which are ideal for providing accurate fertilizer application recommendations in large-scale cropland.
The NFOA algorithm is simple in principle and easy to operate, but many of the parameters in the algorithm tend to use empirical constants, which are better suited for point-based canopy spectra. For the purpose of this study, we improved it to a surface-based fertilizer decision. The RI is an important input index for calculating crop fertilizer requirements in the NFOA algorithm and is calculated by taking the maximum value of NDVI directly from remote sensing images instead of yield. However, this approach tends to ignore possible excessive vigorous crop growth in the field. This paper uses the method of taking NDVI when calculating vegetation cover to solve the problems of image noise and vegetation vigorous growth when NFOA takes NDVI values. In addition, the grain N content (GNC) used in the NFOA algorithm is also a constant value, but in practice, the GNC should be a variable due to spatial differences in the fields. Currently, several works have used multiple linear regression, partial least squares, and artificial neural network (ANN) for remote sensing monitoring of grain protein content (GPC) by selecting sensitive spectral features for different fertility periods [30,31,32,33,34,35,36]. Since there is a strong correlation between GNC and GPC and a stable conversion relationship between them, the estimation of GNC can be achieved by monitoring GPC. By drawing on the ideas and methods of remote sensing monitoring technology for GPC, this paper attempts to establish a remote sensing prediction model for rice GNC by screening the spectral features of rice at key stages and combining them with Random Forest (RF) regression algorithms and to improve the determination of N values in the NFOA algorithm by obtaining the spatial distribution of GNC.
Currently, rice production patterns in China are moving northward [37]. As a typical geographical representative of northern rice, rice in Tianjin has been developing rapidly in recent years [38]. Therefore, this paper selects Tianjin rice as the research object of the N fertilizer recommendation prescription technology and uses multi-year remote sensing images and meteorological data. In this paper, the RI in the NFOA algorithm is improved by NDVI taking method, and the prediction model of GNC is constructed by using RF, which changes the empirical method of obtaining GNC in the previous NFOA. The improved NFOA optimizes the calculation method of key parameters, and then generates a recommended prescription map for rice N fertilizer application, to provide variable fertilizer application for rice precision variable operation. This will provide a reference for precise fertilizer application in rice.

2. Materials and Methods

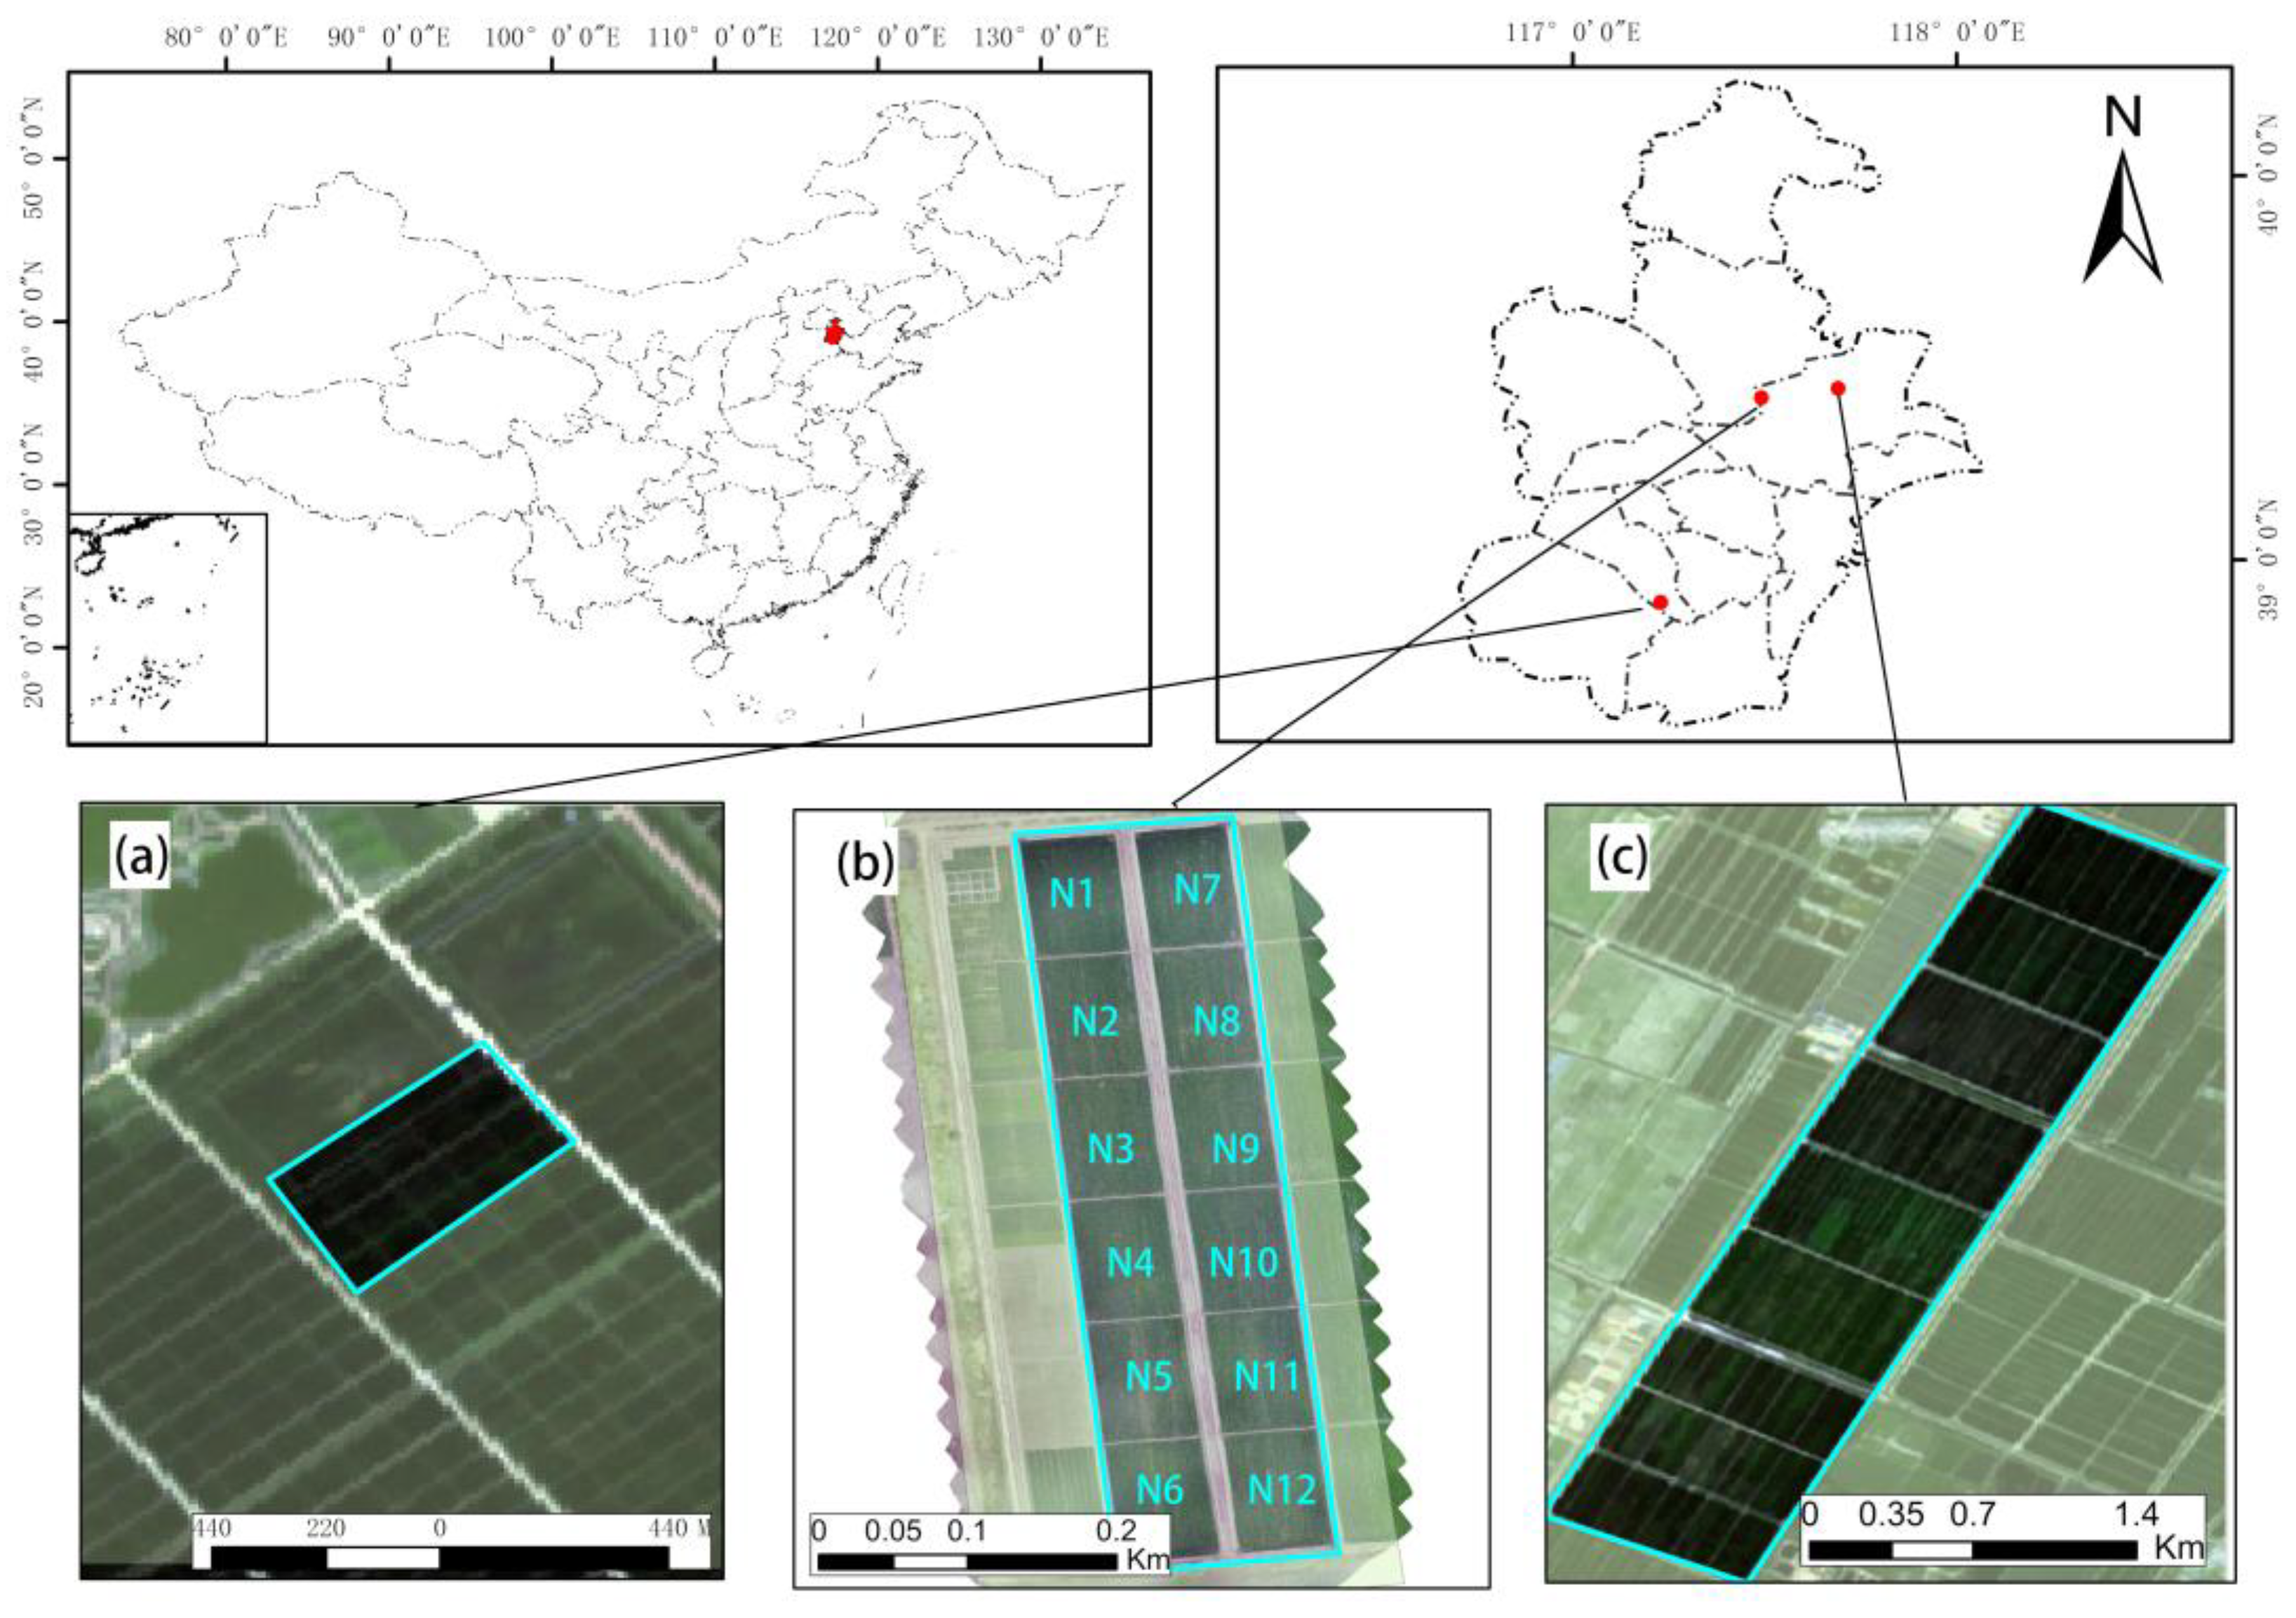
2.1. Overview of the Experiment Area and Experiment Design

The experimental plots are located in Ninghe District (117°18′ E, 39°09′ N) and Xiqing District (116°51′ E, 39°10′ N) of Tianjin, China, at an altitude of about 3 m above sea level. Tianjin is in the lower reaches of the Haihe River Basin, a typical impact plain. It is the confluence of five rivers—the North Canal, Yongding River, Daqing River, Ziya River, and South Canal—and the mouth of the sea, with a well-developed water system, numerous rivers, and lakes, and abundant groundwater resources. Near the Bohai Sea, the marine climate is influenced by the typical warm temperate semi-humid continental monsoon climate, with high temperatures and rain in summer and low temperatures and little rain in winter, with an average annual temperature of about 15 °C and annual precipitation of about 550 mm, mostly concentrated in summer. The type of soil in field experiments are tidal soil.
The experimental plot b (Figure 1b) in 2021 is the main experimental area, with a total area of 5.67 ha, located in the farm of the Tianjin Ninghe District Quality Agricultural Products Development Demonstration Centre, which is the main growing area for rice. The experimental plot b planted Jinyuan 89, a high yielding hybrid japonica rice, with transplanting dates of 12 May 2021. Six doses of N were set in the experimental plot b: a fertilizer mix of 23-13-6 was used at 600 kg/ha (N1, N7), 540 kg/ha (N2, N8), 480 kg/ha (N3, N9), 420 kg/ha (N4, N10), 360 kg/ha (N5, N11) and 300 kg/ha (N6, N12); there were six treatments and two replications. The rest of the fertilizers were the same. This experimental plot is the main plot used in this experiment.
The experimental plot a in 2020 (Figure 1a) in Xiqing District, Tianjin, where the main rice cultivar is grown was Jinyugeng 22, a japonica hybrid rice variety with a high yield and good taste, suitable for cultivation in Tianjin, and transplanting took place on 11 May 2020. The experimental plot c (Figure 1c) in 2019 in the original seed farm of the Tianjin Ninghe District Quality Agricultural Products Development Demonstration Centre, which planted Jinyuan U99 and transplanting took place on 11 May 2019. Experimental plot a and plot b were conducted for other purposes and only the growth status was collected in this study to predict potential yield.

2.2. Data Acquisition and Collection

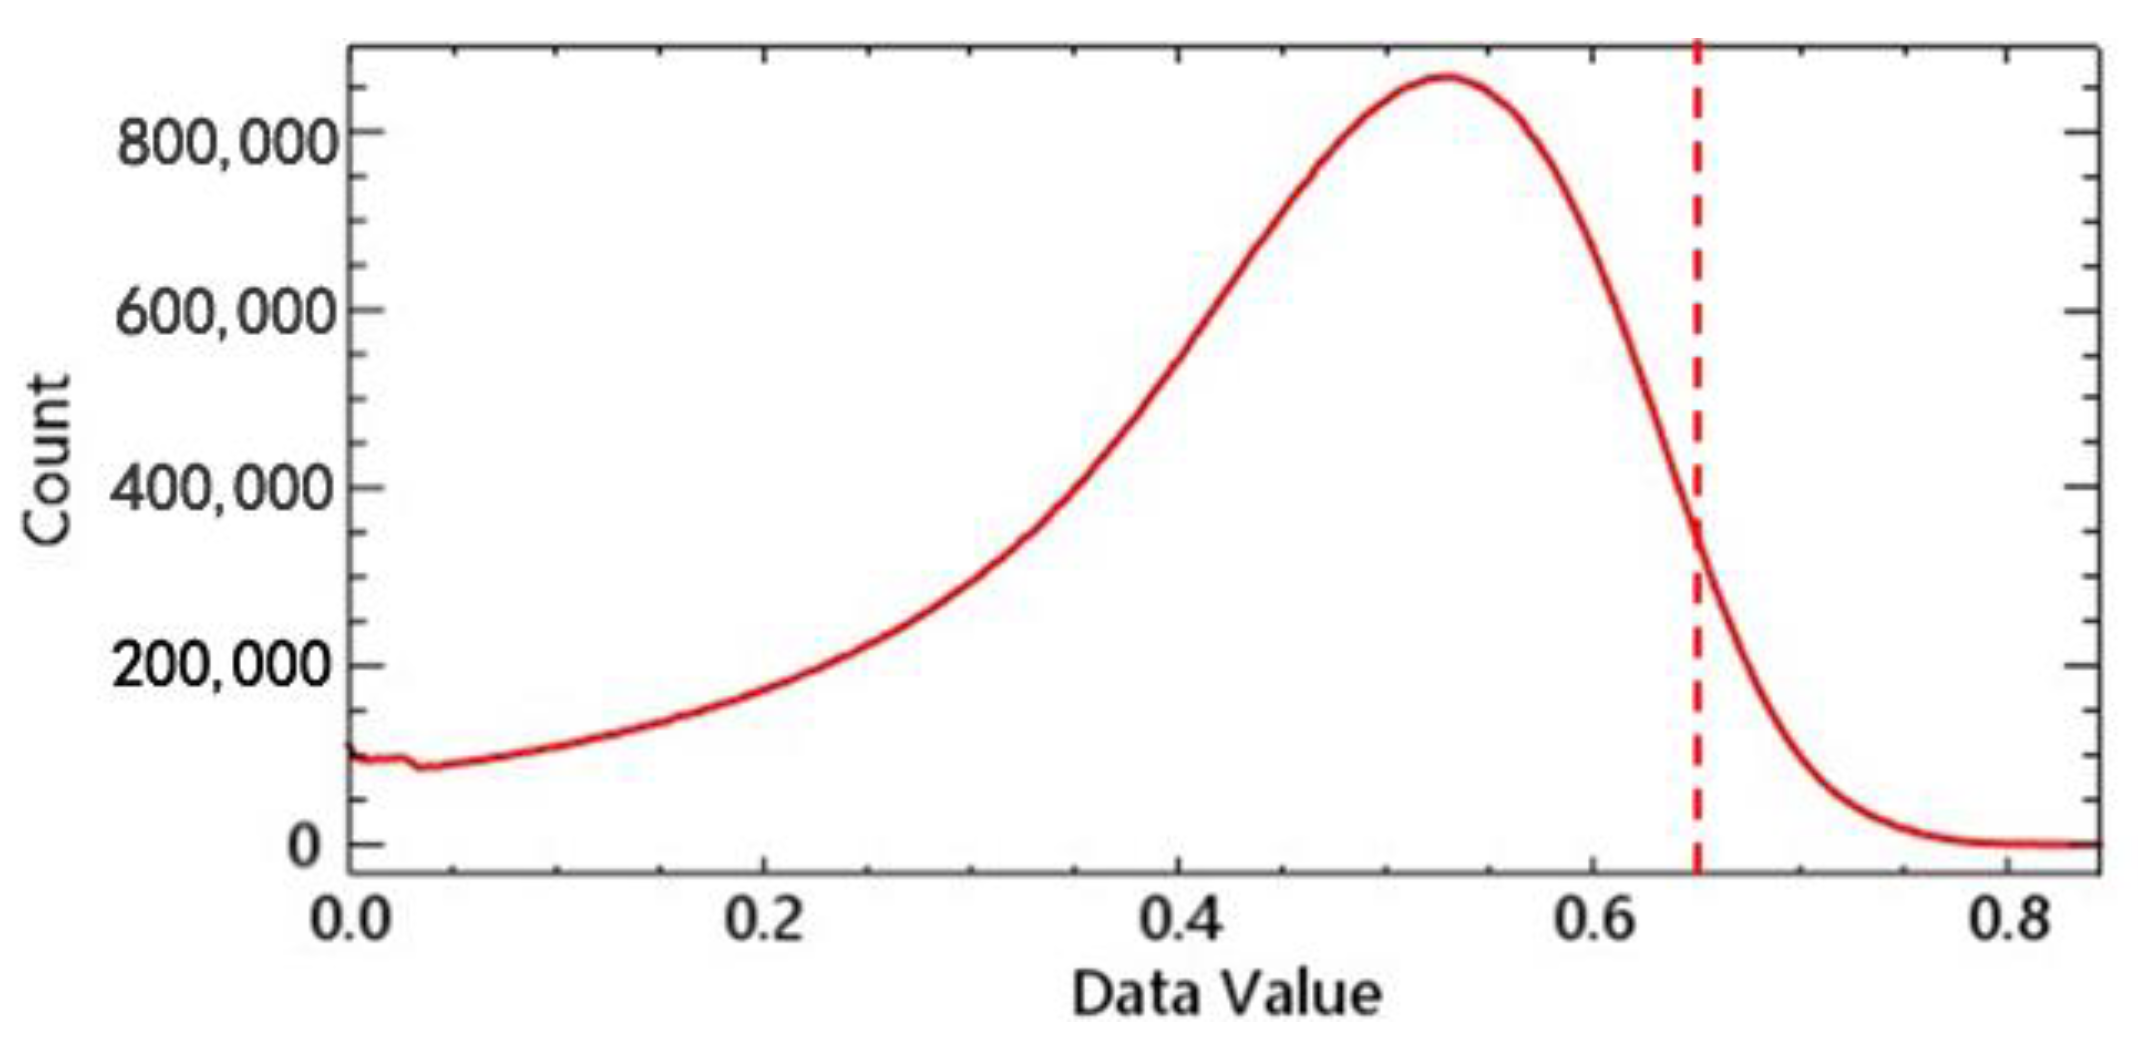
2.2.1. Sentinel-2 Data Acquisition and Processing
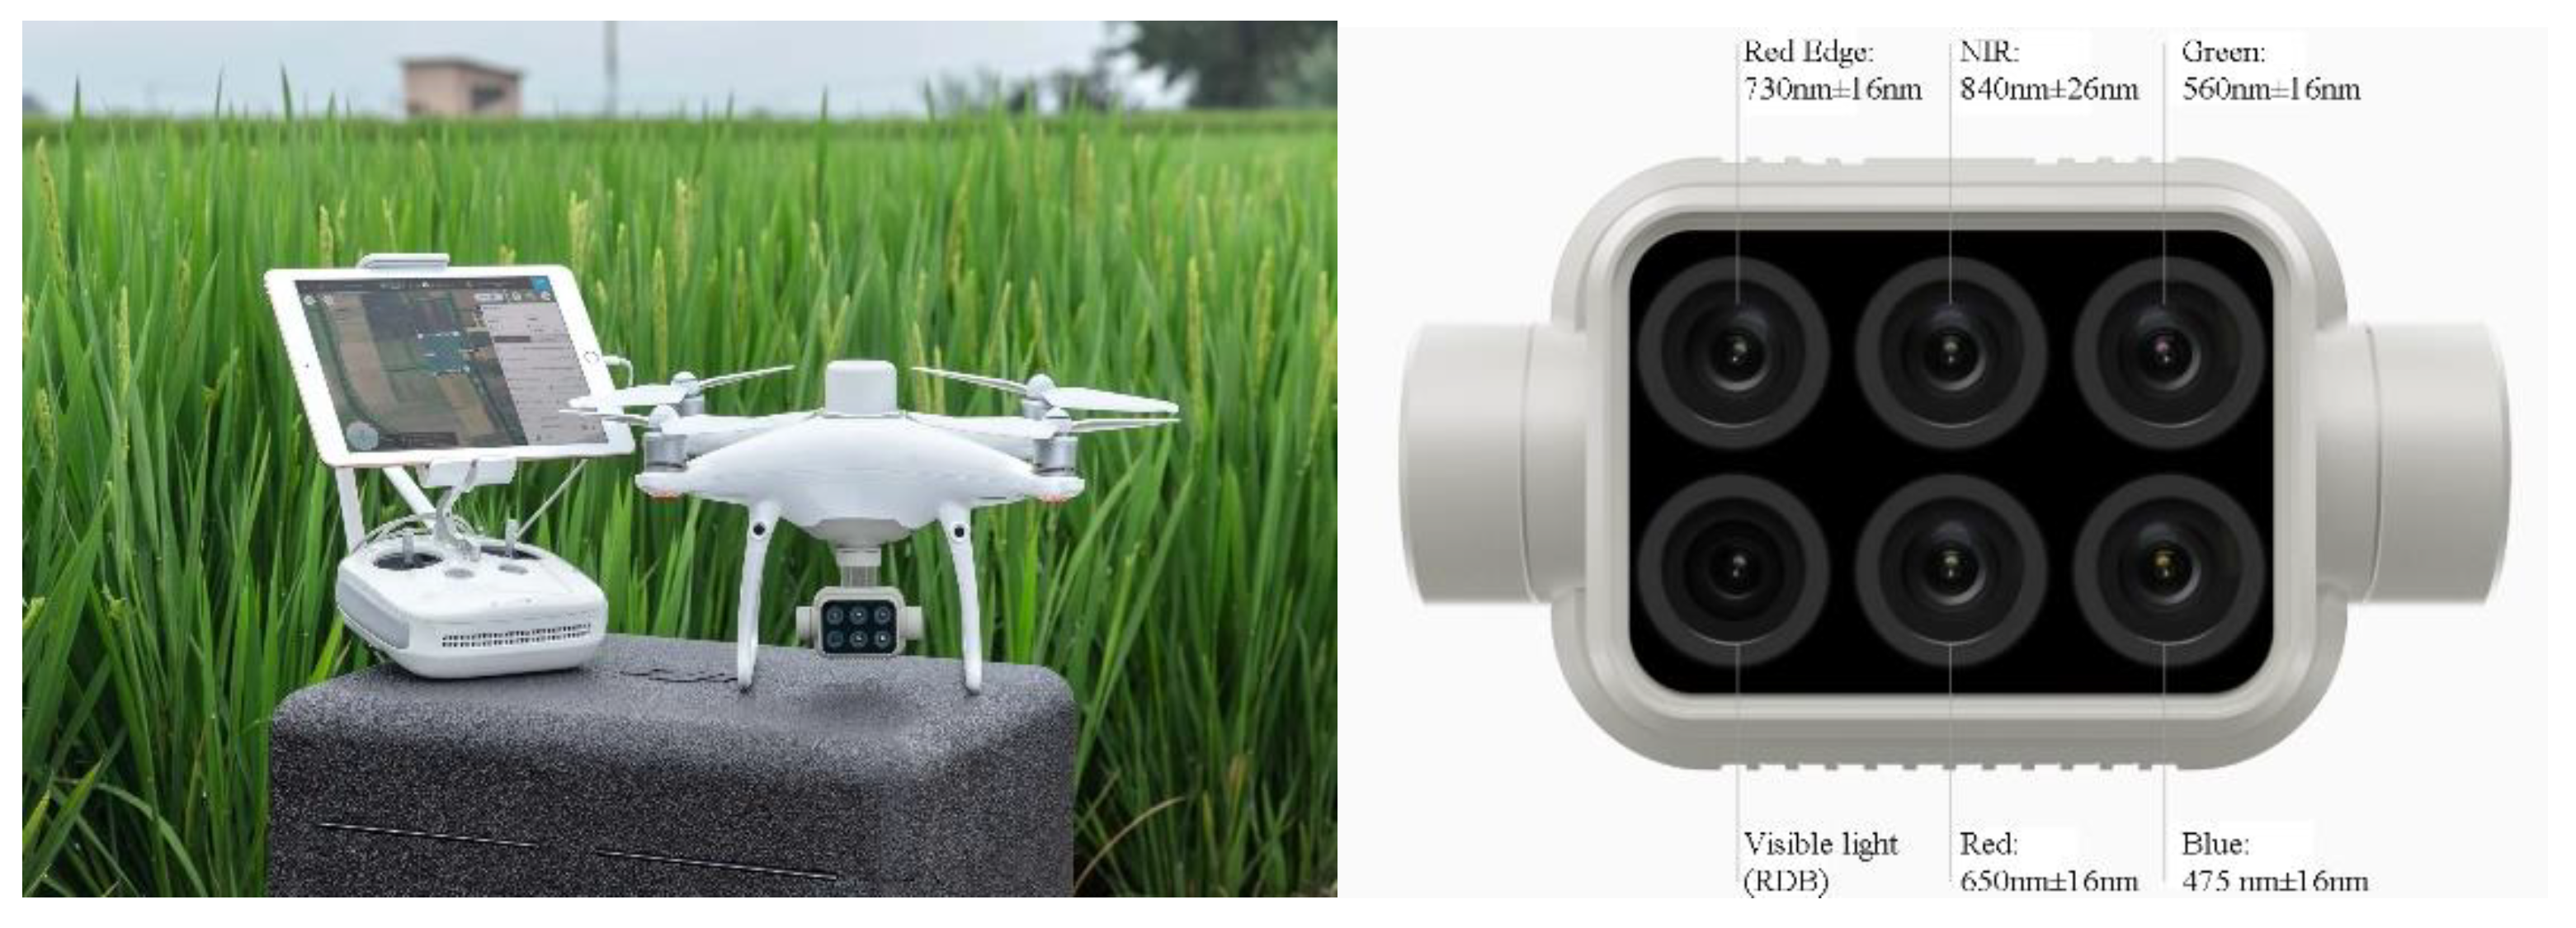
In this paper, images from the Sentinel-2 satellite (launched by ESA in 2015) were used, with product data acquired through Google Earth Engine (GEE) open cloud computing platform (https://code.earthengine.google.com, accessed on 30 December 2021). Sentinel-2 has a 5-day visitation period, an image width of 290 km, and a wavelength range from visible near-infrared to shortwave infrared. The Sentinel-2 Multispectral Instrument (MSI) samples 13 spectral bands: four bands at 10 m, six bands at 20 m, and three bands at 60 m spatial resolution. In this paper, we mainly use four bands, blue, green, red, and near-infrared (NIR) with a spatial resolution of 10 m (Table 1). The sending data are shown in Table 2, and the main parameters are shown in Table 2. In this paper, Sentinel-2 data were mainly used to obtain previous years’ rice NDVI values, which were used to calculate the potential yield prediction model.

2.2.2. UAV Data

The UAV multispectral remote sensing used is the Phantom 4 Multispectral (P4M) manufactured by DJI. The camera consists of six 1/2.9-inch CMOS sensors, including a color (RGB) sensor and five sensors for blue, green, red, red edge and NIR (Figure 2). The specific information of the sensors is shown in Table 3. The individual sensors have an effective pixel count of up to 2.08 million (2.12 million total pixels).
During the season of rice cultivation in 2021, a UAV was arranged to take images during the rice elongation period (5 July) in the experimental plot b in Tianjin (Figure 1b). The flight was conducted on a clear day between 10:00 and 13:00 local time, when the change in solar zenith angle was minimal and the flight altitude was maintained at 100 m above ground. A DJI Terra was used to stitch the collected data together and to radiation correct it. This was followed by a geometric correction based on the Global Positioning System (GPS) points collected in the field. Both the visible and multispectral cameras of P4M are of two-million pixels, with a ground resolution of 5.3 cm at 100 m. Compared with the traditional mode of acquiring remote sensing images by satellite, it can provide higher resolution and more time-sensitive data reference. UAV bands were used to calculate 23 vegetation indices (Table 4). The indices information contributed to the preparation of the GNC prediction model. In this paper, the improved NFOA is mainly used on UAV imagery and contains the maximum NDVI value selection, GNC prediction, and formation of fertilization maps.

2.2.3. Meteorological Data Acquisition

Meteorological data were mainly taken as daily average temperatures, maximum temperatures, and minimum temperatures. The data were obtained from national centers for Environmental Information (NOAA: https://www.ncei.noaa.gov/maps-and-geospatial-products, accessed on 2 December 2021). A total of daily mean temperature, daily maximum temperature, and daily minimum temperature were collected from two meteorological stations within Tianjin from 2019–2021.

2.2.4. Agronomic Parameters Acquisition and Processing

After collecting spectral data at the three most important developmental stages of rice growth and development (elongation, booting and filling stage), a total of 12 plants were destructively taken from 4 × 3 holes at the elongation stage and 8 plants from 4 × 2 holes at the booting and filling stage of the plot for measurement. The rice plants were removed from the roots, washed with water, the roots were cut off with scissors and the washed samples were separated into leaves and stems (ears), placed in an oven at 105 °C for 30 min to inactivate the enzyme, then dried at about 80 °C to a constant weight and weighed for dry weight. The N content of the leaves and stems (ears) was determined using the Kjeldahl method.
Yield measurements are carried out mainly between late September and early October each year, when a 0.6m × 0.6m area of mature rice is selected in each plot and placed in a net bag. After threshing, the weight of the sample rice and the moisture content of the sample rice are measured, and after hulling, GNC and GPC are measured.

2.3. Nitrogen Fertilizer Recommendation Model Construction Method

The NFOA uses spectral information to estimate the difference between potential yield without N fertilizer (YP0) and yield potential with N fertilizer (YPN), combined with GNC and N fertilizer utilization to estimate the N requirement of rice.
The in-season estimated yield index (INSEY) can be considered as an estimate of average daily growth rate or biomass production from the time of planting to the day of sensing. It was calculated from the ratio of NDVI to by the growing degree days (GDD) > 0 from transplanting to sensing. GDD is a temperature-based index, which is the sum of temperatures effective for crop growth and development and represents the amount of heat accumulated during the growing period, which is directly related to the growth rate and reproductive stage of the plant. GDD > 0 minimizes the effect of INSEY on the number of days the plant is active, eliminating the effect of days when the crop is unlikely to grow, which can vary significantly from site to site and from year to year. The formula for calculating GDD is as follows:
GDD = ( T m a x + T m i n ) 2 T b
where T m a x and T m i n are daily maximum and daily minimum temperatures (°C) and T b is the crop development base temperature, which is 12–15 °C for rice [24], 13.5 °C was chosen here.
I N S E Y = N D V I D A T
D A T is the number of days with GDD > 0 between transplanting and observation I N S E Y is the in-season estimated yield index.
Y P 0 = a * exp ( b * I N S E Y )
YP0 is the predicted potential grain yield, and a and b are parameters obtained by calibrating rice yields using I N S E Y values.
R I H a r v e s t = Y l d N R i c h Y l d F i e l d R a t e
R I = N D V I r i c h N D V I
R I H a r v e s t [55] is the fertilizer response index for harvested crops in the NFOA algorithm. It is calculated by dividing the maximum yield of fertilized fields ( Y l d N R i c h ) by the yield of unfertilized fields ( Y l d F i e l d R a t e ) to determine the fertilizer requirement and response for a given year. The in-season R I is the crop response index to N, using NDVI instead of yield, and is calculated in the same way as R I H a r v e s t . N D V I r i c h is the maximum NDVI value on N fertilized fields.
Y P N = Y P 0 * R I
Y P N is the yield of the added N fertilizer. The influence of noise inevitably exists in the image when selecting N D V I r i c h   and may produce too high NDVI values. In this paper, reference is made to the method of taking NDVI values of vegetation cover surfaces by the fractional vegetation coverage (FVC) formula. In previous studies [56,57] of vegetation cover, NDVI values with a cumulative frequency of 95% were taken when selecting NDVIveg (NDVI values of all vegetation covered areas) to avoid errors caused by image noise. In this paper, the NDVI value with a cumulative frequency of 95% was taken as N D V I r i c h , where N D V I r i c h = 0.65, in the field treated with N enrichment and on the cumulative NDVI statistics table synthesized at tillering and elongation stages (Figure 3).
R = N % Y P N Y P 0 N U E
R is the N requirement, N% is the average GNC and NUE is the N fertilizer utilization rate. According to Ling et al. [58], the in-season N fertilizer utilization rate of high-yielding fields ranged from 38% to 45.7%, with an average of 42.45%, where high yields need to be achieved and the generally calculated parameter value is 40% N fertilizer utilization rate, so NUE = 40% in this paper.
There are two main sources of N in the seeds, 70–80% is stored in the above-ground organs of the plant before flowering; before flowering the other 20–30% is reabsorbed from the soil by the plant roots after flowering. In this study, the N mean GNC in Equation (7) was selected by RF based on UAV multispectral data at tillering stage and a RF regression model was developed to predict GNC.

2.4. Estimation of Production Material Costs

After a market survey, the price of Jinyuan 89 was about 2.68 yuan/kg and the price of urea (46%) was 2 yuan/kg.
Saving   amount = U f a r m × p r i c e U N F O A × p r i c e
Saving   amount is the cost of urea application savings from using the improved NFOA. U f a r m is the amount of urea used for empirical farm management. U N F O A is the amount of urea used for improved NFOA. p r i c e is the unit price of rice.

3. Results

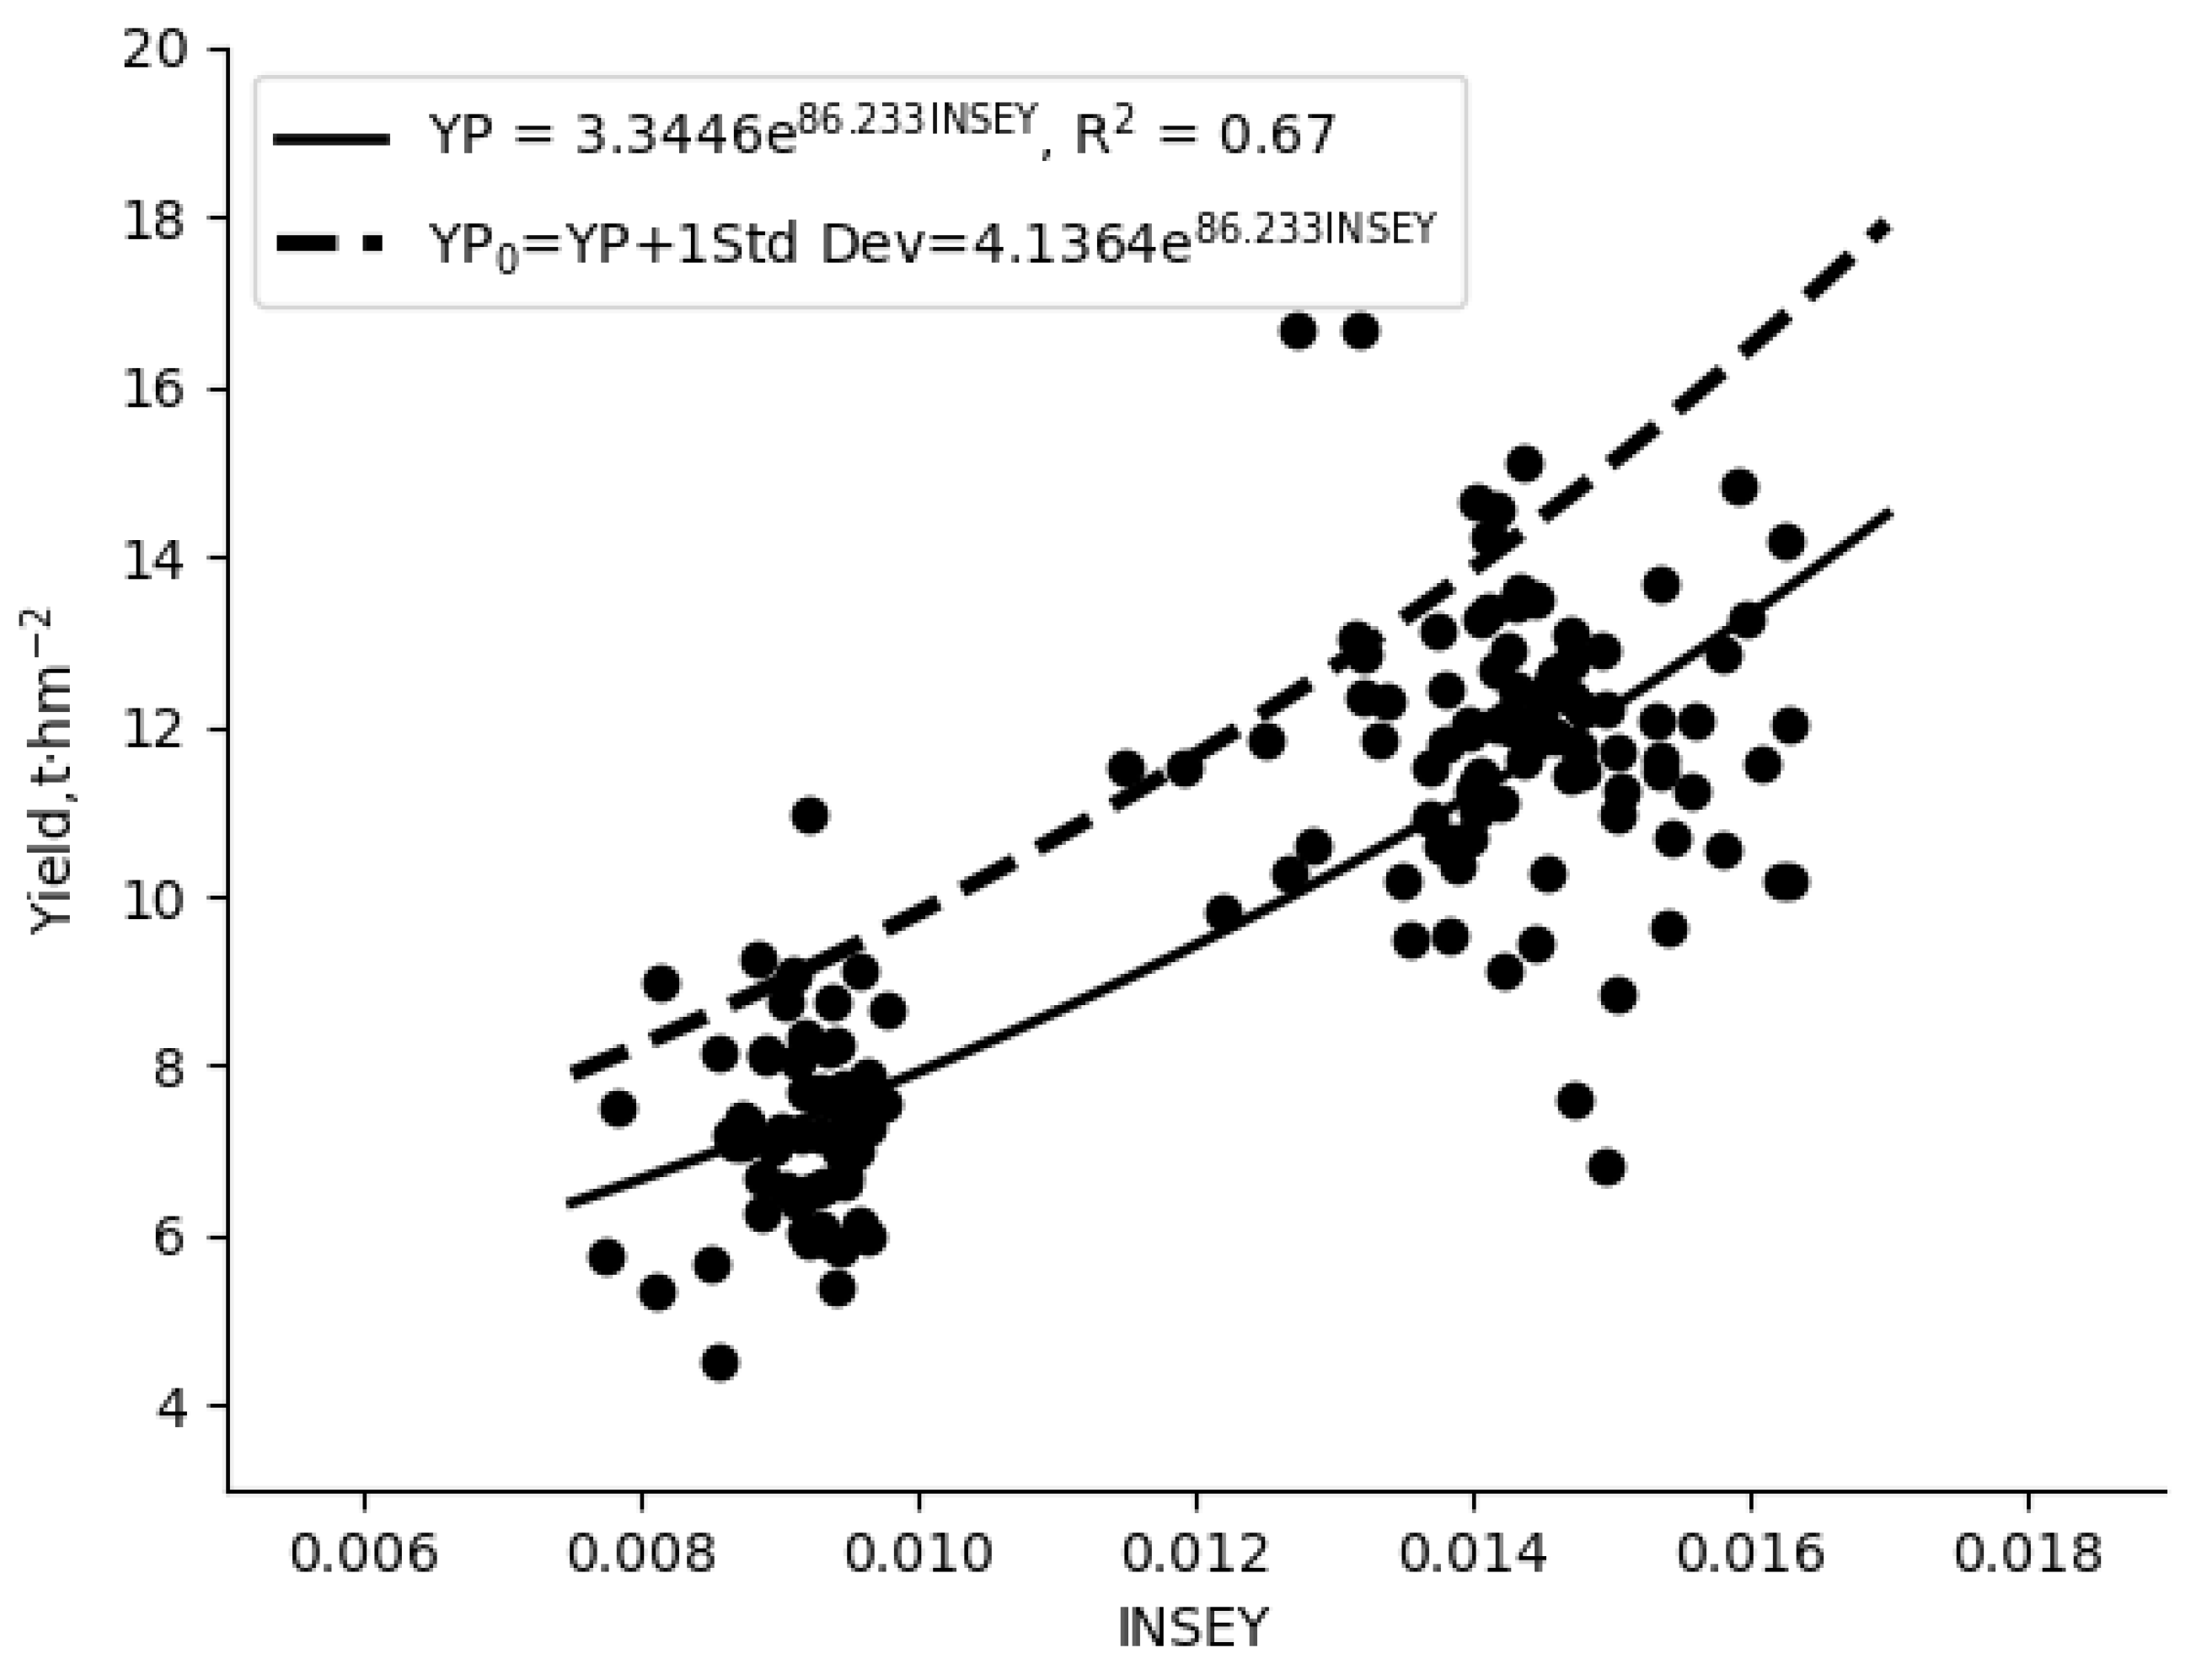
3.1. Construction of a Potential Yield Prediction Model

The NFOA depends on the ability to estimate crop N requirements in the early growth (INSEY) [59]. An estimate of yield potential is provided by dividing the observed NDVI (derived from satellite data) by the number of days from transplanting to the test period, essentially the early growth rate or daily biomass production. The proposed DAT is the number of days of effective growth rate in early rice.
Based on Equation (1) and the resulting meteorological data for 2019–2021, the number of days with GDD > 0 between transplanting and observation, DAT, was calculated as shown in the Table 5 below.
The potential yield estimation model is one of the most fundamental models in the NFOA, which considers the growth stages of rice from transplanting to the growth phase of the fertilizer follow-up period and predicts the yield level that rice can achieve based on the growth rate. Firstly, three years (using three images, one for each year) of Sentinel-2 data were obtained (see Table 1 for details). A total of 150 GPS points of the sample points were superimposed on the Sentinel-2 images. These sample points were collected in experimental plot c for 2019, experimental plot for 2020, and experimental plot b for 2021. According to the location of each sample point, 5 × 5 pixels centered on the sample point were taken, and the average of these 25 pixels was taken as the spectral information of that sample point. What is more, a regression model of the exponential function Y P 0 was developed based on the current season’s estimated yield index INSEY obtained from NDVI and DAT, with three years of yield, as shown in Figure 4. A total of three years of INSEY and yield data for high-yielding rice were used to develop the model, comprising three varieties of high-yielding japonica rice in Tianjin and three growing seasons, for a total of 150 samples. The better fit (R2 = 0.67) of the exponential curve (solid line) in the figure strongly supports the argument that INSEY can predict potential yield.
There are many uncontrolled natural variables, such as rainfall, effective cumulative temperature, and soil conditions, that may adversely affect this relationship from the start of transplanting to the date of remote sensing observations. Additionally, given that this potential yield may not be realized due to the possibility of weed infestation and pests and diseases during the growing season, both natural variables and acquired factors may reduce INSEY’s prediction of potential yield. Therefore, the actual yield prediction curve (solid line) will underestimate the potential yields at the date of the observation. To correctly predict the potential yield, the actual yield is reduced by the fact that this selection is not subject to poor posterior growth conditions. Following the methods of Raun et al. [21] and Zhang et al. [23], they finally obtained a predictive model of INSEY and potential yield by doubling the standard deviation of the predicted yield and then adjusting the constant of the exponential model in Equation (9). In this experiment, if the predicted potential yield is doubled by the standard deviation, the final model of potential yield is the dashed line.
Considering many acquired factors (precipitation, temperature, pests, diseases, etc.), this curve is a more realistic representation of the achievable potential yield of high-yielding japonica rice in the Tianjin area, and the validation results are good (R2 = 0.62, Figure 5) for predicting the potential yield model of rice:
Y P 0 = 4.1364 * e x p 86.233 * I N S E Y

3.2. Construction of a Model for the Prediction of Grain Nitrogen Content

The current yield-based NFOA is based on setting a target yield at the beginning of the rice growing season based on the average GNC and NUE to estimate N fertilizer requirements. Since the empirical average GNC is subject to large errors, this experiment is based on RF regression and uses spectral image features during the fertilization period to predict GNC. Calculation results of 23 VIs based on UAV data, many have been shown to be related to N monitoring or have a high correlation with GPC at all fertility stages, mainly ratio vegetation index (RVI) [31], difference vegetation index (DVI) [31], NDVI [31], green normalized difference vegetation index (GNDVI) [34], and normalized difference green/blue plant pigment ratio (PPR) [32]. So, the GNC prediction model has 23 VIs (Table 4) and five spectral bands of the multispectral UAV involved.
A total of 24 sample points were measured for GNC during the harvest period in experimental plot b, and because of the small number of samples, the k-fold cross validation method was chosen to divide the training and testing sets. The original data set was randomly divided into k mutually exclusive sets (k = 10 in this study), and each iteration used k−1 sets as the training set and the remaining individual as the testing set. The process is repeated k times and the final result is the mean of k times. This method is subject to use in cases where the sample set is small and each sample can be used for calibration and validation, reducing the effect of a single random partition on the model.
RF has a strong advantage in classification and regression in small samples. Using RF to be able to calculate the characteristics of the importance of individual variables, four important variables, green, structure intensive pigment index (SIPI), red, and PPR, were selected from 28 characteristic variables for RF regression. The final model result accuracy was 96.3%, the root mean square error (RMSE) was 0.07, and the mean absolute error was 0.07 degrees. The RF regression model based on the four characteristics of green, SIPI, red, and PPR at the tillering or elongation stage was effective. This result shows that the four spectral features of green, SIPI, red, and PPR at the tillering or elongation stage can be used to predict the GNC at maturity.

3.3. Fertilization Recommendations at Field Scale

According to the above method, the difference between YP0 and YPN was calculated based on NDVI, and finally, the GNC was obtained by RF regression and then combined with NUE to calculate the rice N requirement for the season. In this paper, the multispectral data of the elongation stage were obtained and NDVI was calculated by using multispectral UAV imagery on 5 July 2021 in experimental plot b. A total of 54 days of GDD > 0 were found from rice transplanting to the observation period according to meteorological data in 2021. Then, Y P 0 was obtained using Equation (9). The recommended fertilizer prescription map is based on the above improved NFOA (Figure 6).
The experimental plot b will apply the last additional N fertilizer (urea, 46% N in urea) after 14 July, and based on the farm’s fertilization experience, the last N fertilizer addition is 105 kg/ha of urea per field, which means that the last additional pure N fertilizer is 48 kg/ha. The recommended fertilizer prescription map shows that most of the areas were recommended to apply fertilizer within 20 kg N/ha, and a few were around 50 kg N/ha. Among them, N6 and N12 fields had the least N requirement, most of them were in the range of 0–5 kg N/ ha and a few were in the range of 10–30 kg N/ha; N1 and N7 require more N fertilizer than N6 and N12. Figure 6 clearly shows that the four fields N5, N8, N9, and N10 have more yellow and red colors, which means that most of the N demand is 30–100 kg N/ha. If the uniform fertilizer application of 48 kg N/ha is followed, there will be over and under cases, and most of them are over cases, which will not only not improve the quality and yield, but also increase the input ratio and intensify the environmental pollution. There are fewer areas in the North China Plain where rice is grown, while Tianjin is very suitable for mechanical cultivation because of its abundant water resources, suitable temperature, and flat terrain. Currently, Tianjin has a significant yield of japonica rice and there is not a very suitable and replicable fertilizer application program. The findings of the study here may provide a blueprint for local farms to carry out subsequent farming and provide suggestions for the government to establish intelligent farms.

3.4. Comparison of Improved NFOA and Farm Experience Fertilizer Application in Terms of Economics

Based on the recommended fertilizer prescription maps obtained in experimental plot b, a market survey and calculations were performed to obtain the economic benefits of the improved NFOA. The price of Jinyuan 89 was about 2.68 yuan/kg and the price of urea (46%) was 2 yuan/kg. Based on the average NDVI values of each field and Equation (8), the forecast income and fertilizer expenditures were calculated for each field (Table 6). The results showed that yields based on the predictions could basically reach more than 30,000 yuan/ha. Additional urea at this stage, in the fields N1 and N7 with the highest fertilizer application in the substrate, requires only about 60 yuan/ha for subsequent fertilizer follow-up according to the algorithm in this paper. Empirical farm management would follow up with 105 kg of urea per hectare at this stage, which means it would cost 210 yuan/ha and would save about 150 yuan/ha. It shows that this method can reduce the production cost and increase the net income of rice.

4. Discussion

This paper attempts to combine the spectral information from a multispectral UAV imagery with the NFOA method to study the fertilization program of high-yielding japonica rice in Tianjin. Firstly, a potential yield prediction model for high-yielding japonica rice in Tianjin was constructed using INSEY gained from NDVI calculations of Sentinel-2, and three years of ground truthed yield data. Secondly, the first four important feature parameters were selected using the RF algorithm based on the spectral characteristics of the tillering or elongation stages. The GNC prediction model was constructed from them. This model was applied to the NFOA algorithm to calculate the N demand. Finally, the improved NFOA for Tianjin high-yielding japonica rice was combined with UAV imagery to create a fertilizer prescription map, which provided a fit and quantitative fertilizer application plan for Tianjin high-yielding japonica rice. It was found that: (1) the accuracy of the index model Y P 0 , which was established by INSEY at the elongation stage, was high, with its R2 = 0.67 for a total of 150 samples in three years and its R2 = 0.62 after adjusting the constant a. The accuracy of the potential yield prediction model for rice calculated by Yao et al. [24] and the accuracy of the potential yield prediction model for wheat obtained by Lukina et al. [19] was similar to the accuracy of the model in this paper. Comparison with the results of previous studies shows that the potential yield prediction model obtained in this paper based on Sentinel-2 has good accuracy and feasibility. (2) In the NFOA algorithm, the N D V I r i c h value, which is the maximum NDVI value of the field crop, needs to be selected when calculating RI. According to the method for studying vegetation cover, the value of 95% of the cumulative histogram of NDVI is selected to avoid image noise and vigorous crop growth. In the study of vegetation cover, the NDVImax (NDVI maximum values) and NDVImin (NDVI minimum values) are often selected at 95% and 5% of the cumulative probability of NDVI values covering the ground surface based on the FVC formula. Zhang et al. [57] used the NDVI values of TM images to calculate the meadow cover of Wugong Mountain, and the value at 95% of the cumulative probability was selected as NDVImax when calculating the FVC, Yue et al. [56] Based on GEE platform, when calculating FCV using Landsat 5 Thematic Mapper (TM), Landsat 7 TM, and Landsat 8 Operational Land Imagery (OLI) data, the NDVI value at 95% accumulation frequency is also selected as NDVImax, and this reference is feasible. (3) Some scholars [31,32] have strongly demonstrated the prediction of GPC by the spectral characteristics of each growth period. GPC = protein coefficient of rice * GNC. In this paper, we used the RF to calculate important features and obtained four important feature variables (green, SIPI, red, and PPR) from 23 VIs and five multispectral bands for RF regression with model accuracy = 96.3% and RMSE = 0.07. Zhang et al. [33] used ANN regression to predict rice grain protein with RMSE = 0.39 and the best partial least squares regression (PLSR) to predict rice grain protein with RMSE = 0.21. In comparison with the results of previous studies, the use of RF regression to predict GNC is feasible. (4) The obtained potential yield prediction model and GNC prediction model were used to calculate the fertilizer follow-up demand, and then the UAV multispectral data were used to obtain the recommended prescription map of fertilizer follow-up at the field scale. Through the map and market surveys, an assessment of the economic effects of an improved NFOA was obtained. By calculating the amount of fertilizer savings, the improved NFOA is meaningful and valuable for farm fertilization. Based on the above findings, an improved NFOA model was obtained. Additionally, the accuracy of the potential yield model was improved compared with the original NFOA. The original method of taking NDVI polar values when calculating RI is better applied to active sensors. At the same time, this paper selects NDVI values with a cumulative frequency of 95%, which effectively changes the image noise and applies to imaging remote sensing data. The original NFOA algorithm to obtain GNC is the average value of the plot or previous experience, this paper uses RF to establish a GNC prediction model to predict the GNC by the growth potential, more suitable for calculating the recommended prescription map of fertilizer. In agricultural machinery-based rice farms such as Tianjin, UAV pesticide spraying and UAV fertilizer application have become very common, and high-yielding japonica rice in Tianjin in the North China Plain is a case of suitable water and fertilizer conditions, government support, and good application of agricultural machinery but lack of fertilizer guidance. This study is just to provide a reference for the current fertilizer chasing program of high-yielding rice in Tianjin. Combining with UAV imagery fertilizer tracking improves the shortcomings of satellite remote sensing which is affected by weather, time, and resolution, and provides a reference for the future development of smart farms.
Usually, only one surface application is generally recommended in spectrally directed N fertilization methods including NFOA, as these methods are mainly applicable to dryland crops such as wheat and maize [60]. In the case of rice crops, the applied N fertilizer will be mainly lost by runoff and leaching, etc., resulting in higher N losses. N fertilization of rice crop is generally divided into three applications: basal fertilizer, tiller fertilizer, and spike fertilizer. The main purpose of tiller fertilizer is to promote early tillering and more tillering. Spike fertilizer, on the other hand, needs to be chased reasonably according to the specific growth of rice. Tiller fertilizer may also be applied in multiple phases during the tillering period. For the earlier time, rice is not yet well grown, the leaf area is relatively small, and it is easy to receive the influence of water reflection, which is very unfavorable for spectral information collection. The best situation to be able to use spectral information such as NFOA to target N fertilizer follow-up is only spike fertilizer, so this method cannot target quantitative calculation of all times of N fertilizer spreading in rice. In addition, soil fertility and fertilizer concentration can affect the growth of rice. For example, the N6 and N12 plots in this study had the least amount of basal fertilizer, but the good growth resulted in a calculated N requirement of less than 20 kg/hm2, which is most likely due to the high soil fertility. Therefore, the application of the scheme studied in this paper to all N fertilizer spreading recommendations for rice needs further study. Moreover, the NDVI values of Sentinel-2 were used in this paper for the prediction of potential yield, and finally, the fineness of future fertilizer application in large rice field blocks was used in the UAV fertilizer tracking prescription map. Although Sentinel-2 data and UAV data are two types of data with different spatial resolutions, Sentinel-2 data are only used to build potential yield prediction models and take NDVI to mean values, Sentinel-2 data, and UAV data are mean-to-mean comparisons to minimize the errors caused by spatial resolution. In addition, the experimental plots in this study have a single crop type and, fewer mixed pixels, resulting in fewer errors. So, the data limitation caused by the lack of drone data in previous years is a trouble that can be avoided, and the same type of data will be used as much as possible in the future. Finally, according to the previous study, GNC correlated the highest with N content around the flowering stage. However, in this study, the next fertilizer application could only be guided based on the growth at the elongation stage. Therefore, the machine learning approach to directly predict the GNC at maturity may also have low applicability. The next step of the experiment could be to change other regions and other periods for further prediction of GNC to improve the generalizability and validity of the method.

5. Conclusions

Based on remote sensing images and the improved fertilizer application method NFOA, supplemented with meteorological data, the recommended prescription map of N fertilizer application was carried out for rice in Tianjin. The shortcomings of the NFOA method, which is only suitable for point-to-point mean fertilizer application and localized fertilizer application, are improved. Combining with UAV multispectral data makes the NFOA algorithm better suitable for face-to-face field fertilization, which can be used for guidance of UAV field fertilization. The results show that: (1) the accuracy of fitting the potential rice yield prediction model based on the 2019–2021 INSEY with the actual yield is good with R2 = 0.67; the adjusted accuracy R2 can reach 0.62 after considering the unfavorable conditions such as rainfall, temperature, effective cumulative temperature, and soil condition. (2) To avoid image noise and vegetation vigorous growth, the NDVI values were selected by referring to the FVC formula. The value of 95% of the cumulative frequency of the synthetic NDVI cumulative statistics table at the elongation stage was selected as the N D V I r i c h value. (3) According to the N transport law, GNC was estimated using the RF regression algorithm based on the spectral characteristics at the elongation stage with an accuracy of 6.3% and RMSE of 0.07.
Overall, this study combines the improved NFOA, with UAV multispectral data, and finally generates the recommended prescription map for fertilizer tracking. It can provide technical support for precise variable fertilization and provide effective positive reference for the economic benefits of rice and ecological benefits of field environment.

Author Contributions

Conceptualization, X.X. and M.Y.; methodology, M.Y.; software, M.Y.; validation, M.Y.; formal analysis, X.X.; investigation, Z.L., Y.M., X.Y., X.S., G.Y., S.X., Q.Z. and H.X.; resources, M.Y.; data curation, M.Y.; writing—original draft preparation, M.Y.; writing—review and editing, X.X.; visualization, X.X.; supervision, X.X.; project administration, X.X.; funding acquisition, X.X. All authors have read and agreed to the published version of the manuscript.

Funding

This study was supported by the National Key Research and Development Program of China (2019YFE0125300), the Beijing Academy of Agricultural and Forestry Sciences Innovation Capacity Construction Specific Projects (KJCX20210433) and the China Agriculture Research System of MOF and MARA (CARS-03).

Institutional Review Board Statement

Not applicable.

Informed Consent Statement

Not applicable.

Data Availability Statement

Data are available on the Google Earth Engine website (https://code.earthengine.googl-e.com, accessed on 8 July 2021) and the national centers for Environmental Information (https://www.ncei.noaa.gov/maps-and-geospatial-products, accessed on 8 July 2021).

Acknowledgments

We extend our warm thanks to the technical teams at the Beijing Academy of Agricultural and Forestry Sciences who participated in the ground truth measurement campaigns and data processing.

Conflicts of Interest

The authors declare no conflict of interest.

References

  1. Xu, C.; Ji, L.; Chen, Z.; Fang, F. Historical Review and Prospect of China’s Rice Production, Market and Import and Export Trade. China Rice 2021, 27, 17–21. [Google Scholar]
  2. Ying, Z.; Zhen, W.; Zheng, S.; Tian, T.; Yan, Z.; Di, W. The role of sentinel-2 red edge band in rice identification—A case study of Deqing County, Zhejiang province. Chin. J. Agric. Resour. Region. Plan. 2021, 42, 144–153. [Google Scholar]
  3. Chen, Q.; Tian, Y.; Yao, X.; Cao, W.; Zhu, Y. Comparison of Five Nitrogen Dressing Methods to Optimize Rice Growth. Plant Prod. Sci. 2014, 17, 66–80. [Google Scholar] [CrossRef] [Green Version]
  4. Liu, H.; Guo, Z.; Zhang, Y.; Zhou, W.; Sheng, J.; Chen, L. Synergistic response of rice nitrogen use efficiency to planting density and nitrogen application rate. Chin. J. Ecol. 2021, 40, 1–11. [Google Scholar] [CrossRef]
  5. Chen, Q.; Tian, Y.; Yao, X.; Zhu, Y.; Cao, W. Effects of Nitrogen Fertilizer Top-Dressing Based on Canopy Reflectance Spectra in Rice. Sci. Agric. Sin. 2010, 43, 4149–4157. [Google Scholar]
  6. Sen, Z. Study on Nitrogen Monitoring and Dressing Regulation Based on Spectral Sensing in Wheat. Master’s Thesis, Nanjing Agricultural University, Nanjing, China, 2009. [Google Scholar]
  7. Nikrooz, B.; Hojjat, A.; Seyed Kazem, A.; Mahmoud, O. Multispectral remote sensing for site-specific nitrogen fertilizer management. Pesq. Agropec. Bras. 2013, 48, 1394–1401. [Google Scholar] [CrossRef] [Green Version]
  8. Zhao, H.; Song, X.; Yang, G.; Li, Z.; Zhang, D.; Feng, H. Monitoring of Nitrogen and Grain Protein Content in Winter Wheat Based on Sentinel-2A Data. Remote Sens. 2019, 11, 1724. [Google Scholar] [CrossRef] [Green Version]
  9. Song, X.; Yang, G.; Xu, X.; Zhang, D.; Yang, C.; Feng, H. Winter Wheat Nitrogen Estimation Based on Ground-Level and UAV-Mounted Sensors. Sensors 2022, 22, 549. [Google Scholar] [CrossRef]
  10. Fu, Y.; Yang, G.; Li, Z.; Song, X.; Li, Z.; Xu, X.; Wang, P.; Zhao, C. Winter Wheat Nitrogen Status Estimation Using UAV-Based RGB Imagery and Gaussian Processes Regression. Remote Sens. 2020, 12, 3778. [Google Scholar] [CrossRef]
  11. Song, X.; Wang, J.; Xue, X.; Liu, L.; Cheng, L.; Zhao, C. Assessment of the influence of soil nitrogen supplies and variable fertilization on winter wheat growth condition using airborne hyperspectral image. Trans. Chin. Soc. Agric. Eng. 2004, 20, 45–49. [Google Scholar]
  12. Bonfil, D.J.; Michael, Y.; Shiff, S.; Lensky, I.M. Optimizing Top Dressing Nitrogen Fertilization Using VENμS and Sentinel-2 L1 Data. Remote Sens. 2021, 13, 3934. [Google Scholar] [CrossRef]
  13. Varvel, G.E.; Wilhelm, W.W.; Shanahan, J.F.; Schepers, J.S. An Algorithm for Corn Nitrogen Recommendations Using a Chlorophyll Meter Based Sufficiency Index. Agron. J. 2007, 99, 701–706. [Google Scholar] [CrossRef] [Green Version]
  14. Wood, G.A.; Welsh, J.P.; Godwin, R.J.; Taylor, J.C.; Earl, R.; Knight, S.M. Real-time measures of canopy size as a basis for spatially varying nitrogen applications to winter wheat sown at different seed rates. Biosyst. Eng. 2003, 84, 513–531. [Google Scholar] [CrossRef] [Green Version]
  15. Li, Y.; Shu, S.; Chen, L.; Ye, C.; Huang, J.; Sun, B.; Wang, K.; Cao, Z. Regulation of nitrogen fertilizer based on portable apparatus for crop growth monitoring and diagnosis in Jiangxi double cropping rice. Trans. Chin. Soc. Agric. Eng. 2019, 35, 100–106. [Google Scholar]
  16. Justes, E. Determination of a Critical Nitrogen Dilution Curve for Winter Wheat Crops. Ann. Bot. 1994, 74, 397–407. [Google Scholar] [CrossRef]
  17. Xue, L.; Yang, L. Recommendations for nitrogen fertiliser topdressing rates in rice using canopy reflectance spectra. Biosyst. Eng. 2008, 100, 524–534. [Google Scholar] [CrossRef]
  18. Zha, H.; Miao, Y.; Wang, T.; Li, Y.; Zhang, J.; Sun, W.; Feng, Z.; Kusnierek, K. Improving Unmanned Aerial Vehicle Remote Sensing-Based Rice Nitrogen Nutrition Index Prediction with Machine Learning. Remote Sens. 2020, 12, 215. [Google Scholar] [CrossRef] [Green Version]
  19. Lukina, E.V.; Freeman, K.W.; Wynn, K.J.; Thomason, W.E.; Mullen, R.W.; Stone, M.L.; Solie, J.B.; Klatt, A.R.; Johnson, G.V.; Elliott, R.L. Nitrogen fertilization optimization algorithm based on in-season estimates of yield and plant nitrogen uptake. J. Plant Nutr. 2001, 24, 885–898. [Google Scholar] [CrossRef]
  20. William, R.R.; Gordon, V.J. Improving Nitrogen Use Efficiency for Cereal Production. Agron. J. 1999, 91, 357–363. [Google Scholar] [CrossRef] [Green Version]
  21. Raun, W.R.; Solie, J.B.; Stone, M.L.; Martin, K.L.; Freeman, K.W.; Mullen, R.W.; Zhang, H.; Schepers, J.S.; Johnson, G.V. Optical Sensor-Based Algorithm for Crop Nitrogen Fertilization. Commun. Soil Sci. Plant Anal. 2005, 36, 2759–2781. [Google Scholar] [CrossRef] [Green Version]
  22. Zhang, Q. Study on N Fertilization Recommendation in Winter Wheat Based on Multi-Sources Remote Sensing Data. Master’s Thesis, Northeast Agricultural University, Harbin, China, 2015. [Google Scholar]
  23. Zhang, Q.; Yang, G.; Xu, X.; Li, Z.; Zhang, C.; Wang, S. Recommended Application of N Rate for Winter Wheat Based on GeoEye-1Image. J. Triticeae Crops 2014, 34, 1685–1693. [Google Scholar]
  24. Yao, Y.; Miao, Y.; Huang, S.; Gao, L.; Ma, X.; Zhao, G.; Jiang, R.; Chen, X.; Zhang, F.; Yu, K.; et al. Active canopy sensor-based precision N management strategy for rice. Agron. Sustain. Dev. 2012, 32, 925–933. [Google Scholar] [CrossRef] [Green Version]
  25. Wang, X. Study on Construction Critical Nitrogen Concentration Dilution Models Based on Plant Organs Diagnosis and Regulation of Wheat in the Middle and Lower Reaches of The Yangtze River. Master’s Thesis, Nanjing Agricultural University, Nanjing, China, 2017. [Google Scholar]
  26. Tubaña, B.S.; Arnall, D.B.; Walsh, O.; Chung, B.; Solie, J.B.; Girma, K.; Raun, W.R. Adjusting midseason nitrogen rate using a sensor-based optimization algorithm to increase use efficiency in corn. J. Plant Nutr. 2008, 31, 1393–1419. [Google Scholar] [CrossRef]
  27. Arnall, D.B. Analysis of the Coefficient of Variation of Remote Sensor Readings in Winter Wheat, and Development of a Sensor Based Mid-Season Nitrogen Recommendation for Cotton. Ph.D. Thesis, Oklahoma State University, Stillwater, OK, USA, 2008. [Google Scholar]
  28. Cao, Q.; Miao, Y.; Shen, J.; Yu, W.; Yuan, F.; Cheng, S.; Huang, S.; Wang, H.; Yang, W.; Liu, F. Improving in-season estimation of rice yield potential and responsiveness to topdressing nitrogen application with Crop Circle active crop canopy sensor. Precis. Agric. 2016, 17, 136–154. [Google Scholar] [CrossRef]
  29. Junjun, L. RapidSCAN and Unmanned Aerial Vehicle Remote Sensing-Based Rice Nitrogen Status Diagnosis and Precision Management in Cold Region. Ph.D. Thesis, China Agricultural University, Beijing, China, 2018. [Google Scholar]
  30. Li, Z.; Yang, G.; Wang, J.; Xu, X.; Song, X. Remote sensing of grain protein content in cereal:a review. China Agric. Inf. 2018, 30, 46–54. [Google Scholar]
  31. Zhou, D.; Zhu, Y.; Tian, Y.; Cao, W. Estimating Grain Protein Content with Canopy Spectral Reflectance in Rice. Acta Agron. Sin. 2007, 33, 1219–1225. [Google Scholar]
  32. Wang, Z.J.; Wang, J.H.; Liu, L.Y.; Huang, W.J.; Zhao, C.J.; Wang, C.Z. Prediction of grain protein content in winter wheat (Triticum aestivum L.) using plant pigment ratio (PPR). Field Crops Res. 2004, 90, 311–321. [Google Scholar] [CrossRef]
  33. Zhang, H.; Hu, H.; Chen, Y.; Tang, X.; Wu, C.; Liu, Y.; Yang, S.; Zheng, K. Estimating nitrogen of rice leaf and protein of rice seed based on hyperspectal data. J. Nucl. Agric. Sci. 2012, 26, 135–140. [Google Scholar]
  34. Carl-Göran, P.; Mats, S.; Henrik, E. Canopy reflectance, thermal stress, and apparent soil electrical conductivity as predictors of within-field variability in grain yield and grain protein of malting barley. Precis. Agric. 2006, 7, 343–359. [Google Scholar] [CrossRef]
  35. Hansen, P.M.; Jørgensen, J.R.; Thomsen, A. Predicting grain yield and protein content in winter wheat and spring barley using repeated canopy reflectance measurements and partial least squares regression. J. Agric. Sci. 2002, 139, 307–318. [Google Scholar] [CrossRef]
  36. Liu, H.; Zhu, H.; Wang, P. Quantitative modelling for leaf nitrogen content of winter wheat using UAV-based hyperspectral data. Int. J. Remote Sens. 2017, 38, 2117–2134. [Google Scholar] [CrossRef]
  37. Chen, B.; Ao, H.; Zeng, X. Analysis of the changes in sown area and yield of rice in China from 2009 to 2018. J. Hunan Agric. Univ. (Nat. Sci.) 2021, 47, 495–500. [Google Scholar] [CrossRef]
  38. Li, J.; Li, J.; Li, W.; Zhou, Z.; Wang, X. China’s Rice Yield Increase Potential and Realization Path during the “14th Five-Year Plan” Period. Issues Agric. Econ. 2021, 7, 25–37. [Google Scholar] [CrossRef]
  39. Jordan, C.F. Derivation of Leaf-Area Index from Quality of Light on the Forest Floor. Ecology 1969, 50, 663–666. [Google Scholar] [CrossRef]
  40. Broge, N.H.; Leblanc, E. Comparing prediction power and stability of broadband and hyperspectral vegetation indices for estimation of green leaf area index and canopy chlorophyll density. Remote Sens. Environ. 2001, 76, 156–172. [Google Scholar] [CrossRef]
  41. Rouse, J.W., Jr.; Haas, R.H.; Schell, J.A.; Deering, D.W. Monitoring the Vernal Advancement and Retrogradation (Greenwave Effect) of Natural Vegetation; Nasa/gsfct Type Final Report; Remote Sensing Center Texas A&M University: College Station, TX, USA, 1974. [Google Scholar]
  42. Huete, A.; Justice, C.; Leeuwen, W.V. MODIS vegetation index (MOD13). Algorithm Theor. Basis Doc. 1999, 3, 295–309. [Google Scholar]
  43. Barnes, E.M.; Clarke, T.R.; Richards, S.E.; Colaizzi, P.D.; Thompson, T. Coincident detection of crop water stress, nitrogen status, and canopy density using ground based multispectral data. In Proceedings of the 5th International Conference on Precision Agriculture and Other Resource Management, Bloomington, MN, USA, 16–19 July 2000. [Google Scholar]
  44. Gitelson, A.A.; Viña, A.; Arkebauer, T.J.; Rundquist, D.C.; Keydan, G.; Leavitt, B. Remote estimation of leaf area index and green leaf biomass in maize canopies. Geophys. Res. Lett. 2003, 30, 1248. [Google Scholar] [CrossRef] [Green Version]
  45. Cao, Q.; Miao, Y.; Wang, H.; Huang, S.; Cheng, S.; Khosla, R.; Jiang, R. Non-destructive estimation of rice plant nitrogen status with Crop Circle multispectral active canopy sensor. Field Crops Res. 2013, 154, 133–144. [Google Scholar] [CrossRef]
  46. Ehammer, A.; Fritsch, S.; Conrad, C.; Lamers, J.; Dech, S. Statistical derivation of fPAR and LAI for irrigated cotton and rice in arid Uzbekistan by combining multi-temporal RapidEye data and ground measurements. In Remote Sensing for Agriculture, Ecosystems, and Hydrology XII; SPIE: Bellingham, WA, USA, 2010; pp. 66–75. [Google Scholar]
  47. Gitelson, A.A.; Kaufman, Y.J.; Merzlyak, M.N. Use of a green channel in remote sensing of global vegetation from EOS-MODIS. Remote Sens. Environ. 1996, 58, 289–298. [Google Scholar] [CrossRef]
  48. Ren, H.; Zhou, G. Determination of green aboveground biomass in desert steppe using litter-soil-adjusted vegetation index. Eur. J. Remote Sens. 2014, 47, 611–625. [Google Scholar] [CrossRef]
  49. Chen, J.M. Evaluation of Vegetation Indices and a Modified Simple Ratio for Boreal Applications. Can. J. Remote Sens. 1996, 22, 229–242. [Google Scholar] [CrossRef]
  50. Herrmann, I.; Karnieli, A.; Bonfil, D.J.; Cohen, Y.; Alchanatis, V. SWIR-based spectral indices for assessing nitrogen content in potato fields. Int. J. Remote Sens. 2010, 31, 5127–5143. [Google Scholar] [CrossRef]
  51. Gitelson, A.A. Wide Dynamic Range Vegetation Index for remote quantification of biophysical characteristics of vegetation. J. Plant Physiol. 2004, 161, 165–173. [Google Scholar] [CrossRef] [PubMed] [Green Version]
  52. Goel, N.S.; Qin, W. Influences of canopy architecture on relationships between various vegetation indices and LAI and Fpar: A computer simulation. Remote Sens. Rev. 1994, 10, 309–347. [Google Scholar] [CrossRef]
  53. Metternicht, G. Vegetation indices derived from high-resolution airborne videography for precision crop management. Int. J. Remote Sens. 2003, 24, 2855–2877. [Google Scholar] [CrossRef]
  54. Main, R.; Cho, M.A.; Mathieu, R.; O’Kennedy, M.M.; Ramoelo, A.; Koch, S. An investigation into robust spectral indices for leaf chlorophyll estimation. ISPRS J. Photogramm. Remote Sens. 2011, 66, 751–761. [Google Scholar] [CrossRef]
  55. Johnson, G.V.; Raun, W.R. Nitrogen Response Index as a Guide to Fertilizer Management. J. Plant Nutr. 2003, 26, 249–262. [Google Scholar] [CrossRef] [Green Version]
  56. Yue, Y.; Chen, G.; Wang, L.; Li, X.; Li, Y. Analyses of Vegetation Coverage Changes in Zhouqu County from 1998 to 2019 Based on GEE Platform. Acta Agrestia Sin. 2022, 30, 1534–1542. [Google Scholar] [CrossRef]
  57. Zhang, X.L.; Zhang, Y.; Niu, D.K.; Zhang, W.Y.; Guo, X.M. Spatial-temporal dynamics of upland meadow coverage on Wugong Mountain based on TM NDVI. Acta Ecol. Sin. 2018, 38, 2414–2424. [Google Scholar]
  58. Ling, Q.H.; Zhang, H.C.; Dai, Q.G.; Ding, Y.F.; Ling, L.; Su, Z.F.; Xu, M.; Que, J.H.; Wang, S.H. Study on Precise and Quantitative N Application in Rice. Sci. Agric. Sin. 2005, 38, 2457–2467. [Google Scholar]
  59. Shanahan, J.F.; Kitchen, N.R.; Raun, W.R.; Schepers, J.S. Responsive in-season nitrogen management for cereals. Comput. Electr. Agric. 2008, 61, 51–62. [Google Scholar] [CrossRef] [Green Version]
  60. Xue, L.; Li, G.; Qin, X.; Yang, L.; Zhang, H. Topdressing nitrogen recommendation for early rice with an active sensor in south China. Precis. Agric. 2014, 15, 95–110. [Google Scholar] [CrossRef]
Figure 1. Location of research site (top) and image of experimental plots (bottom). (a) The experimental plot a in the Sinochem Modern Agriculture Tianjin Technical Service Center; (b) the experimental plot b in the farm of the Tianjin Ninghe District Quality Agricultural Products Development Demonstration Centre; (c) the experimental plot c in the original seed farm of the Tianjin Ninghe District Quality Agricultural Products Development Demonstration Centre.
Agronomy 12 01804 g001
Figure 2. The unmanned aerial vehicle Phantom 4 Multispectral (left) and multispectral camera (right).
Agronomy 12 01804 g002
Figure 3. Statistics of normalized difference vegetation index (NDVI) values (the dashed line is at 95% of the cumulative frequency of NDVI values).
Agronomy 12 01804 g003
Figure 4. Model of predicting potential. YP (solid line): original forecast potential production; YP0 (dotted line): adjusted forecast potential production.
Agronomy 12 01804 g004
Figure 5. Comparison chart of predicted yield and actual yield.
Agronomy 12 01804 g005
Figure 6. The recommended fertilizer prescription map made using improved NFOA based on UAV data in the experimental plot b.
Agronomy 12 01804 g006
Table 1. Main parameters used in this paper of the Sentinel-2 sensor.
NamePixel Size/MetersWavelengthDescription
B210496.6 nm (S2A)Blue
B310560 nm (S2A)Green
B410664.5 nm (S2A)Red
B810835.1 nm (S2A)NIR
Table 2. Collected information for Sentinel-2 satellite.
Sending DateProductionScope
24 June 2019Sentinel-2 (Level-2A)The experimental plot c
3 August 2020Sentinel-2 (Level-2A)The experimental plot a
7 August 2021Sentinel-2 (Level-2A)The experimental plot b
Table 3. Phantom 4 Multispectral sensor spectrum characteristics.
NameWavelengthDescription
B1475 nm ± 16 nmBlue
B2560 nm ± 16 nmGreen
B3650 nm ± 16 nmRed
B4730 nm ± 16 nmRed Edge
B5840 nm ± 26 nmNIR
Table 4. The list of the vegetation indices used in this work.
Vegetation IndicesFormulaReference
Difference vegetation index (DVI)NIR − Red[39]
Ratio vegetation index (RVI)NIR/Red[40]
Normalized difference vegetation index (NDVI)(NIR − Red)/(NIR + Red)[41]
Enhanced vegetation index (EVI)2.5((NIR − Red)/((NIR + 6Red − 7.5Blue) + 1))[42]
Normalized difference red edge index (NDRE)(NIR − Red Edge)/(NIR + Red Edge)[43]
Red edge chlorophyll index (CIred−edge)(NIR/Red Edge) − 1[44]
Green chlorophyll index (CIgreen)(NIR/Green) − 1[44]
Normalized NIR index (NNIR)NIR/(NIR + Red + Green)[45]
Red edge difference vegetation index (REDVI)NIR − Red Edge[45]
Red edge ratio vegetation index (RERVI)NIR/Red Edge[46]
Green normalized difference vegetation index (GNDVI)(NIR − Green)/(NIR + Green)[47]
Green optimized soil adjusted vegetation index (GOSAVI)(NIR − Green)/(NIR + Green + 0.16)[48]
Modified simple ratio (mSR)(NIR/Red − 1)/( N I R R e d + 1 )[49]
Modified canopy chlorophyll content index (MCCCI)NDRE/NDVI[45]
Modified transformed chlorophyll absorption ratio index (MTCARI)3((NIR − Red Edge) − 0.2(NIR − Red Edge)(NIR/Green))[50]
Wide dynamic range vegetation index (WDRVI)(0.1NIR − Red)/(0.1NIR + Red)[51]
Nonlinear vegetation index (NLI)(NIR2 − Red)/(NIR2 + Red)[52]
Green re-normalized different vegetation index (GRDVI)(NIR − Green)/ ( NIR + Green ) [45]
Green soil adjusted vegetation index (GSAVI)1.5((NIR − Green)/(NIR + Green + 0.5))[48]
Canopy chlorophyll content index (CCCI)((NIR − Red Edge)/(NIR + Red Edge))/((NIR − Red)/(NIR + Red))[43]
Normalized difference green/blue plant pigment ratio (PPR)(Green − Blue)/(Green + Blue)[53]
Structure intensive pigment index (SIPI)(NIR − Blue)/(NIR − Red)[54]
Optimize soil adjusted vegetation index (OSAVI)1.16((NIR − Red)/(NIR + Red + 0.16))[48]
Table 5. Summary of planting, sensing dates, and the days of GDD > 0 in 2019–2021.
YearPlanting DateSending DateDAT
201911 May24 June44
202011 May3 August85
202112 May8 July57
Table 6. Income forecast and top-dressing expenses of each field.
IDForecast Yield
(t/ha)
Forecast Income
(yuan/ha)
The N Requirement
(kg N/ha)
Topdressing
(Urea, kg/ha)
Topdressing Amount
(yuan/ha)
Saving Amount
(yuan/ha)
N111.9231,952.8112.3426.8354156.33
N212.2032,683.7216.7136.3373137.35
N312.3333,037.3117.5638.1776133.66
N412.3733,139.6718.5440.2981129.41
N512.6833,982.7121.2646.2292117.55
N611.8331,711.3710.1722.1044165.80
N712.0832,371.1814.9432.4865145.03
N812.3833,177.1718.2139.5979130.82
N912.4133,269.5019.0641.4483127.13
N1012.9334,652.5923.8751.88104106.24
N1112.1132,464.6015.0832.7966144.42
N1211.8731,802.1610.9123.7347162.55
Publisher’s Note: MDPI stays neutral with regard to jurisdictional claims in published maps and institutional affiliations.

