Abstract
Global climate change will modify plants in terms of growth and physiology. To better understand the consequences of this effect, the responses of the leaf water relations and nitrogen (N) use efficiency of barley and tomato plants to elevated CO2 (e[CO2], 800 ppm) combined with progressive drought stress at two levels of N supply (N1, 0.5 g N pot−1 and N2, 1.0 g N pot−1) were studied. The plants were grown in two separate phytotrons at ambient CO2 (a[CO2], 400 ppm) and e[CO2], respectively. The leaf physiological parameters as well as carbon (C) and N concentrations were determined; plant growth, water and N use efficiencies were evaluated. The results showed that e[CO2] increased photosynthesis and water use efficiency (WUE) while decreased specific leaf area (SLA) in both species, whereas N supply level differentially influenced WUE in barley and tomato plants. The abscisic acid (ABA)-induced stomatal closure during progressive soil drying varied between the two species where the stomatal conductance (gs) of barley plants was more sensitive to leaf ABA than tomato plants, though CO2 environment did not affect the response in both species. Compared to a[CO2], e[CO2] reduced plant transpiration rate (Tplant) in barley but not in tomato. e[CO2] increased the leaf C:N ratio ([C:N]leaf) in plants by enhancing leaf C concentration ([C]leaf) in barley and by dilution of leaf N concentration ([N]leaf) in tomato, respectively, but N2 substantially decreased [C:N]leaf, and thus, N treatment was the dominant factor controlling [C:N]leaf. Collectively, appropriate N supply may modulate the acclimation of plants to e[CO2] and soil water deficits. This study provides some novel insights into N management of different plant species for adapting to future drier and CO2-enriched environment.
1. Introduction
The global atmospheric CO2 concentration ([CO2]) has increased since the preindustrial era [1], and it is anticipated to increase to 540 ppm by 2050 [2,3]. The increased [CO2] has not only intensified the greenhouse effect, resulting in an increase in air temperature, but also caused a decrease in precipitation, which intensified global drought, making water scarcity especially a limiting factor for crop yield in arid and semi-arid agricultural areas [4]. On the other hand, an increase in vegetative and reproductive growth and yield of plants is essentially dependent upon the adequate supply of nitrogen (N) [5], while mineral concentration, including and especially N, may decrease under elevated [CO2] (e[CO2]) in plants [6], leading to ‘hidden hunger’ [7]. Thus, it is fundamental to investigate the response of different crop species to e[CO2] and N supply, particularly under soil water deficits, for sustainable crop production over the coming century.
It has been suggested that e[CO2] lead to changes in stomatal conductance (gs) over short and long timescales [8]. A number of studies have shown that the gs decreases in response to e[CO2], which reduces transpiration rate (Tr) while maintaining a high internal leaf CO2 concentration (Ci), resulting in increased leaf photosynthetic rate (An) [9,10,11]. However, the effect of N on gs varies, even presenting some contradictory results in the literature; lower gs has been observed in plants with low or zero N treatment [12,13,14], whereas the opposite effect [15], or no effect [16], on gs by N treatments was also reported. During the progress of the soil water deficit, plants perceive the water deficit via the root then synthesize chemical signalling, which is sent to the leaf via the xylem vessels, mainly abscisic acid (ABA), triggering partial stomatal closure [17,18]. However, recent studies have also suggested that ABA biosynthesis can occur rapidly in leaves [19], and both xylem ABA ([ABA]xylem) and leaf ABA ([ABA]leaf) participate in regulating stomatal aperture [20]. It is widely recognised that ABA plays an important role in stomatal regulation during soil water deficit associated with e[CO2] [21,22,23], and ABA also participates in the modulation of plant N signal transduction and uptake [18]. A previous study proved that N deficiency could cause rapid accumulation of ABA, especially in the shoots [24]; however, whether the response of gs to drought stress could be regulated by different N supply levels remains largely elusive. In addition, the mechanisms by which gs is modulated under the combination of soil water deficits, e[CO2] and N supply need further investigation.
It has been well recognised that e[CO2] could decrease gs and Tr, consequently retaining a higher plant water potential [10,25]. The carboxylation rate of Rubisco is enhanced as response to e[CO2] in C3 plants such as tomato and barley, resulting in an increased An [25,26]. It has also been proven that a high water use efficiency (WUE) was observed with a low gs under e[CO2] combined with a soil water deficit [10,20,27,28]. Likewise, leaf N concentration closely correlates to An [29,30], as it largely depends on the presence of RuBP carboxylase and chlorophyll content, both linearly related to leaf N concentration [31]. For instance, significant decreases in An after anthesis were observed in N-deficient plants [32]. Therefore, it is widely accepted that a higher leaf N concentration is usually associated with higher photosynthetic capacity, which results in an increase in An at a certain Tr, leading to an increase in WUE [33,34].
As the main channels for gas exchange between plants and environment, stomata regulate photosynthesis and transpiration rates of leaves, and consequently, stomatal apertures determine the WUE [35]. Evidence has shown that the morphological types of guard cells vary from plant species [36]; most of the dicots have kidney-shaped guard cells when the stomata are open, while monocots have dumb-bell-shaped ones, leading them to be slenderer. Additionally, with one subsidiary cell in each side nearby the guard cells in monocots, they control gs by the cooperation of these two kinds of cells, which are not found in dicots [37]. Therefore, such distinctions in stomata between dicots and monocots may result in different regulatory mechanism and responses of their gs to the environmental changes, which finally perform differently in their physiology and growth [25]. Additionally, the growth of tomato and barley, as two of the most widely planted cash crops and food crops in China, respectively, is intimately connected with soil water status and nutrition supply, and can be representative in reflecting the responses of dicots and monocots to environmental changes [25].
Many studies have demonstrated that e[CO2] could affect carbon (C) and N concentrations, further modulating the C:N ratio ([C:N]) in plant dry biomass [10,18,20,38]. Meanwhile, N exerts as one of the necessary elements of all the enzymes in participating carbohydrate metabolism, taking part in the plant C metabolism [39], affecting C accumulation under e[CO2]. On the other hand, although N supply generally stimulates plant growth [40], it could also decrease plant nitrogen use efficiency (NUE) [41]. However, to date, the mechanism by which NUE is affected by combined e[CO2] growth environment and soil water deficits under varied N supply still remains unknown.
Therefore, this study was designed to investigate the response of WUE and NUE to e[CO2] at two levels of N supply exposed to soil water deficits. It was assumed that different level of N supply would modulate the influence of e[CO2] and soil water deficits on WUE and NUE of tomato and barley plants. To test this, potted barley and tomato plants were grown in two climate-controlled phytotrons with ambient [CO2] (400 ppm, a[CO2]) and e[CO2] (800 ppm) with two levels of N supply, i.e., 0.5 and 1.0 g N per pot. Both barley and tomato were then subjected to progressive soil drying during earlier vegetative growth stages until all plant available water in the pots was depleted. Leaf gas exchange, plant water relations, water consumption, above-ground dry matter, leaf area, C and N concentration in leaf, as well as leaf ABA concentration were determined at different severities of soil water deficits as well as one week after recovery to test the above hypothesis.
2. Materials and Methods
2.1. Experimental Setup
A pot experiment was conducted in two climate-controlled phytotrons (overhead-light-source type phytotron, Zhejiang Qiushi Artificial Environment Co., Ltd., Zhejiang, China) at South Campus of Northwest A&F University, Yangling, Shaanxi, China from September to December 2020. The barley (Hordeum vulgare L. cv. Steptoe) and tomato (Solanum lycopersicum L., cv. Kaideyali 1832) seeds were sown on 25 September 2020, and 19 September 2020, respectively. The seeds of both species have been proved to be greatly influenced by water status and sensitive to drought and N [25,42]. Four barley seeds were sown in each of the 3 L-plastic pots and thinning to 2 seedlings 3 weeks later (18 cm tall, 18 cm in upper diameter and 16 cm in lower diameter) filled with 0.7 kg substrate (Pindstrup substrate No.2, Pindstrup Mosebrug A/S, Pindstrup, Ryomgaard, Denmark). The substrate contained 90% organic matter, with a pH of 5.9. The mixture had a water-holding capacity of 35% (in volumetric water content). The tomato seeds were sown in trays and then transplanted at the 4-leaf stage to the same 3 L plastic pots as barley.
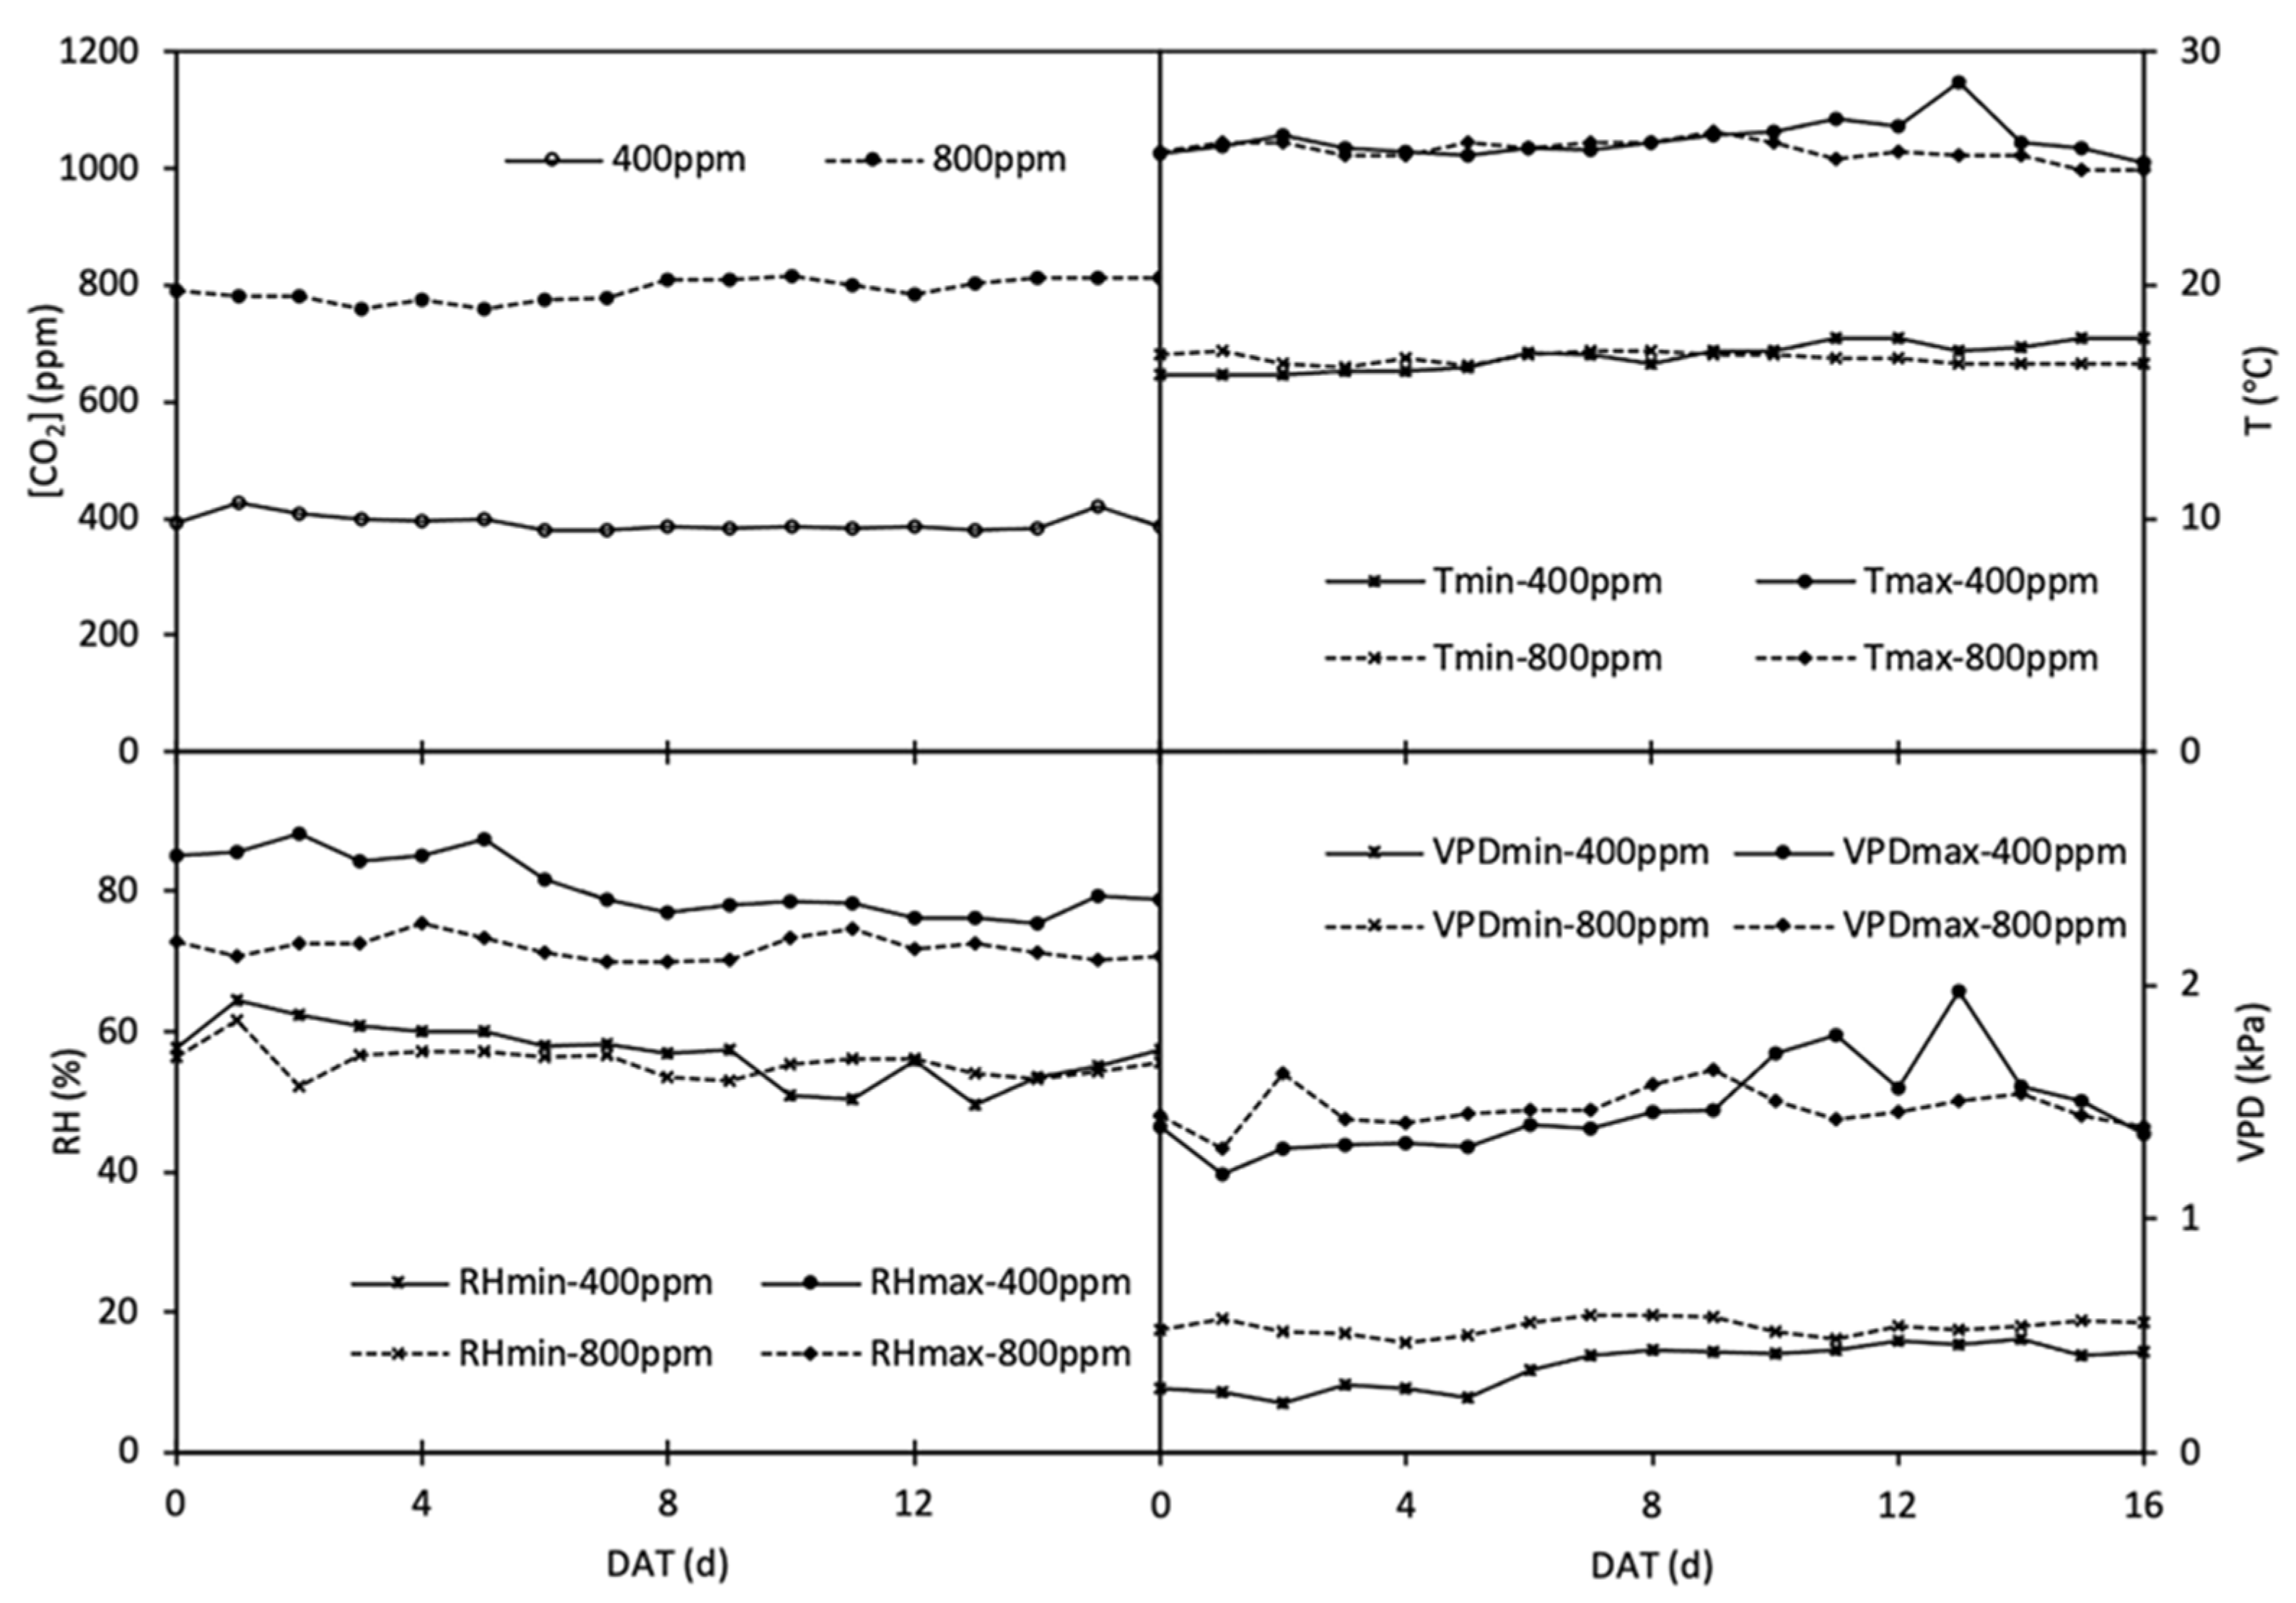
Since sowing, half of the plants (i.e., 40 seedlings per species) were grown in the phytotron filled with ambient CO2 concentration (a[CO2], 400 ppm), and the other half were grown in the other phytotron with elevated CO2 concentration (e[CO2], 800 ppm). In each phytotron, a bottle tank filled with pure CO2 was applied as CO2 supply to sustain or achieve the CO2 concentration ([CO2]), with CO2 releasing 24 h per day from more than one point and distributing evenly in the phytotrons through internal ventilation, and the [CO2] was monitored by the automatic control system of the phytotrons. The climatic conditions in both phytotrons were set as follows: 25/18 ± 2 °C day/night air temperature, 60% relative humidity, 16 h photoperiod, and >500 mol m−2 s−1 photosynthetic active radiation (PAR) supplied by sunlight plus LED lamps. The average of daily [CO2], the maximum and minimum temperature (Tmax, Tmin), relative humidity (RHmax, RHmin) and vapour pressure deficit (VPDmax, VPDmin) in the phytotrons during the experiment are shown in Figure 1. In each phytotron, plants of each crop were divided into two fertilization regimes, i.e., 0.5 g N pot−1 denoted as N1 treatment and 1.0 g N pot−1 denoted as N2 treatment, applied as CO(NH2)2. In addition to N, 0.5 g P and 0.629 g K were applied as KH2PO4 into every pot. The fertilizers were added one week after emergence (barley) and/or transplanting (tomato) with irrigation water.

Figure 1.
The average of CO2 concentration ([CO2], ppm), temperature (T, °C), relative humidity (RH, %) and vapor pressure deficiency (VPD, kPa) in phytotrons designated at 400 and 800 ppm during the experimental period.
Soil evaporation was minimized by covering 3.0 cm perlite evenly over the soil surface in every pot. The constant weight after the pot irrigated to supersaturation and draining freely was regarded as full pot water-holding capacity (WHC), and all the pots were constantly watered to 90% of WHC (i.e., 1.66 kg) for 20 days after emergence (barley) and/or transplant (tomato), then 4 plants were harvested in each species × CO2 × N treatment as the baseline. The soil drying treatment started on 26 October for barley and 4 December for tomato. In each species, four plants in each CO2 × N treatment stayed well-watered to 90% of WHC (16 plants), serving as controls, while the others (48 plants) were subjected to progressive soil drying by withholding irrigation until the gs decreased to ca. 10% of the controls (i.e., ca. 0.7 kg); only e[CO2]-grown barley were subjected to drought for 9 days, owing to the lower water consumption, while the others were subjected to drought for 8 days. During this process, the drought-stressed plants were extra harvested once when gs decreased to ca. 50% of the controls (16 plants per species). At the end of drought stress, half of the stressed plants (16 plants per species) were harvested, and the other half were re-watered to 90% WHC for 7 days. Soil water status in the pots was described as the fraction of transpirable soil water (FTSW). FTSW as a good indicator of soil water status has frequently been used to illustrate the cascades of plant physiological responses to progressive soil drying treatment (e.g., Liu et al., 2003, and the literature cited therein). The total transpirable soil water (TTSW) in the pots was the difference between pot weights at 90% WHC and the final of drought progress before re-watering (i.e., 0.7 kg). The daily value of FTSW in a certain pot was computed as the ratio between the amount of transpirable soil water still remaining in the pot and TTSW (Equation (1)):
where WTn is the pot weight on a given date during progressive soil drying, and WTf is the pot weight when gs decreasing to ca. 10% of the controls. The variation of FTSW during the experiment period in two phytotrons is shown in Figure 2, as the average calculated by the duplicates of every water treatment.
FTSW = (WTn − WTf)/TTSW
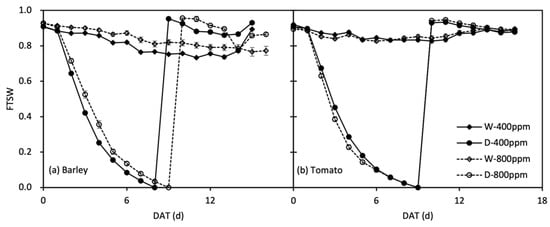
Figure 2.
Change in fraction of transpiration soil water (FTSW) over time (DAT, day after treatment) in well-watered (W) and droughted then re-watered (D) pots under atmospheric [CO2] (400 and 800 ppm) in barley (a) and tomato (b) plants. Error bars indicate the standard error of the means (S.E.) (n = 3–4).
2.2. Measurement
2.2.1. Leaf Gas Exchange Rates
During the progressive soil drying, leaf gas exchange rates including net photosynthetic rate (An, µmol m−2 s−1), gs (mol m−2 s−1) and transpiration rate (Tr, mmol m−2 s−1) of every treatment including replicates were measured from 8:30 to 11:30 every other day by a portable photosynthetic system (LiCor-6800, LI-Cor, Lincoln, NE, USA) to monitor their trends as soil moisture reduced. Measurements were performed on one fully expanded leaf at the upper canopy per plant at 25 °C leaf temperature with 1200 µmol m−2 s−1 photon flux density under every [CO2] (a[CO2] and e[CO2]). Instantaneous water use efficiency (WUEleaf, μmol mmol−1) was calculated as the ratio of An to Tr (An/Tr), and intrinsic water use efficiency (WUEi, μmol mol−1) was counted as the ratio of An to gs (An/gs).
2.2.2. Plant–Water Relation Characteristics
Plant–water relation characteristics were determined at each harvest. Relative water content of leaf (RWC) of every harvest plant was measured following the protocol of Liu and Stützel [43], with flag leaves in barley and young fully expanded leaves in tomato (one leaflet per plant), respectively. RWC was defined as Equation (2):
where Wf is the leaf fresh weight, Wt is the leaf turgid weight measured after rehydration in distilled water for 2 h [20,44], and Wd is the leaf dry weight after oven-drying for 48 h.
RWC = (Wf − Wd)/(Wt − Wd)
Midday leaf water potential (Ψl) was determined on the same leaves used for gas exchange rate measurements, with a pressure chamber (SEC3005, Soil Moisture Equipment Corp., Santa Barbara, CA, USA). After determining Ψl, the leaf was immediately packed in aluminium foil and temporarily frozen in liquid nitrogen. The samples were then stored at −80 °C for the determination of leaf ABA concentration ([ABA]leaf).
2.2.3. Plant Transpiration, Dry Biomass Accumulation, Leaf Area, and Water Use Efficiency
Plant transpiration (Tplant, L plant−1 d−1) was calculated and recorded every day by weighing all the pots since the beginning of the progressive soil drying, and the plant water consumption (WU, dm3 plant−1) was the accumulation of Tplant during the experiment period. After oven-drying to constant weight, the leaf dry mass (DMleaf, g) and stem dry mass (DMstem, g) of the plants were separately weighed, and above-ground dry matter accumulation (ΔDM, g) was recorded as the difference in dry matter, including shoot and leaf, between the first harvest and every latter harvest. Water use efficiency (WUE, kg m−3) of the plant was computed as the ratio of ΔDM to WU (ΔDM/WU).
Plant leaf area (LA, cm2) was determined with a leaf area mater (Li-3100C, LI-Cor, Lincoln, NE, USA). Specific leaf area (SLA, cm2 g−1) was calculated as the ratio of LA to DMleaf (LA/DMleaf).
2.2.4. C and N Concentrations and C:N Ratio in Leaves
The concentration of C ([C]leaf, g kg−1) and N ([N]leaf, g kg−1) in the leaves at each harvest were determined. The samples were oven-dried, ground to fine powder, and passed through a 0.25 mm sieve. The [C]leaf was analysed by using the K2Cr2O7–H2O2 oxidation method based on the Walkley–Black method, and the [N]leaf of the samples was assayed by the Kjeldahl method [45]. The C:N in leaves ([C:N]leaf) was determined as the ratio of [C]leaf to [N]leaf ([C]leaf/[N]leaf).
2.2.5. Leaf ABA Concentration
Every collected leaf sample was ground separately into fine powder under liquid nitrogen, and 27–33 mg per sample was added into a 1.5 mL Eppendorf tube. The ABA was extracted with 1.0 mL milli-Q water on a shaker, at 4 °C, overnight. The extracts were centrifuged at 14,000× g and 0.7 mL supernatants were collected for [ABA]leaf (ng g−1 FW) analysis. [ABA]leaf was assayed by enzyme-linked immunosorbent assay (ELISA) following the protocol represented by Asch [46].
2.3. Data Analysis and Statistics
According to the distribution of leaf gas exchange rates (including An, gs, Tr, WUEi and WUEleaf) of two species with the change in soil water status, the stress of progressive soil drying was divided into three severities according to the corresponding FTSW values; 0.0 to 0.3 (severe-stress), 0.3 to 0.8 (mild-stress) and 0.8 to 1.0 (non-stress). Statistical comparisons of the effects and differences among every [CO2], N treatment and soil water status combination on these indicators were accomplished via one-way analysis of variance (one-way ANOVA) and Games-Howell post hoc test, which based on uneven variance for ANOVA, at the 5% confidence level with SPSS version 26.0 (IBM Electronics).
The response of Tplant to progressive soil drying was described via a linear-plateau model (Equation (3)) [25]:
where y means Tplant, and yinitial means Tplant max, which was measured when the plants have not suffered from soil water deficits; S is the slope of the linear equation, C is the FTSW threshold when y started to diverge from yinitial. The parameters (y, S and C) were evaluated by PROC NLIN of SAS University Edition (SAS Institute Inc., Cary, NC, USA, 2002–2012) with coefficient of determination (r2) calculated.
If FTSW > C, y = yinitial;
If FTSW < C, y = yinitial + S × (FTSW − C)
Three-way ANOVA was applied to compare the effects of the treatments ([CO2], N supply ([N]), and water status ([Water]), including their interactions) on the measured variables, including RWC, Ψ1, DMleaf, DMstem, ΔDM, WU, LA, SLA, WUE, [C]leaf, [N]leaf, [C:N]leaf and [ABA]leaf. The Pearson’s Product-Moment correlation was conducted to assess the significance of the correlation between RWC and Ψ1, and the ACNOVA was used to compare the differences in the slopes and intercepts between the regression lines (taken Ψ1 as a co-variate). All the analysis was completed with IBM SPSS Statistics (version 26.0, IBM Electronics, Armonk, NY, USA).
3. Results
3.1. Leaf Gas Exchange and Stomatal Density
For both crops, the responses of An, gs, Tr, WUEi and WUEleaf to progressive soil drying were analysed according to the three drought-stress stages mentioned above. In both species, An was increased significantly by e[CO2], and it was notably decreased only under severe drought, except for the a[CO2]-grown tomato plants with N1 treatment, whose An declined already at mild drought in relation to the non-stressed plants (Figure 3a,b). The [N] had no significant effect on the An. Basically, the gs of tomato plants was only found to be significantly decreased by e[CO2] in N2 treatment at the non-stress stage (p = 0.004), and it was also increased by N2 treatment when grown in a[CO2] at the non-drought stage (p = 0.018). Varied from barley plants, whose gs was identical at non- and mild-stress, gs of tomato plants had notably decreased at the mild-stress stage, except for the one treated with a[CO2] × N2 (Figure 3c,d). There was no significant difference in Tr between the two [CO2] as well as two [N] treatments for all three soil water regimes. Only tomato plants treated with e[CO2] × N1 had a decreased Tr at the mild-stress stage (Figure 3e,f). For both species, gs and Tr was significantly decreased under severe drought.
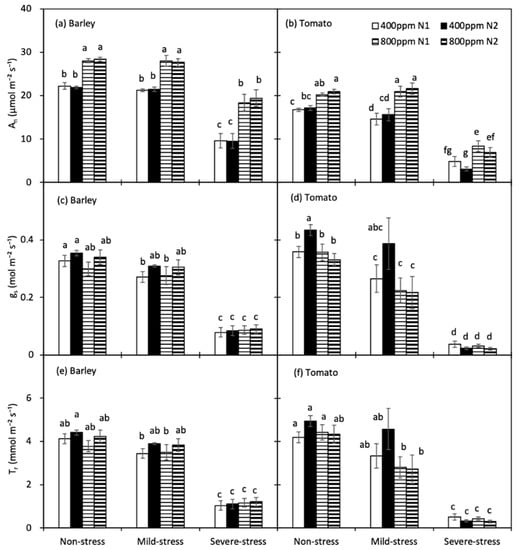
Figure 3.
Leaf photosynthetic rate (An, (a,b)), stomatal conductance (gs, (c,d)) and transpiration rate (Tr, (e,f)) of barley and tomato plants as affected by the atmospheric [CO2] (400 and 800 ppm), N fertilizers (N1 and N2) and water regimes (non-stress, mild-stress and severe-stress). Error bars indicate standard error of the means (S.E.) (n = 8 (barley) and 7 (tomato) in non-stress, 4 in mild-stress and 12 in severe-stress regimes). Bars that share a common letter were not significant different at p = 0.05 within each soil water stress category.
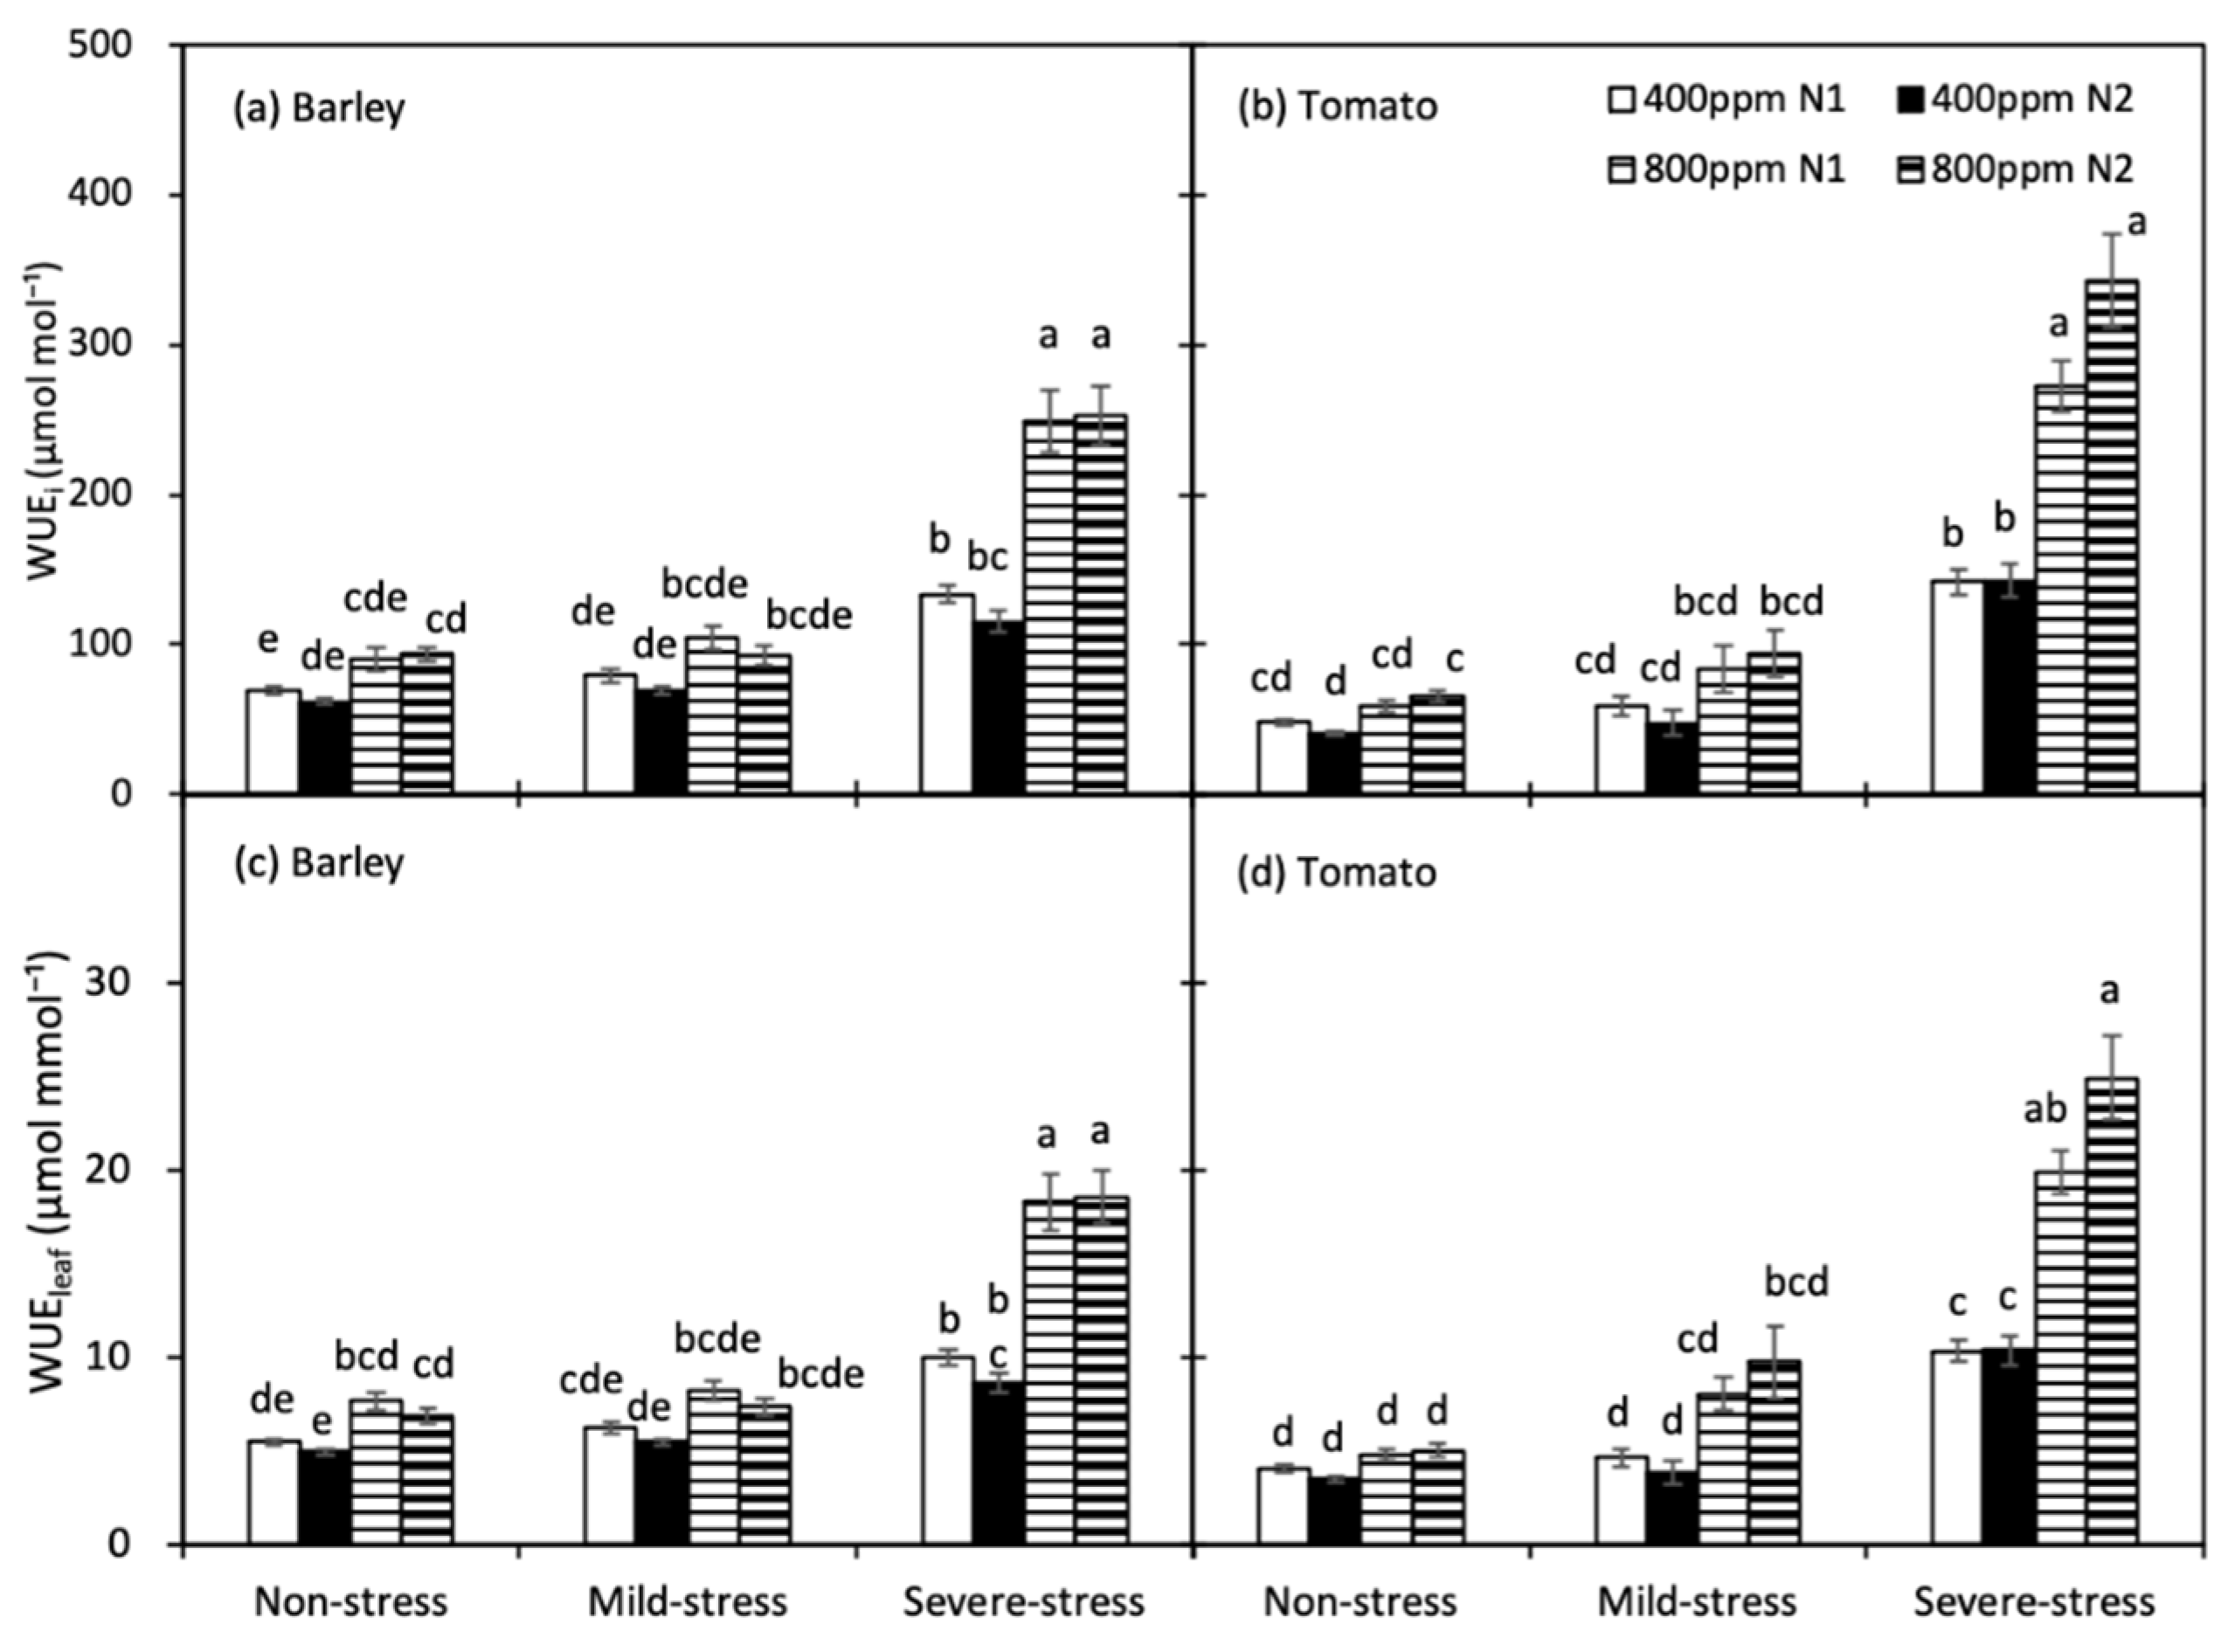
WUEi and WUEleaf of both crops were significantly increased only under severe drought (Figure 4). Compared with the a[CO2]-grown plants, the e[CO2]-grown plants had greater WUEi and WUEleaf, particularly under severe drought. For both species, N treatment did not affect WUEi and WUEleaf across all [CO2] and soil water regimes.

Figure 4.
Intrinsic water use efficiency (WUEi, (a,b)) and instantaneous water use efficiency (WUEleaf, (c,d)) of barley and tomato plants as affected by the atmospheric [CO2] (400 and 800 ppm), N fertilizers (N1 and N2) and water regimes (non-stress, mild-stress and severe-stress). Error bars indicate standard error of the means (S.E.) (n = 8 (barley) and 7 (tomato) in non-stress, 4 in mild-stress and 12 in severe-stress regimes). Bars that share a common letter were not significant different at p = 0.05 within each soil water stress category.
3.2. Plant Water Relations
For barley plants, both e[CO2] and N2 treatment reduced the variation extent of leaf relative water content (RWC) caused by soil water regime, and N2-treated plants had greater RWC when under drought (Table 1). Midday leaf water potential (Ψl) declined by e[CO2] in relation to a[CO2], and N2 treatment increased it (Table 1). For tomato plants, the effect of [CO2] on RWC was manifested under drought or N1 treatment where greater RWC was observed under e[CO2]. When under drought stress, the impact of N treatments was only found in a[CO2]-grown plants, for N2 led a greater RWC (Table 2). Ψl was increased by the effect of e[CO2] when under drought stress. As expected, drought stress decreased both RWC and Ψl in both species; re-watering restored them to the level of the well-watered plants (Table 2).

Table 1.
Leaf relative water content (RWC), leaf water potential (Ψl), water consumption (WU), leaf dry mass (DMleaf), stem dry mass (DMstem), dry matter increase (ΔDM) and water use efficiency (WUE), leaf area (LA), specific leaf area (SLA), concentration of carbon ([C]leaf) and nitrogen ([N]leaf) in leaf, the ratio of [C] to [N] in leaf ([C:N]leaf) and leaf ABA concentration ([ABA]leaf) of well-watered (W), drought-stressed (D) and re-watered (R) barley plants under atmospheric [CO2] (400 and 800 ppm) and N treatments (N1 and N2) in the final harvest. The data in the table was mean ± standard error of the means (S.E.) (N = 4).
Table 2.
Leaf relative water content (RWC), leaf water potential (Ψl), water consumption (WU), leaf dry mass (DMleaf), stem dry mass (DMstem), dry matter increase (ΔDM) and water use efficiency (WUE), leaf area (LA), specific leaf area (SLA), concentration of carbon ([C]leaf) and nitrogen ([N]leaf) in leaf, the ratio of [C] to [N] in leaf ([C:N]leaf) and leaf ABA concentration ([ABA]leaf) of well-watered (W), drought-stressed (D) and re-watered (R) tomato plants under atmospheric [CO2] (400 and 800 ppm) and N treatments (N1 and N2) in the final harvest. The data in the table was mean ± standard error of the means (S.E.) (N = 4).
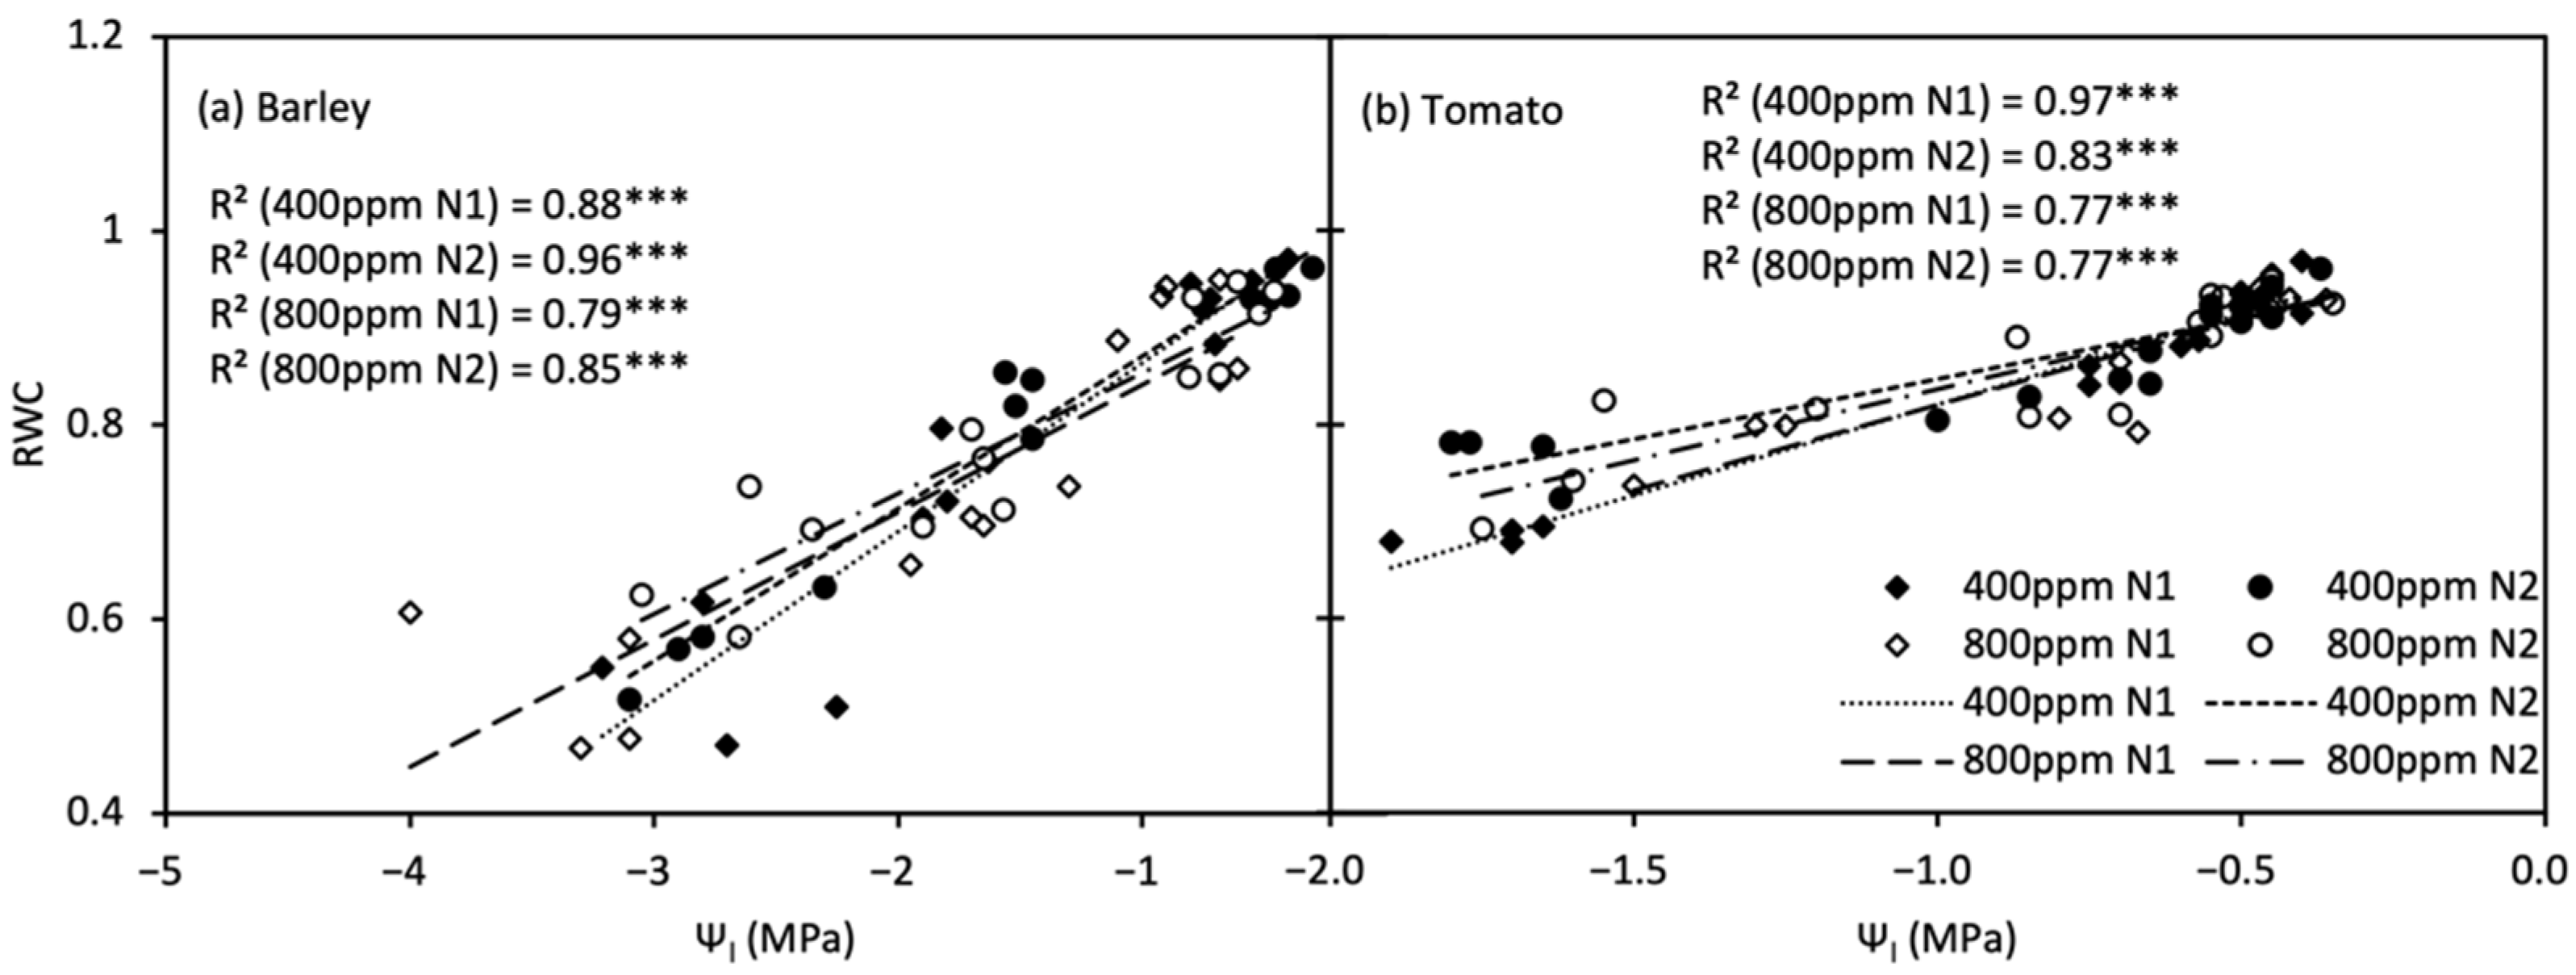
For both species, RWC was positively linearly correlated with Ψl (Figure 5), and the significant difference in the slope of the linear relationship, i.e., the relative capacitance of leaf (Cr), between [N] levels was only observed in a[CO2]-grown tomato plants.

Figure 5.
Relationship between relative water content (RWC, (a)) and leaf water potential (Ψl, (b)) of barley and tomato plants under atmospheric [CO2] (400 and 800 ppm) and N treatments (N1 and N2). *** indicate significance levels at p = 0.001.
3.3. Plant Water Consumption
For barley plants, e[CO2] significantly decreased the plant water consumption (WU) in relation to a[CO2] particularly in drought (Table 1). In tomato plants, WU in N2 plants was greater than in N1 plants, but drought weakened the difference (Table 2). Drought forced the WU of both species to decrease, though it was still lower than the well-watered controls after re-watering (Table 1 and Table 2).
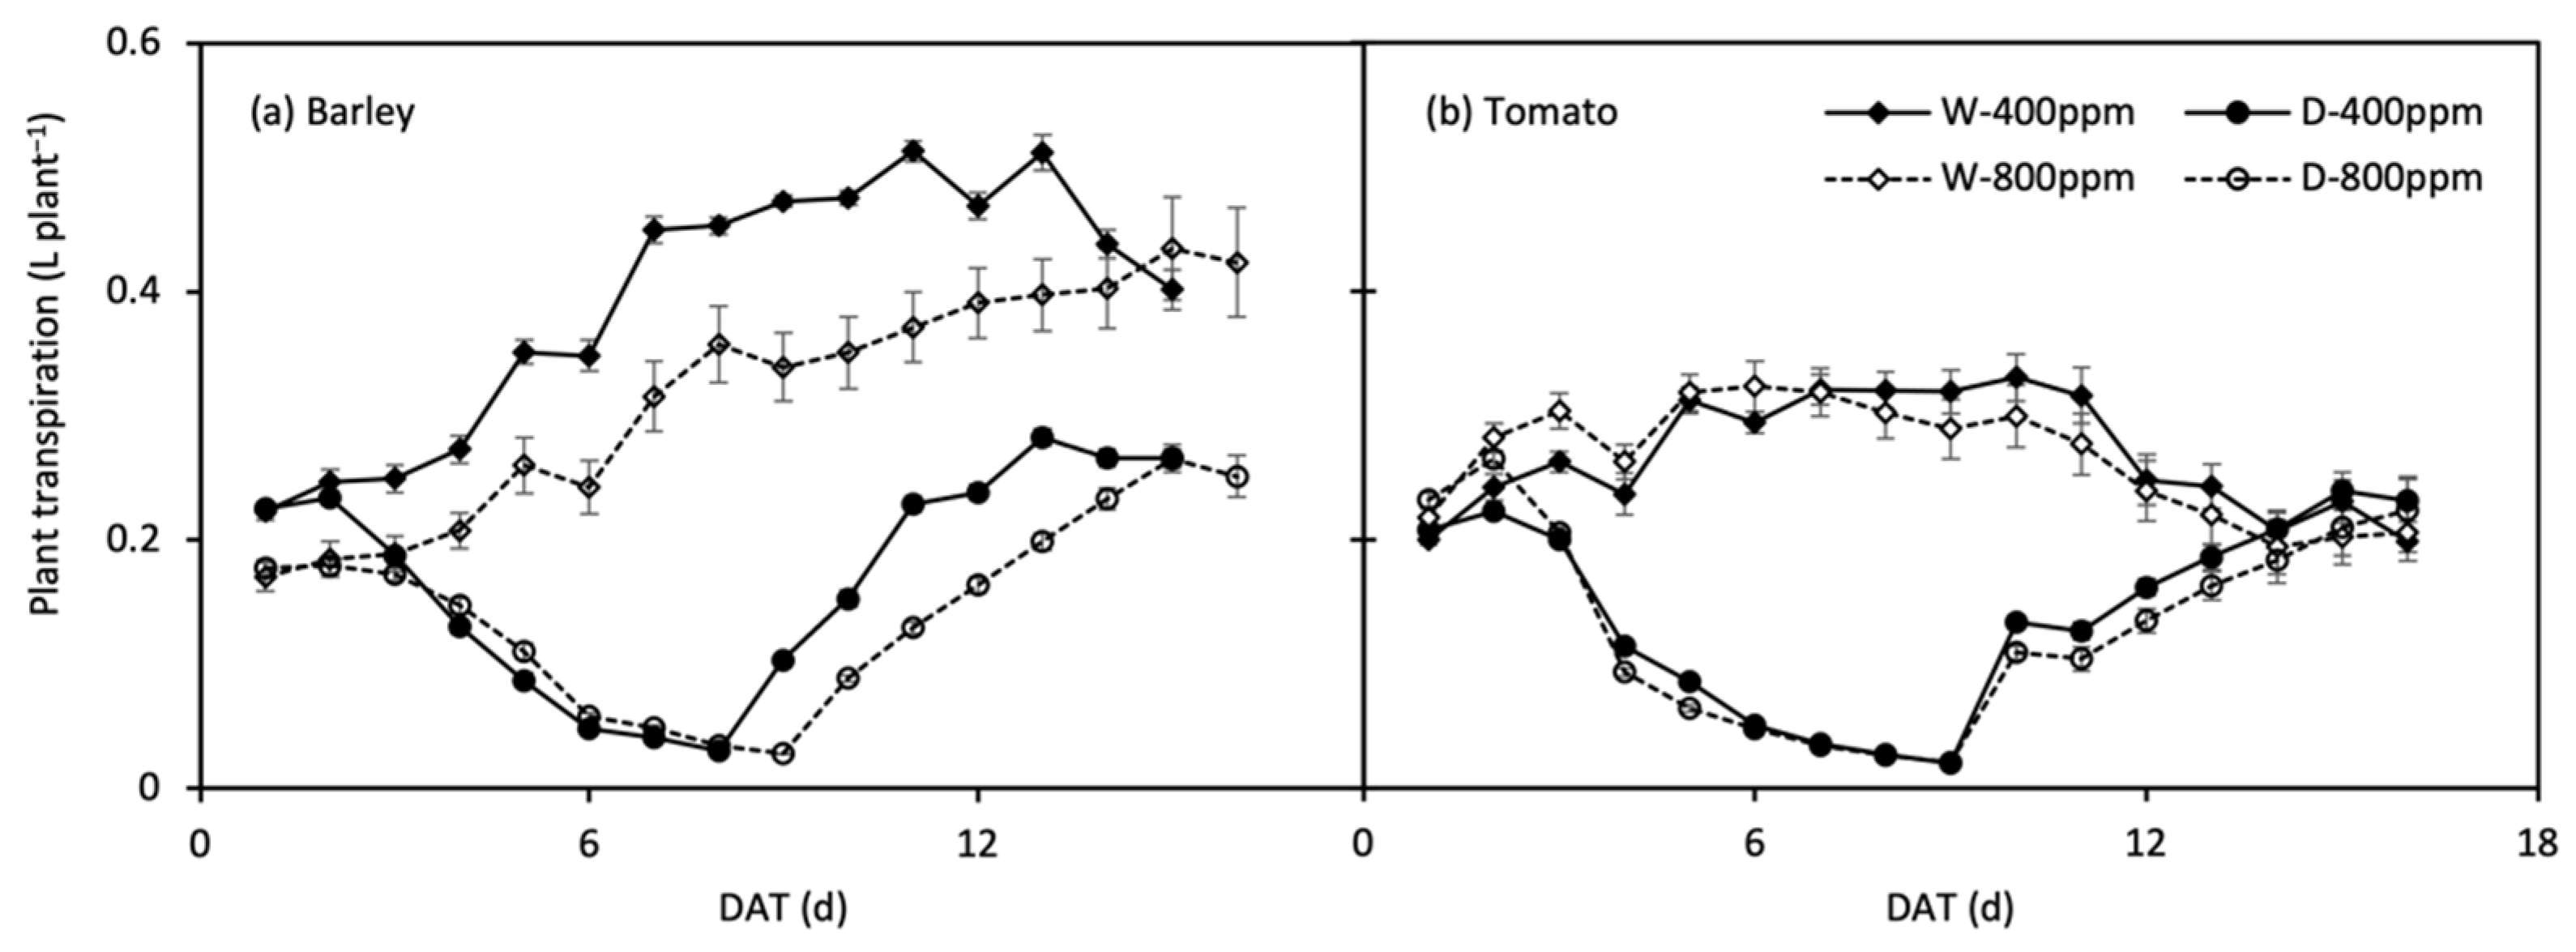
The changes in daily plant transpiration rate (Tplant) during the treatment period are shown in Figure 6. Tplant of the stressed plants were restored upon re-watering, and that of tomato plants even reached the control level. The response of Tplant to progressive soil drying was well described by the linear-plateau model (Figure 7; Table 3). At onset of soil drying, only Tplant of barley was reduced by e[CO2]. Along with the progressive soil drying, the FTSW thresholds in barley declined by the effect of e[CO2], whereas the thresholds rose/remained in N1 and N2 tomato under e[CO2], respectively. Compared with N2, the FTSW threshold was generally lower in N1, while the opposite was true for e[CO2]-grown tomato plants, where the FTSW threshold was greater in N1 than N2 (Figure 7; Table 3).
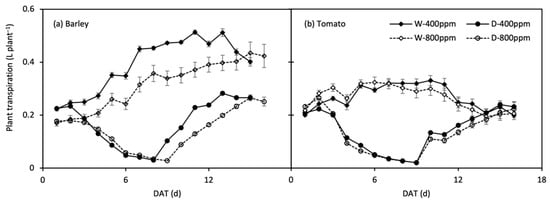
Figure 6.
Change in daily plant transpiration over time (DAT, day after treatment) in well-watered (W) and drought then re-watered (D) pots under atmospheric [CO2] (400 and 800 ppm) of barley (a) and tomato (b) plants. Error bars indicate the standard error of the means (S.E.) (n = 4).
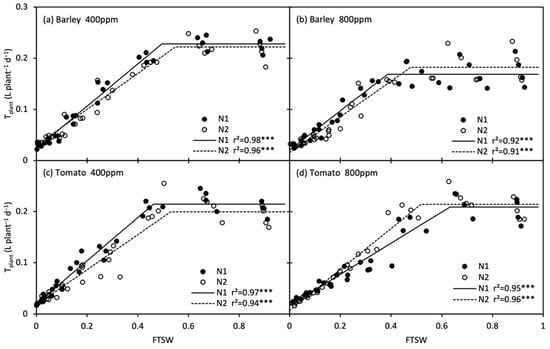
Figure 7.
Changes in daily plant transpiration (Tplant) of barley (a, b) and tomato (c, d) plants grown under atmospheric [CO2] (400 and 800 ppm) and N treatments (N1 and N2) during progressive soil drying. *** indicate significance levels at p = 0.001.
Table 3.
Results of the linear-plateau regression analyses of the responses of plant daily transpiration rate (Tplant) of barley and tomato to the reduction in fraction of transpirable soil water (FTSW). Values are means with 95% confidence interval in the parentheses.
3.4. Plant Dry Mass Accumulation and Water Use Efficiency in Plant
For barley plants, e[CO2] increased the stem dry mass (DMstem), particularly under drought, but reduced leaf dry mass (DMleaf), especially in controls, and finally increased ΔDM among three water regimes. Both DMleaf and DMstem rose by N2 treatment, contributing to greater ΔDM, and re-watering offset the decrease by drought, but it was still lower than the controls (Table 1). In tomato plants, e[CO2] significantly increased DMleaf, DMstem and ΔDM, especially under drought stress. However, N2 only helped DMleaf accumulate, whereas it promoted DMstem to decline, though it finally increased ΔDM, especially in controls. The 7-day re-watering recovered biomass accumulation to some extent but failed to reach the control levels (Table 2).
3.5. Leaf Area and Specific Leaf Area
The leaf area (LA) of barley was unexpectedly decreased by e[CO2]. N2 treatment increased LA particularly under well-watered conditions. Drought stress significantly decreased LA and re-watering recovered some, and the extent was larger at e[CO2] (Table 1). For tomato plants, N2 treatment also increased LA, but it became insignificant when under drought stress. Drought stress decreased LA, then re-watering recovered it, though still lower than that of well-watered plants. A significant increase in LA by the influence of e[CO2] was only observed under drought stress (Table 2).
Specific leaf area (SLA) of barley plants was decreased by e[CO2]. Additionally, SLA declined by drought stress and recovered to the levels of control plants after the 7-day re-watering (Table 1). For tomato plants, the decrease in SLA by e[CO2] was also noticed, particularly at well- and re-watered conditions. N2 treatment significantly increased SLA. After increasing SLA by drought, re-watering enhanced the increase only under a[CO2] (Table 2).
3.6. C and N Concentrations in Leaf
Leaf C concentration ([C]leaf) of barley plants at e[CO2] was notably greater than at a[CO2]. Only under well-watered conditions did N2 increase [C]leaf. In addition, the differences in [C]leaf among three water regimes were alleviated by N2 (Table 1). In tomato plants, [C]leaf declined at e[CO2], particularly in N1 × drought treated plants, and it increased by N2 treatment. When suffering from water deficit, [C]leaf was greater compared with that under well-watered and re-watered conditions, and the extent was more obvious in a[CO2] × N1 and e[CO2] × N2 treatments (Table 2).
Leaf N concentration ([N]leaf) in barley plants declined by e[CO2] particularly in N2 or under drought stress. It was also increased by N2, especially at a[CO2], but drought stress alleviated the positive effect of N2. Compared with the well-watered and drought-stressed plants, re-watered plants had greater [N]leaf (Table 1). Likewise, [N]leaf of tomato plants rose by e[CO2], particularly in well-watered and drought-stressed plants, and N2 treatment increased [N]leaf in tomato plants. Drought-stressed plants had the highest [N]leaf among water treatments, and re-watering significantly decreased [N]leaf but failed to reach the level of controls (Table 2).
In barley plants, the C:N in leaves ([C:N]leaf, NUE) was greater at e[CO2], especially under drought stress. N2 treatment decreased [C:N]leaf, while water deficit alleviated the effect. There was no difference in [C:N]leaf between well-watered and drought-stressed plants, whereas a significant increase was found in re-watered ones (Table 1). The [C:N]leaf of tomato plants was increased by e[CO2], and the effect was intensified in N1 or under drought stress. Additionally, it declined by N2 particularly under e[CO2], but drought alleviated the extent of the decrease. The highest [C:N]leaf was observed in well-watered plants, and re-watering recovered it to some extent, though still lower than the controls (Table 2).
3.7. Leaf ABA Concentration and the Relation with gs
N2 treatment decreased the leaf ABA concentration ([ABA]leaf) of barley plants compared with N1 treatment, especially under drought (Table 1). In tomato plants, [ABA]leaf was increased by e[CO2], especially in N1 treatment and re-watering conditions. N2 treatment only decreased [ABA]leaf of e[CO2]-grown plants (Table 2). For both species, when suffering from water deficit, they had considerably relatively greater [ABA]leaf then it declined after the 7-day re-watering, but only in tomato plants was the extent of the recovery affected by [CO2] and [N], with lower [ABA]leaf than controls when under a[CO2] or N1 (Table 1 and Table 2).
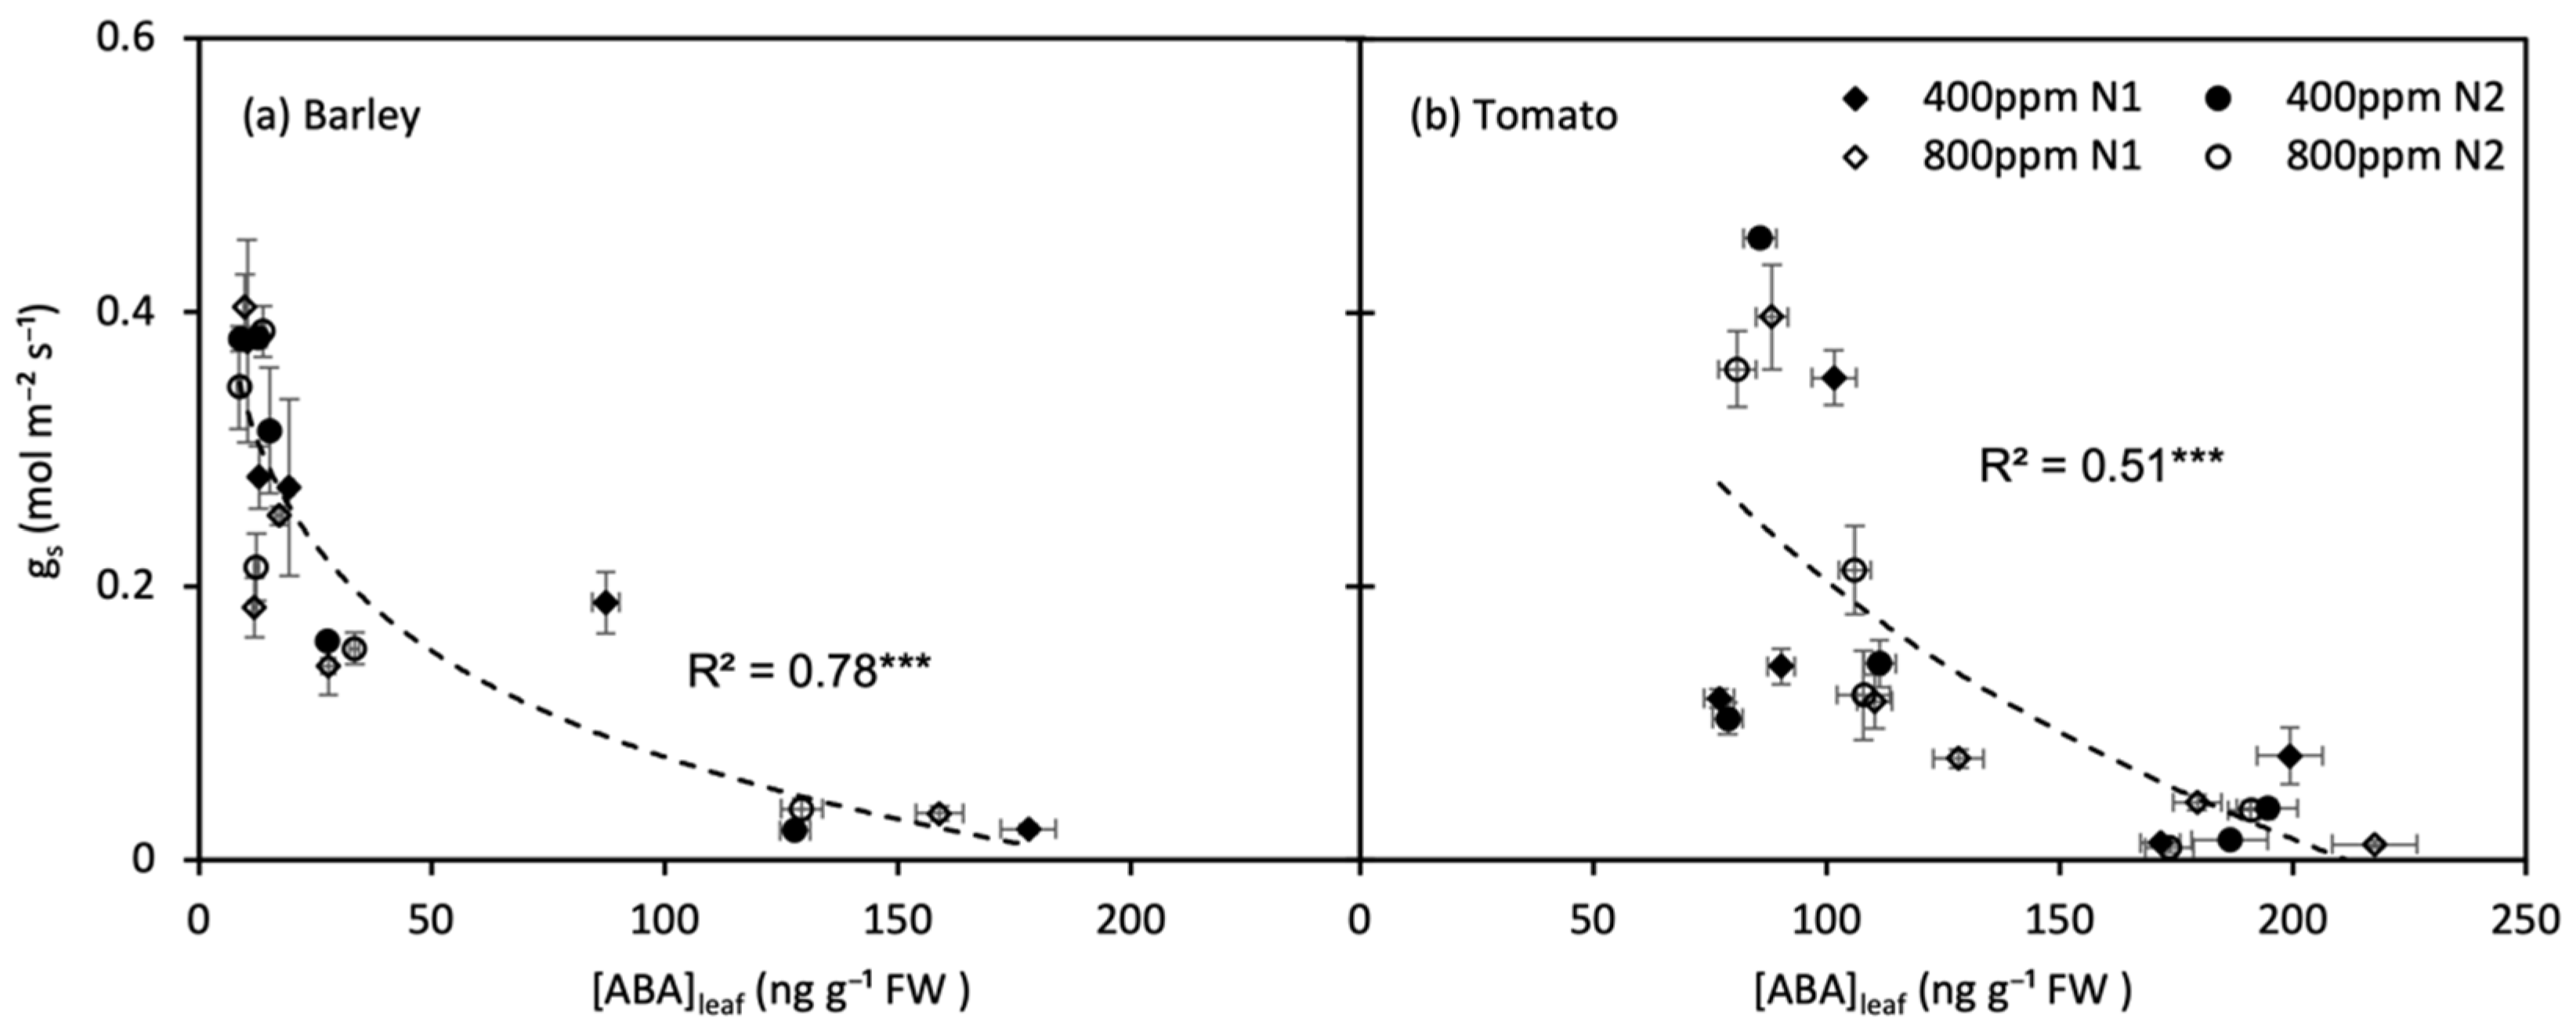
For both barley and tomato plants, the gs decreased exponentially with an increase in [ABA]leaf (p < 0.001) (Figure 8). The gs decreased more rapidly with [ABA]leaf increasing slightly during the early of soil drying, and when the soil water deficit became severe, the [ABA]leaf reached a high level, and the gs became less sensitive to [ABA]leaf variation.

Figure 8.
Relations between leaf ABA concentration ([ABA]leaf) with stomatal conductance (gs) of barley (a) and tomato (b) plants grown under atmospheric [CO2] (400 and 800 ppm) and N treatments (N1 and N2) during moderate progressive soil drying. Error bars indicate the standard error of the means (SE) (n = 4). *** indicate significance levels at p = 0.001.
4. Discussion
4.1. Responses of Leaf Gas Exchange to e[CO2] and N Treatments
Previous studies have revealed that e[CO2] decreases gs by reducing stomatal density or aperture [20,25,47]. Here, the negative effect of e[CO2] on gs was observed but only significant in tomato with N2 (high) treatment. Some recent works have demonstrated that elevated CO2 could have no effect on gs [9,48], and earlier studies suggested that the reduction in gs was mainly a compensation for increased leaf area ratio (LAR) [49,50,51]. In this study, greater DM combined with unchanged/decreased LA at e[CO2] showed a decline in LAR, implying an upward trend in gs, thereby offsetting the decrease in gs caused by e[CO2]. In addition, the reduced gs as compensation for increased LAR was enhanced with high nutrients [51]. In relation to this, it was observed that N2 attenuated the decrease in LAR, promoting a considerable reduction in gs but only in tomato plants. Meanwhile, in accordance with the general positive correlation between gs and [N]leaf [52,53,54], N2-treated barley commonly had greater gs at non- and mild-drought stress though not statistically significant, while in tomato, such positive correlation could be weakened by e[CO2]. Therefore, it is plausible that putative difference existed between monocots and dicots in the response of gs to e[CO2]. The differences in Tr among treatments were consistent with those for gs. In addition, the discrepancies in both gs and Tr between the two CO2 growth environments as well as two N treatments decreased during progressive soil drying, and they were finally absent under severe drought stress, indicating that drought has dominated the responses of gs to CO2 environments and N availability.
As expected, e[CO2] significantly increased An, mainly by accelerating the Rubisco-catalysed carboxylation process [55], thereby considerably increasing the An without the decline of gs. Even so, the differences in both WUEi and WUEleaf between the two CO2 environments were noticed only when drought stress was intensified, indicating soil water deficits may dominate both WUEi and WUEleaf, and the impacts were more pronounced in gs and Tr than in An.
In the present study, gs of both species was negatively correlated with [ABA]leaf under both [CO2] environments (Figure 8, Table 1 and Table 2), especially at early water deficit, implying that [ABA]leaf could be involved as an earlier chemical signalling inducing stomatal closure [19,20]. It is notable that besides ABA, cytokinin (CK) could be also involved in stomatal regulation [56]. It has been demonstrated that plant leaves would accumulate higher levels of CK under e[CO2] without notable increase in LA [57], and CK may participate more than ABA in plant growth regulation under e[CO2] [58]. Evidence demonstrated that the level of N supply to the plant was able to affect CK content [59], which may result in the alteration of cell division, cell expansion and cell patterning for plants grown under e[CO2] [58]. However, these possibilities need to be explored in future studies.
4.2. Variations of Plant–Water Relations under e[CO2] and Different N Treatment
It is well known that ABA-induced stomatal closure could improve plant–water relation [60,61], and such regulation is species dependent [62]. Previous studies have shown that endogenous ABA level may be affected by N nutrition in several plant species [18,63]. In relation to this, higher N level improved the sensitivity of gs to [ABA]leaf in monocot plants such as barley, for it declined at a lower [ABA]leaf level in drought stress, which could have contributed to maintaining greater Ψl as well as RWC during exposure to drought. However, for tomato plants, e[CO2] induced greater [ABA]leaf, but lower gs was only observed under N2 treatment, indicating e[CO2] could be the main factor improving plant–water relation of dicots when under adequate N supply [64]. One other point worth mentioning is that essentially, lower RWC and Ψl were found in e[CO2]-grown barley plants, contrary to tomato plants, for barley plants deployed an anisohydric behaviour, which caused Ψl and RWC to decline in response to the maintained gs in e[CO2] [65]. Evidence has proven that the relative capacitance of leaf (Cr) also correlates with the water-holding capacity of leaf [43]. On the one hand, Cr is linked with leaf thickness [66,67]; on the other hand, thickness is an essential factor for leaf mass per area (LMA, the inverse of SLA) composition and negatively correlating with SLA [68]. N2 treatment notably promoted SLA in tomato plants, thereby especially decreasing leaf thickness and Cr under a[CO2], causing the differences in RWC between N treatments only at a[CO2].
The effect of the two [CO2] environments on plant water consumption (WU) varied from species, and similar effects were also noticed in LA. Therefore, the differential effects of e[CO2] on LA can be regarded as a factor influencing WU, and a relatively lower rise in LA might be the cause of the failure to increase the WU of barley by N2. Some studies have also suggested that the effect of e[CO2] on WU depends on soil depth, through affecting the root distribution and soil water depletion in the soil profile [69,70]; thus, e[CO2] also could have no/or even a negative impact on WU in the absence of LA changes. The influence of [CO2] on the sensitivity of Tplant to progressive soil drying varied among species and N treatments; such responses could be associated with the responses of gs to soil water deficits. Higher N treatment alleviated the difference in the response of Tplant to soil water deficits between the two [CO2] environments, and elevated the sensitivity to soil water deficits of Tplant in both species except for e[CO2]-grown tomato. For barley plants, the retarded responses of Tplant to soil water deficits at e[CO2] could have significances in modifying plant drought response and WUE; the delayed reduction in Tplant during soil drying might accelerate plant death during severe drought by not restraining water loss in time, while keeping biomass production [71]. Therefore, increasing N supply especially under e[CO2] may improve this situation by conserving water by decreasing Tplant at higher FTSW threshold, helping them to accommodate prolonged drought; this was also the case for tomato plants grown under a[CO2]. However, for e[CO2]-grown tomato plants, N2 supply might be excessive, hence the reduced threshold instead, so the N supply strategy for dicots grown under e[CO2] may need further exploration.
4.3. Responses of Plant Growth to e[CO2] under Different N Treatments
Experiments have reported that e[CO2] was beneficial to crop biomass accumulation [11], and combining with unchanged/or decreased WU resulted in higher WUE in both species. In addition, the SLA of both species decreased by the effect of e[CO2], consistent with the previous meta-analysis [72] that [CO2] higher than ambient leads to increased LMA. The improved An stimulated by e[CO2] benefits the accumulation of starch, positively affecting leaf density [72], which means leaf thickness increases by large mesophyll cells instead of the number of mesophyll layers [73]. On the other hand, the effect of [CO2] on LAM is dependent on the total non-structural carbohydrates (TNC) accumulations in leaves, and increased starch accumulation also promotes LMA to increase [74], i.e., a decrease in SLA, and thus, the decrease in SLA usually coincides with an increase in leaf density. A high leaf density, reflecting a large fraction of mesophyll or a high volume of sclerenchymatic tissue and vascular bundles, may contribute to leaf and plant survival with greater leaf toughness [72,75].
Plant growth, leaf area and dry mass accumulation under appropriate N supply can be improved [40,76]. Here, compared to N1, although LA and ΔDM of both species were significantly improved in N2 treatment, DMstem of tomato plants was decreased, implying that the level of N supply modified the dry matter partitioning among different organs in tomato plants. Low nutrients, especially the lack of N, will contribute to TNC accumulation, leading to decreased SLA [72]. This decrease induced by N1 treatment in this study was notably performed in tomato plants. Unexpectedly, such effect in barley was observed but non-statistical, indicating that the effect of nutrient on leaf anatomy may be relatively smaller than other environmental effects [77], and it probably varies among species. Furthermore, other research has indicated that the variation of SLA is driven by nutrition, mainly due to alteration in leaf density, and thus, an appropriate increase N apply may promote higher concentrations of cytoplasmic compounds but lower fraction of sclerenchymatic tissue [78], presenting large-volume air spaces within the leaves. This results in a lower leaf density but enhances conductivity within the leaves, which may facilitate photosynthesis [68], and mass-based An max is also highly significantly related to SLA [79]. On the other hand, nutrient limitation leads to a strong decrease in whole-plant LA, which results in higher irradiances in lower leaves, and it also decreases SLA.
4.4. Responses of Leaf C:N Stoichiometry to e[CO2] and N Treatments
Several studies supported that e[CO2] increased [C] but decreased [N], leading to high C:N stoichiometry [38,41,80]. Therefore, the positive effect on [C]leaf was also attributed to the greater C accumulation in plant organs [81]. On the other hand, the significantly negative impact of e[CO2] on [N]leaf, frequently considered to be the result of the dilution effect [82], presumably due to the accumulation of non-structural carbohydrates [83], and the synthesis of more secondary C-based metabolites with low [N] [84], thereby leading to an increasing [C:N]leaf. Furthermore, it is widely recognized that the [C] is almost constant in all parts of natural condition-grown plants [85], while the [N] varied in the order of magnitude from different plant organs, and it also varied substantially among organs of different species [85,86], so the increased [C:N]leaf may also be indirectly driven by the shifts in biomass partitioning towards organs which have a relatively low N concentration [87]. Since Rubisco represents the enzymes involved in photosynthesis and the largest single N pool in the leaves, its metabolic down-regulation and re-allocation of N to other processes under e[CO2] can also significantly improve NUE [20,26,84,87,88]. By contrast, higher N supply (N2) induced substantial decreases in plant [C:N]leaf. In the present study, [N]leaf was found to be sensitive to both CO2 environment and N treatment. [N] was generally observed to decline under e[CO2] [38,82] and increase in higher N addition [28,89,90]. In contrast, despite [C] being significantly affected by CO2 environments [38,41,80], many studies have also reported [C] to stay relatively constant under higher N addition [91,92], indicating the pattern that greater variation in [N] than in [C] in plants may exist [83]. The changes in [C:N] of plants were more strongly correlated with N than C dynamics in most ecosystem components [41], suggesting that [C:N] dynamics in response to e[CO2] and N supply level are chiefly dependent on the change in N supply.
5. Conclusions
CO2 concentrations, the level of N supply and their interactions differentially affected growth, physiology, and water and nitrogen use efficiencies of barley and tomato plants under drought stress. The gs was mainly regulated by e[CO2]-induced stomatal performances and LAR, and e[CO2] weakened the positive impact of N2 addition on gs in dicots. The gs of barley and tomato plants was more sensitive to [ABA]leaf when under N2 and e[CO2], respectively, thereby improving water relations by earlier stomatal closure, but N2 treatment alleviated this sensitivity in e[CO2]-grown tomato. Additionally, N2 promoted Tplant to decline earlier to response water deficit hence restrained water loss in plants, but damaged or even counteracted the same positive impact of e[CO2] in tomato on this process. Moreover, for both species, e[CO2] improved NUE mainly by decreased [N]leaf, but the N2-induced [N]leaf increase also substantially decreased NUE, indicating that N availability may play a more essential role than e[CO2] in regulating NUE to some extent. Therefore, improving N availability to help plants better adapt to climate change can be promising, and it can be a considered reliable agricultural strategy from the perspective of barley growth, while the effects of N availability on the tomato still needs further research in the future. Furthermore, the concern of N availability effects on soil–plant systems under an ever-changing environment should be included as well.
Author Contributions
Conceptualization, Y.C. and F.L.; data curation, Y.C.; formal analysis, Y.C.; funding acquisition, Z.W.; investigation, Z.W., H.W., J.Z. and J.L.; methodology, F.L.; project administration, Z.W.; software, Y.C.; supervision, Z.W. and F.L.; writing—original draft, Y.C.; writing—review and editing, F.L. All authors have read and agreed to the published version of the manuscript.
Funding
This research was funded by the National Natural Science Foundation of China, grant number 51909220.
Institutional Review Board Statement
Not applicable.
Informed Consent Statement
Not applicable.
Data Availability Statement
Not applicable.
Conflicts of Interest
The authors declare no conflict of interest.
References
- Hansen, J.; Sato, M. Greenhouse gas growth rates. Proc. Natl. Acad. Sci. USA 2004, 101, 16109–16114. [Google Scholar] [CrossRef] [PubMed] [Green Version]
- Cotton, T.E.A.; Fitter, A.H.; Miller, R.M.; Dumbrell, A.J.; Helgason, T. Fungi in the future: Interannual variation and effects of atmospheric change on arbuscular mycorrhizal fungal communities. New Phytol. 2015, 205, 1598–1607. [Google Scholar] [CrossRef] [PubMed] [Green Version]
- Panneerselvam, P.; Kumar, U.; Senapati, A.; Parameswaran, C.; Anandan, A.; Kumar, A.; Jahan, A.; Padhy, S.R.; Nayak, A.K. Influence of elevated CO2 on arbuscular mycorrhizal fungal community elucidated using Illumina MiSeq platform in sub-humid tropical paddy soil. Appl. Soil Ecol. 2020, 145, 103344. [Google Scholar] [CrossRef]
- Kirtman, B.; Power, S.B.; Adedoyin, A.J.; Boer, G.J.; Bojariu, R.; Camilloni, I.; Doblas-Reyes, F.; Fiore, A.M.; Kimoto, M.; Meehl, G.; et al. Near-term Climate Change: Projections and Predictability. In Climate Change 2013: The Physical Science Basis. Contribution of Working Group I to the Fifth Assessment Report of the Intergovernmental Panel on Climate Change; Stocker, T.F., Qin, D., Plattner, G.-K., Tignor, M., Allen, S.K., Boschung, J., Nauels, A., Xia, Y., Bex, V., Midgley, P.M., Eds.; Cambridge University Press: Cambridge, UK; New York, NY, USA, 2013; pp. 953–1028. [Google Scholar]
- Lawlor, D.W. Carbon and nitrogen assimilation in relation to yield: Mechanisms are the key to understanding production systems. J. Exp. Bot. 2002, 53, 773–787. [Google Scholar] [CrossRef] [PubMed]
- Li, X.; Jiang, D.; Liu, F. Dynamics of amino acid carbon and nitrogen and relationship with grain protein in wheat under elevated CO 2 and soil warming. Environ. Exp. Bot. 2016, 132, 121–129. [Google Scholar] [CrossRef]
- Myers, S.S.; Zanobetti, A.; Kloog, I.; Huybers, P.; Leakey, A.D.B.; Bloom, A.J.; Carlisle, E.; Dietterich, L.H.; Fitzgerald, G.; Hasegawa, T.; et al. Increasing CO2 threatens human nutrition. Nature 2014, 510, 139–142. [Google Scholar] [CrossRef] [PubMed]
- Way, D.A.; Oren, R.; Kroner, Y. The space-time continuum: The effects of elevated CO2 and temperature on trees and the importance of scaling. Plant Cell Environ. 2015, 38, 991–1007. [Google Scholar] [CrossRef]
- Fauset, S.; Oliveira, L.; Buckeridge, M.S.; Foyer, C.H.; Galbraith, D.; Tiwari, R.; Gloor, M. Contrasting responses of stomatal conductance and photosynthetic capacity to warming and elevated CO2 in the tropical tree species Alchornea glandulosa under heatwave conditions. Environ. Exp. Bot. 2019, 158, 28–39. [Google Scholar] [CrossRef]
- Wei, Z.; Du, T.; Li, X.; Fang, L.; Liu, F. Interactive effects of CO2 concentration elevation and nitrogen fertilization on water and nitrogen use efficiency of tomato grown under reduced irrigation regimes. Agric. Water Manag. 2018, 202, 174–182. [Google Scholar] [CrossRef]
- Leakey, A.; Ainsworth, E.A.; Bernacchi, C.; Rogers, A.; Long, S.; Ort, D.R. Elevated CO2 effects on plant carbon, nitrogen, and water relations: Six important lessons from FACE. J. Exp. Bot. 2009, 60, 2859–2876. [Google Scholar] [CrossRef]
- Shangguan, Z.; Shao, M.; Dyckmans, J. Nitrogen nutrition and water stress effects on leaf photosynthetic gas exchange and water use efficiency in winter wheat. Environ. Exp. Bot. 2000, 44, 141–149. [Google Scholar] [CrossRef]
- Zhao, D.; Reddy, K.R.; Kakani, V.G.; Reddy, V. Nitrogen deficiency effects on plant growth, leaf photosynthesis, and hyperspectral reflectance properties of sorghum. Eur. J. Agron. 2005, 22, 391–403. [Google Scholar] [CrossRef]
- Dordas, C.A.; Sioulas, C. Safflower yield, chlorophyll content, photosynthesis, and water use efficiency response to nitrogen fertilization under rainfed conditions. Ind. Crop. Prod. 2008, 27, 75–85. [Google Scholar] [CrossRef]
- Ciompi, S.; Gentili, E.; Guidi, L.; Soldatini, G.F. The effect of nitrogen deficiency on leaf gas exchange and chlorophyll fluorescence parameters in sunflower. Plant Sci. 1996, 118, 177–184. [Google Scholar] [CrossRef]
- Wang, C.; Wu, S.; Tankari, M.; Zhang, X.; Li, L.; Gong, D.; Hao, W.; Zhang, Y.; Mei, X.; Wang, Y.; et al. Stomatal aperture rather than nitrogen nutrition determined water use efficiency of tomato plants under nitrogen fertigation. Agric. Water Manag. 2018, 209, 94–101. [Google Scholar] [CrossRef]
- Liu, F.; Andersen, M.N.; Jacobsen, S.-E.; Jensen, C.R. Stomatal control and water use efficiency of soybean (Glycine max L. Merr.) during progressive soil drying. Environ. Exp. Bot. 2005, 54, 33–40. [Google Scholar] [CrossRef]
- Wang, Y.; Liu, F.; Andersen, M.N.; Jensen, C.R. Improved plant nitrogen nutrition contributes to higher water use efficiency in tomatoes under alternate partial root-zone irrigation. Funct. Plant Biol. 2010, 37, 175–182. [Google Scholar] [CrossRef]
- Zhang, F.-P.; Sussmilch, F.; Nichols, D.S.; Cardoso, A.A.; Brodribb, T.J.; McAdam, S.A.M. Leaves, not roots or floral tissue, are the main site of rapid, external pressure-induced ABA biosynthesis in angiosperms. J. Exp. Bot. 2018, 69, 1261–1267. [Google Scholar] [CrossRef] [PubMed]
- Liu, J.; Hu, T.; Fang, L.; Peng, X.; Liu, F. CO2 elevation modulates the response of leaf gas exchange to progressive soil drying in tomato plants. Agric. For. Meteorol. 2019, 268, 181–188. [Google Scholar] [CrossRef]
- Li, S.; Li, X.; Wei, Z.; Liu, F. ABA-mediated modulation of elevated CO2 on stomatal response to drought. Curr. Opin. Plant Biol. 2020, 56, 174–180. [Google Scholar] [CrossRef] [PubMed]
- Engineer, C.B.; Hashimoto-Sugimoto, M.; Negi, J.; Israelsson-Nordström, M.; Azoulay-Shemer, T.; Rappel, W.-J.; Iba, K.; Schroeder, J.I. CO2 Sensing and CO2 Regulation of Stomatal Conductance: Advances and Open Questions. Trends Plant Sci. 2016, 21, 16–30. [Google Scholar] [CrossRef] [PubMed] [Green Version]
- Tausz-Posch, S.; Dempsey, R.W.; Seneweera, S.; Norton, R.M.; Fitzgerald, G.; Tausz, M. Does a freely tillering wheat cultivar benefit more from elevated CO2 than a restricted tillering cultivar in a water-limited environment? Eur. J. Agron. 2015, 64, 21–28. [Google Scholar] [CrossRef]
- Teplova, I.; Veselov, S.; Kudoyarova, G. Changes in ABA and IAA content in the roots and shoots of wheat seedlings under nitrogen deficiency. In Root Demographics and Their Efficiencies in Sustainable Agriculture, Grasslands and Forest Ecosystems; Springer: Dordrecht, The Netherlands, 1998; pp. 599–605. [Google Scholar]
- Wei, Z.; Fang, L.; Li, X.; Liu, J.; Liu, F. Effects of elevated atmospheric CO2 on leaf gas exchange response to progressive drought in barley and tomato plants with different endogenous ABA levels. Plant Soil 2020, 447, 431–446. [Google Scholar] [CrossRef]
- Drake, B.G.; Gonzalez-Meler, M.A.; Long, S.P. More efficient plants: A consequence of rising atmospheric CO2? Annu. Rev. Plant Physiol. Plant Mol. Biol. 1997, 48, 609–639. [Google Scholar] [CrossRef] [PubMed] [Green Version]
- Pazzagli, P.T.; Weiner, J.; Liu, F. Effects of CO2 elevation and irrigation regimes on leaf gas exchange, plant water relations, and water use efficiency of two tomato cultivars. Agric. Water Manag. 2016, 169, 26–33. [Google Scholar] [CrossRef]
- Yang, X.; Zhang, P.; Wei, Z.; Liu, J.; Hu, X.; Liu, F. Effects of elevated CO2 and nitrogen supply on leaf gas exchange, plant water relations and nutrient uptake of tomato plants exposed to progressive soil drying. Sci. Hortic. 2022, 292, 110643. [Google Scholar] [CrossRef]
- Cai, J.; Jiang, D.; Wollenweber, B.; Dai, T.; Cao, W. Effects of nitrogen application rate on dry matter redistribution, grain yield, nitrogen use efficiency and photosynthesis in malting barley. Acta Agric. Scand. Sect. B—Soil Plant Sci. 2012, 62, 410–419. [Google Scholar] [CrossRef]
- Tambussi, E.; Nogues, S.; Ferrio, P.; Voltas, J.; Araus, J. Does higher yield potential improve barley performance in Mediterranean conditions?: A case study. Field Crop. Res. 2005, 91, 149–160. [Google Scholar] [CrossRef]
- Gonzalez-Dugo, V.; Durand, J.L.; Gastal, F. Water deficit and nitrogen nutrition of crops. A review. Agron. Sustain. Dev. 2010, 30, 539–544. [Google Scholar] [CrossRef] [Green Version]
- Jiang, D.; Fan, X.; Dai, T.; Cao, W. Nitrogen fertiliser rate and post-anthesis waterlogging effects on carbohydrate and nitrogen dynamics in wheat. Plant Soil 2008, 304, 301–314. [Google Scholar] [CrossRef]
- Cernusak, L.A.; Winter, K.; Aranda, J.; Turner, B.L.; Marshall, J.D. Transpiration efficiency of a tropical pioneer tree (Ficus insipida) in relation to soil fertility. J. Exp. Bot. 2007, 58, 3549–3566. [Google Scholar] [CrossRef] [PubMed]
- Cabrera-Bosquet, L.; Molero, G.; Nogués, S.; Araus, J.L. Water and nitrogen conditions affect the relationships of Δ13C and Δ18O to gas exchange and growth in durum wheat. J. Exp. Bot. 2009, 60, 1633–1644. [Google Scholar] [CrossRef]
- Warren, C.R.; Dreyer, E. Temperature response of photosynthesis and internal conductance to CO2: Results from two independent approaches. J. Exp. Bot. 2006, 57, 3057–3067. [Google Scholar] [CrossRef] [PubMed] [Green Version]
- Meidner, H.; Mansfield, T.A. Physiology of Stomata; McGraw-Hill: London, UK, 1968. [Google Scholar]
- Yu, G.; Wang, Q. Ecophysiology of Plant Photosynthesis, Transpiration, and Water Use; Science Press: Beijing, China, 2010. [Google Scholar]
- Wang, C.; Sun, Y.; Chen, H.Y.; Ruan, H. Effects of elevated CO2 on the C:N stoichiometry of plants, soils, and microorganisms in terrestrial ecosystems. Catena 2021, 201, 105219. [Google Scholar] [CrossRef]
- Huppe, H.C.; Turpin, D.H. Integration of Carbon and Nitrogen Metabolism in Plant and Algal Cells. Annu. Rev. Plant Biol. 1994, 45, 577–607. [Google Scholar] [CrossRef]
- Cechin, I.; Fumis, T.d.F. Effect of nitrogen supply on growth and photosynthesis of sunflower plants grown in the greenhouse. Plant Sci. 2004, 166, 1379–1385. [Google Scholar] [CrossRef]
- Yang, Y.; Luo, Y.; Lu, M.; Schädel, C.; Han, W. Terrestrial C:N stoichiometry in response to elevated CO2 and N addition: A synthesis of two meta-analyses. Plant Soil 2011, 343, 393–400. [Google Scholar] [CrossRef]
- Yuanshengtaiseeds. Kaideyali 1832. Available online: http://www.ystseeds.com/shop/fqzz/fgfq/120.html (accessed on 6 May 2022).
- Liu, F.; Stützel, H. Leaf water relations of vegetable amaranth (Amaranthus spp.) in response to soil drying. Eur. J. Agron. 2002, 16, 137–150. [Google Scholar] [CrossRef]
- Zhang, P.; Yang, X.; Chen, Y.; Wei, Z.; Liu, F. Dissecting the combined effects of air temperature and relative humidity on water-use efficiency of barley under drought stress. J. Agron. Crop Sci. 2021, 207, 606–617. [Google Scholar] [CrossRef]
- Yang, X.; Shao, M.; Li, T.; Zhang, Q.; Gan, M.; Chen, M.; Bai, X. Distribution of soil nutrients under typical artificial vegetation in the desert–loess transition zone. Catena 2021, 200, 105165. [Google Scholar] [CrossRef]
- Asch, F. Determination of Abscisic Acid by Indirect Enzyme Linked Immuno Sorbent Assay (ELISA); Laboratory for Agro-hydrology and Bioclimatology, Department of Agricultural Sciences, The Royal Veterinary and Agricultural University: Taastrup, Denmark, 2000; pp. 12–56. [Google Scholar]
- Yan, F.; Li, X.; Liu, F. ABA signaling and stomatal control in tomato plants exposure to progressive soil drying under ambient and elevated atmospheric CO2 concentration. Environ. Exp. Bot. 2017, 139, 99–104. [Google Scholar] [CrossRef]
- Slot, M.; Rifai, S.W.; Winter, K. Photosynthetic plasticity of a tropical tree species, Tabebuia rosea, in response to elevated temperature and [CO2]. Plant Cell Environ. 2021, 44, 2347–2364. [Google Scholar] [CrossRef] [PubMed]
- Eamus, D. Responses of field grown trees to CO2 enrichment. Commonw. For. Rev. 1996, 1, 39–47. [Google Scholar]
- Reid, C.D.; Maherali, H.; Johnson, H.B.; Smith, S.D.; Wullschleger, S.D.; Jackson, R.B. On the relationship between stomatal characters and atmospheric CO2. Geophys. Res. Lett. 2003, 30. [Google Scholar] [CrossRef] [Green Version]
- Saxe, H.; Ellsworth, D.S.; Heath, J. Tree and forest functioning in an enriched CO2 atmosphere. New Phytol. 1998, 139, 395–436. [Google Scholar] [CrossRef]
- Field, C.; Mooney, H.A. The photosynthesis-nitrogen relationship in wild plants. In On the Economy of Plant Form and Function; Givnish, T.J., Ed.; Cambridge University Press: Cambridge, UK, 1986; pp. 25–55. [Google Scholar]
- Schulze, E.-D.; Kelliher, F.M.; Körner, C.; Lloyd, J.; Leuning, R. Relationships among maximum stomatal conductance, ecosystem surface conductance, carbon assimilation rate, and plant nitrogen nutrition: A global ecology scaling exercise. Annu. Rev. Ecol. Syst. 1994, 25, 629–662. [Google Scholar] [CrossRef]
- Franks, P.J.; Drake, P.L.; Beerling, D.J. Plasticity in maximum stomatal conductance constrained by negative correlation between stomatal size and density: An analysis using Eucalyptus globulus. Plant Cell Environ. 2009, 32, 1737–1748. [Google Scholar] [CrossRef] [PubMed]
- Ainsworth, E.A.; Rogers, A. The response of photosynthesis and stomatal conductance to rising [CO2]: Mechanisms and en-vironmental interactions. Plant Cell Environ. 2007, 30, 258–270. [Google Scholar] [CrossRef] [PubMed]
- Verslues, P.E. ABA and cytokinins: Challenge and opportunity for plant stress research. Plant Mol. Biol. 2016, 91, 629–640. [Google Scholar] [CrossRef] [PubMed]
- Yong, J.W.H.; Wong, S.C.; Letham, D.S.; Hocart, C.H.; Farquhar, G.D. Effects of Elevated [CO2] and Nitrogen Nutrition on Cytokinins in the Xylem Sap and Leaves of Cotton. Plant Physiol. 2000, 124, 767–780. [Google Scholar] [CrossRef] [PubMed] [Green Version]
- Masle, J. The Effects of Elevated CO2 Concentrations on Cell Division Rates, Growth Patterns, and Blade Anatomy in Young Wheat Plants Are Modulated by Factors Related to Leaf Position, Vernalization, and Genotype. Plant Physiol. 2000, 122, 1399–1416. [Google Scholar] [CrossRef] [Green Version]
- Jackson, M. Are plant hormones involved in root to shoot communication? Adv. Bot. Res. 1993, 19, 103–187. [Google Scholar]
- Chaves, M.M.; Costa, J.M.; Zarrouk, O.; Pinheiro, C.; Lopes, C.M.; Pereira, J.S. Controlling stomatal aperture in semi-arid regions—The dilemma of saving water or being cool? Plant Sci. 2016, 251, 54–64. [Google Scholar] [CrossRef] [PubMed]
- Dodd, I.C.; Theobald, J.C.; Richer, S.K.; Davies, W.J. Partial phenotypic reversion of ABA-deficient flacca tomato (Solanum lycopersicum) scions by a wild-type rootstock: Normalizing shoot ethylene relations promotes leaf area but does not diminish whole plant transpiration rate. J. Exp. Bot. 2009, 60, 4029–4039. [Google Scholar] [CrossRef]
- Bunce, J.A. Long-Term Growth of Alfalfa and Orchard Grass Plots at Elevated Carbon Dioxide. J. Biogeogr. 1995, 22, 341–348. [Google Scholar] [CrossRef]
- Kiba, T.; Kudo, T.; Kojima, M.; Sakakibara, H. Hormonal control of nitrogen acquisition: Roles of auxin, abscisic acid, and cytokinin. J. Exp. Bot. 2011, 62, 1399–1409. [Google Scholar] [CrossRef] [PubMed]
- Wullschleger, S.; Tschaplinski, T.; Norby, R. Plant water relations at elevated CO2–implications for water-limited environments. Plant Cell Environ. 2002, 25, 319–331. [Google Scholar] [CrossRef] [PubMed] [Green Version]
- Tardieu, F.; Simonneau, T. Variability among species of stomatal control under fluctuating soil water status and evaporative demand: Modelling isohydric and anisohydric behaviours. J. Exp. Bot. 1998, 49, 419–432. [Google Scholar] [CrossRef] [Green Version]
- Blackman, C.J.; Brodribb, T.J. Two measures of leaf capacitance: Insights into the water transport pathway and hydraulic conductance in leaves. Funct. Plant Biol. 2011, 38, 118–126. [Google Scholar] [CrossRef] [PubMed] [Green Version]
- Sack, L.; Cowan, P.D.; Jaikumar, N.; Holbrook, N.M. The ‘hydrology’ of leaves: Co-ordination of structure and function in temperate woody species. Plant Cell Environ. 2003, 26, 1343–1356. [Google Scholar] [CrossRef] [Green Version]
- Niinemets, Ü. Research review. Components of leaf dry mass per area–thickness and density–alter leaf photosynthetic capacity in reverse directions in woody plants. New Phytol. 1999, 144, 35–47. [Google Scholar] [CrossRef]
- Qiao, Y.; Zhang, H.; Dong, B.; Shi, C.; Li, Y.; Zhai, H.; Liu, M. Effects of elevated CO2 concentration on growth and water use efficiency of winter wheat under two soil water regimes. Agric. Water Manag. 2010, 97, 1742–1748. [Google Scholar] [CrossRef]
- Derner, J.; Polley, H.; Johnson, H.; Tischler, C. Root system response of C4 grass seedlings to CO2 and soil water. Plant Soil 2001, 231, 97–104. [Google Scholar] [CrossRef]
- Will, R.E.; Wilson, S.M.; Zou, C.B.; Hennessey, T.C. Increased vapor pressure deficit due to higher temperature leads to greater transpiration and faster mortality during drought for tree seedlings common to the forest–grassland ecotone. New Phytol. 2013, 200, 366–374. [Google Scholar] [CrossRef]
- Poorter, H.; Niinemets, Ü.; Poorter, L.; Wright, I.J.; Villar, R. Causes and consequences of variation in leaf mass per area (LMA): A meta-analysis. New Phytol. 2009, 182, 565–588. [Google Scholar] [CrossRef] [PubMed]
- Sims, D.A.; Seemann, J.R.; Luo, Y. Elevated CO2 concentration has independent effects on expansion rates and thickness of soybean leaves across light and nitrogen gradients. J. Exp. Bot. 1998, 49, 583–591. [Google Scholar] [CrossRef]
- Roumet, C.; Laurent, G.; Roy, J. Leaf structure and chemical composition as affected by elevated CO2: Genotypic responses of two perennial grasses. New Phytol. 1999, 143, 73–81. [Google Scholar] [CrossRef]
- Alvarez-Clare, S.; Kitajima, K. Physical defence traits enhance seedling survival of neotropical tree species. Funct. Ecol. 2007, 21, 1044–1054. [Google Scholar] [CrossRef]
- Lebauer, D.S.; Treseder, K.K. Nitrogen limitation of net primary productivity in terrestrial ecosystems is globally distributed. Ecology 2008, 89, 371–379. [Google Scholar] [CrossRef] [Green Version]
- Shields, L.M. Leaf xeromorphy as related to physiological and structural influences. Bot. Rev. 1950, 16, 399–447. [Google Scholar] [CrossRef]
- Mediavilla, S.; Garcia-Ciudad, A.; Garcia-Criado, B.; Escudero, A. Testing the correlations between leaf life span and leaf structural reinforcement in 13 species of European Mediterranean woody plants. Funct. Ecol. 2008, 22, 787–793. [Google Scholar] [CrossRef]
- Reich, P.B.; Ellsworth, D.S.; Walters, M.B. Leaf structure (specific leaf area) modulates photosynthesis-nitrogen relations: Evidence from within and across species and functional groups. Funct. Ecol. 1998, 12, 948–958. [Google Scholar] [CrossRef]
- Sardans, J.; Rivas-Ubach, A.; Peñuelas, J. The C:N:P stoichiometry of organisms and ecosystems in a changing world: A review and perspectives. Perspect. Plant Ecol. Evol. Syst. 2012, 14, 33–47. [Google Scholar] [CrossRef]
- McKenzie, S.W.; Johnson, S.N.; Jones, T.H.; Ostle, N.J.; Hails, R.S.; Vanbergen, A.J. Root herbivores drive changes to plant primary chemistry, but root loss is mitigated under elevated atmospheric CO2. Front. Plant Sci. 2016, 7, 837. [Google Scholar] [CrossRef] [Green Version]
- Deng, Q.; Hui, D.; Luo, Y.; Elser, J.; Wang, Y.P.; Loladze, I.; Zhang, Q.; Dennis, S. Down-regulation of tissue N:P ratios in terrestrial plants by elevated CO2. Ecology 2015, 96, 3354–3362. [Google Scholar] [CrossRef] [PubMed] [Green Version]
- Güsewell, S. N:P ratios in terrestrial plants: Variation and functional significance. New Phytol. 2004, 164, 243–266. [Google Scholar] [CrossRef]
- Gifford, R.M.; Barrett, D.J.; Lutze, J.L. The effects of elevated [CO2] on the C:N and C:P mass ratios of plant tissues. Plant Soil 2000, 224, 1–14. [Google Scholar] [CrossRef]
- He, J.-S.; Fang, J.; Wang, Z.; Guo, D.; Flynn, D.F.B.; Geng, Z. Stoichiometry and large-scale patterns of leaf carbon and nitrogen in the grassland biomes of China. Oecologia 2006, 149, 115–122. [Google Scholar] [CrossRef] [PubMed]
- Reich, P.B.; Oleksyn, J. Global patterns of plant leaf N and P in relation to temperature and latitude. Proc. Natl. Acad. Sci. USA 2004, 101, 11001–11006. [Google Scholar] [CrossRef] [Green Version]
- Elser, J.J.; Fagan, W.F.; Kerkhoff, A.J.; Swenson, N.G.; Enquist, B.J. Biological stoichiometry of plant production: Metabolism, scaling and ecological response to global change. New Phytol. 2010, 186, 593–608. [Google Scholar] [CrossRef] [Green Version]
- Reddy, A.R.; Rasineni, G.K.; Raghavendra, A.S. The impact of global elevated CO2 concentration on photosynthesis and plant productivity. Curr. Sci. 2010, 99, 46–57. [Google Scholar]
- Reich, P.B.; Tilman, D.; Craine, J.; Ellsworth, D.S.; Tjoelker, M.G.; Knops, J.; Wedin, D.; Naeem, S.; Bahauddin, D.; Goth, J. Do species and functional groups differ in acquisition and use of C, N and water under varying atmospheric CO2 and N availa-bility regimes? A field test with 16 grassland species. New Phytol. 2001, 150, 435–448. [Google Scholar] [CrossRef] [Green Version]
- Knops, J.M.H.; Naeem, S.; Reich, P.B. The impact of elevated CO2, increased nitrogen availability and biodiversity on plant tissue quality and decomposition. Glob. Chang. Biol. 2007, 13, 1960–1971. [Google Scholar] [CrossRef]
- Luo, Z.B.; Calfapietra, C.; Liberloo, M.; Scarascia-Mugnozza, G.; Polle, A. Carbon partitioning to mobile and structural frac-tions in poplar wood under elevated CO2 (EUROFACE) and N fertilization. Glob. Chang. Biol. 2006, 12, 272–283. [Google Scholar] [CrossRef]
- Cui, Q.; Lü, X.-T.; Wang, Q.-B.; Han, X.-G. Nitrogen fertilization and fire act independently on foliar stoichiometry in a temperate steppe. Plant Soil 2010, 334, 209–219. [Google Scholar] [CrossRef]


Publisher’s Note: MDPI stays neutral with regard to jurisdictional claims in published maps and institutional affiliations. |
© 2022 by the authors. Licensee MDPI, Basel, Switzerland. This article is an open access article distributed under the terms and conditions of the Creative Commons Attribution (CC BY) license (https://creativecommons.org/licenses/by/4.0/).