Article

Durum Wheat Response to Organic and Mineral Fertilization with Application of Different Levels and Types of Phosphorus-Based Fertilizers

1
Department of Agricultural and Environmental Science, University of Bari Aldo Moro, Via G. Amendola 165/A, 70126 Bari, Italy
2
Department of Biology, University of Bari Aldo Moro, 70126 Bari, Italy
3
Department of Soil, Plant and Food Sciences, University of Bari Aldo Moro, 70126 Bari, Italy
4
Department of Bioenergy, Biorefinery and Green Chemistry (TERIN-BBC-BIC)-Italian National Agency for the New Technologies, Energy and Sustainable Economic Development (ENEA)-Territorial Office of Bari, Via Giulio Petroni 15/F, 70124 Bari, Italy
*
Author to whom correspondence should be addressed.
Agronomy 2022, 12(8), 1861; https://doi.org/10.3390/agronomy12081861
Submission received: 7 June 2022 / Revised: 4 July 2022 / Accepted: 5 August 2022 / Published: 6 August 2022

Abstract

:
The use of green compost is a suitable technology to recycle organic waste into environmentally friendly soil improvement mitigating the pressure on landfills and contributing to sustainability. Among the major nutrients, phosphorus (P) stands at a significant position for seed and fruit quality, photosynthesis, and metabolic function in plants. This work evaluates the effects of different doses of mineral/organic fertilizers on two durum wheat cultivars: Anco Marzio and Vespucci. The fertilization trials compared one unfertilized control test and six treatments performed with different types of fertilizers (four minerals and two organics, based on green compost). Grain yield, compared with the unfertilized control, increased with the mineral fertilization by 125.5% for Anco Marzio and 136.42% for Vespucci, while organic fertilization alone determined an increase of 25.52% and 30.92% for Anco Marzio and Vespucci, respectively. The contribution of a higher dose of phosphorus (140 kg ha−1), combined with nitrogen and potassium, favored a further increase in grain production (+9.34%), compared with 100 kg ha−1. The content of chlorophylls and carotenoids was highly increased (5%) in both the cultivars by all kinds of phosphate fertilization, whereas an increase in the phosphate content of caryopses resulted in Anco Marzio across the two years but not in Vespucci. Among the two cultivars of durum wheat, Vespucci produced a greater quantity of grains but with a less vitreous consistency and poorer in proteins than Anco Marzio. The fertilization management also influenced the wheat behavior to stripe yellow rust attack by showing the highest index severity with the compost-based fertilization. The best management of fertilizers associated with the use of more phosphorus-use-efficient genotypes, are essential for improving quality and for the development of a sustainable agriculture.

1. Introduction

Phosphorus (P) is one of the main nutrients influencing all biological processes of plants and its role in enhancing tillering and growth is well recognized [1]. As part of nucleotides (e.g., ATP synthesis), it has an important role in energy transfer reactions [2,3]. P is also involved in root development and metabolic activities, especially in protein synthesis [4]. In addition, phosphate concentration in chloroplasts determines phosphorylated sugar transport and starch synthesis [5]. P availability is among the major growth limiting factors in many ecosystems worldwide. Due to low P availability to plants, large amounts of phosphate-based fertilizers are generally needed for sustainable agriculture [6]. The amount of P removed from crops must be replenished through application of P fertilizer or manure to maintain the P balance in the soil [7]. P deficiency is a very common issue in alkaline calcareous soils [2,8,9]. The crucial aspect of applying P to the soil is that an insufficient dose will hinder crop growth, while an overdose will be wasteful and can pose an environmental threat, such as eutrophication of surface waters [10] caused by the increased P loading.
However, an adequate global food supply seems to be difficult to maintain without application of fertilizers [11]. Making accurate N fertilizer practices, we can improve fertilization efficiency and reduce unnecessary input costs for grain producers [9,12]. In any case, N fertilization should be always well balanced with the P and potassium (K) content in the soil, providing the amounts needed to achieve expected yield, including N losses, if leached [13].
Nitrogen (N) is also one of the main nutrients required for optimal wheat yield in all environments [14]. Studies carried by Ehdaie and Waines [15] confirmed that N is the main nutrient affecting wheat yield. Unfortunately, N fertilizers are used indiscriminately to increase crop yield, which have posed threats to the environment and human health by polluting air, water, and soil [16].
Stefanova and Muhova [16] studied in Bulgaria the influence of different levels of mineral fertilization of NP from 0 to 160 kg ha−1 and determined that the maximum increase is established at the following fertilization rates: number of grains per spike at N160 P160; grain weight at N80 P160; length of spike at N160 P120; plant height at N120; and highest grain yield at N160 P80. The same trend was also observed in the study of Panayotova and colleagues [1], which has been nevertheless contradicted by the findings of other authors [17] reporting that the combination of N120 and P80 fertilization is more effective. Boukhalfa-Deraoui and colleagues [18] found that the optimal P rate of durum wheat is 60 kg ha−1 in sandy and calcareous alkaline soil. The use of mineral fertilizers is therefore a recurring worldwide strategy to remedy N deficiency and increase crop yield [19]. However, these agronomic practices contributed to several environmental issues, such as reduced soil biodiversity, air pollution through greenhouse gas emissions, acid rain formation, and groundwater eutrophication [19,20]. For this reason, there is an increasing need for using alternative strategies that can and/or do reverse this trend to avoid soil depletion.
From a double perspective of sustainability and circularity in agriculture, organic agro-industrial wastes can be an important source of plant nutrients and soil improvement to enhance plant health and soil quality [21]. Particularly, composting is considered a strategic technology to convert organic wastes into environmentally friendly soil conditioners, mitigating pressure on landfills and reducing the incineration of agro-industrial and municipal organic waste [22,23,24,25]. Organic soil improvers based on green compost obtained from a wide range of plant sources are nowadays considered effective to increase the soil organic matter content and to restore fertility by using composted biomass from agro-waste.
The milling industry requires high quality durum wheat with a high gluten content, while research on the influence of fertilization techniques and in particular the phosphatic one and on the interaction of newly introduced genotypes are somewhat lacking. In order to provide new insights for a more sustainable agriculture by recycling biomass of plant origin, the objective of this research work was to evaluate the multifaceted effects and the global response of different doses and types of organic and mineral phosphorus-based fertilizers on productivity, grain composition, and stripe yellow rust gravity on two cultivars of durum wheat mostly spread in the South of Italy.

2. Materials and Methods

2.1. Field Experimental Set-Up

The experimental trial was carried out in two crop cycles during 2019–2020 and 2020–2021. It was placed at the DiSAAT of the University of Bari (Italy) on durum wheat (Triticum durum Desf.) crop and raised in succession to chickpea by using 42 plastic containers (Ø = 0.72 m and height of 0.60 m) filled with 293 kg of sandy-loam soil having good fertility from previous assays. The main physicochemical characteristics of the soil are as follows: sand 50.6%, silt 26.0%, clay 23.4%, organic matter 1.7%, P2O5 19 mg kg−1, exchangeable K2O 231 mg kg−1, total N 1.2 g kg−1, pH 7.4. The characterization of the soil was performed using the official methodologies [26]. The trial involved a split-plot design with 3 replicates and was aimed at comparing 2 cultivars of durum wheat (Anco Marzio and Vespucci) and 7 different types of fertilization in single containers; cultivar was the main-plot factor, while type of fertilization was the sub-plot factor. The fertilization regime included one control test (C0-unfertilized) and 6 treatments with different types of fertilizers (4 mineral fertilizers and 2 organic fertilizers with green compost).
In the treatments with mineral fertilization, N and K were applied at the doses of 120 and 100 kg ha−1 respectively, according to the good practices mostly used for durum wheat cultivation in Southern Italy. While, for P 2 fertilizer types were compared: mineral superphosphate (P) and Fosfactyl (Top-Phos MPPA D-Coder, 3/22/0 of N and P2O5, respectively) with P protected by polyphenolic activated molecules (T), both applied at the doses of 100 (P1 and T1) and 140 (P2 and T2) kg ha−1 of P2O5. Therefore, four treatments with mineral fertilization were set up: P1, P2, T1 and T2 (Table 1). Regarding mineral fertilizers, the full rate of P and K, in the form of potassium sulfate, supplemented with 30% N, was distributed at sowing, whereas the remaining dose of N was supplied at topdressing.
Organic fertilization was based on green compost obtained from pruning residues of parks and gardens, away from areas with high car traffic, and wet organic waste from the separate collection of municipalities. The main physicochemical characteristics of green compost are reported [24]. Green compost was distributed at the doses of 15 (GC1) and 7.5 (GC2) Mg ha−1 and buried in the 0–20 cm soil depth one month before planting. Half a dose of the mineral fertilizers from the P1 treatment (60, 50 and 50 kg ha−1 of N, P2O5 and K2O, respectively) was added to the GC2 treatment. The treatments details are reported in Table 1.
In the first year, sowing was carried out on 15 November 2019, while in the second year on 20 November 2020, making a sowing density of 350 seeds m−2 was distributed on 3 rows pot−1. During the cultivation cycle (November-June), the parameters of temperature, humidity, and rainfall were measured in the agrometeorological station of the University site. From the plantlet emergence to the end of crop cycle, emergency irrigation was carried out when a loss of water of 50% of the maximum available water was lost by evapotranspiration, and the applied water volume was calculated to restore field capacity in the whole soil mass contained in each pot. The following parameters were measured during both cultivation cycles.

2.2. Stripe Yellow Rust Gravity

The stripe yellow rust attack caused by Puccinia striiformis Westend. f.sp. tritici Erikss. (Pst) was observed in 2021 on both cultivars. The disease was consistent only in the second crop cycle, while it was negligible in the previous one. Leaves with symptoms were taken on 7 April 2021 and examined in laboratory using an optical photomicroscope (Mod. BX60, OLYMPUS, Milan, Italy) to confirm origin of the Pst attack. The disease was measured using the Severity Index (or Gravity Index) estimating the proportion of infected foliar area respect to total area by a severity scale of 7 classes ranging from 0 to 6 [27]. The severity (gravity) index (Ig) was calculated on samples of 10 leaves using the formula [28]:
Ig   ( % ) = ( f V g ) N m   ×   100
where: f = leaves number in each severity class, Vg = value in the corresponding severity scale, N = 10 (observed leaves number), m = 6 (maximum value of the scale).

2.3. Leaf Chlorophyll Content (SPAD Index)

The leaf chlorophyll content (SPAD index) was tested at stem elongation, booting, ear emergence and kernel ripening phases, using the Chlorophyll Meter, SPAD-502, Minolta with a view to characterize the crop nitrogen status.

2.4. Productivity and Seed Quality

At harvesting, carried out when the grain was fully ripe on 17 June 2020 in the first year and on 22 June 2021 in the second year, the main morphological, productive, and technological parameters were measured: plant height, culms, ears, shoot dry biomass, seed yield, 1000 seed weight, hectolitre weight, non-vitreous kernels and, on whole grain flour, also the protein content.

2.5. Protein Content

The protein content in the caryopsis (GPC) expressed as the percentage of protein per dry weight, was determined on a representative sample of 3 g of whole-wheat flour by near-infrared reflectance spectroscopy (Zeutec Spectra Alyzer Premium, Zeutec Büchi, Rendsburg, Germany).

2.6. Chlorophylls and Carotenoid Content

Pigment analyses were assessed using the protocol of [29] with minor modifications. Briefly, 80 mg of leaf samples collected among two consecutive years (2019 and 2020) at three different developmental stages (tillering, stem elongation, and kernel ripening) were grounded in liquid nitrogen to obtain a fine powder. Next, 1 mL of 80% cold acetone was added and samples were shaken for 45 min at 7 °C. The sample tubes were then centrifuged at 4 °C and 10,000× g for 10 min. The supernatant was then collected and diluted (1:10) prior to the spectrophotometric analyses obtaining absorbance data at 665, 652, and 470 nm for Chlorophyll a, b, and Carotenoids, respectively. Pigments content was determined using the equations reported in [29] according to sample fresh weight (FW). Eight technical replicates were performed (n = 8) out of each biological replicate in each sampling stage.

2.7. Phosphate Content

Phosphate content (Pi) was determined using the blue molybdenum test [30,31]. Briefly, leaf tissues (50 mg fresh weight) collected as reported before for pigment analyses were grounded in liquid nitrogen, and 1 mL of 1% acetic acid solution was added. Next, 100 µL of supernatant was added to 900 µL of ascorbic acid/molybdate reagent (18 g/L ascorbic acid: 3.5 g L−1 ammonium molybdate in 0.6 M H2S04), reaching the final volume of 1 mL. Samples were then incubated at 42 °C for 30 min and absorbance was measured at 820 nm. The concentration of Pi was calculated through a standard curve using potassium dihydrogen phosphate as standard. Data were then related to sample FW. Six technical replicates were performed out of each biological replicate in each sampling stage.

2.8. Statistical Analysis

The parameters quantified for leaf chlorophylls content, stripe yellow rust, productivity, seed quality, and protein content were analyzed by analysis of variance (ANOVA) by the SNK test that was used to highlight differences between group means.
The chlorophylls, carotenoid, and phosphate content were analyzed by ANOVA using the Dunnett post-hoc test (the Control C0 was used as referring sample) by GraphPad Prism version 8.0.2. Chlorophylls (Chl) a and b data were computed to perform a correlation analysis with SPAD data using the Pearson correlation coefficient and two-tailed p value.

3. Results

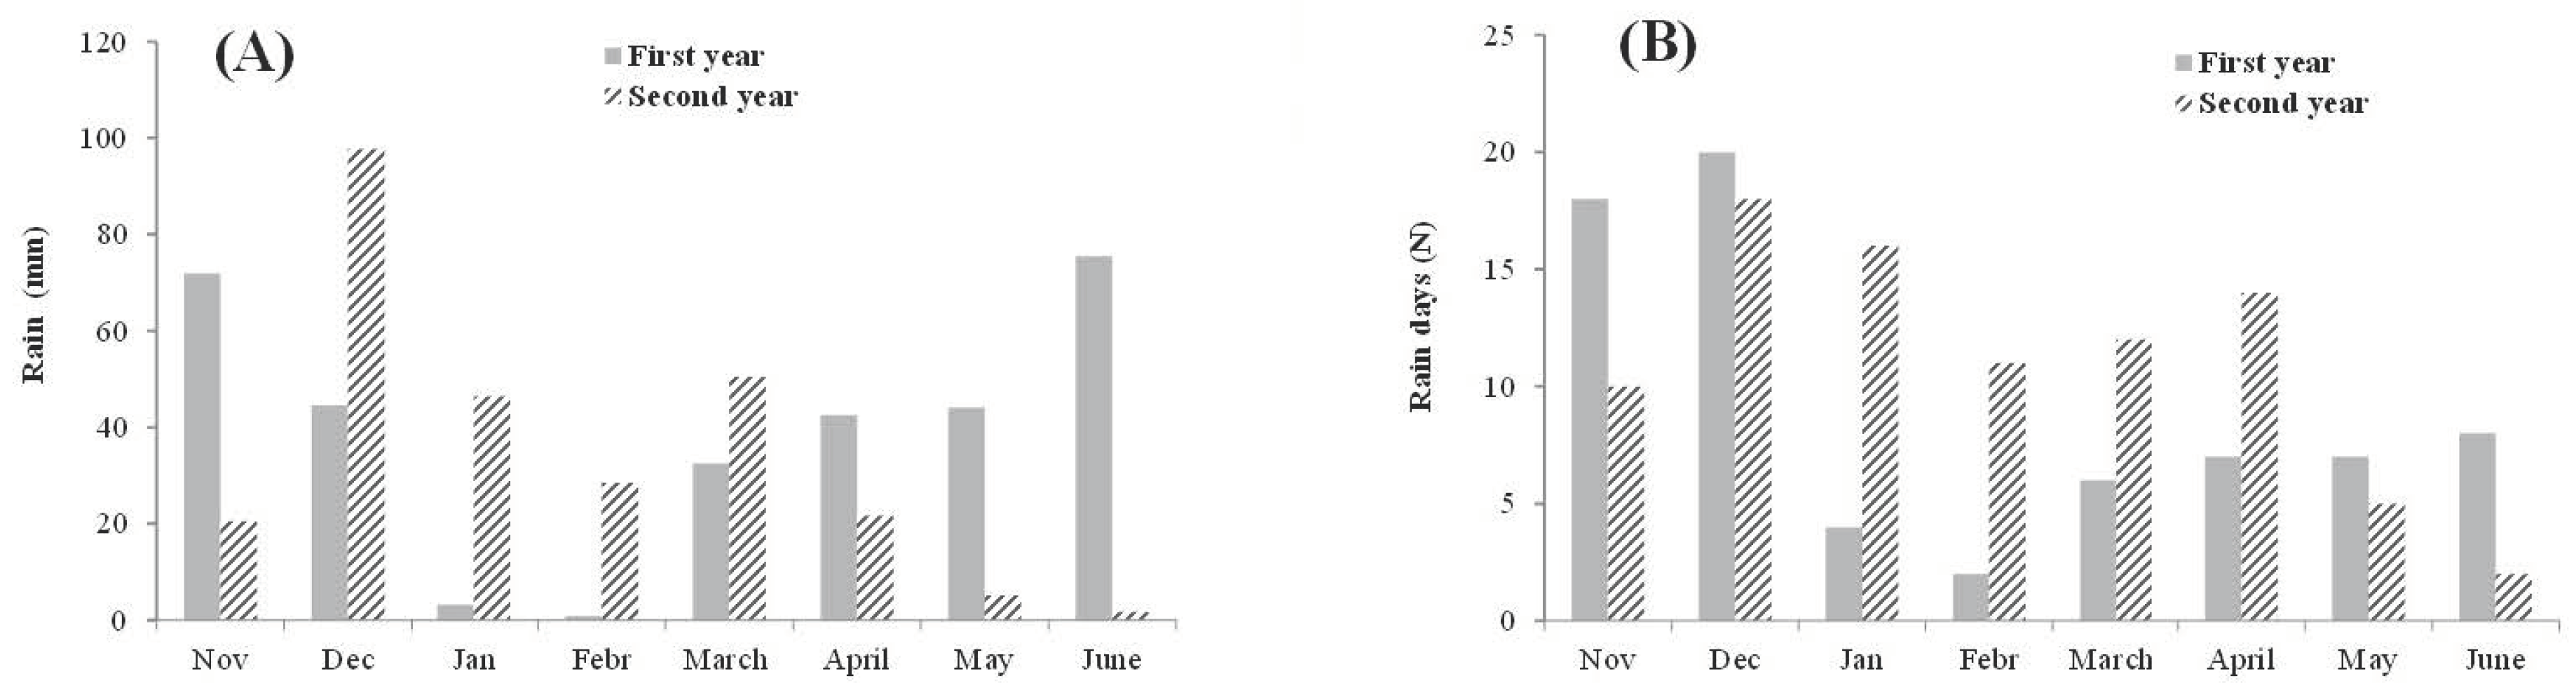
3.1. Phosphate Fertilization, Climate Parameters and Stripe Yellow Rust Infection

This research work evaluated the effects of different doses of mineral and/or organic fertilizers on two durum wheat cultivars, Anco Marzio and Vespucci, in replicate trials and for two consecutive years (2019/2020–2020/2021).
The fertilization trials compared one unfertilized control test and six treatments performed with different fertilizers (four minerals and two organics, based on green compost). For mineral fertilization two P-based types, the superphosphate and Fosfactyl, were compared, and both were applied in two doses of P2O5 at 100 and 140 Kg ha−1, respectively. In the theses with mineral fertilization, nitrogen (N) and potassium (K) were provided at the doses of 120 and 100 kg ha−1, respectively. Organic fertilizer was distributed at the doses of 15 and 7.5 Mg ha−1. Moreover, 60, 50 and 50 kg ha−1 of N, P2O5, and K2O, respectively, were supplied to the last thesis (Table 1).
The thermo-pluviometric trends during the two years of experimental fields are shown in Figure 1 and Figure 2. In the first year, the total rainfall during the whole cultivation cycle of durum wheat was 315 mm, distributed during autumn and spring, while in January and February there was low rainfall. In the successive year, the total rainfall was 273 mm, well distributed during the first six months of the crop cycle (November-April) with many rainy days, on average more than 10 days per month, except for May and June where there was a low rainfall (Figure 1). Mean air temperature, absolute minimum, and maximum temperatures and relative humidity (RH) of each month during the first and second year of the durum wheat cycle are reported in Figure 2, which shows that an increase in temperature accompanied the low rainfall of the second year in May and June. The air RH was related to the distribution of rainfall. Overall, the reported data show that the first year was climatically more favorable for wheat cultivation, while the second one was characterized by many rainy days during the crop development phases and by drought during the growing season. Therefore, it was considered necessary to provide three irrigation interventions with 76 mm of water supply.
The climatic trend of 2021, which was characterized by frequent rainfall, temperature between 14 and 22 °C, and high air RH during the phenological phases of stem elongation, booting, early emergence, and kernel ripening favored infections of Pst that reduced the productivity of both cultivars in the second crop cycle by showing a different epidemiological trend associated with the fertilization management. Evaluation of rust attack severity has been highlighted (Figure 3): (i) no significant difference between the cultivars; (ii) a significant increase of severity on both cultivars with the compost-based fertilization; (iii) a higher disease severity on Vespucci if compost was applied alone (GC1); (iv) absence of difference on Anco Marzio when the reduced dose of compost was associated with the half dose of mineral fertilizer (GC2 + 1/2 P1); and (v) the unfertilized control (C0) showed lower severity than the compost-fertilized theses. Therefore, it is noticeable that compost supplementation has increased the severity of stripe yellow rust with greater effect on Vespucci than Anco Marzio if compost was applied alone. When compost was applied in combination with mineral superphosphate, such treatment determined a significant increase of severity with respect to mineral fertilization without difference between the cultivars. This finding highlights that the greater severity occurred with the compost-based fertilization than the mineral ones.

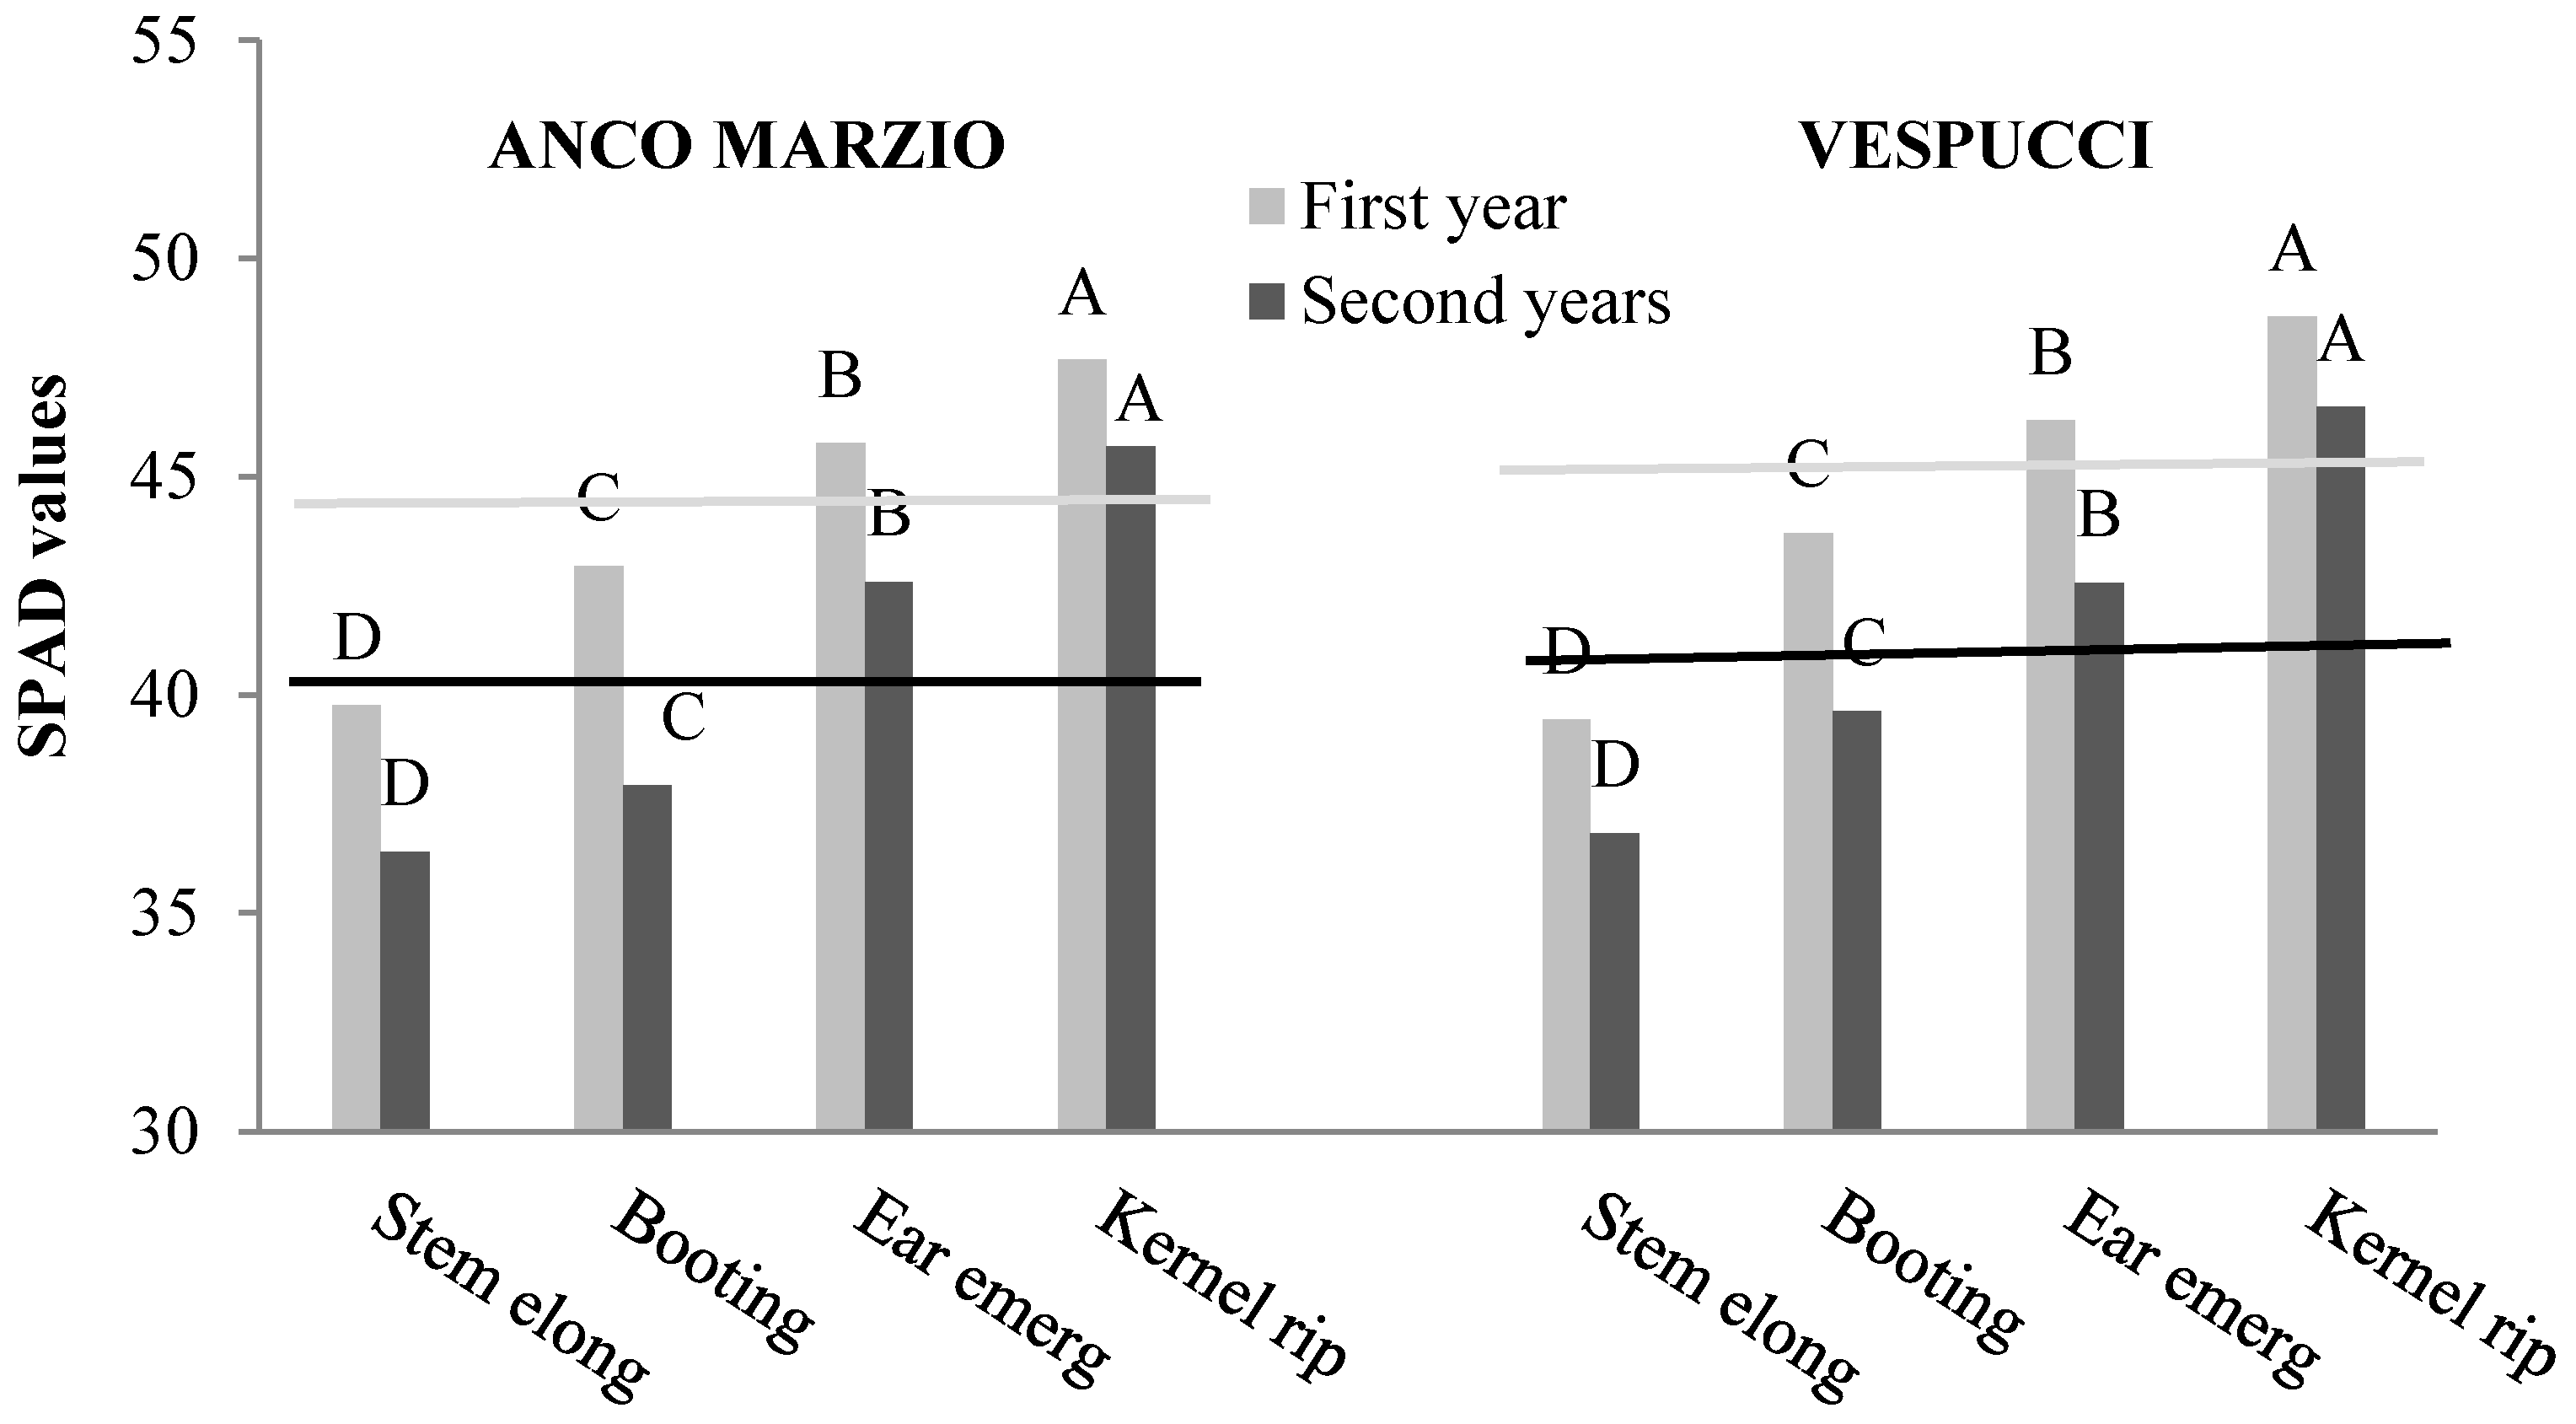
3.2. SPAD Index, Morphological Parameters and Shoot Dry Biomass

In both years, the two unfertilized cultivars showed the lowest SPAD values, which were comparable among the two cultivars in all growth stages. On the contrary, following fertilization a significant increase of SPAD was observed in both years for the two cultivars, reaching the highest values during the stage of kernel ripening (Table 2). During the first two stages of development (stem elongation and booting) the highest SPAD index was recorded in the treatments subjected to mineral fertilization, without significant differences when varying the type and doses of P, while with the last two surveys carried out at ear emergence and kernel ripening, the highest SPAD values were recorded for the crops subjected to mineral fertilization with the highest doses of P (140 kg ha−1), without showing significant differences between the different types of P administered. The SPAD index detected in the second year was always lower probably due to unfavorable weather conditions and rust attacks (Figure 4).
Morphological parameters showed slight differences in the response of the two cultivars to different types of fertilization in the two tested years with significant interaction for years × cultivars × fertilization (Table 3).
In both the cultivars the lowest plant height occurred in the unfertilized control, while the highest was found with mineral fertilization and organic fertilization supplemented with 1/2 P1, whereas intermediate heights occurred with organic fertilization (Table 4). The number of culms per m2 followed the same trend as fertilization varied. The number of ears also did not vary with the years, nor with the cultivars, but changed with fertilization. The highest number of ears per m2 was produced by wheat cultivars fertilized with mineral and organic fertilization supplemented with half mineral (P1), with an average increase, compared with the unfertilized control, of 34.47%. No significant differences were found between the different types of P fertilizers (mineral superphosphate and Top Phos) and doses (100 and 140 kg ha−1 of P2O5). With organic fertilization alone, the increase in the number of ears per m2, compared with the control, was only 28.4%.
In the first year the average production of dry epigeal biomass, for both cultivars, was 12.18 Mg ha−1, while in the second year, due to unfavorable weather conditions and rust attack, it was reduced by 17.1%. In both years the Vespucci cultivar recorded a higher average production of dry biomass (11.8 Mg ha−1) than Anco Marzio (10.47 Mg ha−1) (Table 3 and Table 4). Mineral and organic fertilization supplemented with half mineral fertilizer (GC1 + 1/2 P1) promoted higher plant development in both cultivars without showing significant differences between the different doses and types of phosphate fertilizers. The cultivars treated with the organic fertilizer produced a lower dry biomass (on average 24.21%) than the ones subjected to mineral fertilization and showed a considerable increase (on average 45.93%) compared with the unfertilized control.

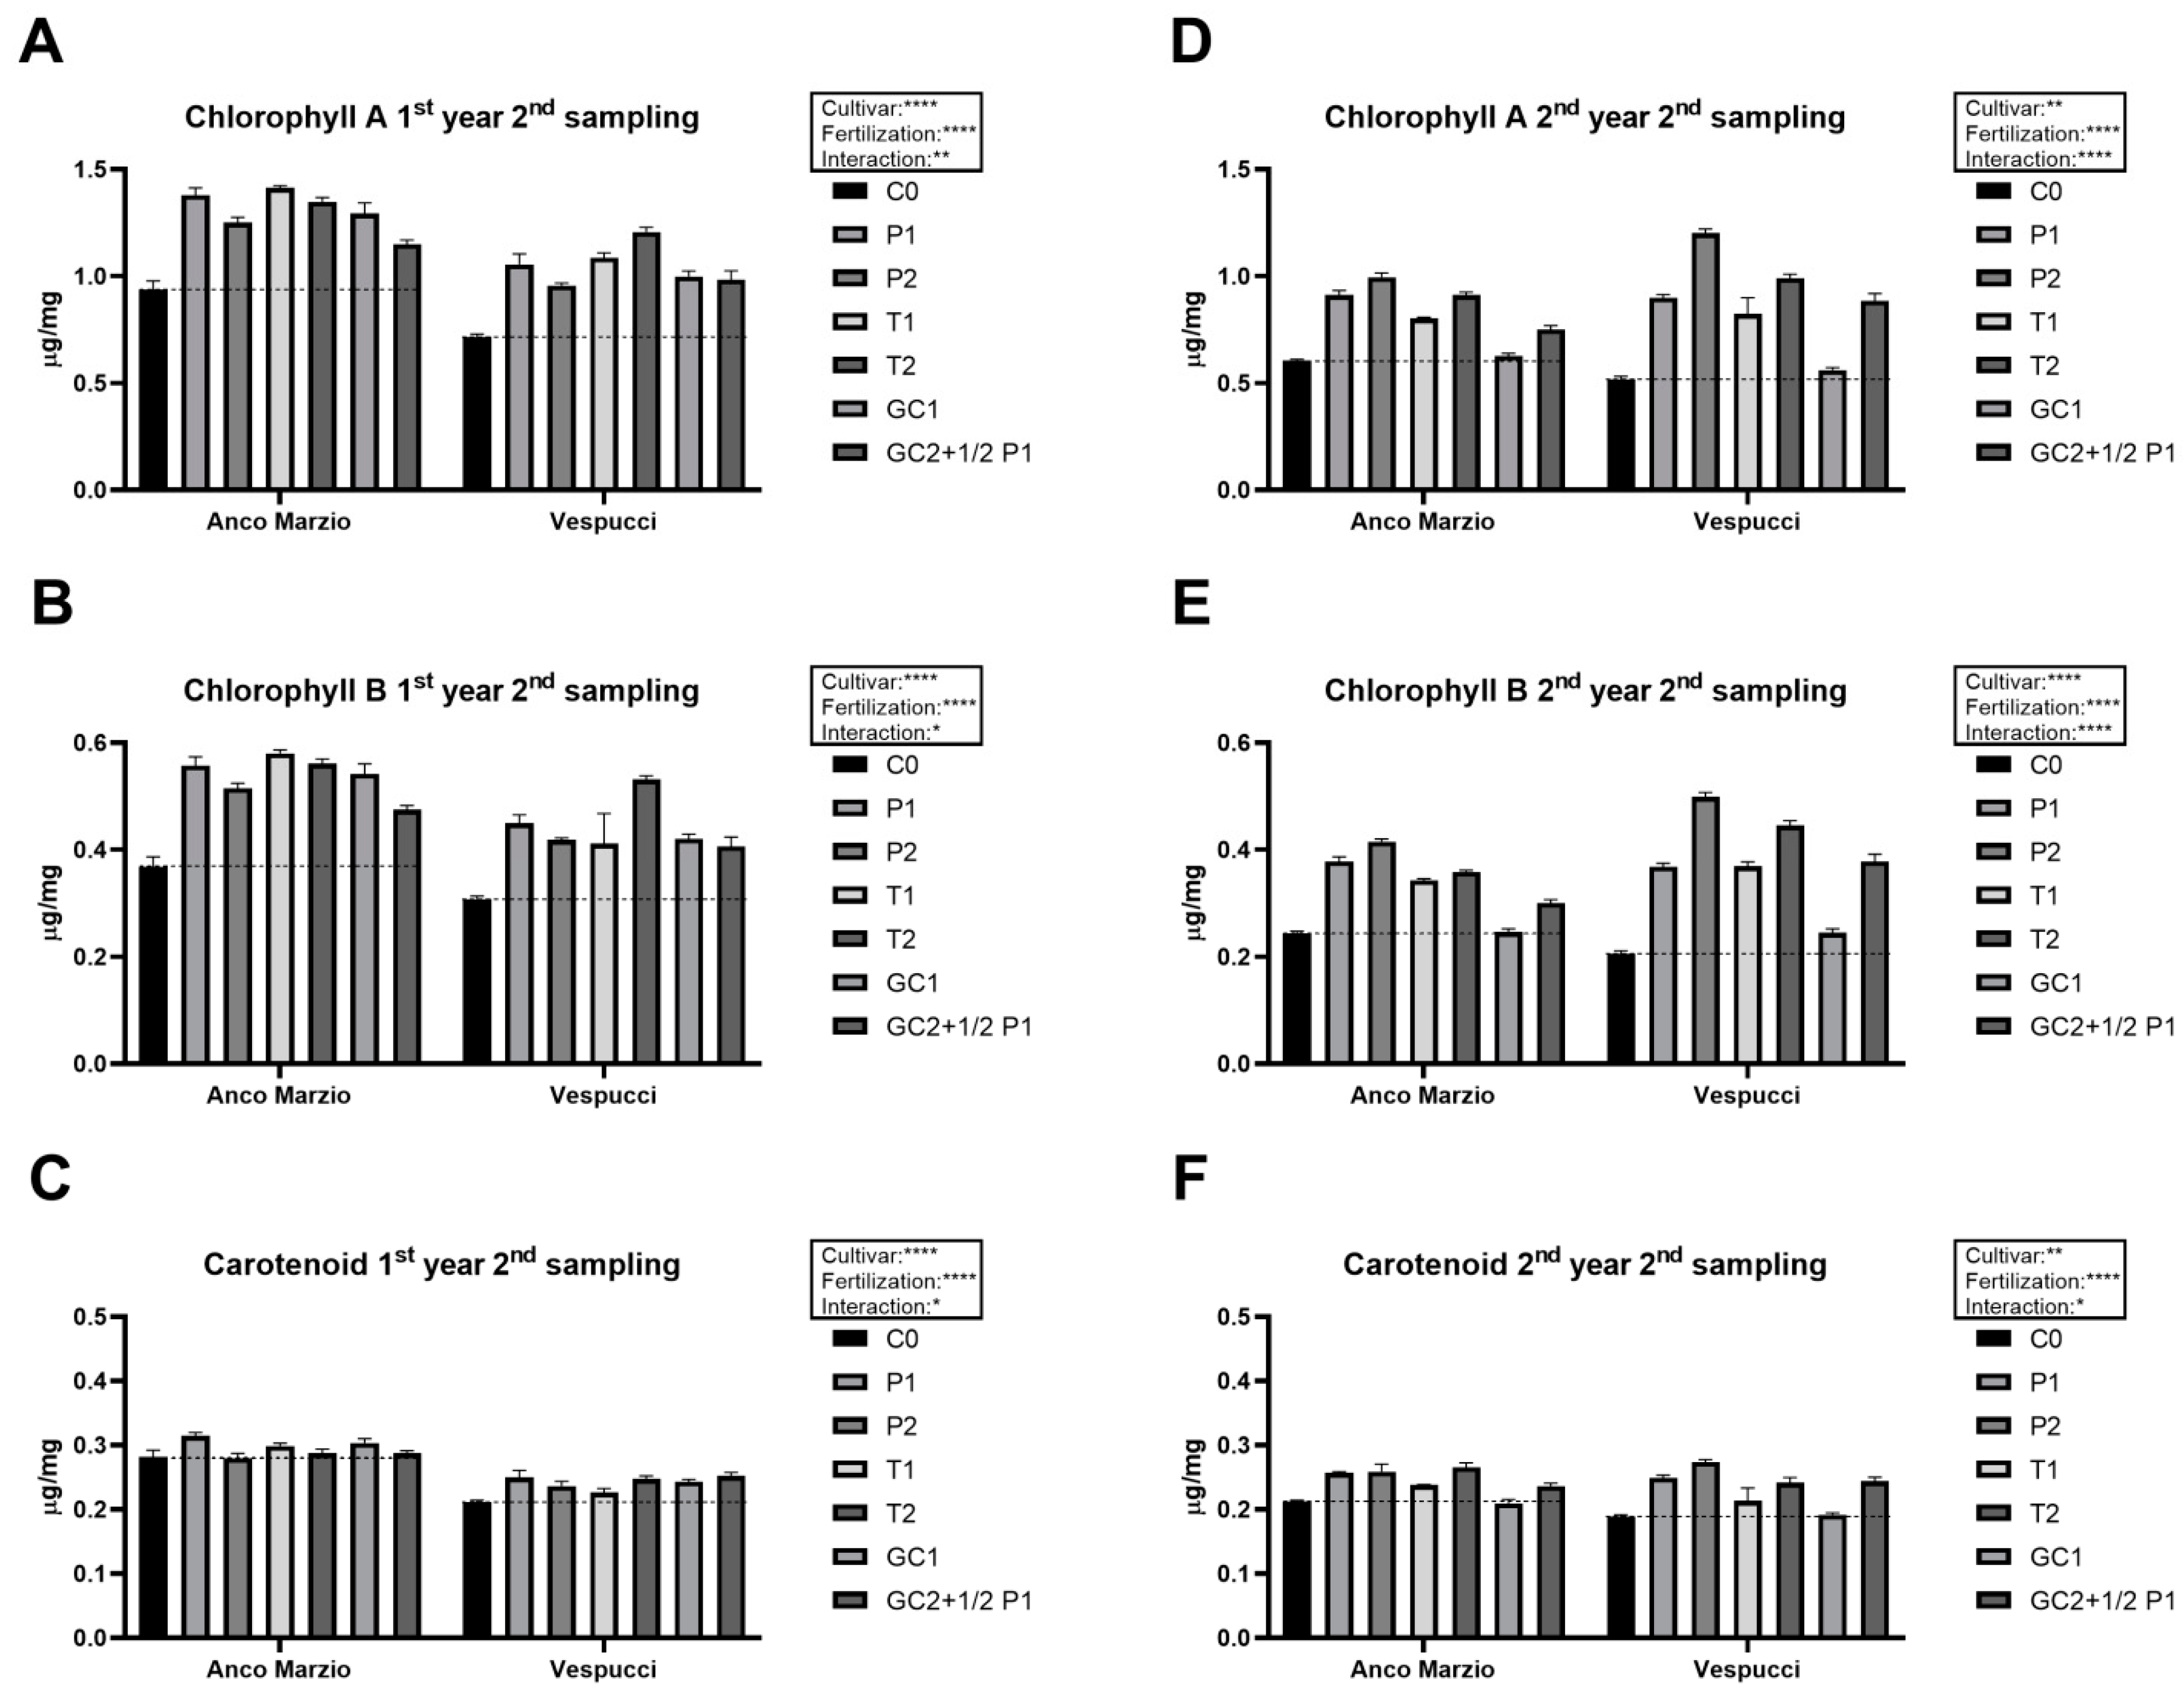
3.3. Pigments Content

Pigments content (chlorophylls a, b, and carotenoids) was determined using leaf tissues collected in three different sampling times (tillering, stem elongation, and kernel ripening) for both the experimental years. In the first year, for both the cultivars, a slight increase in pigment contents of fertilized plants compared with the control was observed in the tillering stage (Figure 5 A–C). The Vespucci cultivar recorded the highest values in the GC2 treatment + 1/2 P1, while the Anco Marzio cultivar in the T2 treatment. In the second year (Figure 5D–F), the same trend with a general increase in pigment content in fertilized plants with respect to the control ones occurred, with the only exception represented by GC1, whose pigment content decreased in both the cultivars compared with the control. Results of statistical analyses indicate that the cultivar factor frequently did not appear significant, whereas treatment and the two factors’ interaction were most significant for the second-year data. These trends were confirmed by the results of the Dunnett post-test (Table S1), where most of the statistically significant comparisons were related to the second year of analysis. At the stem elongation stage, the increase in the pigment content after fertilization was more pronounced (Figure 6). In the first year (Figure 6A–C), the rise of chlorophylls a and b in fertilized samples was consistent in both the cultivars, whereas the carotenoid content seemed less influenced by phosphate fertilization. Despite that, ANOVA results indicated that the two factors (cultivar and fertilization) and their interaction were significant for all pigments. Results of Dunnett’s test (Table S2) indicated that most of the pairwise comparisons were significant. The data trend in the second year of analysis (Figure 6D–F) was comparable, with a general increase in pigment content after fertilization, except for the GC1. These results confirmed that the factor fertilization was more significant than cultivar. Data of the last sampling phase (Figure 7), which occurred during the kernel ripening stage, indicated a general increase in pigment content in the fertilized plants compared with the control ones. The data showed that sample P2 had the higher values in the Anco Marzio cultivar, whereas in Vespucci, the highest values were reported for the T2 plants (Figure 7A–F). The results indicated that the fertilization factor and the factor interaction were statistically significant; on the other hand, the factor cultivar became significant mainly in carotenoid analysis. Results from post-test analyses (Table S3) indicated that most of the statistically significant comparisons were related to the first year of Anco Marzio.
Data of pigment contents were also used to compute a correlation analysis with SPAD data detected in the phases of stem elongation and kernel ripening (Table 5). The results revealed a high degree of correlation for both cropping cycles and the phenological phases occurred.

3.4. Kernel Yield

Production responses were significantly different by year, cultivar, and fertilization (Figure 8). The 2019/2020 period was the more favorable with an average grain yield of 4.68 Mg ha−1, while in 2020/2021, due to rust attacks and higher temperature in the grain period, there was a lower yield averaging 3.86 Mg ha−1. In both years, the most productive cultivar was Vespucci. In the first year, for both cultivars the highest grain production was recorded when plants were treated with mineral fertilization or with organic fertilization supplemented with half of mineral fertilization (GC1 + 1/2 P1). Always in the first year, lower productions occurred for crops subjected only to organic fertilization, with an increase over the unfertilized control of 25.52% for the cultivar Anco Marzio and 30.92% for Vespucci. In the second year, both cultivars responded differently to fertilization (significant interaction for year × cultivar × fertilization). The contribution of a higher dose of phosphorus (140 kg ha−1), regardless of the type, favored a significant increase of 10.39% in grain production in the cultivar Anco Marzio compared with the dose of 100 kg ha−1. No significant differences were found between the grain production obtained with the fertilization of 100 kg ha−1 of P and the organic fertilization integrated with half of mineral fertilization (P1). Lower yields of 31.12% for Anco Marzio and 26% for Vespucci were obtained when the crop was fertilized with organic fertilizers compared with mineral ones. However, with organic fertilization yields increased on average by 67.43% compared with the unfertilized crop.
In order to evaluate possible variations in production, the 1000-seeds weight was determined. The weight of 1000 seeds provides further information on the size of the grain and the hectolitre weight, which are qualitative and technological parameters proportional to the milling yield. The weight of 1000 seeds was higher in the first year, which was characterized by a particularly favorable climate for the cultivation of durum wheat. Among the two cultivars, the highest values were recorded for Anco Marzio (Table 4).
In both years and cultivars, the highest 1000-seed weight (average 50.88 g) was recorded in the crop fertilized with mineral and organic supplemented with 1/2 mineral (GC2 + 1/2 P1) fertilization. This weight was reduced by 11.06% with organic fertilization alone and reached the lowest value (average 40.45) in the unfertilized control. No major differences were recorded when changing mineral fertilizer type and phosphorus doses. Panayotova and colleagues [32] also found a significant increase in durum wheat grain yield with phosphate fertilization.
In the two-year period the average hectolitre weight was 80.25 and 78.82 kg HL−1 for Anco Marzio and Vespucci, respectively, without significant variation over the years. In the first year no significant differences between cultivars were observed, but in the second year the highest hectolitre weight was recorded in the cultivar Anco Marzio (on average 80.40 kg HL−1) versus Vespucci (on average 78.6 kg HL−1), with a significant interaction year × cultivar.
In both cultivars in the first year the highest hectolitre weight occurred when the crop was treated with mineral fertilizers and with organic fertilization supplemented with half of mineral (GC2 + 1/2 P1); hectolitre weight was reduced by 2.39% when plants were fertilized only with organic fertilizers (GC1) and reached the minimum value (on average 74.15 kg HL−1) in the absence of fertilization. On the other hand, in the second year characterized by adverse crop conditions, when rust attacks occurred, the two cultivars responded differently to fertilization. The highest hectolitre weight in Anco Marzio (83 kg HL−1) was obtained when mineral fertilization was applied with phosphorus in the form of Top Phos in the highest dose (140 kg ha−1 of P2O5), whereas an average reduction of 2.45% was observed with the other types of mineral and organic fertilization supplemented with half mineral. A further reduction of 9.09% in hectolitre weight occurred in plants treated with organic fertilization (Table 3 and Table 4). In addition, the hectolitre weight of the Vespucci cultivar was lower (on average 78.6 HL−1) in the second year. No significant differences were found between the different types and doses of mineral and organic supplemented with half mineral fertilizers and low values were found with organic fertilization (76.15 kg HL−1).

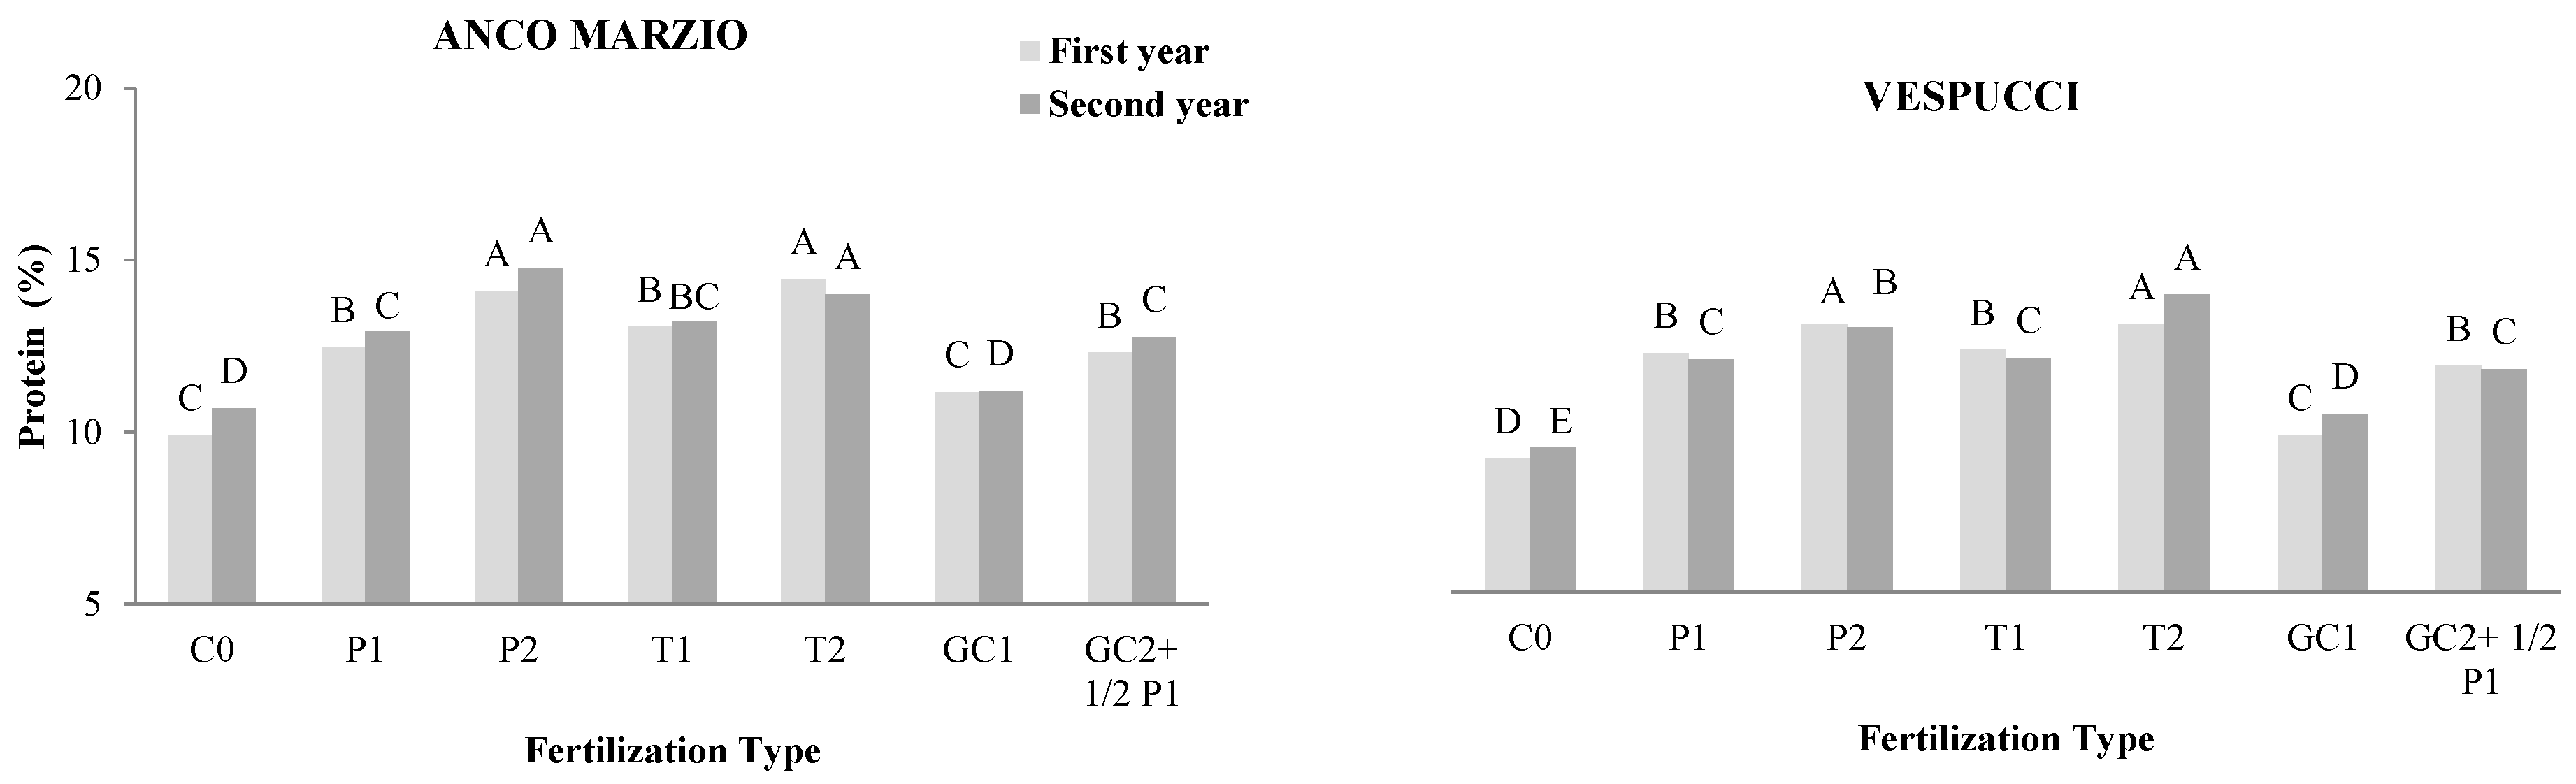
3.5. Quality of Kernels

The percentage of non-vitreous kernel is an important attribute of international classification in the evaluation of durum wheat quality. Higher vitreous kernels indicate higher protein content, harder grain and coarser granulation, higher semolina yield, superior pasta color, better cooking quality, and opportunity for higher selling prices [32]. The standard of non-vitreous kernels acceptable to Kaliti Food Share Company (KFSC) for pasta processing should be less than 20%. In this research, the average values over the two-year period for the percentage of non-vitreous kernels were 16.15%, with no significant differences between the two years. Non-vitreous kernels increased from 12.97% to 19.31% for the cultivars Anco Marzio and Vespucci, respectively, and from 12.47% to 20.83% for the crop fertilized with organic fertilization or organic plus half of mineral fertilization (P1) compared with the crop fertilized with organic fertilization (Table 4 and Figure 9). The application of the highest rate of phosphorus (140 kg ha−1) in combination with 120 and 100 kg ha−1 of nitrogen and potassium, respectively, resulted in lower non-vitreous kernels with average values of 9.5%, whereas with the lowest dose of phosphorus (100 kg ha−1) the values of non-vitreous kernels were on average 13.88%. In agreement with the findings of Boukhalfa-Deraoui [17], the contribution of a higher dose of phosphorus (140 kg ha−1) promoted a higher efficiency of the nitrogen fertilizers.
Closely related to the vitreousness of the caryopses was their protein content. The highest percentage of protein content (on average 13.78%) was reached when the crop was treated with mineral fertilizers, with the highest dose of phosphorus (140 kg ha−1 of P2O5). Varying the type of fertilization, the protein content, on average, decreased to 12.51%, 12.14%, 10.60%, 9.75%, respectively, when the crop was fertilized with mineral fertilization with the lowest dose of phosphorus (100 kg ha−1 of P2O5), integrated organic fertilization with half of mineral, organic fertilization, and unfertilized control (Table 4 and Figure 10). In each case, grain protein content was higher in Anco Marzio (Table 4). No differences were found between different types of phosphorus, nor between the years, despite rust attack and more unfavorable weather conditions occurred in the second year.

3.6. Phosphate Content

Determination of phosphate content (Pi) indicated a different scenario for the two years of analyses (Figure 11). In the first year, most of the fertilized samples showed a lower Pi content when compared with unfertilized plants (Figure 11A–C). This was particularly evident by observing data from the second (stem elongation) and third (kernel ripening) sampling stages, where in both the cultivars only organic fertilization led to higher Pi content than control in both the cultivars. Interestingly, the Pi content in the kernel showed a cultivar-dependent trend with respect to the unfertilized control samples: it decreased in Vespucci and increased in the Anco Marzio cultivar in response to fertilization (Figure 11D). Dunnett post-test (Table S4) indicated that the largest number of statistically significant comparisons were reported in the second sampling stage for Anco Marzio and in the kernel for Vespucci.
In the second year (Figure 11E-G), the Pi content of unfertilized plants resulted higher than in all the other fertilized plants in all the three sampling stages for both the cultivars. The only exception was observed for the organic treatment of Vespucci collected in the second and third stages. The same trend was observed for kernels, where the unfertilized Vespucci showed the higher Pi content compared with fertilized plants, whereas Anco Marzio still indicated an increase in Pi content in response to fertilization (Figure 11D, H). Data from the post-test (Table S4) indicated that the second and third sampling stages showed several statistically significant comparisons, whereas the opposite behavior reported for Pi content in kernel leads to the high statistical significance of both factors (Cultivar, Fertilization) and their interaction.

4. Discussion

The use of appropriate cultivars and balanced application of fertilizers are the main agronomic practices to improve wheat productivity and quality [32].
SPAD index measured at stem elongation, booting, ear emergence, and kernel ripening phases, gives a direct measure of the nutritional status of plants during growth, using the total chlorophyll content of leaves as an indirect indication of the amount of nitrogen present at the leaf level [33,34,35]. The data obtained in this research show that mineral fertilization increases the SPAD index in both cultivars at all the phenological stages. The provision of a higher dose of P (140 kg ha−1) also contributes significantly to increase chlorophylls content. This suggests that inorganic fertilization makes nitrogen immediately available in the soil which can be easily absorbed and assimilated by plants. In contrast, organic fertilization with green compost resulted in a lower increase in SPAD in both cultivars than that observed following mineral fertilization. This result, in agreement with literature data, demonstrates that N from organic manure becomes available to plants only at a late stage of growth [36,37,38]. Our results indicate that the pigment content seems to be highly influenced by phosphate fertilization. By comparing fertilized and unfertilized plants an increase in each developmental stage has been observed for both the cultivars. These data agree with the literature data [5,39,40] that demonstrate that a proper fertilization by phosphate source can increase the production of chlorophylls and carotenoids. The more detailed description of data indicated that the most significant increases of pigments were observed during stem elongation and kernel ripening; interestingly, in these two developmental stages data of chlorophyll contents are well correlated with the SPAD index.
The increased availability of N and P to plants following mineral fertilization is also evident from agronomic parameters, such as culm and spike number and epigeal biomass, which increased significantly in both years.
It has been reported that wheat grain yield is affected by the P application and without adequate amounts the plant cannot retain its proper development [41,42]. Similarly, the amount of application is significant in determining the yield crop [39], especially in less productive cultivars and in years with water stress [43]. This study indicates that 140 kg ha−1 of applied P increased the entire yield and parameters such as plant height, culms, ears, shoot dry biomass, grain yield, 1000-seeds weight, hectolitre weight, non-vitreous kernels, and the protein content.
The highest intake of phosphorus, regardless of its type (mineral superphosphate and Top Phos), besides favoring a higher production of grains, contributed to improve its quality by increasing the protein content. Other authors also found a positive effect of phosphate fertilization on grain production but not all on the protein content of soft wheat [40,44].
Looking at the phosphate content (Pi) content, the results indicate as the control sample showed the highest Pi content in leaves. This trend is more evident by observing the second-year data, whereas the increase seems less pronounced in the first year. A possible explanation of the high Pi content in unfertilized samples is reported by Haberman and colleagues [45]. These authors indicated that the P leaf content of fertilized olive trees does not decrease despite the P depletion in the soil. Furthermore, the lower Pi detected in the samples treated with mineral fertilizers could be associated with a Pi transfer to kernel tissues, as reported in literature [45,46]. This data partially agrees with our data, where an increase in Pi content of kernels occurs in Anco Marzio across the two years but not in Vespucci, thus suggesting a genotype-dependent response.
The results also show that the climatic trend of 2021, characterized by frequent rainfall of low entity and higher relative humidity of the air during the phenological phases of crop development (stem elongation, booting, ear emergence, and kernel ripening phases), led to a significant infection of rust, negatively affecting the productivity of both the cultivars. Stripe yellow rust is considered to be a low-temperature disease that frequently occurs in temperate areas characterized by cooler and moist weather conditions. Nevertheless, recent devastating outbreaks also occurred in warmer climate areas where the disease was infrequent or even absent in the past [47,48]. In literature was reported that “adult plant resistance” (APR) confers the most durable resistance to Pst in wheat [49] being regulated/mediated by genetic recombinant of resistance genes [50]. It begins early in the growth cycle, being expected to offer a greater yield protection than operating from flag leaf emergence. The expression of APR genes is overall related to crop nutritional status, whenever high N content in soil leads to more severity of the disease [50].
The following remarks can be drawn from a two-year trial of field research to evaluate the effects of mineral fertilization, organic fertilization with green compost, and combination among them on the performance of two cultivars of durum wheat in a Mediterranean area of southern Italy:
(a)
With the mineral fertilization during the two-year test period, the average increase in production of durum wheat grain, compared with the unfertilized control, was of 136.42% for Anco Marzio and 125.5% for Vespucci, while organic fertilization alone reached only a weak increase of 25.52% and 30.92%, respectively. No differences were found between the different types of mineral phosphorus (mineral superphosphate and Top Phos).
(b)
The contribution of a higher dose of phosphorus (140 kg ha−1) combined with N and K2O respectively at the doses of 120 and 100 kg ha−1 has favored a further increase in grain production (+9.34%) and an increase of the percentage of grain with vitreous consistency and higher protein content. The content of pigments (chlorophylls and carotenoids) in the leaves and phosphates in the kernels was influenced by phosphate fertilization, whereas over the two years, a more significant increase was found in the Anco Marzio cultivars compared with the Vespucci. The cultivar Vespucci produced a greater quantity of grain but with a less vitreous consistency and poorer protein content than Anco Marzio.
(c)
The use of the only green compost as a soil conditioner for two consecutive years was not enough to improve soil fertility comparable with that obtained by mineral fertilization. More experimental trials performed for a longer time are needed to show the potential beneficial effects of green compost. It was sufficient to apply half dose of the mineral fertilization in addition to half dose of the organic fertilization to achieve the same productivity as those obtained from the mineral fertilization alone.
(d)
The use of green compost, either alone or associated with mineral fertilization, has overall determined an increase of the wheat stripe yellow rust gravity on both cultivars during the second year of the crop cycle, whenever the climatic conditions were more favorable for spreading the disease.

Supplementary Materials

The following supporting information can be downloaded at: https://www.mdpi.com/article/10.3390/agronomy12081861/s1, Table S1: Mean results of pigment analyses performed on samples of the first sampling stage (tillering). Results of the Dunnett post-hoc test were reported using the Control (C0) as referring sample within each cultivar. Eight technical replicates were performed out of each biological replicate. Table S2: Mean values results of pigment analyses performed on samples of the second sampling stage (stem elongation). Results of the Dunnett post-hoc test were reported using the Control (C0) as referring sample within each cultivar. Eight technical replicates were performed out of each biological replicate. Table S3: Mean values results of pigment analyses performed on samples of the third sampling stage (kernel ripening). Results of the Dunnett post-hoc test were reported using the Control (C0) as referring sample within each cultivar. Eight technical replicates were performed out of each biological replicate. Table S4: Mean values results related phosphate content data (n = 12). Data are related to different sampling stages, three related to leaf (tillering, stem elongation and kernel ripening) and one to kernel (milky ripe stage). Results of the Dunnett test were reported using the Control (C0) as referring sample within each cultivar.

Author Contributions

Conceptualization, A.G., G.L., G.C. and M.C.d.P.; methodology, A.G., G.L., G.C. and M.C.d.P.; validation, A.G., G.L., G.C. and M.C.d.P.; formal analysis, S.F., F.V., D.N., D.C., S.L.G. and M.A.M.; investigation, S.F., F.V., D.N. and U.D.C.; resources, A.G.; data curation, A.G. and F.V.; writing—original draft preparation, A.G., G.L., G.C., M.C.d.P. and U.D.C.; writing—review and editing, A.G., G.L., G.C, M.C.d.P., U.D.C., D.N. and F.V.; funding acquisition, A.G. All authors have read and agreed to the published version of the manuscript.

Funding

This research was supported by the projects “CerealMed”—Enhancing diversity in Mediterranean cereal farming systems, project funded by PRIMA Section2—Multi-topic 2019 and MUR (Ministero dell’Università e della Ricerca) Projects PRIMA 2019 “CEREALMED”; Project PSR Puglia 2014–2020, sottomisura 16.2, “filiera frumento duro: innovazione varietale, qualita’ e tracciabilita’ delle produzioni pugliesi”/IPERDURUM DDS N. 130 del 30/06/2020 CUP: B39J20000160009; project PSR Puglia 2014–2020, sottomisura 16.2, un nuovo grano” per la valorizzazione delle produzioni cerealicole della puglia”/NewGrain”, DDS N. 168 del 28 luglio 2020, CUP: B77H20001640009.

Conflicts of Interest

The authors declare no conflict of interest. The funders had no role in the design of the study; in the collection, analyses, or interpretation of data; in the writing of the manuscript, or in the decision to publish the results.

References

  1. Panayotova, G.; Kostadinova, S.; Aleksieva, S.; Slavova, N.; Aladzhova, C. Nitrogen and phosphorus balances as dependent on durum wheat fertilization. Bulg. J. Agric. Sci. 2018, 24 (Suppl. 1), 9–17. [Google Scholar]
  2. Raghothama, K.G.; Sims, J.T.; Sharpley, A.N. Phosphorus and Plant Nutrition: An Overview. In Phosphorus: Agriculture and the Environment; Sims, J.T., Sharpley, A.N., Eds.; American Society of Agronomy-Crop Science Society of America-Soil Science Society of America: Madison, WI, USA, 2005; pp. 355–378. ISBN 978-0891181576. [Google Scholar]
  3. Chaturvedi, I. Effects of phosphorus levels alone or in combination with phosphate- solubilizing bacteria and farmyard manure on growth, yield and nutrient uptake of wheat (Triticum aestivum). J. Agric. Social Sci. 2006, 2, 96–100. [Google Scholar]
  4. Tanwar, S.P.S.; Shaktawat, M.S. Influence of phosphorus sources, levels and solubilizers on yield, quality and nutrient uptake of soybean (Glycine max)-wheat (Triticum aestivum) cropping system in southern Rajasthan. Indian J. Agric. Sci. 2003, 73, 3–7. [Google Scholar]
  5. Bojović, B.M.; Stojanović, J. Chlorophyll and carotenoid content in wheat cultivars as a function of mineral nutrition. Arch. Biol. Sci. 2005, 57, 283–290. [Google Scholar] [CrossRef]
  6. Lin, B. Strategies for efficient use of chemical fertilizers in agriculture. In Proceedings of the National Congress of Soil Science, Hangzhou, China, November 1995; pp. 109–114. [Google Scholar]
  7. Saleque, M.A.; Timsina, J.; Panaullah, G.M.; Ishaque, M.; Pathan, A.B.M.U.; Connor, D.J.; Saha, P.K.; Quayyum, M.A.; Humphreys, E.; Meisner, C.A. Nutrient uptake and apparent balances for rice-wheat sequences. II. Phosphorus. J. Plant Nutr. 2006, 28, 157–172. [Google Scholar] [CrossRef]
  8. Rahim, A.; Abbasi, G.H.; Rashid, M.A.; Ranjha, M. Methods of phosphorus application and irrigation schedule influencing wheat yield. Pak. J. Agric. Sci. 2007, 44, 420–423. [Google Scholar]
  9. Lakshmi, P.V.; Singh, S.K.; Pramanick, B.; Kumar, M.; Laik, R.; Kumari, A.; Shukla, A.K.; Abdel Latef, A.A.H.; Ali, O.M.; Hossain, A. Long-Term Zinc Fertilization in Calcareous Soils Improves Wheat (Triticum aestivum L.) Productivity and Soil Zinc Status in the Rice–Wheat Cropping System. Agronomy 2021, 11, 1306. [Google Scholar] [CrossRef]
  10. Dobermann, A.; White, P.F. Strategies for nutrient management in irrigated and rainfed lowland rice systems. Nutr. Cycl. Agroecosyst. 1998, 53, 1–18. [Google Scholar] [CrossRef]
  11. Tilman, D.; Cassman, K.G.; Matson, P.A.; Naylor, R.; Polasky, S. Agricultural Sustainability and Intensive Production Practices. Nature 2002, 418, 671–677. [Google Scholar] [CrossRef]
  12. Arregui, L.M.; Lasa, B.; Lafarga, A.; Iraneta, I.; Baroja, E.; Quemada, M. Evolution of chlorophyll meters as tools for N fertilization in winter wheat under humid Mediterranean conditions. Eur. J. Agromony 2006, 24, 140–148. [Google Scholar] [CrossRef]
  13. Lalev, T.; Dechev, D.; Yanev, S.; Panayotova, G.; Kolev, T.; Saldziev, I.; Genov, G.; Rashev, S. Technology for Growing Durum Wheat; Science and Technology Ltd.: Stara Zagora, Bulgaria, 1995; ISBN 954-661-011-9. [Google Scholar]
  14. Mahjourimajd, S.; Taylor, J.; Sznajder, B.; Timmins, A.; Shahinnia, F.; Rengel, Z.; Khabas-Saberi, H.; Kuchel, H.; Okamoto, M.; Langridge, P. Genetic basis for Variation in Wheat Grain Yield in Response to Varying Nitrogen Application. PLoS ONE 2016, 11, e0159374. [Google Scholar] [CrossRef] [PubMed] [Green Version]
  15. Ehdaie, B.; Waines, J.G. Sowing date and nitrogen rate effects on dry matter and nitrogen partitioning in bread and durum wheat. Field Crops Res. 2001, 73, 47–61. [Google Scholar] [CrossRef]
  16. Stefanova-Dobreva, S.; Muhova, A. Influence of NPK fertilization on grain yield and some components of durum wheat (Triticum durum Desf.). Sci. Pap. Ser. A Agron. 2020, LXIII, 2. [Google Scholar]
  17. Almaliev, M.; Kostadinova, S.; Panayotova, G. Effect of fertilizing systems on the phosphorus efficiency indicators at durum wheat. Agric. For. 2014, 60, 127–134. [Google Scholar]
  18. Boukhalfa-Deraoui, N.; Hanifi-Mekliche, L.; Mekliche, A.; Mihoub, A.; Daddibouhoun, M. Effect of phosphorus application on durum wheat in alkaline sandy soil in arid condition of southern Algeria. Asian J. Crop Sci. 2015, 7, 61–71. [Google Scholar] [CrossRef] [Green Version]
  19. Laidig, F.; Piepho, H.; Rentel, P.; Drobek, D.; Meyer, U.; Huesken, A. Breeding progress, environmental variation and correlation of winter wheat yield and quality traits in German official variety trials and on-farm during 1983–2014. Theor. Appl. Genet. 2017, 130, 223–245. [Google Scholar] [CrossRef] [Green Version]
  20. Andrews, M.; Edwards, G.R.; Ridgway, H.J.; Cameron, K.C.; Di, H.J.; Raven, J.A. Positive plant microbial interactions in perennial ryegrass dairy pasture systems. Ann. Appl. Biol. 2011, 159, 79–92. [Google Scholar] [CrossRef]
  21. Butler, J.; Garratt, M.P.D.; Leather, S.R. Fertilisers and insect herbivores: A meta-analysis. Ann. Appl. Biol. 2012, 161, 223–233. [Google Scholar] [CrossRef]
  22. Toop, T.A.; Ward, S.; Oldfield, T.; Hull, M.; Kirby, M.E.; Theodorou, M.K. AgroCycle—Developing a circular economy in agriculture. Energy Proced. 2017, 123, 76–80. [Google Scholar] [CrossRef]
  23. De Corato, U.; Salimbeni, R.; De Pretis, A.; Patruno, L.; Avella, N.; Lacolla, G.; Cucci, G. Microbiota from ‘next-generation green compost’ improves suppressiveness of composted Municipal-Solid-Waste to soil-borne plant pathogens. Biol. Control 2018, 124, 1–17. [Google Scholar] [CrossRef]
  24. Cucci, G.; Lacolla, G.; Summo, C.; Pasqualone, A. Effect of organic and mineral fertilization on faba bean (Vicia faba L.). Sci. Hortic. 2019, 243, 338–343. [Google Scholar] [CrossRef]
  25. De Corato, U. Agricultural waste recycling in horticultural intensive farming systems by on-farm composting and compost-based tea application improves soil quality and plant health: A review under the perspective of a circular economy. Sci. Tot. Environ. 2020, 738, 139840. [Google Scholar] [CrossRef] [PubMed]
  26. Violante, P. Metodi di Analisi Chimica del Suolo. [Methods of Soil Chemical Analyses]; Franco Angeli: Milan, Italy, 2000. [Google Scholar]
  27. Chen, W.; Welling, C.; Chen, X.; Kang, Z.; Liu, T. Wheat stripe (yellow) rust caused by Puccinia striiformis f. sp. tritici. Mol. Plant Pathol. 2014, 15, 433–446. [Google Scholar] [CrossRef]
  28. McIntosh, R.A.; Wellings, C.R.; Park, R. Wheat Rusts: An Atlas of Resistance Genes; Kluwer Academic Publishers: Dordrecht, The Netherlands, 1995. [Google Scholar]
  29. Agrios, G.N. Plant Pathology, 5th ed.; eBook; Elsevier: Amsterdam, The Netherlands, 2005; p. 952. ISBN 9780080473789. [Google Scholar]
  30. Lacolla, G.; Fortunato, S.; Nigro, D.; De Pinto, M.C.; Mastro, M.A.; Caranfa, D.; Gadaleta, A.; Cucci, G. Effects of mineral and organic fertilization with the use of wet olive pomace on durum wheat performance. Int. J. Recycl. Org. Waste Agric. 2019, 8, 245–254. [Google Scholar] [CrossRef] [Green Version]
  31. Wellburn, A.R. The spectral determination of chlorophylls a and b, as well as total carotenoids, using various solvents with spectrophotometers of different resolution. J. Plant Physiol. 1994, 144, 307–313. [Google Scholar] [CrossRef]
  32. Panayotova, G.; Kostadinova, S.; Valkova, N. Grain quality of durum wheat as affected by phosphorus and combined nitrogen-phosphorus fertilization. Sci. Pap. LX Ser. A Agron. 2017, 60, 356–363. [Google Scholar]
  33. Dinkinesh, A.; Tamado, T.; Tadesse, D. Effects of Blended NPSB Fertilizer Rates on Yield and Grain Quality of Durum Wheat (Triticum turgidum L.) Varieties in Minijar Shenkora District, Central Ethiopia. Ethiop. J. Agric. Sci. 2020, 30, 57–76. [Google Scholar]
  34. Cartelat, A.; Cerovic, Z.G.; Goulas, Y.; Meyer, S.; Lelarge, C.; Prioul, J.L.; Moya, I. Optically assessed contents of leaf polyphenolics and chlorophyll as indicators of nitrogen deficiency in wheat (Triticum aestivum L.). Field Crops Res. 2005, 91, 35–49. [Google Scholar] [CrossRef]
  35. Debaeke, P.; Rouet, P.; Justes, E. Relationship between the normalized SPAD index and the nitrogen nutrition index: Application to durum wheat. J. Plant Nutr. 2006, 29, 75–92. [Google Scholar] [CrossRef]
  36. Sorensen, P.; Amato, M. Remineralization and residual effects of N after application of pig slurry to soil. Eur. J. Agric. 2002, 16, 81–95. [Google Scholar] [CrossRef]
  37. Xiong, D.; Chen, J.; Yu, T.; Gao, W.; Ling, X.; Li, Y.; Huang, J. SPAD-based leaf nitrogen estimation is impacted by environmental factors and crop leaf characteristics. Sci. Rep. 2015, 5, 13389. [Google Scholar] [CrossRef] [PubMed] [Green Version]
  38. Guster, R.; Ebertseder, T.; Weber, A.; Schraml, M.; Schmidhalter, U. Short-term and residual availability of nitrogen after long-term application of organic fertilizer on arable land. J. Plant Nutr. Soil Sci. 2005, 168, 439–446. [Google Scholar]
  39. Zhang, F.F.; Gao, S.; Zhao, Y.Y.; Zhao, X.L.; Liu, X.M.; Xiao, K. Growth traits and nitrogen assimilation-associated physiological parameters of wheat (Triticum aestivum L.) under low and high N conditions. J. Integr. Agric. 2015, 14, 1295–1308. [Google Scholar] [CrossRef] [Green Version]
  40. Rasul, G.A.M. Effect of phosphorus fertilizer application on some yield components of wheat and phosphorus use efficiency in calcareous soil. J. Dyn. Agric. Res. 2016, 3, 46–51. [Google Scholar]
  41. Zhu, X.K.; Jiang, Z.Q.; Feng, C.N.; Guo, W.S.; Peng, Y.X. Responses of phosphorus use efficiency, grain yield, and quality to phosphorus application amount of weak-gluten wheat. J. Integr. Agric. 2012, 11, 1103–1110. [Google Scholar] [CrossRef]
  42. Kaleem, S.; Ansar, M.; Ali, M.A.; Sher, A.; Ahmad, G.; Rashid, M. Effect of phosphorus on the yield and yield components of wheat variety “Inqlab-91” under rainfed conditions. Sarhad J. Agric. 2009, 25, 21–24. [Google Scholar]
  43. Khan, M.B.; Lone, M.I.; Ullah, R.; Kaleem, S.; Ahmed, M. Effect of different phosphatic fertilizers on growth attributes of wheat (Trticum aestivum L.). J. Am. Sci. 2010, 6, 1256–1262. [Google Scholar]
  44. Palumbo, M.; Panto, S.; Boggini, G. Phosphorus fertilization of durum wheat (Triticum durum Desf.) in Sicily: Yield and quality results. J. Agron. 1991, 25, 20–28. [Google Scholar]
  45. Haberman, A.; Dag, A.; Erel, R.; Zipori, I.; Shtern, N.; Ben-Gal, A.; Yermiyahu, U. Long-term impact of phosphorous pertilization on pield and alternate bearing in intensive irrigated olive cultivation. Plants 2021, 10, 1821. [Google Scholar] [CrossRef]
  46. Batten, G.D. A review of phosphorus efficiency in wheat. Plant Soil 1992, 146, 163–168. [Google Scholar] [CrossRef]
  47. Hovmoller, M.S.; Walter, S.; Justesen, A.F. Escalating threat of wheat rusts. Science 2010, 329, 369. [Google Scholar] [CrossRef] [PubMed] [Green Version]
  48. Prescott, J.M.; Burnett, P.A.; Saari, E.E.; Ransom, J.; Bowman, J.; Milliano, W.; de Singh, R.P.; Bekele, G. Wheat Diseases and Pests: A Guide for Field Identification; International Maize and Wheat Improvement Center (CIMMYT): Mexico City, Mexico, 1986. [Google Scholar]
  49. Wellings, C.R.; Boyd, L.A.; Chen, X.M. Resistance to stripe rust in wheat: Pathogen biology driving resistance breeding. In Disease Resistance in Wheat; Sharma, I., Ed.; CAB International: London, UK, 2012; pp. 63–83. [Google Scholar]
  50. Mboup, M.; Leconte, M.; Gautier, A.; Wan, A.M.; Chen, W.Q.; de Vallavielle-Pope, C.; Enjalbert, J. Evidence of genetic recombination in wheat yellow rust population of a Chinese over-summering area. Fungal Genet. Biol. 2009, 46, 299–307. [Google Scholar] [CrossRef] [PubMed]
Figure 1. Total precipitation (A) and rainy days (B) per month during the two-year trial of the durum wheat cycle.
Agronomy 12 01861 g001
Figure 2. Mean air temperature, absolute minimum and maximum temperatures, and relative humidity (RH) for month during the first (A) and second (B) year of the durum wheat cycle.
Agronomy 12 01861 g002
Figure 3. Stripe yellow rust severity in two durum wheat cultivars (Vespucci and Anco Marzio) naturally infected by Puccinia striiformis Westend. f. sp. tritici Erikss. (Pst) under different fertilization regimes during the second year of the crop cycle. Data are means of three replicates (10 leaves for each) where different letters between cultivars indicate different severity to Pst according to the SNK test at the p = 0.01 level. Bar indicates the standard error of the mean (n = 3).
Agronomy 12 01861 g003
Figure 4. Mean SPAD values observed at the following crop stages: stem elongation, booting, ear emergence, and kernel ripening phases in two durum wheat cultivars (Anco Marzio and Vespucci) grown under different fertilization regime during the first and second year. For each effect considered, the values followed by the same letter are not significantly different, according to the SNK test at p = 0.01.
Agronomy 12 01861 g004
Figure 5. Pigment (Chlorophyll A, B, and Carotenoid) content on samples collected during the first crop stage (tillering). Data are related to the first (AC) and second (DF) year of analyses. Data were reported by indicating the statistical significance of two factors (Cultivar and Fertilization) and their interaction. Data are reported with p-values. * p ≤ 0.05; ** p ≤ 0.01; *** p ≤ 0.001; **** p ≤ 0.0001; ns: non-significant.
Agronomy 12 01861 g005
Figure 6. Pigment (Chlorophyll A, B, and Carotenoid) content on samples collected during the second crop stage (stem elongation). Data are related to the first (AC) and second (DF) year of analyses. Data were reported by indicating the statistical significance of two factors (Cultivar and Fertilization) and their interaction. Data are reported with p-values. * p ≤ 0.05; ** p ≤ 0.01; **** p ≤ 0.0001.
Agronomy 12 01861 g006
Figure 7. Pigment (Chlorophyll A, B, and Carotenoid) content on samples collected during the third crop stage (kernel ripening). Data are related to the first (AC) and second (DF) year of analyses. Data were reported by indicating the statistical significance of two factors (Cultivar and Fertilization) and their interaction. Data are reported with p-values. * p ≤ 0.05; ** p ≤ 0.01; *** p ≤ 0.001; **** p ≤ 0.0001; ns: non-significant.
Agronomy 12 01861 g007
Figure 8. Kernel yield in two durum wheat cultivars (Anco Marzio and Vespucci) grown under different fertilization regimes during the first and second year. For each effect considered, the values followed by the same letter are not significantly different, according to the SNK test at p = 0.01.
Agronomy 12 01861 g008
Figure 9. Mean values of non-vitreous kernel percentage in two durum wheat cultivars (Anco Marzio and Vespucci) grown under different fertilization regime during the first and second year. For each effect considered, the values followed by the same letter are not significantly different, according to the SNK test at p = 0.01.
Agronomy 12 01861 g009
Figure 10. Mean of grain protein content percentage in two durum wheat cultivars (Anco Marzio and Vespucci) grown under different fertilization regime during the first and second year. For each effect considered, the values followed by the same letter are not significantly different, according to the SNK test at p = 0.01.
Agronomy 12 01861 g010
Figure 11. Phosphate content (Pi) on the leaf (at three crop stages) and kernel (at the stage of ripening) samples. Data are related to the first and second year of analyses. Data were reported by indicating the statistical significance of two factors (Cultivar and Fertilization) and their interaction. Data are reported with p-values. * p ≤ 0.05; ** p ≤ 0.01; *** p ≤ 0.001; **** p ≤ 0.0001; ns: non-significant.
Agronomy 12 01861 g011
Table 1. Fertilization conditions applied to wheat durum (Triticum durum Desf.) cv Anco Marzio and Vespucci.
Fertilization TypeGreen Compost
(Mg ha−1)
N
(kg ha−1)
P2O5
(kg ha−1)
K2O
(kg ha−1)
Unfertilized C00000
Mineral
P10120100 (simple superph)100 (potassium sulfate)
P20120140 (simple superph)100 (potassium sulfate)
T10120100 (Top Phos)100 (potassium sulfate)
T20120140 (Top Phos)100 (potassium sulfate)
Organic
GC115240109168
GC27.5120 + 60 *54 + 50 **84 + 50 ***
* = N, 120 kg organic + 60 Kg mineral; ** P2O5, 54 kg organic + 50 Kg mineral; *** = K2O, 84 kg organic + 50 Kg mineral; C0 = unfertilized control; GC = organic fertilization with green compost.
Table 2. Means of chlorophyll content (SPAD index) in the years 2019/2020 and 2020/2021 observed at stem elongation, booting, ear emergence, and kernel ripening phases in two durum wheat cultivars.
Fertilization
Type
SPAD Index at
Stem ElongationBootingEar EmergenceKernel Ripening
ANCO MARZIO
C023.1E23.9E26.7E28.2E
P139.8BC42.8B46.7C48.7C
P242.5A46.4A49.7A52.2B
T142.2A44.9A48.0A50.7BC
T243.8A46.6A52.0A54.3A
GC136.0D37.7D40.7D44.3D
GC2 + 1/2 P139.2C40.8C45.4C48.3C
VESPUCCI
C024.4E26.2D27.9C30.8D
1P40.8BC43.5B47.8A50.7B
2P42.4B46.2AB49.4A52.0A
1T41.1BC45.3AB47.5A50.9B
2T44.7A47.8A49.9A53.6A
GC134.4D38.3C41.2B45.2C
GC2 + 1/2 P139.2C44.4B47.3A50.1B
For each effect considered, the values followed by the same letter are not significantly different, according to the SNK test at p = 0.01.
Table 3. The effect of years cultivars and fertilization on the morphological, commercial, and physiological parameters of durum wheat.
Sources of
Variation
Plant HeightTotal CulmsTotal
Ear
Shoot Dry BiomassKernel YieldHect. Kernel Weight1000 Seed WeightNon-Vitreous
Kernels
Protein
(cm)(n m−2)(n m−2)(Mg ha−1)(Mg ha−1)(kg HL−1)(g)(%)(%)
Years
First86.52a434.10a406.15a12.18a4.68a79.57a50.37a16.52a12.03a
Second90.69a450.16a410.14a10.10b3.85b79.50a46.89b15.78a12.29a
Cultivars
Anco Marzio91.40a444.42a416.81a10.47b3.72b80.25a49.10a12.97b12.64a
Vespucci85.71b439.46a408.48a11.80a4.81a78.82b48.12a19.32a11.68b
Fertilization
C061.08c329.36c288.07c5.18c2.11d74.29e40.75c29.90a9.75d
P194.08a462.50a435.23a12.73a4.79ab80.73bc51.10a13.83c12.39b
P295.83a475.57a444.13a13.36a5.19a81.33ab51.37a10.00d13.71a
T195.17a466.29a439.28a12.60a4.62ab80.72bc50.88a13.92c12.64b
T295.92a472.35a443.37a12.50a5.11ab81.98a51.80a9.00d13.86a
GC185.17b429.39b402.35b9.58b3.56c77.50d45.25b20.83b10.60c
GC2 + 1/2 P192.67a458.14a435.87a11.99a4.48b80.18c49.23a15.58c12.14b
Significance
Years (Y)nsnsns****ns**nsns
Cultivar (C)**nsns******ns****
Fertilization (F)******************
Interaction
Y × C*nsnsns**ns*ns
Y × Fnsnsnsnsnsnsns*ns
F × C**nsnsnsnsnsns**ns
Y × F × C**nsnsnsnsnsnsns*
ns non-significant; *, ** Significant at p ≤ 0.05 and 0.01, respectively. For each effect considered, the values followed by the same letter are not significantly different, according to the SNK test at p = 0.05.
Table 4. Means of values in the years 2019/2020 and 2020/2021 on the morphological, commercial, and physiological parameters in two durum wheat cultivars (Anco Marzio and Vespucci).
Fertilization TypePlant HeightTotal CulmsTotal
Ear
Shoot Dry BiomassKernel YieldHect. Kernel Weight1000 Seed WeightNon-Vitreous
Kernels
Protein
(cm)(n m−2)(n m−2)(Mg ha−1)(Mg ha−1)(kg HL−1)g(%)(%)
ANCO MARZIO
C060.7B336.4C290.2C5.72C1.73C74.7D40.5C25.0A10.29D
P197.7A461.4A436.0A11.89A4.12A81.4B52.1A10.8C12.69B
P297.5A483.3A443.9A12.50A4.75A81.8B52.2A7.7D14.43A
T197.2A469.7A442.2A11.79A4.13A81.6B51.9A11.0C13.12B
T2100.2A471.6A439.0A11.50A4.49A82.7A52.2A6.7D14.22A
GC193.2A423.9B397.9B8.73B2.94B78.5C45.5B16.8B11.17C
GC2 + 1/2 P193.5A464.8A440.2A11.18A3.89C81.0B49.4A12.8C12.52B
VESPUCCI
C061.5C322.3C286.0C4.63C2.49C73.8E41.0C34.8A9.20E
1P90.5A463.6A434.5A13.56A5.46A80.1BC50.1A16.8C12.10C
2P94.2A467.8A444.3A14.23A5.63A80.8AB50.5A12.3D13.01B
1T93.2A462.9A436.4A13.41A5.11A79.9BC49.9A16.8C12.17C
2T91.7A473.1A447.7A13.51A5.72A81.3A51.4A11.3D13.51A
GC177.2B434.9B406.8B10.43B4.19B76.5D45.0B24.8B10.04D
GC2 + 1/2 P191.8A451.5A431.6A12.80A5.07A79.3C49.0A18.3C11.75C
For each effect considered, the values followed by the same letter are not significantly different, according to the SNK test at p = 0.01.
Table 5. Results of SPAD and Chl (a + b) correlation analyses. Data are based on Pearson correlation calculations using a two-tailed p-value.
Fertilization TypeSamplingPearson rR Squaredp-Value (Two-Tailed)Significant
First year Stem elongation0.69880.48840.0054**
Kernel ripening0.82390.67890.0003***
Second year Stem elongation0.82770.68510.0003***
Kernel ripening0.69790.48710.0055**
Data are reported with p-values. ** p ≤ 0.01; *** p ≤ 0.001.
Publisher’s Note: MDPI stays neutral with regard to jurisdictional claims in published maps and institutional affiliations.

