
Soil Quality Index as Affected by Integrated Nutrient Management in the Himalayan Foothills

 , ,
, ,  , , ,
, , ,  and
and
Abstract
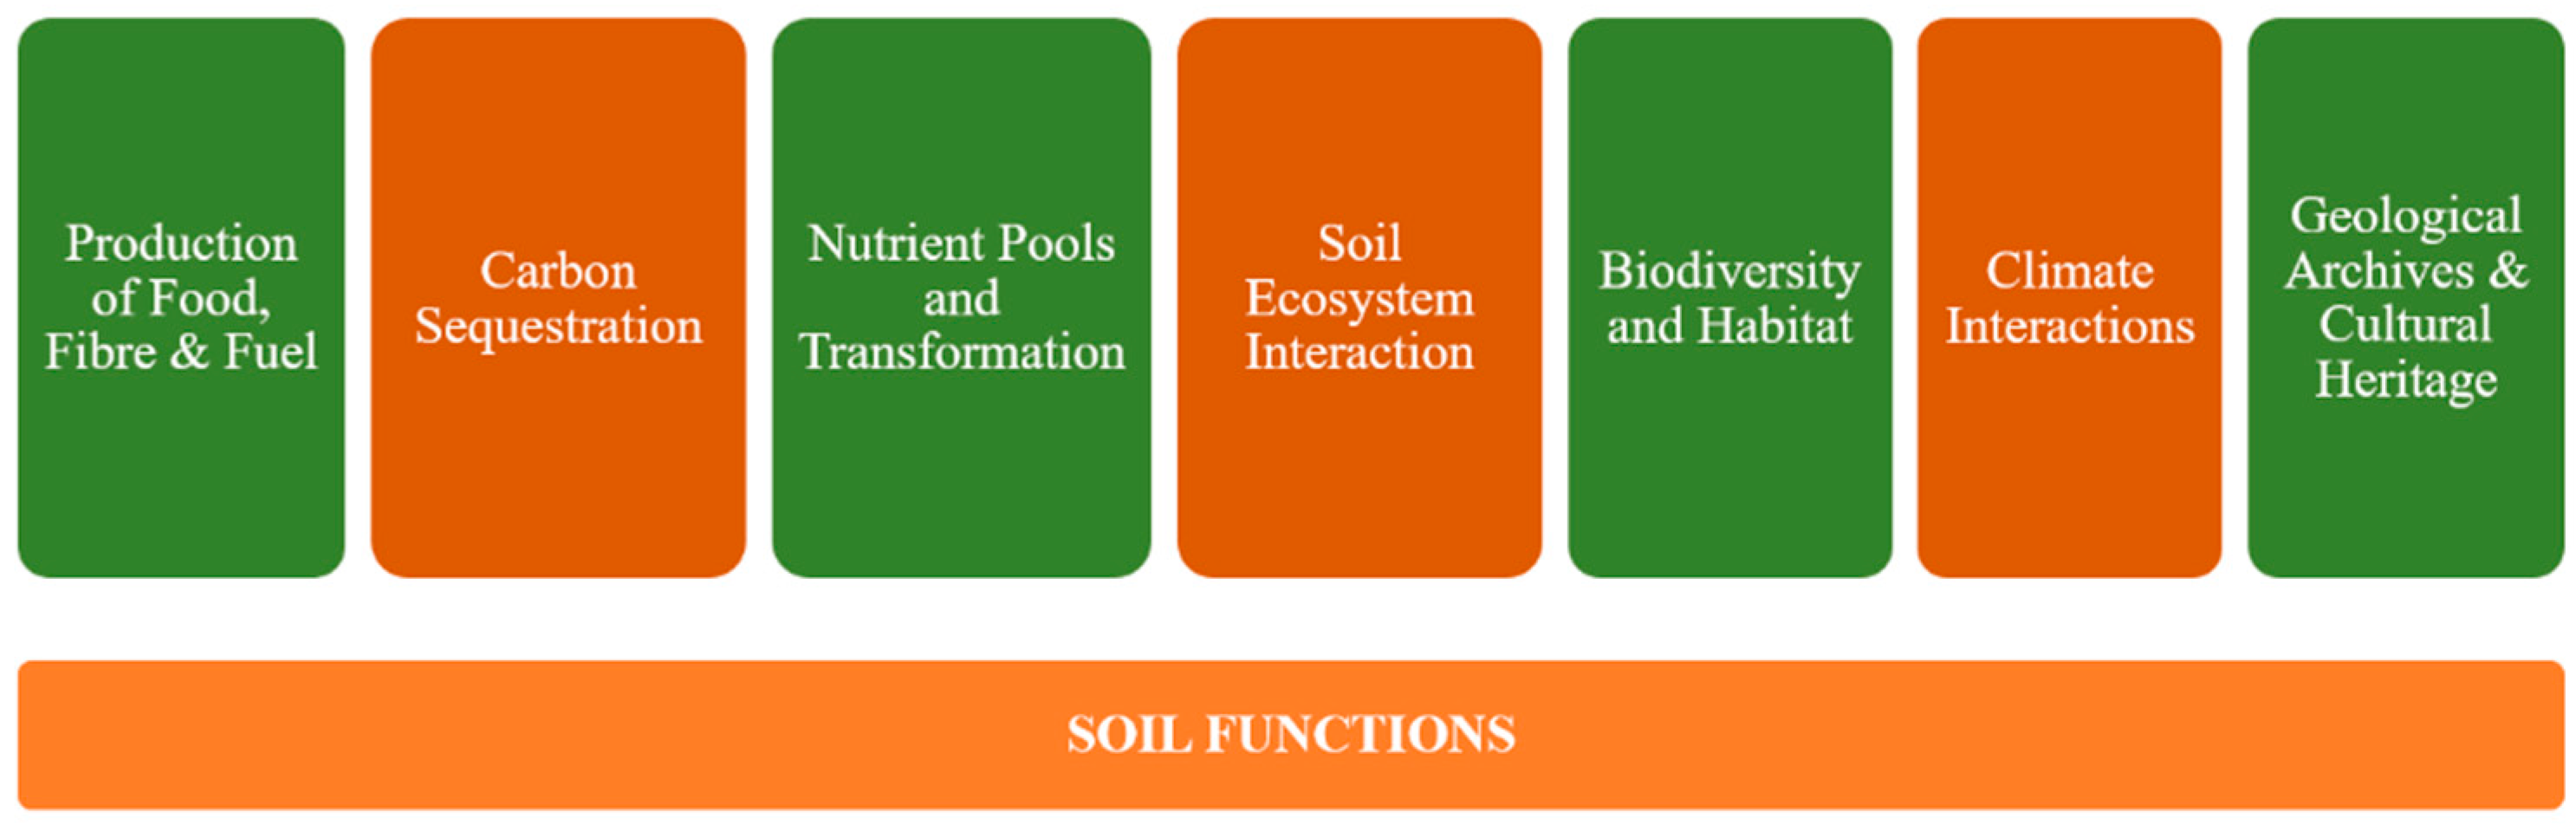
:1. Introduction
2. Materials and Methods
2.1. Experimental Site
2.2. Treatments Details
2.3. Collection and Preparation of Soil Samples
2.4. Soil Analysis
2.5. Soil Chemical Properties
2.6. Soil Organic Carbon Fractions
2.7. Soil Biological Properties
2.8. Soil Quality Assessment
2.9. Statistical Analysis
3. Results
3.1. Influence of Different Treatments on Mean Values of Soil Physical Quality Indicators
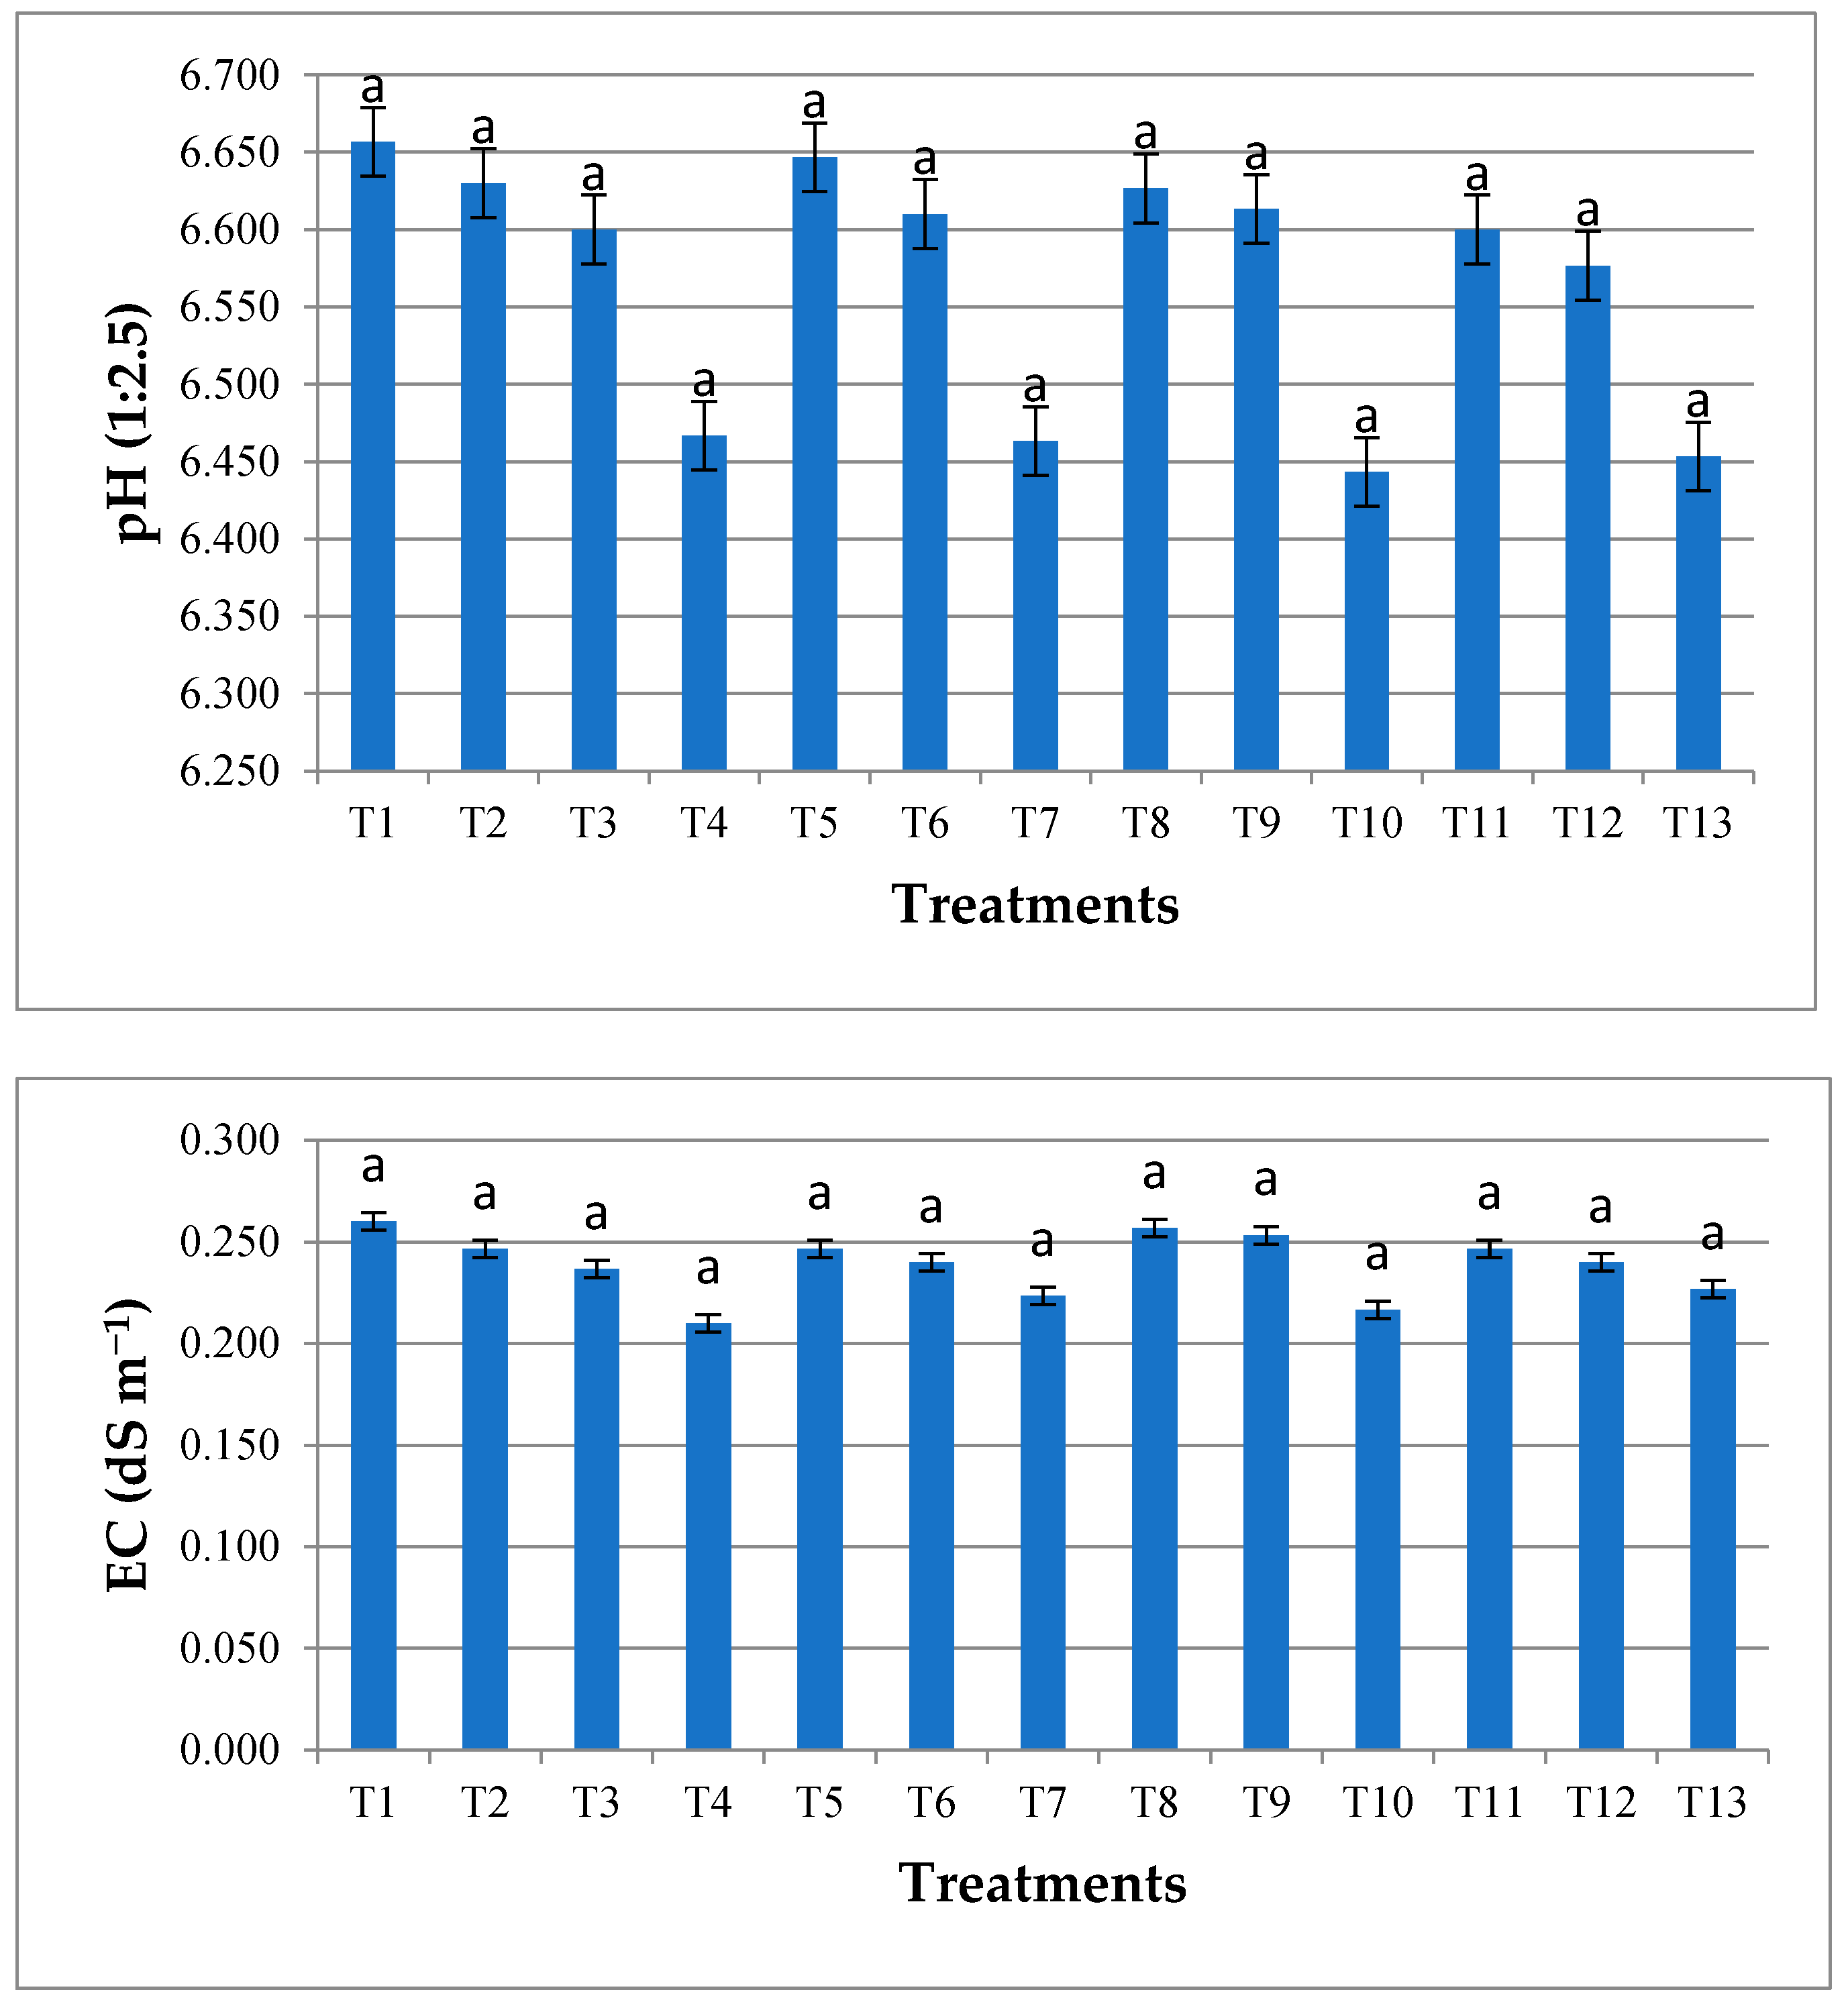
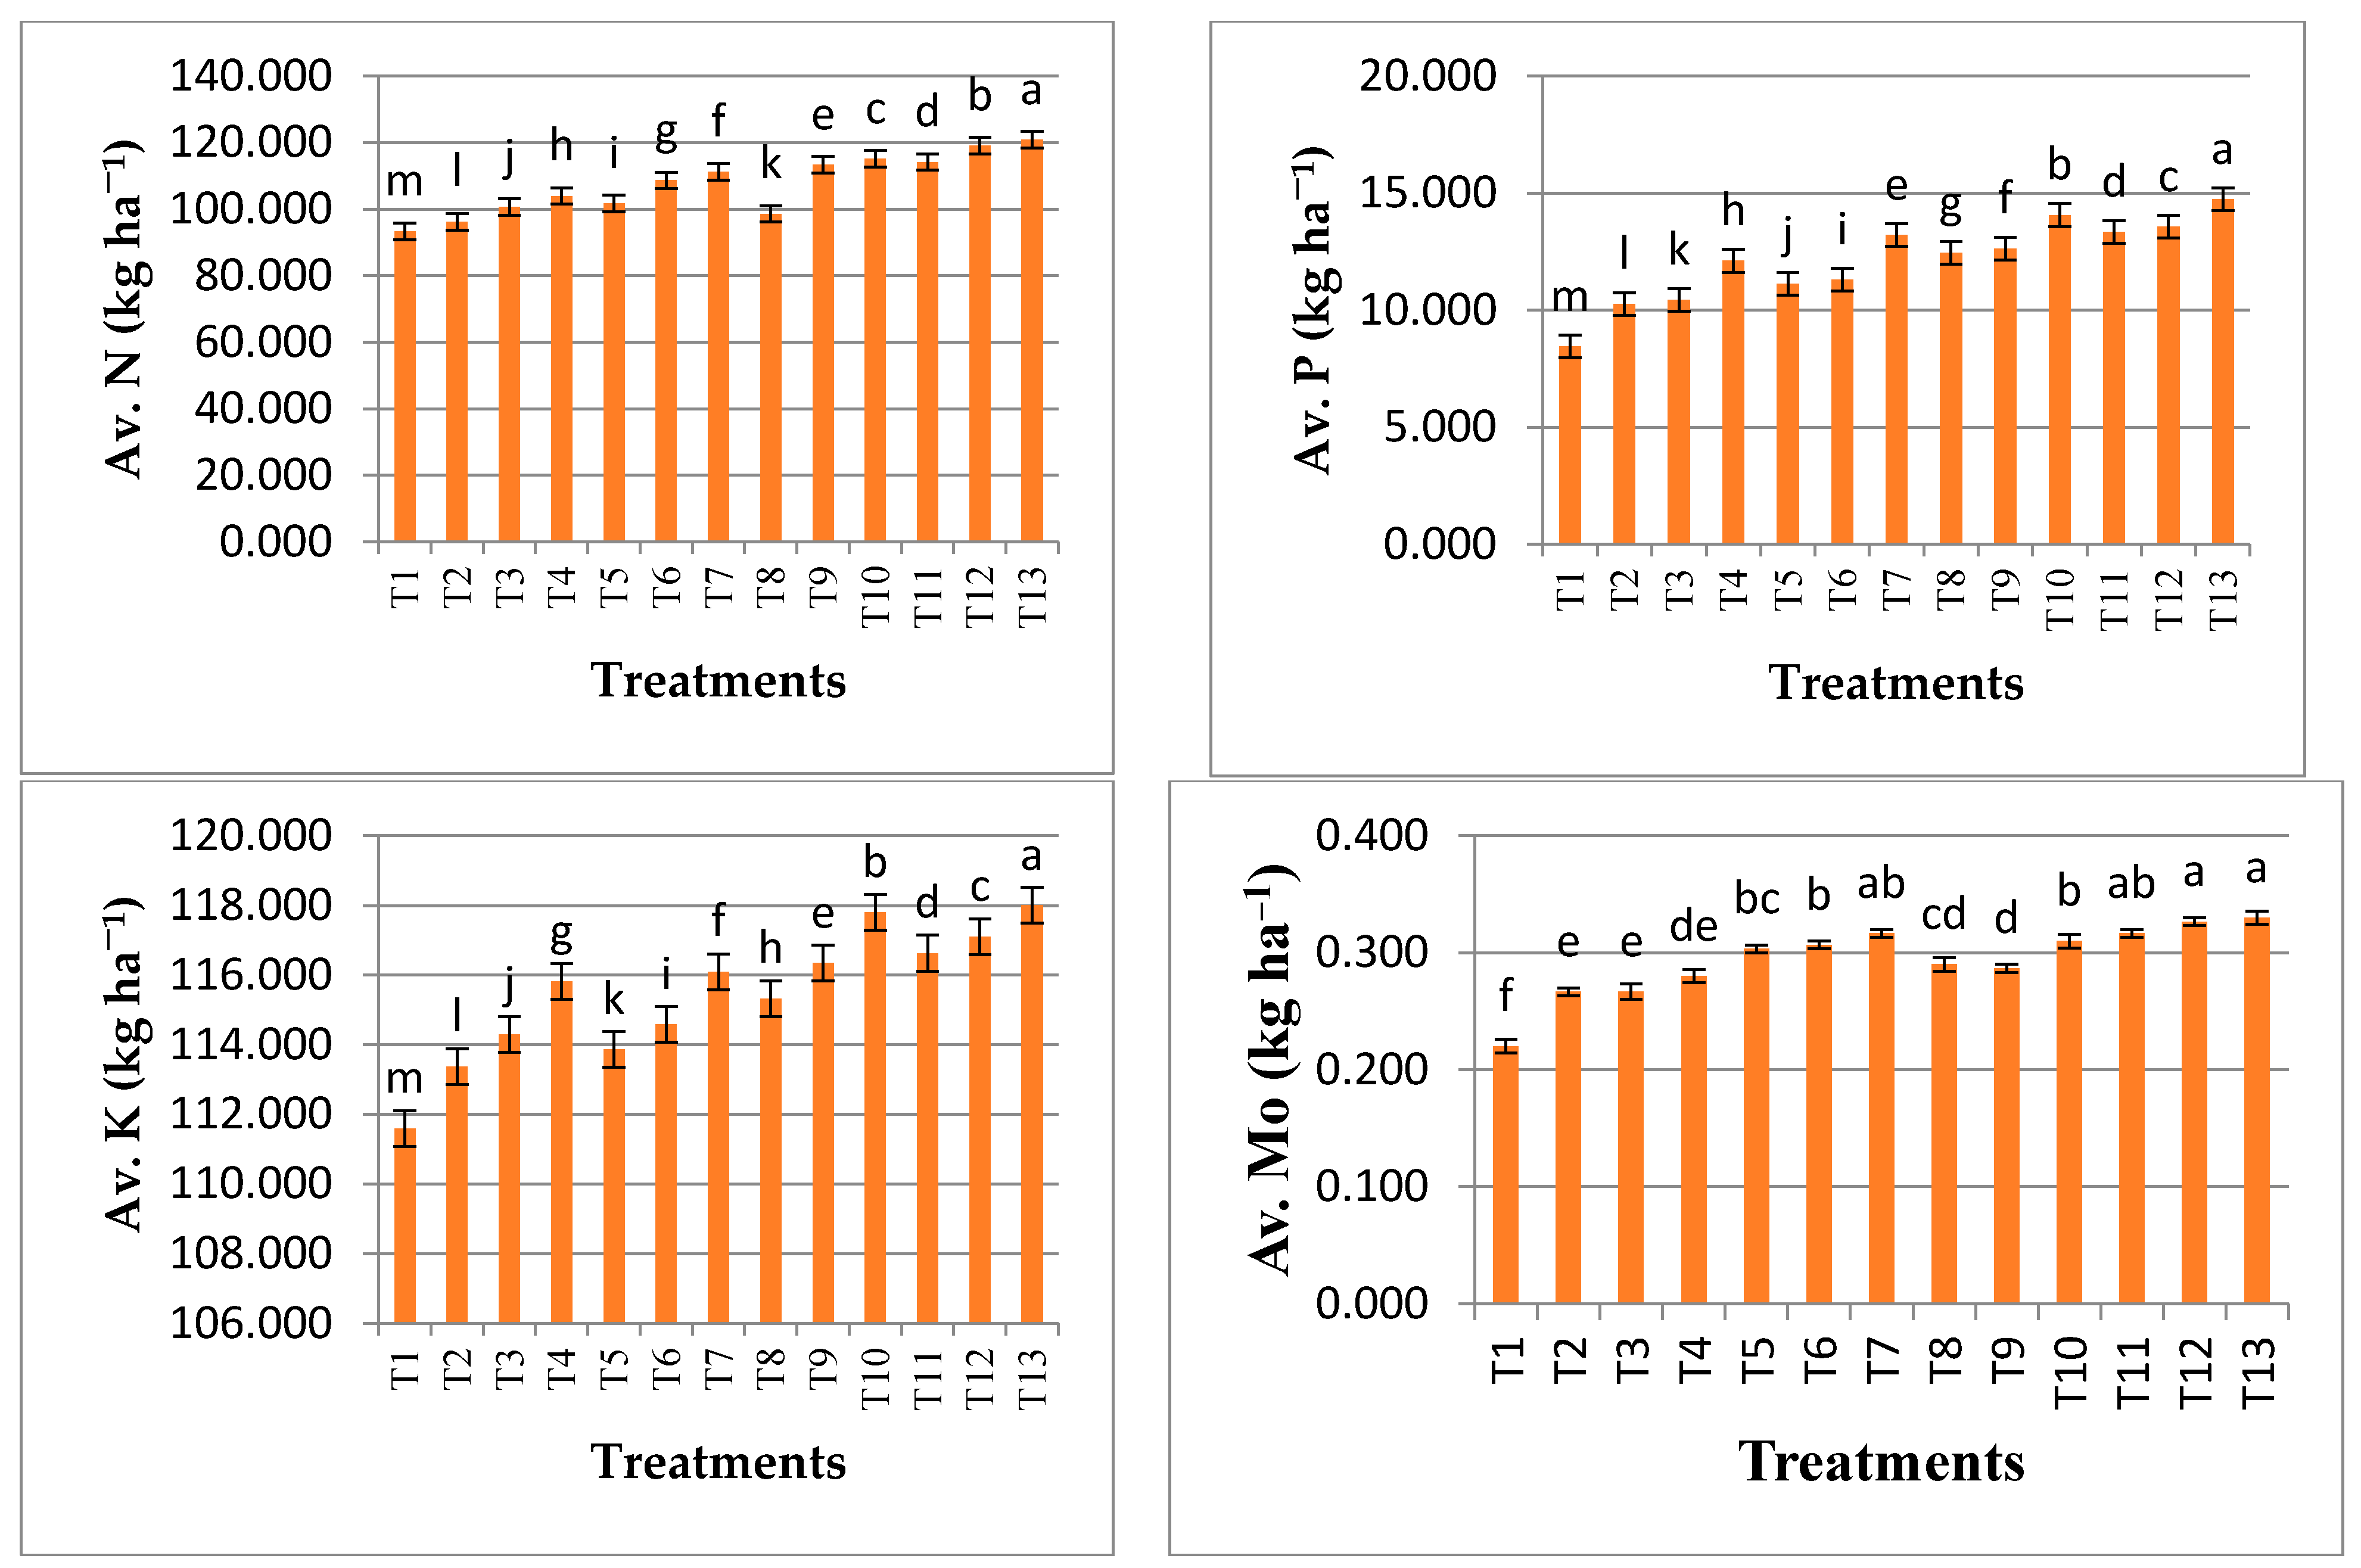
3.2. Influence of Different Treatments on Mean Values of Soil Chemical Quality Indicators
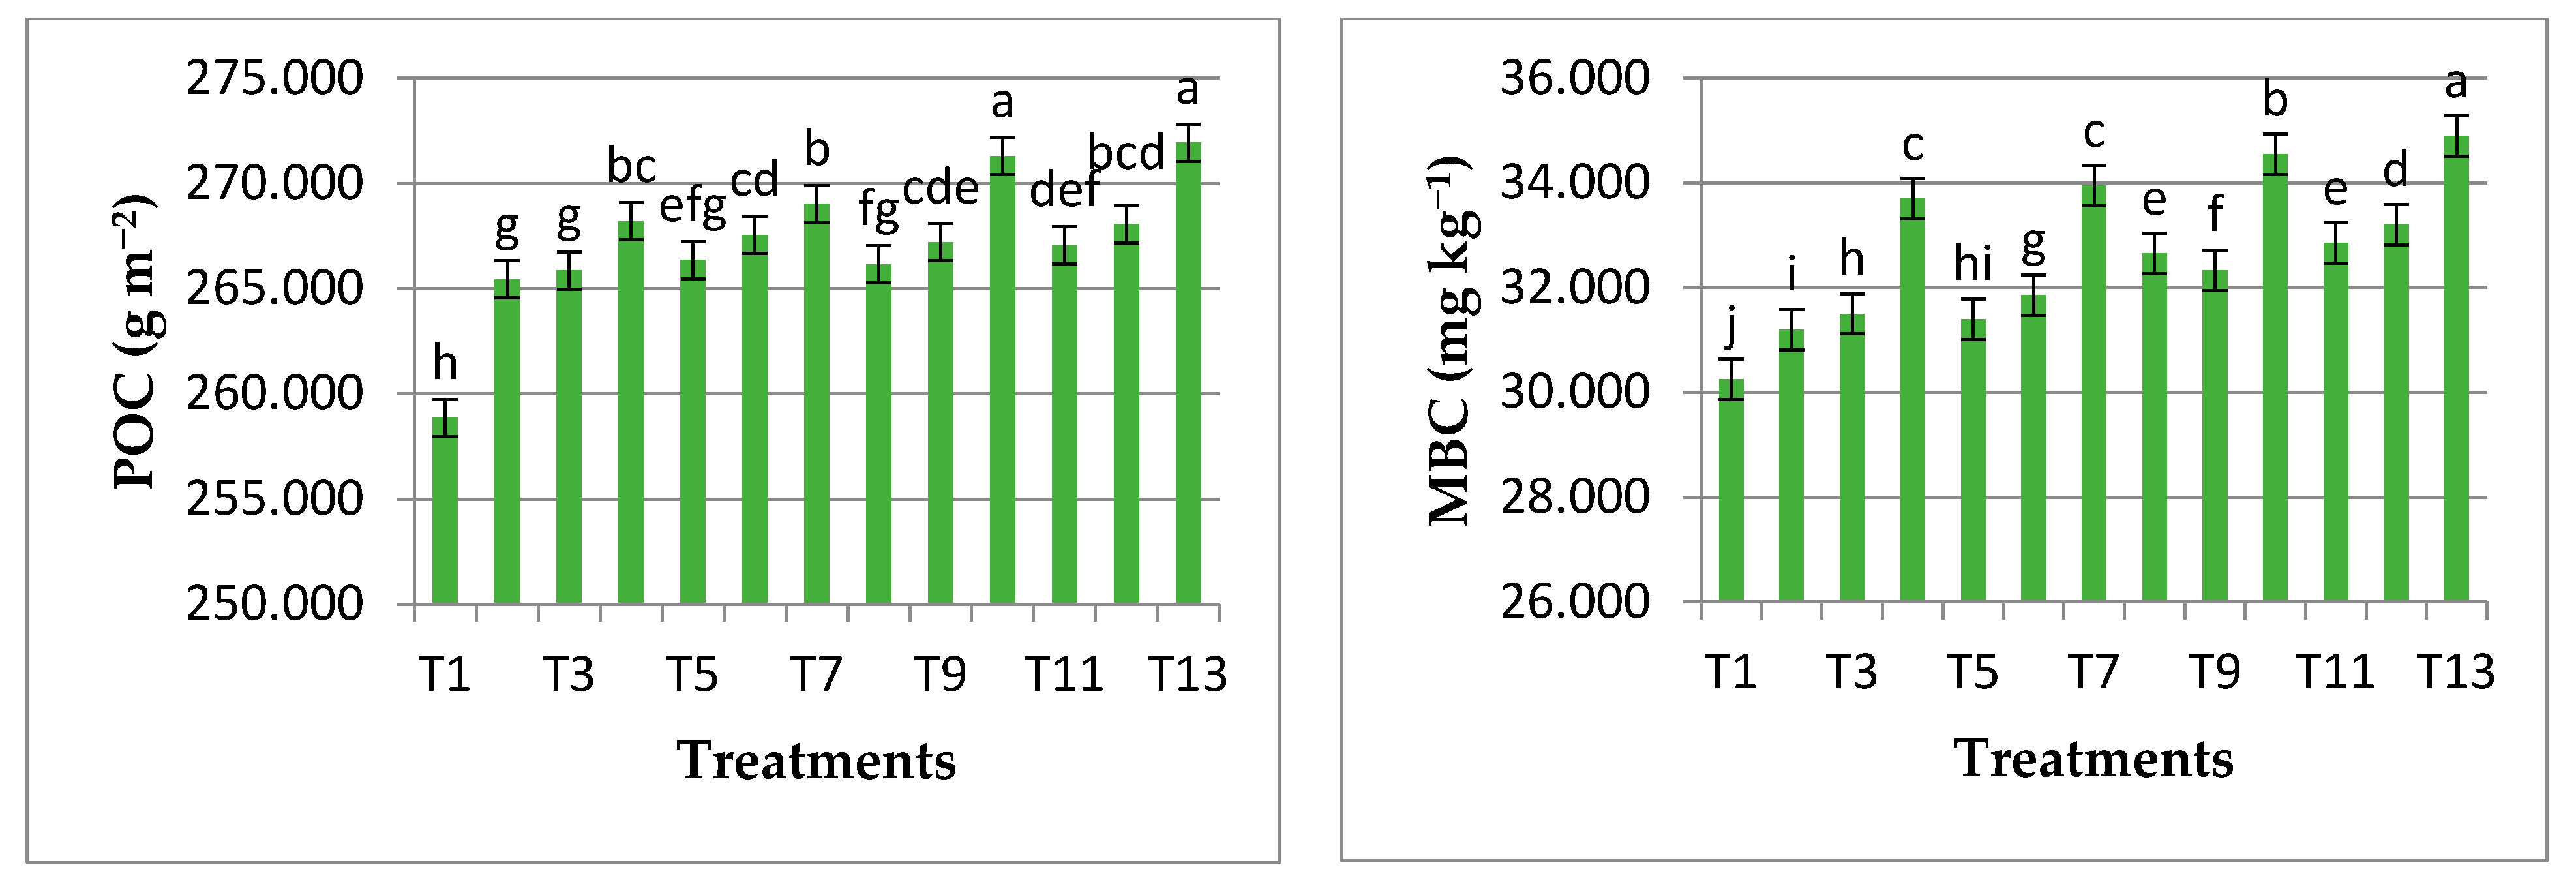
3.3. Influence of Different Treatments on Mean Values of Soil Carbon Fractions
3.4. Influence of Different Treatments on Mean Values of Soil Dehydrogenase Enzyme Activity and Total Microbial Count
3.5. Soil Quality Index
4. Conclusions
Author Contributions
Funding
Institutional Review Board Statement
Informed Consent Statement
Data Availability Statement
Conflicts of Interest
References
- Leeuwen, V.; Creamer, J.P.; Cluzeau, R.E.; Debeljak, D.; Gatti, M.; Henriksen, F.; Kuzmanovski, C.B.; Menta, V.; Peres, C.; Picaud, G.; et al. Modeling of soil functions for assessing soil quality: Soil biodiversity and habitat provisioning. Front. Environ. Sci. 2019, 7, 113. [Google Scholar] [CrossRef]
- Orgiazzi, A.; Bardgett, R.D.; Barrios, E. Global Soil Biodiversity Atlas; European Commission: Brussels, Belgium, 2016.
- Notaris, D.; Jensen, C.; Olesen, J.L.; da Silva, J.E.; Rasmussen, T.S.; Panagea, I.; Rubaek, G.H. Long-term soil quality effects of soil and crop management in organic and conventional arable cropping systems. Geoderma 2021, 403, 115383. [Google Scholar] [CrossRef]
- Doran, J.W.; Parkin, T.B. Defining and assessing soil quality. In Defining Soil Quality for a Sustainable Environment; Soil Science Society of America: Madison, WI, USA, 1994; Volume 35, pp. 1–21. [Google Scholar]
- Biswas, S.; Hazra, G.C.; Purakayastha, T.J.; Saha, N.; Mitran, T.; Singha Roy, S.; Basak, N.; Mandal, B. Establishment of critical limits of indicators and indices of soil quality in rice–rice cropping systems under different soil orders. Geoderma 2017, 292, 34–48. [Google Scholar] [CrossRef]
- Choudhary, M.; Datta, A.; Jat, H.S.; Yadav, A.K.; Gathala, M.K.; Sapkota, T.B.; Das, A.K.; Sharma, P.C.; Jat, M.L.; Singh, R.; et al. Changes in soil biology under conservation agriculture based sustainable intensification of cereal systems in Indo-Gangetic Plains. Geoderma 2018, 313, 193–204. [Google Scholar] [CrossRef]
- Armenise, E.; Redmile-Gordon, M.A.; Stellacci, A.M.; Ciccarese, A.; Rubino, P. Developing a soil quality index to compare soil fitness for agricultural use under different managements in the Mediterranean environment. Soil Tillage Res. 2013, 130, 91–98. [Google Scholar] [CrossRef]
- Bai, Z.; Li, H.; Yang, X.; Zhou, B.; Shi, X.; Wang, B.; Li, D.; Shen, J.; Chen, Q.; Qin, W.; et al. The critical soil P levels for crop yield, soil fertility and environmental safety in different soil types. Plant Soil 2013, 372, 27–37. [Google Scholar] [CrossRef]
- Bouma, J.; Van Ittersum, M.K.; Stoorvogel, J.J.; Batjes, N.H.; Droogers, P.; Pulleman, M.M. Soil capability: Exploring the functional potentials of soils. In Global Soil Security; Springer: Cham, Switzerland, 2017; pp. 27–44. [Google Scholar]
- Selim, M.M. Introduction to the integrated nutrient management strategies and their contribution to yield and soil properties. Int. J. Agron. 2020, 2020, 2821678. [Google Scholar] [CrossRef]
- Mandal, A.; Patra, A.K.; Singh, D.; Swarup, A.; Masto, R.E. Effect of long term application of manure and fertilizer on biological and biochemical activities in soil during crop developmental stages. Bioresour. Technol. 2007, 98, 3585–3592. [Google Scholar] [CrossRef]
- Ramesh, P.; Raten Panwar, N.; Bahadur Singh, A.; Ramana, S.; Subba Rao, A. Impact of organic-manure combinations on the productivity and soil quality in different cropping systems in central India. J. Plant Nutr. Soil Sci. 2009, 172, 577–585. [Google Scholar] [CrossRef]
- Basak, N.; Mandal, B.; Rai, A.K.; Basak, P. Soil quality and productivity improvement: Indian story. Proc. Indian Natl. Sci. Acad. 2021, 87, 2–10. [Google Scholar] [CrossRef]
- Crews, T.E.; Peoples, M.B. Legume versus fertilizer sources of nitrogen: Ecological tradeoffs and human needs. Agric. Ecosyst. Environ. 2004, 102, 279–297. [Google Scholar] [CrossRef]
- Yuvaraj, M.; Pandiyan, M.; Gayathri, P. Role of legumes in improving soil fertility status. In Legume Crops-Prospects, Production and Uses; IntechOpen: London, UK, 2020. [Google Scholar]
- Sharma, A.; Jalali, V.K.; Sharma, V.; Sharma, K.L. Distribution of available Potassium in soils of Rainfed areas Representing different Agro climatic Zones of Jammu and Kashmir. Indian J. Dryland Agric. Res. Dev. 2009, 24, 39–44. [Google Scholar]
- Gupta, R.D.; Arora, S.; Gupta, G.D.; Sumberia, N.M. Soil physical variability in relation to soil erodibility under different land uses in foothills of Siwaliks in NW India. Trop. Ecol. 2010, 51, 183. [Google Scholar]
- Jackson, M.L. Soil Chemical Analysis; Prentic Hall: Englewood Cliffs, NJ, USA, 1973. [Google Scholar]
- Piper, C.S. Soil and Plant Analysis; The University of Adelaide: Adelaide, Australia, 1950. [Google Scholar]
- Bouyoucos, G.J. Hydrometer Method improved for making particle size analysis of soils. Agron. J. 1962, 54, 464–465. [Google Scholar] [CrossRef]
- Keen, B.A.; Raczkowski, H. The relation between the clay content and certain physical properties of a soil. J. Agric. Sci. 1921, 11, 441–449. [Google Scholar] [CrossRef]
- Gupta, P.K. Soil, Plant, Water and Fertilizer Analysis; Publication AGRO-BIOS: Jodhpur, India, 1999; pp. 24–61. [Google Scholar]
- Subbiah, B.V.; Asija, G.L. A rapid procedure for the estimation of available nitrogen in soils. Curr. Sci. 1956, 25, 259. [Google Scholar]
- Olsen, S.R.; Cole, C.V.; Watanabe, F.S.; Dean, L.A. Estimation of available phosphorous in soils by extraction with sodium bicarbonate. In USDA Circular; USDA: Washington, DC, USA, 1956; p. 939. [Google Scholar]
- Chapman, H.D.; Pratt, P.F. Method of Analysis for Soils, Plants and Waters; Division of Agricultural Science, University of California: Berkely, CA, USA, 1961; p. 61. [Google Scholar]
- Walkley, A.; Black, I.A. An examination of the Degtjareff method for determining soil organic matter, and proposed modification of the chromic acid titration method. Soil Sci. 1934, 37, 29–38. [Google Scholar] [CrossRef]
- Blair, G.J.; Lefroy, R.D.B.; Lise, L. Soil carbon fractions based on their degree of oxidation and the development of a carbon management index for agricultural systems. Aust. J. Agric. Res. 1995, 46, 1459–1466. [Google Scholar] [CrossRef]
- Camberdella, C.A.; Elliott, E.T. Particulate soil organic matter across grassland cultivation sequence. Soil Sci. Soc. Am. J. 1992, 56, 777–783. [Google Scholar] [CrossRef]
- Vance, E.D.; Brookes, P.C.; Jenkinson, D.S. An extraction method for measuring soil microbial biomass carbon. Soil Biol. Biochem. 1987, 19, 703–707. [Google Scholar] [CrossRef]
- Aneja, K.R. Experiments in Microbiology, Plant Pathology Tissue Culture and Mushroom Cultivation; New Age International Limited: Delhi, India, 2001. [Google Scholar]
- Cassida, L.E.; Klein, D.P.; Santaro, T. Soil dehydrogenase activity. Soil Sci. 1964, 93, 371–376. [Google Scholar] [CrossRef]
- Stocking, M.A. Tropical Soils and Food Security: The Next 50 Years. Science 2003, 302, 1356–1359. [Google Scholar] [CrossRef] [PubMed] [Green Version]
- Diack, M.; Stott, D. Development of a Soil Quality Index for the Chalmers Silty Clay Loam from the Midwest USA; Purdue University, USDA-ARS National Soil Erosion Research Laboratory: West Lafayette, IN, USA, 2001; pp. 550–555. [Google Scholar]
- Karlen, D.L.; Hurley, E.G.; Andrews, S.S.; Cambardella, C.A.; Meek, D.W.; Duffy, M.D.; Mallarino, A.P. Crop rotation effects on soil quality at three northern corn/soybean belt locations. Agron. J. 2006, 98, 484–495. [Google Scholar] [CrossRef] [Green Version]
- Vasu, D.; Tiwari, G.; Sahoo, S.; Dash, B.; Jangir, A.; Sharma, R.P.; Naitam, R.; Tiwary, P.; Karthikeyan, K.; Chandran, P. A Minimum Data Set of Soil Morphological Properties for Quantifying Soil Quality in Coastal Agroecosystems. Catena 2021, 198, 105042. [Google Scholar] [CrossRef]
- Bhardwaj, A.K.; Jasrotia, P.; Hamilton, S.K.; Robertson, G.P. Ecological management of intensively cropped agro-ecosystem improves soil quality with sustained crop productivity. Agric. Ecosyst. Environ. 2011, 140, 419–429. [Google Scholar] [CrossRef]
- Gomez, K.A.; Gomez, A.A. Statistical Procedures for Agricultural Research; John Wiley and Sons: New York, NY, USA, 1984. [Google Scholar]
- Arunrat, N.; Pumijumnong, N.; Sereenonchai, S.; Chareonwong, U. Factors controlling soil organic carbon sequestration of highland agricultural areas in the mae chaem basin, northern Thailand. Agronomy 2020, 10, 305. [Google Scholar] [CrossRef] [Green Version]
- Sharma, R.P.; Kaushal, V.; Verma, G.; Sharma, S.P. Effect of threedecade long application of chemical fertilizers and amendments on crop yield under maize wheat cropping system in an acid alfisol. J. Appl. Nat. Sci. 2014, 6, 106–109. [Google Scholar] [CrossRef] [Green Version]
- Abdallah, A.M.; Jat, H.S.; Choudhary, M.; Abdelaty, E.F.; Sharma, P.C.; Jat, M.L. Conservation Agriculture Effects on Soil Water Holding Capacity and Water-Saving Varied with Management Practices and Agroecological Conditions: A Review. Agronomy 2021, 11, 1681. [Google Scholar] [CrossRef]
- Datt, N.; Dubey, Y.P.; Chaudhary, R. Studies on impact of organic, inorganic and integrated use of nutrients on symbiotic parameters, yield, quality of French bean (Phaseolus vulgaris L.) vis-à-vis soil properties of an acid Alfisol. Afr. J. Agric. Res. 2013, 8, 2645–2654. [Google Scholar]
- Das, B.; Chakraborty, D.; Singh, V.K.; Aggarwal, P.; Singh, R.; Dwivedi, B.S.; Mishra, R.P. Effect of integrated nutrient management practice on soil aggregate properties, its stability and aggregate-associated carbon content in an intensive rice–wheat system. Soil Tillage Res. 2014, 136, 9–18. [Google Scholar] [CrossRef]
- Antil, R.S.; Singh, M. Effects of organic manures and fertilizers on organic matter and nutrient status of the soil. Arch. Agron. Soil Sci. 2007, 53, 519–528. [Google Scholar] [CrossRef]
- Chandra, A.; Pardha-Saradhi, P.; Maikhuri, R.K.; Saxena, K.G.; Rao, K.S. Impact of farm yard manure on cropping cycle in a rainfed agroecosystem of Central Himalaya. Vegetos 2021, 34, 249–262. [Google Scholar] [CrossRef] [PubMed]
- Shah, T.I.; Rai, A.P.; Aziz, M.A. Relationship of Phosphorus Fractions with Soil Properties in Moth-bean Growing Acid Soils of North Western Indian Himalayas. Commun. Soil Sci. Plant Anal. 2019, 50, 1192–1198. [Google Scholar] [CrossRef]
- Matse, D.T.; Huang, C.H.; Huang, Y.M.; Yen, M.Y. Effects of co-inoculation of Rhizobium with plant growth promoting rhizobacteria on the nitrogen fixation and nutrient uptake of Trifolium repens in low phosphorus soil. J. Plant Nutr. 2020, 43, 739–752. [Google Scholar] [CrossRef]
- Janati, W.; Benmrid, B.; Elhaissoufi, W.; Zeroual, Y.; Nasielski, J.; Bargaz, A. Will Phosphate Bio-solubilization Stimulate Biological Nitrogen Fixation in Grain Legumes. Front. Agron. 2021, 7, 637196. [Google Scholar] [CrossRef]
- Banerjee, P.; Das, P.; Sinha, S. Importance of molybdenum for the production of pulse crops in India. J. Plant Nutr. 2021, 45, 300–310. [Google Scholar] [CrossRef]
- Dotaniya, C.K.; Lakaria, B.L.; Sharma, Y.; Meena, B.P.; Aher, S.B.; Shirale, A.O.; Gurav Pandurang, P.; Dotaniya, M.L.; Biswas, A.K.; Patra, A.K.; et al. Performance of chickpea (Cicer arietinum L.) in maize-chickpea sequence under various integrated nutrient modules in a Vertisol of Central India. PLoS ONE 2022, 17, 0262652. [Google Scholar] [CrossRef]
- Singh, A.; Singh, V.K.; Chandra, R.; Srivastava, P.C. Effect of integrated nutrient management on pigeon pea-based intercropping system and soil properties in Mollisols of the Tarai region. J. Indian Soc. Soil Sci. 2012, 60, 38–44. [Google Scholar]
- Ghosh, D.; Mandal, M.; Pattanayak, S.K. Long term effect of integrated nutrient management on dynamics of phosphorous in an acid Inceptisols of tropical India. Commun. Soil Sci. Plant Anal. 2021, 52, 2289–2303. [Google Scholar] [CrossRef]
- Adnan, M.; Fahad, S.; Zamin, M.; Shah, S.; Mian, I.A.; Danish, S.; Zafar-ul-Hye, M.; Battaglia, M.L.; Naz, R.M.M.; Saeed, B.; et al. Coupling phosphate-solubilizing bacteria with phosphorus supplements improve maize phosphorus acquisition and growth under lime induced salinity stress. Plants 2020, 9, 900. [Google Scholar] [CrossRef] [PubMed]
- Bargaz, A.; Lyamlouli, K.; Chtouki, M.; Zeroual, Y.; Dhiba, D. Soil microbial resources for improving fertilizers efficiency in an integrated plant nutrient management system. Front. Microbiol. 2018, 9, 1606. [Google Scholar] [CrossRef] [Green Version]
- Dhiman, D.; Sharma, R.; Sankhyan, N.K.; Sepehya, S.; Sharma, S.K.; Kumar, R. Effect of regular application of fertilizers, manure and lime on soil health and productivity of wheat in an acid Alfisol. J. Plant Nutr. 2019, 42, 2507–2521. [Google Scholar] [CrossRef]
- Zakikhani, H.; Khanif, Y.M.; Anuar, A.R.; Radziah, O.; Soltangheisi, A. Effects of different levels of molybdenum on uptake of nutrients in rice cultivars. Asian J. Crop Sci. 2014, 6, 236–244. [Google Scholar] [CrossRef] [Green Version]
- Rutkowska, B.; Szulc, W.; Spychaj-Fabisiak, E.; Pior, N. Prediction of molybdenum availability to plants in differentiated soil conditions. Plant Soil Environ. 2017, 63, 491–497. [Google Scholar]
- Ali, I.; He, L.; Ullah, S.; Quan, Z.; Wei, S.; Iqbal, A.; Munsif, F.; Shah, T.; Xuan, Y.; Luo, Y.; et al. Biochar addition coupled with nitrogen fertilization impacts on soil quality, crop productivity, and nitrogen uptake under double-cropping system. Food Energy Secur. 2020, 9, 208. [Google Scholar] [CrossRef]
- Kumar, U.; Shahid, M.; Tripathi, R.; Mohanty, S.; Kumar, A.; Bhattacharyya, P.; Lal, B.; Gautam, P.; Raja, R.; Panda, B.B.; et al. Variation of functional diversity of soil microbial community in sub-humid tropical rice-rice cropping system under long-term organic and inorganic fertilization. Ecol. Indic. 2017, 73, 536–543. [Google Scholar] [CrossRef]
- Iqbal, A.; He, L.; Ali, I.; Ullah, S.; Khan, A.; Akhtar, K.; Wei, S.; Fahad, S.; Khan, R.; Jiang, L. Co-incorporation of manure and inorganic fertilizer improves leaf physiological traits, rice production and soil functionality in a paddy field. Sci. Rep. 2021, 11, 10048. [Google Scholar] [CrossRef] [PubMed]
- Chenu, C.; Angers, D.A.; Barr’e, P.; Derrien, D.; Arrouays, D.; Balesdent, J. Increasing organic stocks in agricultural soils: Knowledge gaps and potential innovations. Soil Tillage Res. 2019, 188, 41–52. [Google Scholar] [CrossRef]
- Anantha, K.C.; Majumder, S.P.; Badole, S.; Padhan, D.; Datta, A.; Mandal, B.; Sreenivas, C.H. Pools of organic carbon in soils under a long-term rice–rice system with different organic amendments in hot, sub-humid India. Carbon Manag. 2020, 11, 331–339. [Google Scholar] [CrossRef]
- Li, T.; Zhang, Y.; Bei, S.; Li, X.; Reinsch, S.; Zhang, H.; Zhang, J. Contrasting impacts of manure and inorganic fertilizer applications for nine years on soil organic carbon and its labile fractions in bulk soil and soil aggregates. Catena 2020, 194, 104739. [Google Scholar] [CrossRef]
- Moharana, P.C.; Sharma, B.M.; Biswas, D.R.; Dwivedi, B.S.; Singh, R.V. Long term effect of nutrient management on soil fertility and soil organic carbon pools under a 6-year old pearl millet-wheat cropping system in an Inceptisol of subtropical India. Fields Crop Res. 2012, 136, 32–41. [Google Scholar] [CrossRef]
- Mandal, M.; Kamp, P.; Singh, M. Effect of long term manuring on carbon sequestration potential and dynamics of soil organic carbon labile pool under tropical rice-rice agro-ecosystem. Commun. Soil Sci. Plant Anal. 2020, 51, 468–480. [Google Scholar] [CrossRef]
- Singh, G.; Bhattacharyya, R.; Das, T.K.; Sharma, A.R.; Ghosh, A.; Das, S.; Jha, P. Crop rotation and residue management effects on soil enzyme activities, glomalin and aggregate stability under zero tillage in the Indo-Gangetic Plains. Soil Tillage Res. 2018, 184, 291–300. [Google Scholar] [CrossRef]
- Smitha, G.R.; Basak, B.B.; Thondaiman, V.; Saha, A. Nutrient management through organics, bio-fertilizers and crop residues improves growth, yield and quality of sacred basil (Ocimum sanctum Linn). Ind. Crops Prod. 2019, 128, 599–606. [Google Scholar]
- Hernandez, T.; Berlanga, J.G.; Tormos, I.; Garcia, C. Organic versus inorganic fertilizers: Response of soil properties and crop yield. AIMS Geosci. 2021, 7, 415–439. [Google Scholar] [CrossRef]
- Vishwanath; Kumar, S.; Purakayastha, T.J.; Datta, S.P.; Rosin, K.G.; Mahapatra, P.; Sinha, S.K.; Yadav, S.P. Impact of forty-seven years of long-term fertilization and liming on soil health, yield of soybean and wheat in an acidic Alfisol. Arch. Agron. Soil Sci. 2020, 68, 531–546. [Google Scholar]
- Cheng, H.; Yuan, M.; Duan, Q.; Sun, R.; Shen, Y.; Yu, Q.; Li, S. Influence of phosphorus fertilization patterns on the bacterial community in upland farmland. Ind. Crops Prod. 2020, 155, 112761. [Google Scholar] [CrossRef]
- Blanchet, G.; Gavazov, K.; Bragazza, L.; Sinaj, S. Responses of soil properties and crop yields to different inorganic and organic amendments in a Swiss conventional farming system. Agric. Ecosyst. Environ. 2016, 230, 116–126. [Google Scholar] [CrossRef] [Green Version]
- Wang, J.; Song, Y.; Ma, T.; Raza, W.; Li, J.; Howland, J.G.; Huang, Q.; Shen, Q. Impacts of inorganic and organic fertilization treatments on bacterial and fungal communities in a paddy soil. Appl. Soil Ecol. 2017, 112, 42–50. [Google Scholar] [CrossRef]
- Bei, S.; Zhang, Y.; Li, T.; Christie, P.; Li, X.; Zhang, J. Response of the soil microbial community to different fertilizer inputs in a wheat-maize rotation on a calcareous soil. Agric. Ecosyst. Environ. 2018, 260, 58–69. [Google Scholar] [CrossRef]
- Lazcano, C.; Gomez-Brandon, M.; Revilla, P.; Dominguez, J. Short-term effects of organic and inorganic fertilizers on soil microbial community structure and function. Biol. Fertil. Soils 2013, 49, 723–733. [Google Scholar] [CrossRef]
- Li, X.; Liu, C.; Zhao, H.; Gao, F.; Ji, G.; Hu, F.; Li, H. Similar positive effects of beneficial bacteria, nematodes and earthworms on soil quality and productivity. Appl. Soil Ecol. 2018, 130, 202–208. [Google Scholar] [CrossRef]


| Treatments | Bulk Density (mg m−3) | WHC (%) | Soil Porosity (%) | Infiltration Rate (cm h−1) | Total WSA (%) |
|---|---|---|---|---|---|
| T1 | 1.54 d | 30.56 k | 42.51 g | 0.85 a | 43.20 a |
| T2 | 1.56 a | 30.66 i | 41.83 l | 0.85 a | 43.55 a |
| T3 | 1.53 e | 30.75 f | 42.56 f | 0.85 a | 43.65 a |
| T4 | 1.48 i | 35.27 b | 44.76 a | 0.87 a | 44.85 a |
| T5 | 1.55 bc | 30.65 i | 42.14 j | 0.85 a | 43.50 a |
| T6 | 1.53 e | 30.79 e | 42.88 e | 0.85 a | 43.70 a |
| T7 | 1.49 h | 35.31 a | 44.38 b | 0.87 a | 44.75 a |
| T8 | 1.55 bc | 30.61 j | 42.14 j | 0.85 a | 43.70 a |
| T9 | 1.54 cd | 30.73 g | 42.29 h | 0.85 a | 43.85 a |
| T10 | 1.51 f | 35.06 d | 43.64 d | 0.87 a | 44.90 a |
| T11 | 1.55 bc | 30.60 j | 41.94 k | 0.85 a | 43.50 a |
| T12 | 1.55 b | 30.71 h | 42.20 i | 0.85 a | 43.75 a |
| T13 | 1.50 g | 35.10 c | 44.01 c | 0.87 a | 44.80 a |
| Treatments | Dehydrogenase Activity (μg TPF g−1 Soil 24 h−1) | Bacterial Population (×104 cfu g−1 Soil) | Fungal Population (×102 cfu g−1 Soil) |
|---|---|---|---|
| T1 | 23.29 m | 11.04 m | 7.01 l |
| T2 | 24.04 l | 11.78 h | 7.98 g |
| T3 | 24.56 j | 12.19 e | 8.39 e |
| T4 | 25.85 d | 13.82 a | 10.07 a |
| T5 | 24.24 k | 11.56 j | 7.76 i |
| T6 | 24.92 h | 11.96 f | 8.11 f |
| T7 | 26.10 c | 13.58 b | 9.84 b |
| T8 | 24.70 i | 11.40 k | 7.59 j |
| T9 | 25.14 f | 11.93 g | 8.12 f |
| T10 | 26.65 b | 13.23 c | 9.66 c |
| T11 | 24.97 g | 11.26 l | 7.43 k |
| T12 | 25.36 e | 11.70 i | 7.86 h |
| T13 | 26.88 a | 13.01 d | 9.53 d |
| Principal Component I | Principal Component II | Principal Component III | Principal Component IV | |
|---|---|---|---|---|
| Eigen value | 13.57 | 4.66 | 2.57 | 1.43 |
| Percentage of variance explained | 67.99 | 16.21 | 9.86 | 5.94 |
| Cumulative percentage | 67.99 | 84.20 | 94.06 | 100 |
| Weighting | 0.680 | 0.162 | 0.099 | 0.059 |
| Eigenvectors | ||||
| WHC | 0.911 | 0.085 | 0.236 | −0.189 |
| Porosity | 0.787 | 0.077 | 0.288 | 0.298 |
| Bacteria | 0.421 | 0.480 | 0.358 | 0.218 |
| Fungi | 0.811 | 0.092 | −0.107 | −0.092 |
| DHA | 0.132 | 0.905 | 0.296 | 0.075 |
| Labile carbon | 0.383 | −0.264 | 0.295 | 0.337 |
| POC | 0.647 | 0.167 | 0.137 | 0.043 |
| MBC | 0.839 | −0.341 | −0.068 | 0.164 |
| Bulk density | −0.681 | −0.201 | 0.186 | −0.362 |
| Av. N | 0.814 | −0.354 | 0.290 | 0.190 |
| Av. P | 0.735 | 0.158 | −0.337 | 0.746 |
| Av. Mo | 0.624 | 0.704 | −0.031 | −0.293 |
| Av. K | 0.165 | 0.297 | 0.140 | 0.459 |
| Treatment | WHC | Bacteria | DHA | Available P | SQI | ||||
|---|---|---|---|---|---|---|---|---|---|
| S | W | S | W | S | W | S | W | ||
| T1 | 0.068 | 0.680 | 0.162 | 0.162 | 0.189 | 0.099 | 0.241 | 0.059 | 0.105 |
| T2 | 0.107 | 0.680 | 0.237 | 0.162 | 0.113 | 0.099 | 0.390 | 0.059 | 0.145 |
| T3 | 0.104 | 0.680 | 0.445 | 0.162 | 0.057 | 0.099 | 0.207 | 0.059 | 0.161 |
| T4 | 0.347 | 0.680 | 0.284 | 0.162 | 0.047 | 0.099 | 0.212 | 0.059 | 0.299 |
| T5 | 0.129 | 0.680 | 0.352 | 0.162 | 0.187 | 0.099 | 0.062 | 0.059 | 0.167 |
| T6 | 0.127 | 0.680 | 0.558 | 0.162 | 0.238 | 0.099 | 0.216 | 0.059 | 0.213 |
| T7 | 0.232 | 0.680 | 0.686 | 0.162 | 0.152 | 0.099 | 0.384 | 0.059 | 0.307 |
| T8 | 0.219 | 0.680 | 0.076 | 0.162 | 0.191 | 0.099 | 0.103 | 0.059 | 0.186 |
| T9 | 0.301 | 0.680 | 0.059 | 0.162 | 0.012 | 0.099 | 0.045 | 0.059 | 0.218 |
| T10 | 0.343 | 0.680 | 0.531 | 0.162 | 0.571 | 0.099 | 0.375 | 0.059 | 0.398 |
| T11 | 0.187 | 0.680 | 0.334 | 0.162 | 0.041 | 0.099 | 0.284 | 0.059 | 0.202 |
| T12 | 0.081 | 0.680 | 0.536 | 0.162 | 1.000 | 0.099 | 0.432 | 0.059 | 0.266 |
| T13 | 0.295 | 0.680 | 1.000 | 0.162 | 0.030 | 0.099 | 0.117 | 0.059 | 0.372 |
Publisher’s Note: MDPI stays neutral with regard to jurisdictional claims in published maps and institutional affiliations. |
© 2022 by the authors. Licensee MDPI, Basel, Switzerland. This article is an open access article distributed under the terms and conditions of the Creative Commons Attribution (CC BY) license (https://creativecommons.org/licenses/by/4.0/).
Share and Cite
Shah, T.I.; Shah, A.M.; Bangroo, S.A.; Sharma, M.P.; Aezum, A.M.; Kirmani, N.A.; Lone, A.H.; Jeelani, M.I.; Rai, A.P.; Wani, F.J.; et al. Soil Quality Index as Affected by Integrated Nutrient Management in the Himalayan Foothills. Agronomy 2022, 12, 1870. https://doi.org/10.3390/agronomy12081870
Shah TI, Shah AM, Bangroo SA, Sharma MP, Aezum AM, Kirmani NA, Lone AH, Jeelani MI, Rai AP, Wani FJ, et al. Soil Quality Index as Affected by Integrated Nutrient Management in the Himalayan Foothills. Agronomy. 2022; 12(8):1870. https://doi.org/10.3390/agronomy12081870
Chicago/Turabian StyleShah, Tajamul Islam, Aanisa Manzoor Shah, Shabir Ahmed Bangroo, Manbir Pal Sharma, Aziz Mujtaba Aezum, Nayar Afaq Kirmani, Aabid Hussain Lone, Mohammad Iqbal Jeelani, Ajai Pratap Rai, Fehim Jeelani Wani, and et al. 2022. "Soil Quality Index as Affected by Integrated Nutrient Management in the Himalayan Foothills" Agronomy 12, no. 8: 1870. https://doi.org/10.3390/agronomy12081870