Abstract
Biochar application has been considered as a promising solution to address the effects of modern agriculture on climate change. However, there is a lack of research on the biochar application of greenhouse gas emissions based on poor soils in Korean agricultural land. Therefore, this study aimed to evaluate the effects of biochar application according to different soil characteristics on soil organic carbon (SOC) improvement and greenhouse gas reduction. The incubation experiments were conducted for 49 days and used different feedstock (barley straw and poultry manure) and biochar application rates (0, 5, 10, and 20-ton ha−1) in four soil characteristics (upland, U; greenhouse, G; converted land, C; reclaimed land, R). The results of this study showed that the SOC increased significantly in all soils after biochar application. The increasing SOC rate was the highest in poor soil. Biochar 20-ton ha−1 treatment significantly reduced N2O emissions by 33.2% compared with the control. Barley straw biochar significantly reduced N2O emissions from all soils. Barley straw biochar decreased approximately 74.5% of N2O emissions compared with poultry manure biochar. Poultry manure biochar improved SOC and reduced N2O emissions in poor soil. However, in poultry manure biochar treatment in U and G soil, N2O emissions increased. In conclusion, barley straw biochar application was found to suppress N2O emissions and improve the SOC in all soil characteristics of agricultural land. In addition, the soil carbon storage effect and N2O reduction effect of biochar were the highest in poor soil. Thus, the biochar application can be a potential agricultural practice for improving soil quality and decreasing N2O emissions in domestic agricultural soil.
1. Introduction
Climate change has had a decisive impact on global food production and greenhouse gas emissions scenarios, including disturbing the soil, the largest carbon reservoir in the terrestrial ecosystem [1,2]. Historical emissions have raised atmospheric concentrations of GHGs, including carbon dioxide (CO2), nitrous oxide (N2O), and methane (CH4), to unprecedented levels for at least 800,000 years [3]. Among the different sectors that emit greenhouse gases worldwide, agriculture comprises approximately 10–12% of total emissions, with an annual greenhouse gas emission of approximately 5.1–6.1 Pg. [4,5]. Among these GHGs, CH4 and N2O, which are mainly emitted from agricultural land, have a global warming potential (GWP) of 28 and 265 folds that of CO2, respectively, and consequently have a considerably greater effect on global warming [3]. N2O is a major source of nitrogen oxide (NO), an important ozone depletion agent [6]. Furthermore, the agricultural sector accounts for approximately 60% of global anthropogenic emissions of N2O [7]. Although N2O is mainly emitted from uplands, it is also emitted from some rice fields and can stay in the atmosphere for more than 100 years; therefore, reducing N2O emissions is important to mitigate climate change [8].
Recently, as part of the response to climate change, research focusing on biochar actively garnered attention in the agricultural sector [5,8,9]. Biochar is a compound word of biomass and charcoal, and it is a solid compound with a high carbon content, manufactured by pyrolyzing biomass in an oxygen-free environment [10]. Biochar is a promising alternative to agricultural productivity and climate change mitigation [11,12,13]. It has been claimed that biochar has the potential to reduce the impact of agricultural systems on global warming through carbon sequestration and N2O suppression [13,14,15,16,17]. Particularly, it reportedly has a positive effect on N2O emission mitigation in agricultural lands, such as paddy fields and uplands using fertilizers [18,19]. Case et al. [5] reported that biochar suppressed cumulative N2O emission production by 91% in near-saturated, fertile soils. Ginebra et al. [11] reported that N2O fluxes decreased 23–50% in treatments containing biochar with low mineral N contents and high C stability. Such possible beneficial effects of biochar are a few of the reasons why biochar research is gaining popularity [20].
However, some studies have indicated that the effect of biochar is inconsistent and have reported a neutral or slight increase in N2O emissions [21,22,23,24]. For example, the incorporation of high C/N ratio biochar can suppress N2O emissions because available soil N is immobilized [25]. Conversely, readily mineralizable N in low C/N ratio biochar can be transformed into mineral N that feeds into nitrification and denitrification processes. as a result, N2O emissions can increase by heterotrophic denitrification activities [26]. In addition, the biochar application effect can be different in poor soil than that in fertile soil [27]. Moreover, the difference in the effects of biochar application in the soil can depend upon the associated feedstocks [28,29,30], physicochemical properties [31], pyrolysis temperature [12,32], existing soil features [12,15,33], fertilizer input [18,21]. In previous studies, although the effect of mitigating N2O emissions varies according to soil fertility, biochar feedstock and input amount, and soil features of the agricultural land [27,34], there are no significant differences between pyrolysis temperature and fertilizer input and N2O emissions [35]. Thus, it is important to differentiate biochar application by existing soil features.
In the case of cropland in Korea, tidal flats or forests are frequently converted into agricultural land [36,37]. As a result, there are fertile soils and poor soils even on agricultural land. However, research so far has focused on the development of biochar feedstocks to reduce greenhouse gases [28,38,39,40], the effect of increasing crop growth and yield [41,42,43], the effects of biochar according to climate zone [13,44], and adsorption of water and soil pollutants [45,46]. Although there have been studies evaluating the effect of biochar on existing fertile farmland [13,14,38,42,47], studies on the effect of biochar on poor soil that can be converted to cropland have been limited. Quantification of nitrous oxide emissions through the application of biochar to soils of different fertility is needed, as applying the same biochar to soils with different characteristics can pose a threat to cropland aimed at mitigating climate change. We hypothesized that applying biochar to agricultural land would have a soil improvement effect on fertile soil and a carbon storage effect on poor soil.
Therefore, this study aimed to analyze the SOC improvement and N2O emission reduction effects of biochar on different soil characteristics in cropland of Korea. To this end, (1) the change in SOC after biochar application was compared, (2) N2O emission features according to biochar type and application rate were evaluated, and (3) cumulative N2O emission features were evaluated quantitatively according to soil characteristics. Our study can provide useful information for mitigating climate change through biochar application in various forms of agricultural soil.
2. Materials and Methods
2.1. Soil and Biochar
The soil used for the incubation experiments was collected from upland (35°00′ N, 127°30′ E), greenhouses (35°22′ N, 126°36′ E), converted land (35°49′ N, 127°02′ E), and reclaimed land (35°49′ N, 126°41′ E). The soil obtained from the sites was air-dried at the National Academy of Agricultural Sciences in Wanju-gun, Jeollabuk-do, Republic of Korea, and passed through a 2 mm sieve before being used as a test material. The publicly disclosed chemical properties of the soil are indicated in the table below (Table 1).

Table 1.
Chemical properties by soil characteristics in agricultural land.
Biochar was made from Barley straw and poultry manure. After undergoing a pre-treatment process, including collection, and drying, biochar was produced at a biochar manufacturing factory in Yesan-gun, Chungcheongnam-do, through TLUD (Top Lit Up Draft) pyrolysis in a carbonization furnace at 500 °C. The pH of the barley straw biochar (BB) was 9.5, T-C content was 253.0 g kg−1, the C/N ratio was 17.3, and the surface area was 6.3-m2 g−1. The pH of the poultry manure biochar (PB) was 10.2, T-C content was 376.9 g kg−1, the C/N ratio was 13.8, and the surface area was 7.8-m2 g−1 (Table 2).
Table 2.
Physicochemical properties of biochar.
2.2. Incubation Experiments
Experimental treatment areas were classified as upland soil (U), greenhouse soil (G), converted land soil (C), and reclaimed land soil (R), which are types frequently changed to farmland, and each treatment group was treated using two biochar types at 0, 5, 10, and 20-ton ha−1 [48]. Finally, each experimental group was treated for three repetitions adding up to 96 experimental groups (Table 3).
Table 3.
Description of the experimental setup.
Using the standard amount of fertilizer used on spring cabbage (N–P–K = 32–7.8–19.8 kg 10 a−1), 5.47, 3.53, and 2.54 g urea-soluble phosphorus–potassium chloride were, respectively, added per 10 kg soil, and 42 g mixed livestock manure compost (28% cow manure, 22% pig manure, and 19% chicken manure) was added per 10 kg soil. The fertilizer was applied equally to all agricultural soil characteristics [49]. Biochar was applied to each experimental group by calculating appropriate input for each group. For all experimental groups, soil and materials were added, mixed, and packed in a closed chamber (∅ 9.0 cm, H 12.5 cm). Water holding capacity of 70%, the temperature of 25 °C, and conditions for the highest level of microbial decomposition activity [50] were maintained, and the groups were incubated for 49 days (Table 3).
2.3. Gas Samples and Measurements
Gas samples and measurements used a protocol similar to that described by Maucieri et al. [51]. The N2O concentration generated in the closed chamber under constant temperature was examined. A vacuum pump introduced fresh air into the closed bottle to eliminate the gas present before sampling. Gas samples were obtained with a 2-day interval for the first week of incubation, after a 3-day interval for the second week, and weekly after that. When gas samples were not collected, the stopper was left open to supply sufficient oxygen, and distilled water was replenished every 2–3 days to maintain a constant moisture content considering evaporation. N2O concentration of the gas sample was measured using gas chromatography (7890A, Agilent, Santa Clara, CA, USA). The detailed conditions are indicated in Table 4. N2O efflux calculation formula is as follows [52]:
Table 4.
SOC, T-N, C/N ratio, N2O emissions, and cumulative N2O emissions according to soil characteristics after 49 days of incubation conditions.
Here, N2O efflux is emission (mg m−2 day−1) is the gas density, N2O is 1.967-mg cm−3, V is the chamber volume (m3), A is the chamber surface area (m2), and is the increasing N2O concentration in the chamber per unit time (mg m−3 day−1), and T is the constant temperature. Furthermore, the cumulative amount was calculated using Σ (R × D) to determine the total N2O efflux during constant temperature. Herein, R is the N2O generated (mg m−3 day−1), and D is the sampling interval [52].
2.4. Soil and Biochar Analysis
For soil analysis, pH, T-C, and T-N were measured following the soil chemical analysis [53]. For pH, soil and distilled water were mixed at a 1:5 ratio (W V−1) by stirring for 30 min and measured using a pH meter (S230 Mettler Toledo, Switzerland), and T-C and T-N were measured using a CN analyzer (Vario Max CN, Elementar, Langenselbold, Germany). Effective phosphoric acid was measured using the Lancaster method (UV2550PC, PerkinElmer, Waltham, MA, USA), NH4+ were measured using the Indophenol-Blue colorimetric method, and NO3− was measured using the Brucine. Cation Exchange Capacity and displaceable cations were measured using ICP (ICPE-9000, Shimadzu, Kyoto, Japan) after leaching with a 1N-NH4OAc solution [53].
Biochar pH was measured using the equipment used for soil analysis by mixing biochar and distilled water at a ratio of 1:10 (W V−1) and stirring, whereas for T-C and T-N, total hydrogen was measured using an Elemental Analyzer (Vario MACRO cube, Elementar, Germany) and specific surface area was assessed using a surface area analyzer (BELSORP-max, BEL, Toyonaka, Japan) [54].
2.5. Statistical Analysis
A comparison of N2O emissions according to biochar application by soil in agricultural land was statistically processed using SPSS statistics (Version 25, IBM, Armonk, NY, USA). All data are expressed as mean ± standard error. Two-way ANOVA was conducted to compare the differences between the treatments. Additionally, Duncan’s multiple range test was performed only when the F-test value was significant in the range of p < 0.05.
3. Results
3.1. Soil Chemistry Properties
The SOC indicated a significant difference between soil characteristics and also significantly increased according to the biochar application rate. U20, G20, C20, and R20 were increased SOC content by 23.2%, 30.8%, 47.2%, and 44.6%, Compared with U0, G0, C0, and R0. The increase rate of SOC was highest in converted land soil and lowest in upland soil (Table 4).
Only the converted land soil had a significant difference in T-N according to the amount of biochar input. There was no significant difference in T-N depending on the biochar application rates within the U, G, and R soil. However, there was a significant difference in the 20-ton ha-1 treatment overall in agricultural land. Nitrogen content was relatively high in greenhouse and upland soil, where ammonium ions (NH4+) and nitrates (NO3−) existed at relatively high levels. In the C20 treatment group, T-N was significantly increased by 14.7% compared with the control group. Although there was no significant difference, T-N increased by 3.6%, 7.7%, and 1.3% in U20, G20, and R20 treatment groups. As a result, the nitrogen improvement effect by biochar input was the highest in converted soil (Table 4).
The C/N ratio indicated a significant difference between soil characteristics and significantly increased according to the amount of biochar input. C/N ratio increased by 19.8%, 24.9%, 37.5%, and 45.1% in the U20, G20, C20, and R20 treatment groups, respectively, compared with the control group. Similar to SOC, the C/N increase rate was highest in the reclaimed land soil and the lowest in upland soil (Table 4).
3.2. N2O Emission
N2O emissions were analyzed for 49 days, and a significant difference between soil characteristics was observed (Table 4). The average N2O emission of the greenhouse soil was highest with 14.1 ± 2.8-mg m−2 day−1 and the lowest in the reclaimed land soil with 2.7 ± 0.2 mg-m−2 day−1. N2O emission rapidly increased in upland and greenhouse soil early in the constant temperature conditions, whereas the converted land and reclaimed land soil exhibited the highest level on the 14th day of continuous temperature.
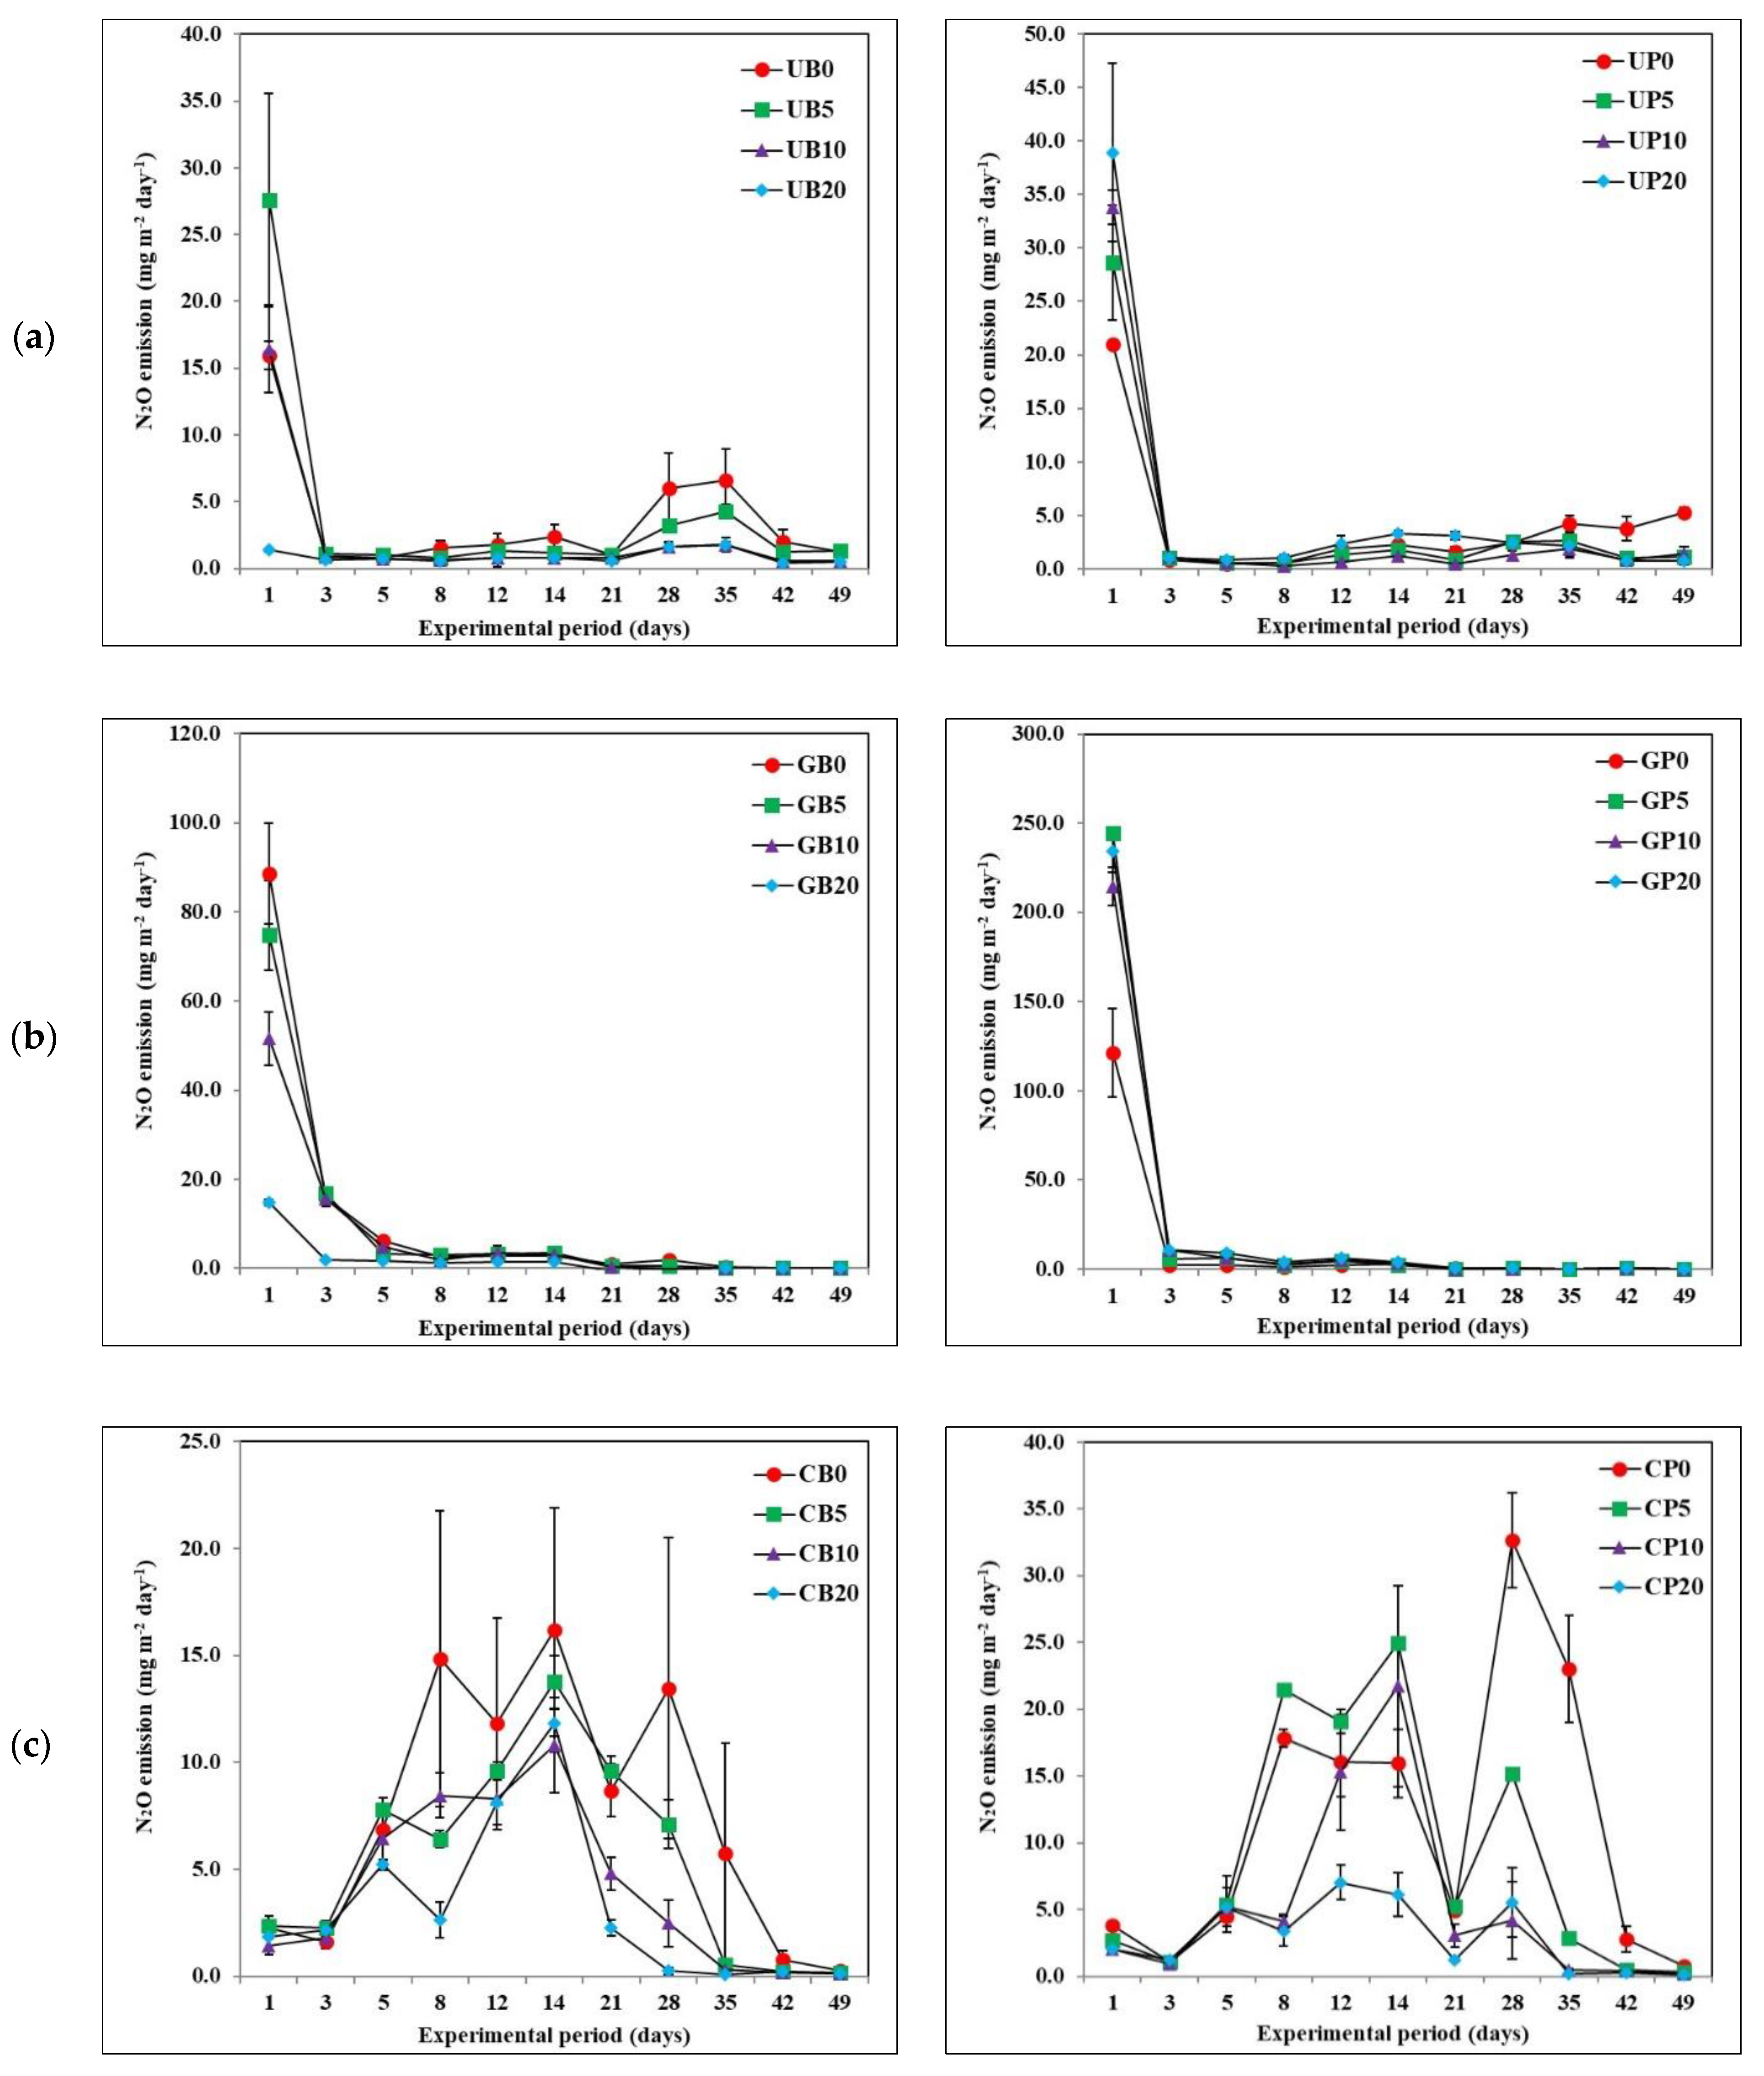
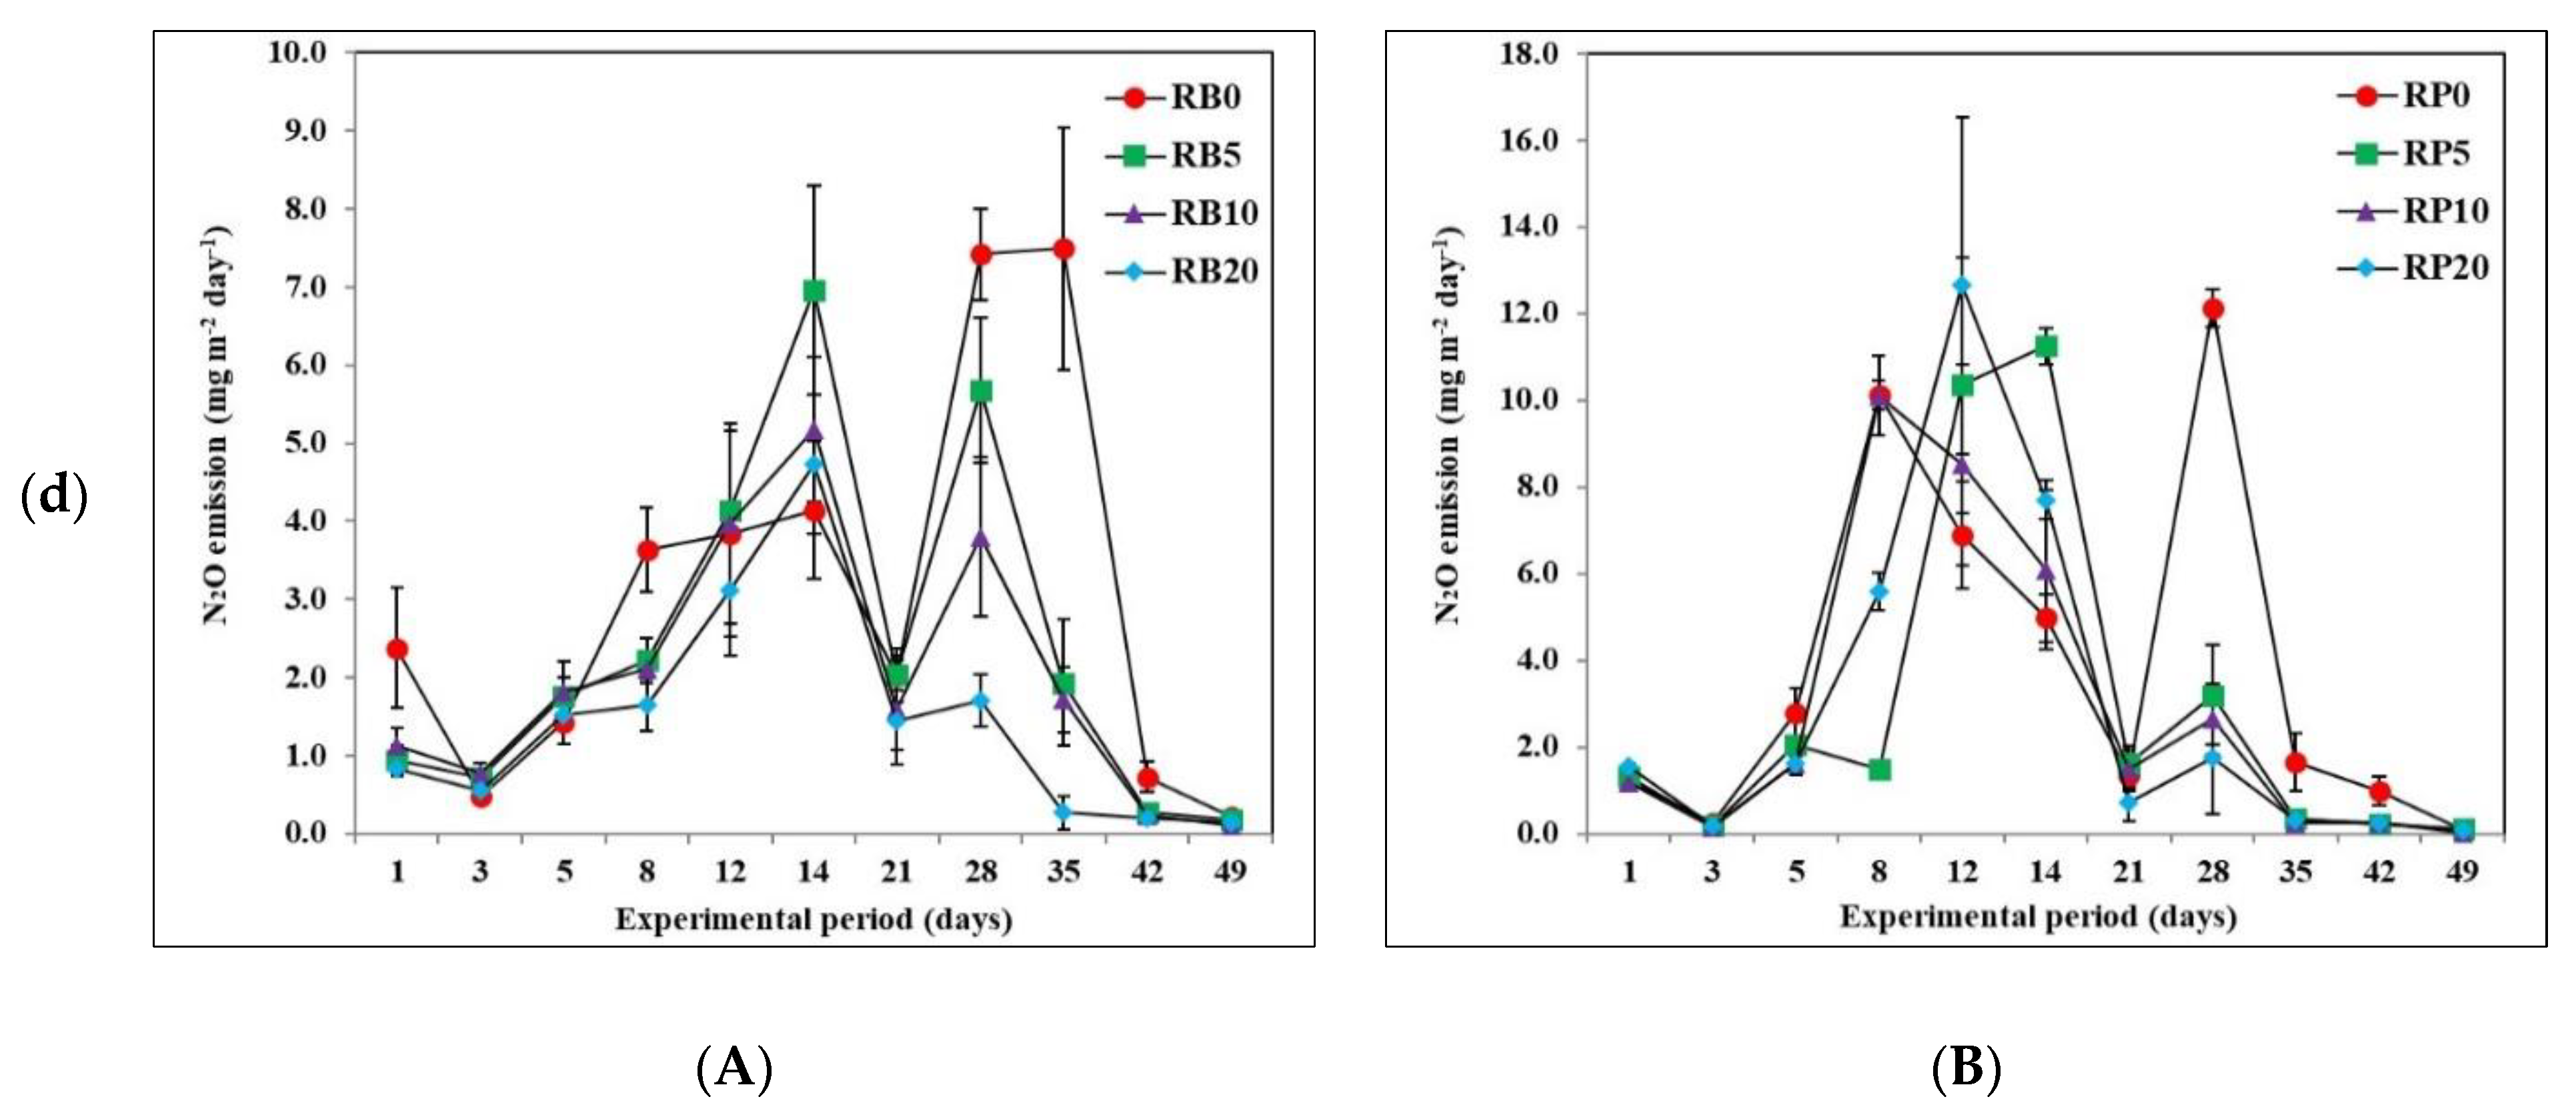
As a result of the analysis of N2O emissions according to biochar feedstock, N2O emissions indicated a significant difference between biochar feedstocks. N2O emission was lower than that in the control group in all soils to which BB was applied, but N2O emissions increased in upland and greenhouse soils treated with PB biochar than in the control group (Figure 1).
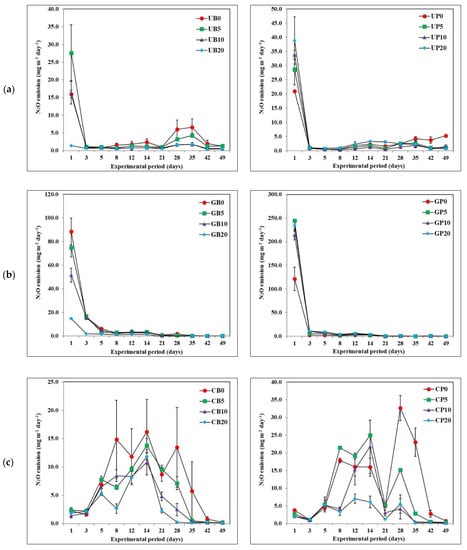
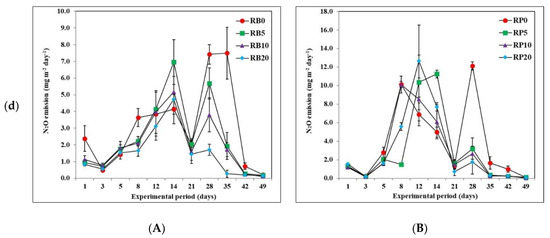
Figure 1.
N2O emission according to soil characteristics under incubation conditions during the 49 days. The error bars represent standard errors (n = 3). (a): upland, (b): greenhouse, (c): converted land, (d): reclaimed land. (A): barley straw biochar, (B): poultry manure biochar.
3.3. Cumulative N2O Emission
As a result of the analysis, there was a significant difference between cumulative N2O emissions and soil. The cumulative N2O emission from reclaimed land soil was the lowest, with 60.5 ± 3.4-mg m−2, and highest in greenhouse soil, with 296.3 ± 11.2-mg m−2. The cumulative N2O emission from reclaimed soil was not significantly different from that of upland soil (70.4 ± 2.9-mg m−2), and was significantly lower than that of converted land soil (139.3 ± 9.8-mg m−2) (Table 4).
Analysis of the cumulative N2O emissions according to biochar type showed that BB significantly decreased N2O emissions compared with PB. The cumulative N2O emissions of soil where BB was applied was 94.9 ± 4.2 g m−2, and PB biochar were found to be 189.9 ± 8.3 g m−2. Approximately 200% more N2O was emitted from PB than from BB, a raw vegetable material (Figure 2).
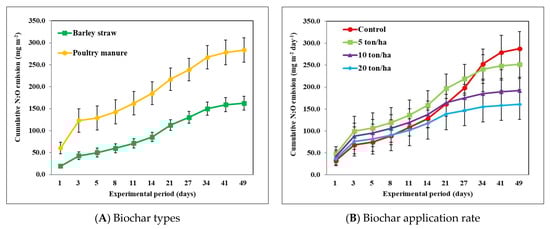
Figure 2.
Cumulative N2O emission according to biochar types and application rates under incubation conditions during the 49 days. The error bars represent standard errors (n = 3). (A): Cumulative N2O emission by biochar types on all soil characteristics. (B): Cumulative N2O emission by biochar types on all soil characteristics.
As a result of analyzing the cumulative N2O emission according to the biochar application rate, it was found that the N2O emission was significantly reduced in the group treated with 10 and 20-ton ha−1. No significant differences in the remaining 5 ton ha−1 treated groups were observed. N2O emissions were reduced by approximately 12.7% and 33.2% in the group treated with 10 and 20-ton ha−1 biochar, with 135.9 ± 9.2 and 114.9 ± 10.0-mg m−2, compared with 153.1 ± 9.3-mg m−2 of the control group only treated with fertilizer (Figure 2).
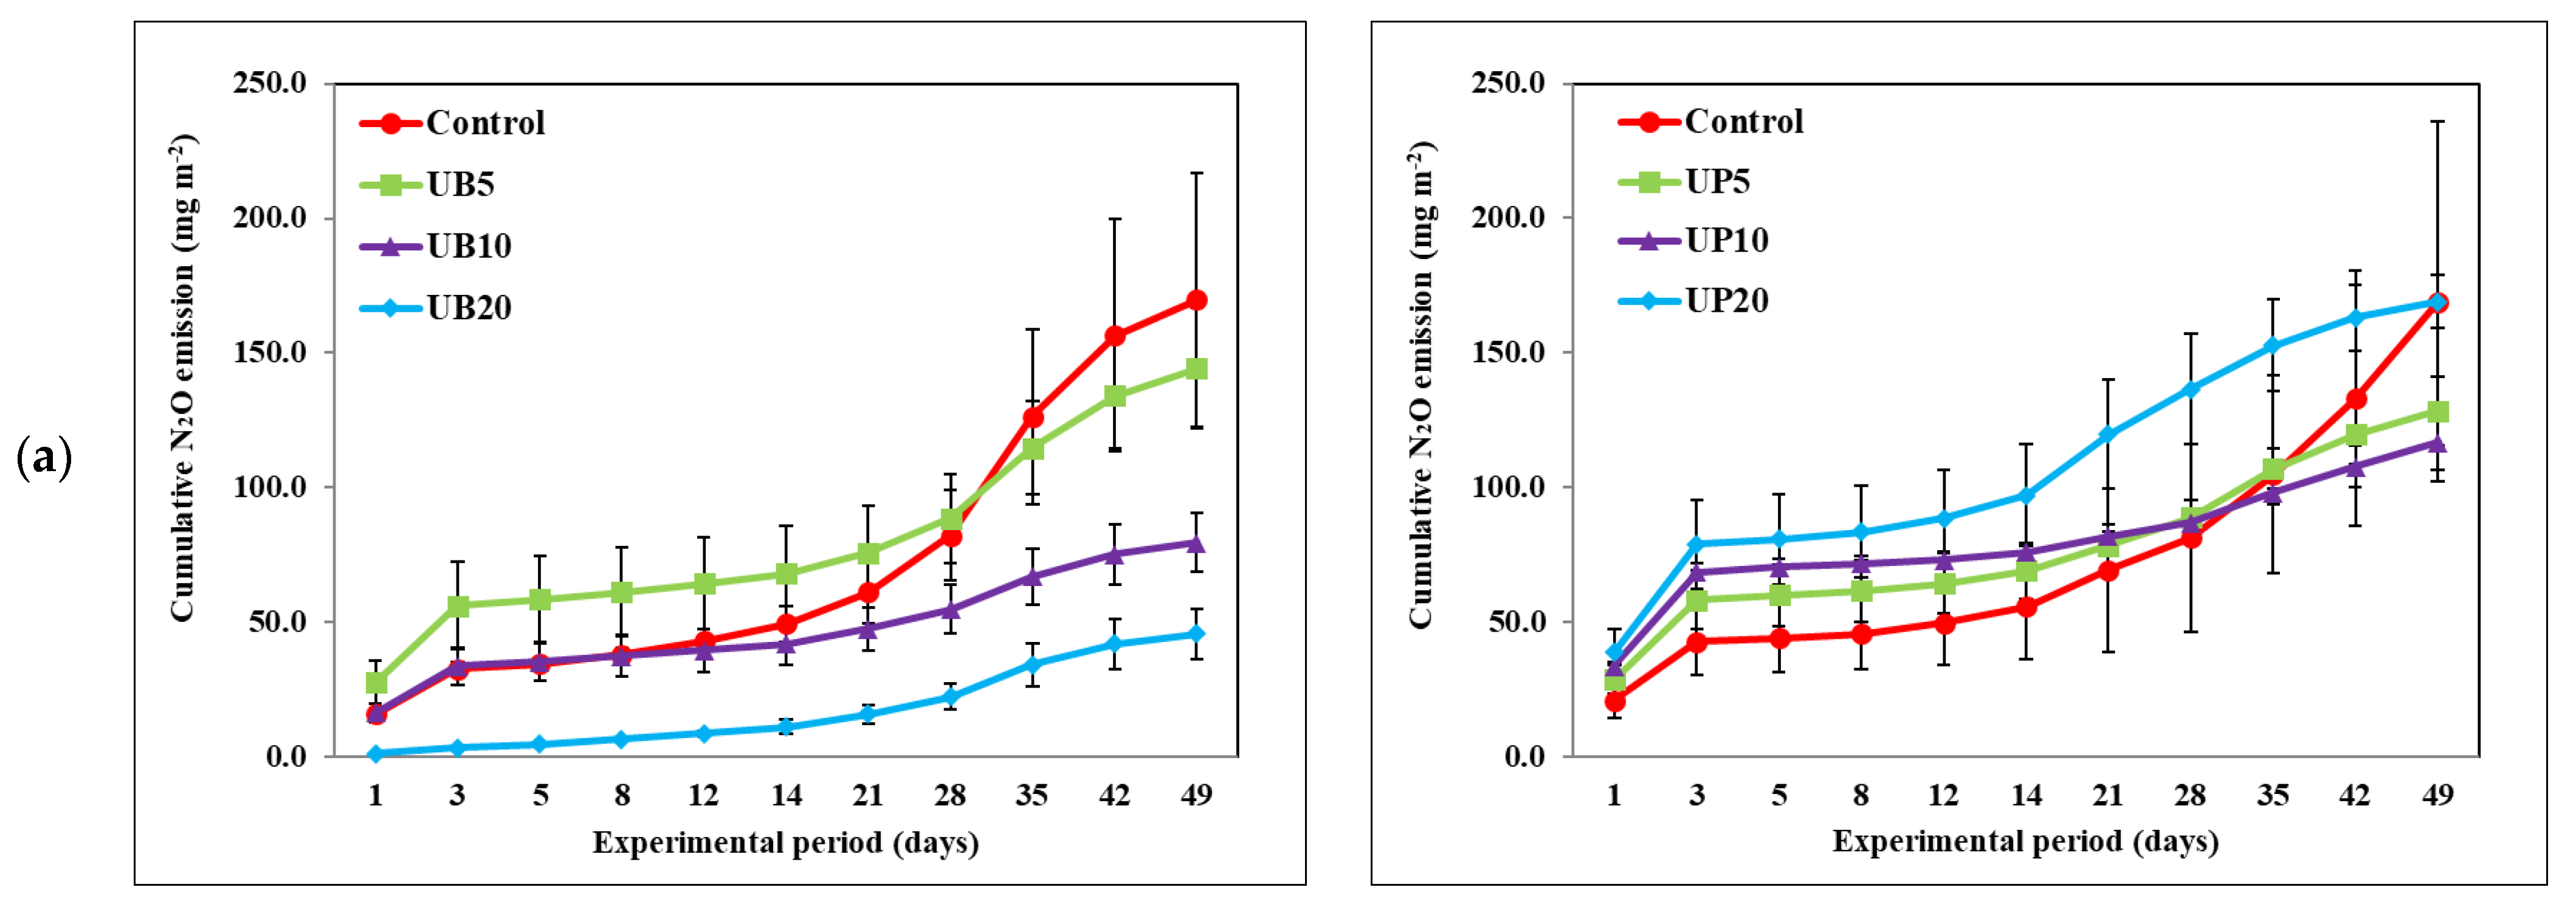
As a result of analyzing the cumulative N2O emissions after applying biochar in upland soil, N2O emissions significantly decreased in the UB10 and UB20 treatment groups. No significant differences were observed in the UB5, UP5, UP10, and UP20 experimental groups. N2O emissions were reduced by 53.0% and 313.2% in UB10 and UB20, respectively, with 48.1 ± 3.9-mg m−2 and 17.8 ± 3.0-mg m−2, compared with the control group with 73.7 ± 10.6-mg m−2 (Figure 3).
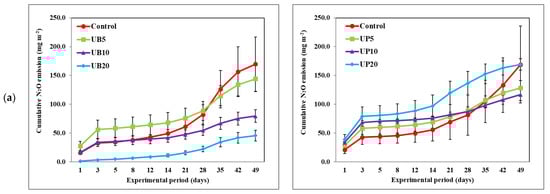
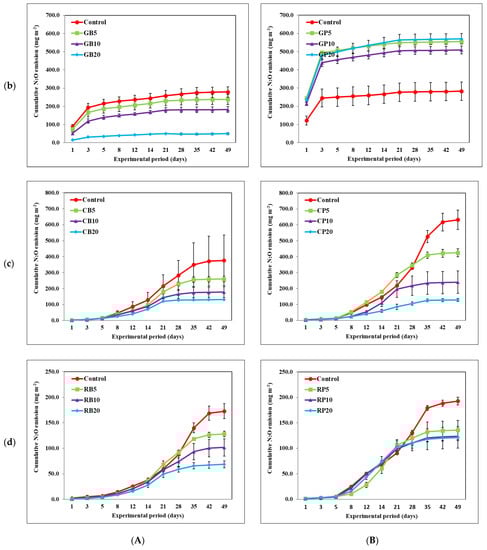
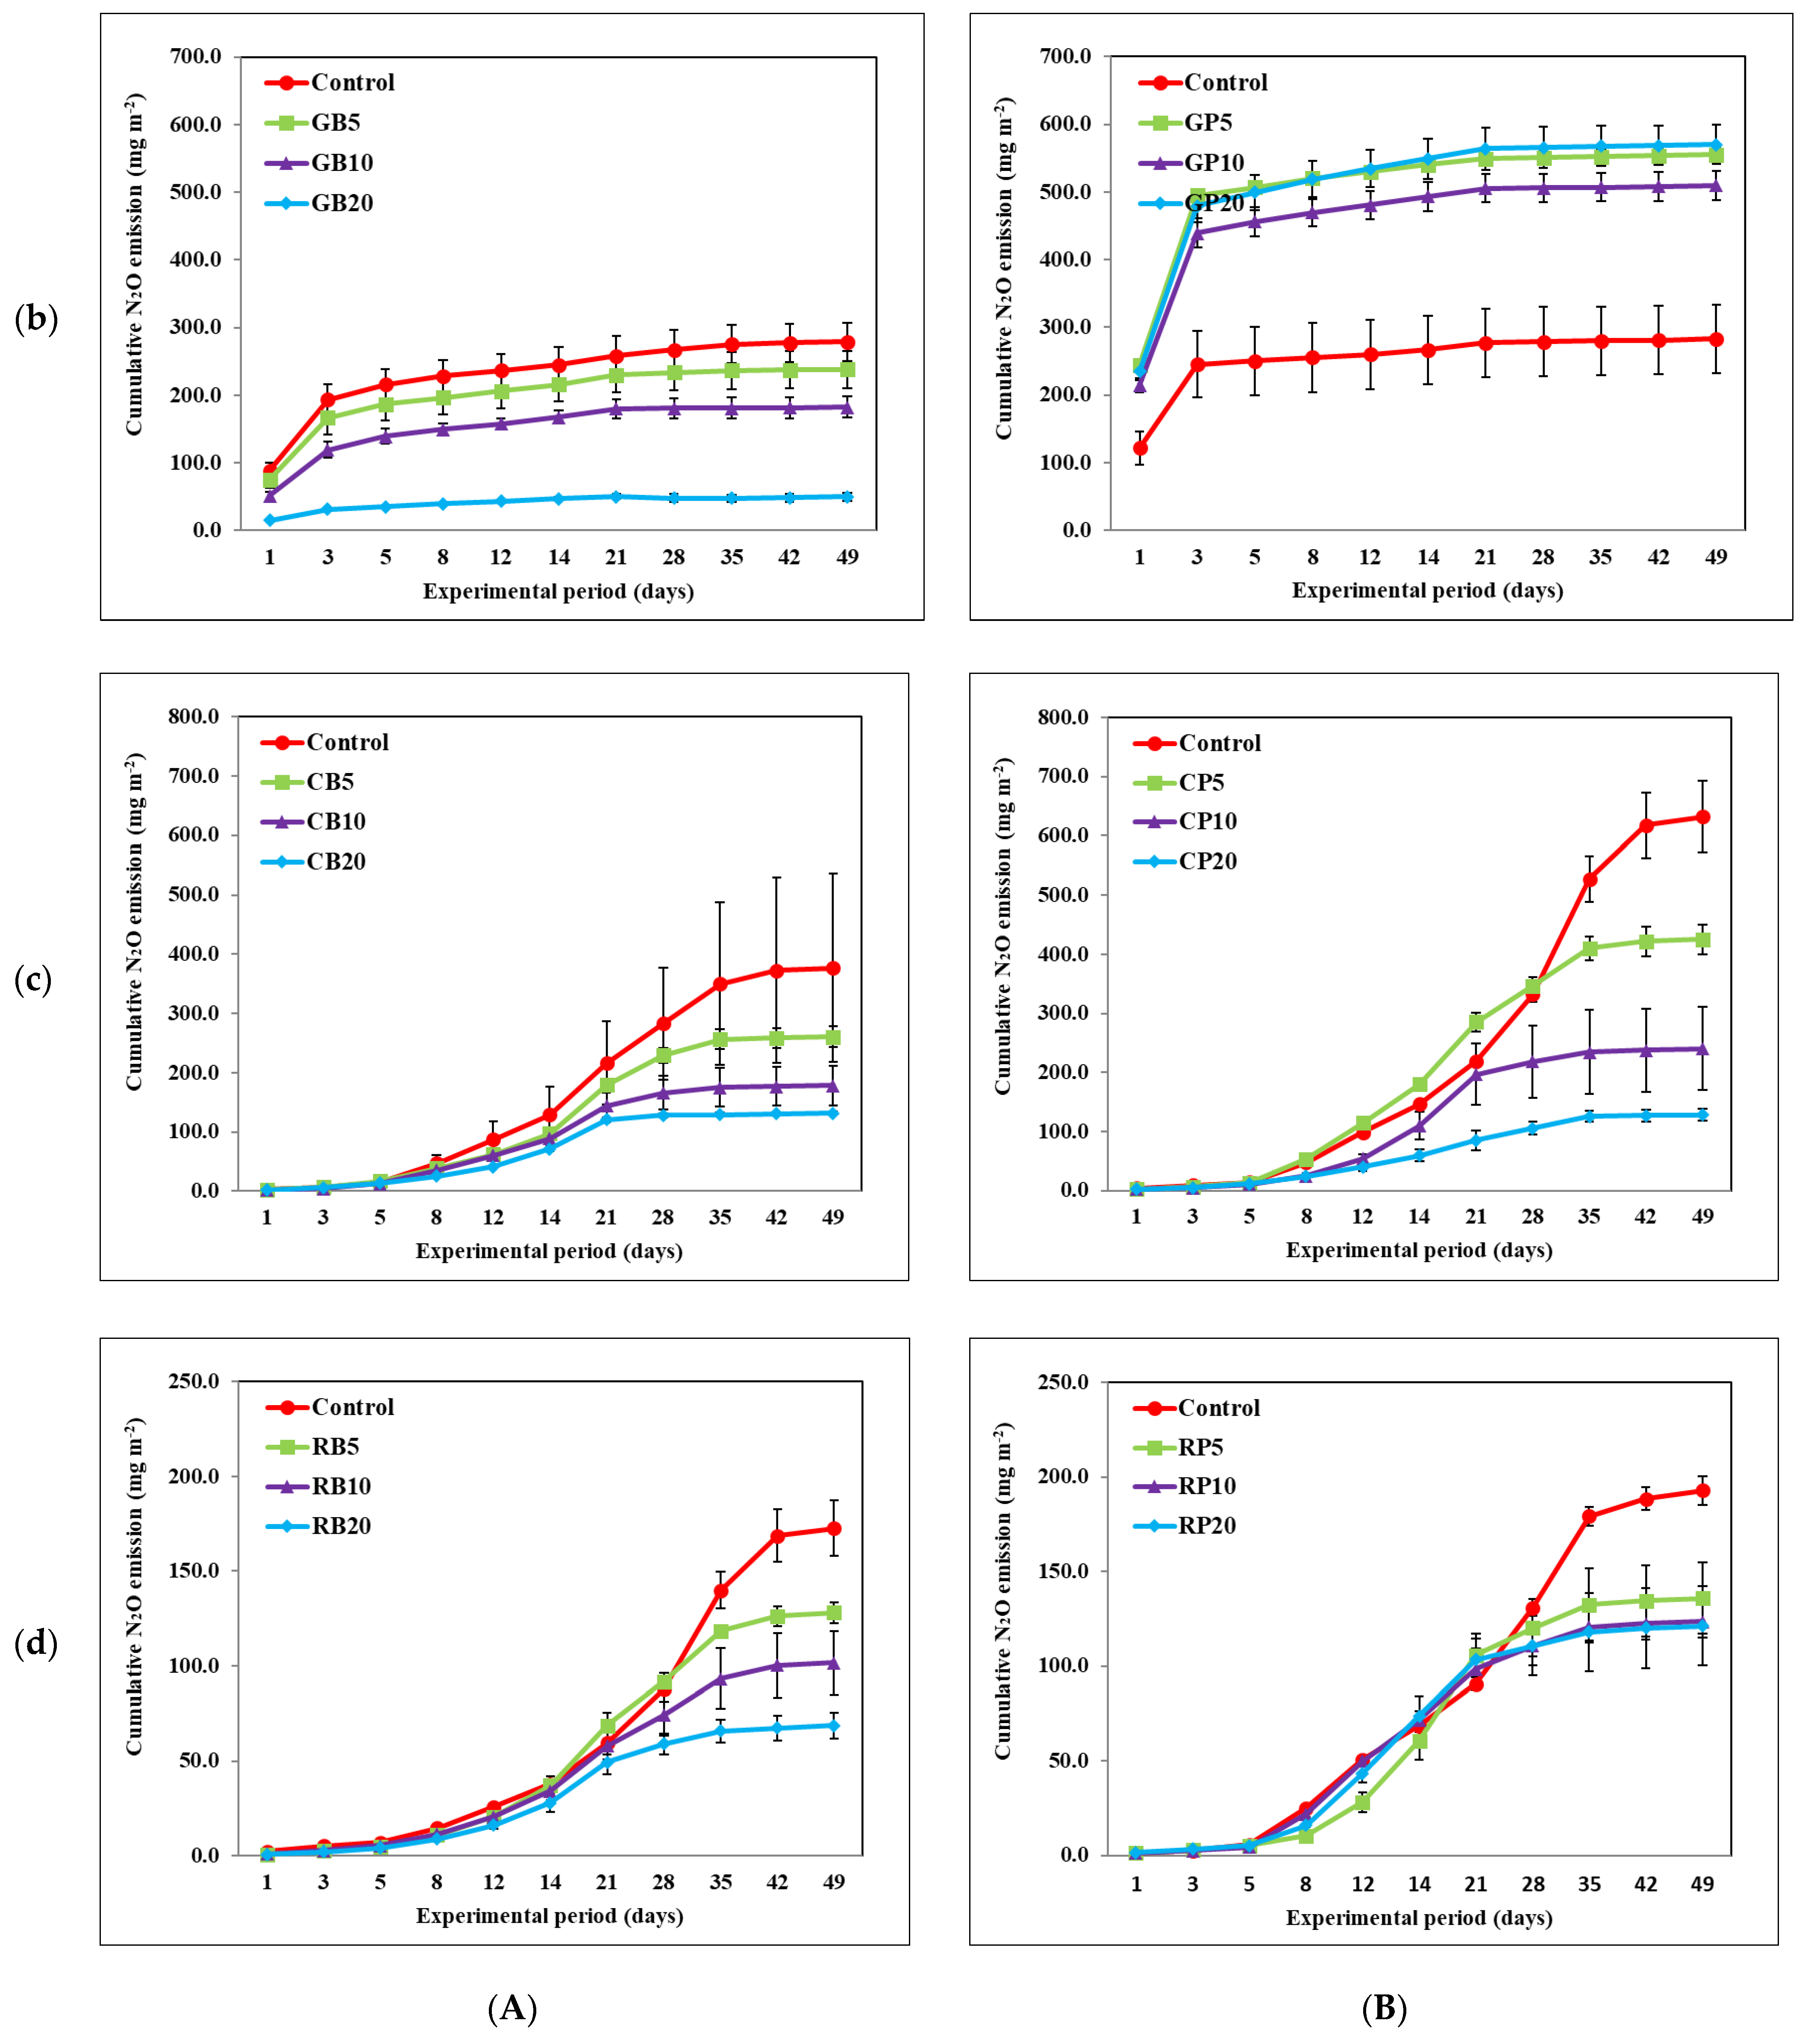
Figure 3.
Cumulative N2O emission on biochar types and application rates according to soil characteristics under incubation conditions during the 49 days. The error bars represent standard errors (n = 3). (a): upland, (b): greenhouse, (c): converted land, (d): reclaimed land. (A) barley straw biochar, (B) poultry manure biochar.
In the greenhouses, N2O emissions were significantly reduced in the GB5, GB10, and GB20 experimental groups, but significantly increased in the GP5, GP10, and GP20 experimental groups. Compared with the control group, cumulative N2O emission in GB5, GB10, and GB20 was reduced by 15.5%, 51.7%, and 465.1%, respectively, but increased by 50.0%, 45.0%, and 50.5% in GP5, GP10, and GP20, respectively (Figure 3).
In the converted land soil, N2O emissions were significantly decreased in the CB10, CB20, CP10, and CP20 experimental groups and reduced by 80.6%, 136.3%, 98.3%, and 270.6% in the CB10, CB20, CP10, and CP20 treatment groups, respectively, compared with the control group. There was no significant difference between the BP5, CP10 experimental, and control groups. Overall, N2O emission was observed to reduce in proportion to the biochar application rate.
In the reclaimed land soil, no significant difference was found in the experimental and control groups. However, there was no difference from the control group before the 28th day, but after the 28th day, a difference in the biochar-treated group was observed. N2O emissions were reduced by 18.2%, 43.3%, and 94.5% in RB5, RB10, and RB20, respectively, on the 49th day. N2O emissions decreased in RP5, RP10, and RP20, and were reduced by 27.0%, 28.7%, and 30.6%, respectively (Figure 3).
4. Discussion
4.1. Effect of Biochar Application on SOC Improvement
Biochar has a positive effect on soil improvement in agricultural land [33,55,56], but the effect depends on the biochar material [11,29,57], input amount [27,31,58], manufacturing temperature [9,31], and soil conditions [12,15,59]. Nonetheless, when degradation-resistant biochar is added to the soil, SOC increases [44,47] and it induces the recovery of physical, chemical, and biological qualities of the soil [33,38,39]. Among the different effects of biochar, its ability to store carbon and decrease greenhouse emissions is the most highly evaluated [40]. The direct input of organic substances, such as rice straw into the soil, significantly increases C emissions because of biodegradation [60].
However, because biochar is a non-degradable material unaffected by biodegradation [41,42], soil carbon increases but does not influence emissions because it does not decompose [58,61]. Considering the carbon loss rate of crop biomass during the biochar conversion process, about 20% of the carbon contained in the initial biomass can be sequestered into the soil [10]. Long-term application of black carbon stimulated enhanced stabilization of non-pyrogenic soil. Organic carbon can increase soil carbon stocks by 30–60% [62].
Yang et al. [47] reported additional SOC of 18.0–37.2% in cornfields through the application of biochar, and Ma et al. [26] reported a 31.5% SOC stock effect through biochar application in double cropping (rice–wheat) agricultural land. Wang et al. [44] reported a SOC increase effect of 21.6% by applying biochar to paddy soil. The SOC significantly increased to 33.2% compared to the control in this study. SOC was higher in the U and G than in the C and R, but the increase ratio was higher in the C and R. The carbon ratio distinctly increased in C and R soil with initial low carbon content. The highest SOC increase rate was 47.2% in C soil and 44.6% in R soil. This is because biochar applications are more effective in poor soil than in fertile soil [27]. Lee et al. [63] reported that when the initial carbon content of the test soil was low, the increase rate of soil carbon compared with the amount of carbon input from biochar was high. This is similar to the results from this study. Thus, in poor soil, the effect of biochar on carbon storage and nitrous oxide emission suppression was high. However, it is considered that it is necessary to select the initial soil condition and the type of biochar for fertile soil.
4.2. Effect of Biochar Application on N2O Emission
Biochar directly and indirectly influence processes such as the uptake of low mineral nitrogen and soil denitrification to reduce N2O emissions [64,65,66]. This study indicated that sections treated with BB decreased N2O emissions by 74.5% compared with those treated using PB. When biochar with a high C/N ratio is injected into the soil, nitrogen is stabilized, thus suppressing N2O emission from the soil [25]. The C/N ratios of BB and PB were 17.3 and 13.8, respectively. It is thought that BB had lower N2O emissions than PB because its C/N ratio was 25.4% higher. C/N ratios of BB were lower than 27.3 for maize straw biochar [14] and 46.6 for rice straw biochar [15], and 72.1 for wheat straw biochar [13]. However, it was higher than pig manure biochar and poultry manure biochar [11,12,67]. Liu et al. [68] discovered that N2O emission was higher in manure biochar than that in straw biochar through a meta-analysis, and some studies even discovered that it increased N2O emissions. Biochar may change N2O emissions by affecting ammonia oxidation and denitrification, determined by the amount of biochar injected into the soil [69]. Similar to these studies, it was found that areas treated with PB had N2O emissions that were 74.5% higher than those in areas treated with BB. These results suggest that the difference arises based on the features of the raw materials in the vegetable matter and animal matter. Thus, vegetable biochar is expected to be applicable on site, but animal biochar is thought to require further research on the amount of application.
In this study, N2O emissions of the soil decreased in proportion to the biochar application rate. Results were the same as in a meta-analysis study by Liu et al. [68], which found that an increase in biochar input accelerated the soil N2O emission reductions. Cayuela et al. [35] reported that N2O emissions were decreased according to the increasing biochar application rate. In this study too, it was analyzed that the N2O emission decreased by 33.2% in the 20-ton ha−1 treatment group that received the most biochar. This result was lower than in the study by Zhang et al. [2] showing that N2O emissions were reduced by an average of 38% with biochar input. It was also lower than the study by Shaukat et al. [18], which reported a 49–61% reduction in N2O in an experiment comparing a control group treated with nitrogen only and a group treated with nitrogen and Biochar. However, it was higher than the meta-analysis results of Liu et al. [68], and Han et al. [70], 32% and 32.6%. These results are similar to those of our study.
However, no significant difference was observed in upland soils between those treated with PB and the control group, and in the case of greenhouse soil, N2O emissions increased significantly according to the PB application rate (Figure 3). These results can be explained in two aspects. The first reason might have been caused by its higher N concentration, which potentially increased N substrate availability for nitrification or denitrification processes that release N2O [40]. Indeed, biochar derived from Poultry manure was higher in T-N, ranging approximately 2 times than BB (Table 2). Consequently, PB with more N was incorporated into G soils that have more N concentration after amendment, which would increase soil N availability and hence soil N2O emissions [9]. Subedi et al. [12] reported that poultry manure biochar made at high temperature emitted about 20% more N2O than the control, and poultry biochar made at low temperature increased by approximately 100–200% more. In addition, Subedi et al. [12] reported that poultry manure biochar increased N2O emission about 15–253% than the control. The second reason may be related to microorganisms and soil moisture. Soil N2O emissions are primarily a microbial process, and soil moisture is a significant factor in N2O emissions as it regulates oxygen availability to soil microbes [39,66,71]. Biochar could increase soil N2O emissions when the soil has abundant inorganic nitrogen and relatively low moisture [<80% WFPS (water-filled pore space), the main route of N2O emissions] [35,72,73]. Therefore, upland soil and greenhouse soil had higher NH4+ and NO3− contents than other soils, and it is believed that experiment conditions of <80% WFPS contributed to these results. Moreover, the input of PB, which has a high nitrogen content unlike BB, accelerated nitrification, and the input of biochar increased the amount of N2O emissions. This study shows that both biochar type and the amount of nitrogen in the soil were important factors affecting soil N2O emission [29,74].
Shi et al. [65] proposed a reduction in the number of ammonia-oxidizing archaea (AOA, also called ammonia-oxidizing bacteria, AOB) and an increase in the number of nitrous oxide reductase genes (nosZ) due to biochar input as the primary reason for the reduction in soil N2O emissions. In contrast, Li et al. [75] reported that biochar is associated with high activity of AOA and AOB in the nitrification process, and Liu et al. [68] reported that biochar increases the population of AOA and AOB and contributes to biochemical reactions. Although N2O has been shown to be produced primarily by nitrification and denitrification processes, deposition of N can improve N2O emissions by providing more N to nitrification or denitrification communities [9]. Although data on the actual rates of soil nitrification and denitrification are increasing, little is known regarding N2 emissions and N2O production and consumption at different scales in the field [35]. These results suggest that additional research on biochar in the soil ecosystem’s nitrogen cycle network and the microbiome is necessary [30].
5. Conclusions
This study attempted to evaluate the effect of improving SOC and reducing N2O emissions according to the soil characteristics that can be used for agricultural land. As a result, we found that the effect of biochar was higher in poor soil than in fertile soil. In addition, the effect of plant-based biochar was higher than that of animal-manure-based biochar. The effect of biochar was higher in carbon storage and nitrous oxide emissions in poor soil than in fertile soil. Barley straw biochar increased SOC in all soils and reduced N2O emissions. However, poultry biochar accelerated N2O emissions in upland or greenhouse cultivation land, which is fertile soil. The application of biochar improves SOC regardless of fertility and biochar type, but can increase N2O emissions depending on soil fertility and biochar type. Therefore, to store carbon within the soil in agricultural land and decrease N2O emissions, rather than uniformly applying biochar to all soil characteristics, biochar application considering soil characteristics, biochar feedstock, and the application rates is advised. Long-term observational studies using biochar to inhibit atmospheric N2O emissions and positively influence crop production are necessary for sustainable agriculture in the future.
Author Contributions
Conceptualization, S.-I.L.; Data curation, J.-M.L.; Formal analysis, J.-M.L.; Investigation, J.-M.L., D.-G.P. and S.-I.L.; Methodology, S.-I.L.; Project administration, S.-I.L.; Supervision, S.-I.L.; Validation, S.-I.L.; Visualization, J.-M.L.; Writing—original draft, J.-M.L.; Writing—review & editing, J.-M.L., S.-S.K., E.-J.C., H.-S.G., H.-S.L. and S.-I.L. All authors have read and agreed to the published version of the manuscript.
Funding
This work was carried out with the support of the “Cooperative Research Program for Agriculture Science and Technology Development (PJ01556801)”, Rural Development Administration, Republic of Korea.
Institutional Review Board Statement
Not applicable.
Informed Consent Statement
Not applicable.
Data Availability Statement
Not applicable.
Conflicts of Interest
The authors declare that they have no conflict of interest.
References
- Lal, R. Soil Health and Carbon Management. Food Energy Secur. 2016, 5, 212–222. [Google Scholar] [CrossRef]
- Zhang, Q.; Xiao, J.; Xue, J.; Zhang, L. Quantifying the Effects of Biochar Application on Greenhouse Gas Emissions from Agricultural Soils: A Global Meta-Analysis. Sustainability 2020, 12, 3436. [Google Scholar] [CrossRef]
- IPCC. Climate Change 2014: Synthesis Report. Contribution of Working Groups I, II and III to the Fifth Assessment Report of the Intergovernmental Panel on Climate Change; IPCC: Geneva, Switzerland, 2014; ISBN 9789291691432. [Google Scholar]
- Cui, Z.; Wang, G.; Yue, S.; Wu, L.; Zhang, W.; Zhang, F.; Chen, X. Closing the N Use Efficiency Gap to Achieve Food and Environmental Security. Environ. Sci. Technol. 2014, 48, 5780–5787. [Google Scholar] [CrossRef] [PubMed]
- Case, S.D.C.; McNamara, N.P.; Reay, D.S.; Stott, A.W.; Grant, H.K.; Whitaker, J. Biochar Suppresses N2O Emissions While Maintaining N Availability in a Sandy Loam Soil. Soil Biol. Biochem. 2015, 81, 178–185. [Google Scholar] [CrossRef]
- Revell, L.E.; Tummon, F.; Salawitch, R.J.; Stenke, A.; Peter, T. The Changing Ozone Depletion Potential of N2O in a Future Climate. Geophys. Res. Lett. 2015, 42, 10047–10055. [Google Scholar] [CrossRef]
- IPCC. Climate Change 2013: The Physical Science Basis, Contribution of Working Groups I to the Fifth Assessment Report of the Intergovernmental Panel on Climate Change; IPCC: Geneva, Switzerland, 2013. [Google Scholar]
- Deng, B.L.; Wang, S.L.; Xu, X.T.; Wang, H.; Hu, D.N.; Guo, X.M.; Shi, Q.H.; Siemann, E.; Zhang, L. Effects of Biochar and Dicyandiamide Combination on Nitrous Oxide Emissions from Camellia Oleifera Field Soil. Environ. Sci. Pollut. Res. 2019, 26, 4070–4077. [Google Scholar] [CrossRef]
- Deng, B.; Zheng, L.; Ma, Y.; Zhang, L.; Liu, X.; Zhang, X.; Zhang, W.; Huang, W.; Hu, X.; Guo, X.; et al. Effects of Mixing Biochar on Soil N2O, CO2, and CH4 Emissions after Prescribed Fire in Alpine Meadows of Wugong Mountain, China. J. Soils Sediments 2020, 20, 3062–3072. [Google Scholar] [CrossRef]
- Lehmann, J. A Handful of Carbon. Nature 2007, 447, 143–144. [Google Scholar] [CrossRef]
- Ginebra, M.; Muñoz, C.; Calvelo-Pereira, R.; Doussoulin, M.; Zagal, E. Biochar Impacts on Soil Chemical Properties, Greenhouse Gas Emissions and Forage Productivity: A Field Experiment. Sci. Total Environ. 2022, 806, 150465. [Google Scholar] [CrossRef]
- Subedi, R.; Taupe, N.; Pelissetti, S.; Petruzzelli, L.; Bertora, C.; Leahy, J.J.; Grignani, C. Greenhouse Gas Emissions and Soil Properties following Amendment with Manure-Derived Biochars: Influence of Pyrolysis Temperature and Feedstock Type. J. Environ. Manag. 2016, 166, 73–83. [Google Scholar] [CrossRef]
- Wu, Y.; Li, Y.; Wang, H.; Wang, Z.; Fu, X.; Shen, J.; Wang, Y.; Liu, X.; Meng, L.; Wu, J. Response of N2O Emissions to Biochar Amendment on a Tea Field Soil in Subtropical Central China: A Three-Year Field Experiment. Agric. Ecosyst. Environ. 2021, 318, 107473. [Google Scholar] [CrossRef]
- Xie, Y.; Yang, C.; Ma, E.; Tan, H.; Zhu, T.; Müller, C. Biochar Stimulates NH4+ Turnover While Decreasing NO3− Production and N2O Emissions in Soils under Long-Term Vegetable Cultivation. Sci. Total Environ. 2020, 737, 140266. [Google Scholar] [CrossRef] [PubMed]
- He, L.; Zhao, X.; Wang, S.; Xing, G. The Effects of Rice-Straw Biochar Addition on Nitrification Activity and Nitrous Oxide Emissions in Two Oxisols. Soil Tillage Res. 2016, 164, 52–62. [Google Scholar] [CrossRef]
- Zaw Oo, A.; Sudo, S.; Thuzar Win, K.; Shibata, A.; Gonai, T. Influence of Pruning Waste Biochar and Oyster Shell on N 2 O and CO 2 Emissions from Japanese Pear Orchard Soil. Heliyon 2018, 4, 568. [Google Scholar] [CrossRef]
- Toma, Y.; Higuchi, T.; Nagata, O.; Kato, Y.; Izumiya, T.; Oomori, S.; Ueno, H. Efflux of Soil Nitrous Oxide from Applied Fertilizer Containing Organic Materials in Citrus Unshiu Field in Southwestern Japan. Agriculture 2017, 7, 10. [Google Scholar] [CrossRef]
- Shaukat, M.; Samoy-Pascual, K.; Maas, E.D.V.L.; Ahmad, A. Simultaneous Effects of Biochar and Nitrogen Fertilization on Nitrous Oxide and Methane Emissions from Paddy Rice. J. Environ. Manag. 2019, 248, 109242. [Google Scholar] [CrossRef]
- Grutzmacher, P.; Puga, A.P.; Bibar, M.P.S.; Coscione, A.R.; Packer, A.P.; de Andrade, C.A. Carbon Stability and Mitigation of Fertilizer Induced N2O Emissions in Soil Amended with Biochar. Sci. Total Environ. 2018, 625, 1459–1466. [Google Scholar] [CrossRef]
- Liu, J.; Shen, J.; Li, Y.; Su, Y.; Ge, T.; Jones, D.L.; Wu, J. Effects of Biochar Amendment on the Net Greenhouse Gas Emission and Greenhouse Gas Intensity in a Chinese Double Rice Cropping System. Eur. J. Soil Biol. 2014, 65, 30–39. [Google Scholar] [CrossRef]
- Carvalho, M.T.M.; Madari, B.E.; Bastiaans, L.; van Oort, P.A.J.; Leal, W.G.O.; Heinemann, A.B.; da Silva, M.A.S.; Maia, A.H.N.; Parsons, D.; Meinke, H. Properties of a Clay Soil from 1.5 to 3.5 Years after Biochar Application and the Impact on Rice Yield. Geoderma 2016, 276, 7–18. [Google Scholar] [CrossRef]
- Lin, X.W.; Xie, Z.B.; Zheng, J.Y.; Liu, Q.; Bei, Q.; Zhu, J.G. Effects of Biochar Application on Greenhouse Gas Emissions, Carbon Sequestration and Crop Growth in Coastal Saline Soil. Eur. J. Soil Sci. 2015, 66, 329–338. [Google Scholar] [CrossRef]
- Liu, J.; Qiu, H.; Wang, C.; Shen, J.; Zhang, W.; Cai, J.; Tang, H.; Wu, J. Effects of Biochar Amendment on Greenhouse Gas Emission in Two Paddy Soils with Different Textures. Paddy Water Environ. 2021, 19, 87–98. [Google Scholar] [CrossRef]
- Li, J.; Kwak, J.H.; Chang, S.X.; Gong, X.; An, Z.; Chen, J. Greenhouse Gas Emissions from Forest Soils Reduced by Straw Biochar and Nitrapyrin Applications. Land 2021, 10, 189. [Google Scholar] [CrossRef]
- Hu, Z.; Towfiqul Islam, A.R.M.; Chen, S.; Hu, B.; Shen, S.; Wu, Y.; Wang, Y. Effects of Warming and Reduced Precipitation on Soil Respiration and N2O Fluxes from Winter Wheat-Soybean Cropping Systems. Geoderma 2019, 337, 956–964. [Google Scholar] [CrossRef]
- Ma, Y.; Liu, D.L.; Schwenke, G.; Yang, B. The Global Warming Potential of Straw-Return Can Be Reduced by Application of Straw-Decomposing Microbial Inoculants and Biochar in Rice-Wheat Production Systems. Environ. Pollut. 2019, 252, 835–845. [Google Scholar] [CrossRef] [PubMed]
- Hailegnaw, N.S.; Mercl, F.; Pračke, K.; Száková, J.; Tlustoš, P. Mutual Relationships of Biochar and Soil PH, CEC, and Exchangeable Base Cations in a Model Laboratory Experiment. J. Soils Sediments 2019, 19, 2405–2416. [Google Scholar] [CrossRef]
- Bednik, M.; Medyńska-Juraszek, A.; Ćwieląg-Piasecka, I. Effect of Six Different Feedstocks on Biochar’s Properties and Expected Stability. Agronomy 2022, 12, 1525. [Google Scholar] [CrossRef]
- Oo, A.Z.; Sudo, S.; Akiyama, H.; Win, K.T.; Shibata, A.; Yamamoto, A.; Sano, T.; Hirono, Y. Effect of Dolomite and Biochar Addition on N2O and CO2 Emissions from Acidic Tea Field Soil. PLoS ONE 2018, 13, e0192235. [Google Scholar] [CrossRef]
- Martos, S.; Mattana, S.; Ribas, A.; Albanell, E.; Domene, X. Biochar Application as a Win-Win Strategy to Mitigate Soil Nitrate Pollution without Compromising Crop Yields: A Case Study in a Mediterranean Calcareous Soil. J. Soils Sediments 2020, 20, 220–233. [Google Scholar] [CrossRef]
- Han, L.; Zhang, B.; Chen, L.; Feng, Y.; Yang, Y.; Sun, K. Impact of Biochar Amendment on Soil Aggregation Varied with Incubation Duration and Biochar Pyrolysis Temperature. Biochar 2021, 3, 339–347. [Google Scholar] [CrossRef]
- Omondi, M.O.; Xia, X.; Nahayo, A.; Liu, X.; Korai, P.K.; Pan, G. Quantification of Biochar Effects on Soil Hydrological Properties Using Meta-Analysis of Literature Data. Geoderma 2016, 274, 28–34. [Google Scholar] [CrossRef]
- Nguyen, T.T.N.; Xu, C.Y.; Tahmasbian, I.; Che, R.; Xu, Z.; Zhou, X.; Wallace, H.M.; Bai, S.H. Effects of Biochar on Soil Available Inorganic Nitrogen: A Review and Meta-Analysis. Geoderma 2017, 288, 79–96. [Google Scholar] [CrossRef]
- Shakoor, A.; Arif, M.S.; Shahzad, S.M.; Farooq, T.H.; Ashraf, F.; Altaf, M.M.; Ahmed, W.; Tufail, M.A.; Ashraf, M. Does Biochar Accelerate the Mitigation of Greenhouse Gaseous Emissions from Agricultural Soil?—A Global Meta-Analysis. Environ. Res. 2021, 202, 111789. [Google Scholar] [CrossRef] [PubMed]
- Cayuela, M.L.; van Zwieten, L.; Singh, B.P.; Jeffery, S.; Roig, A.; Sánchez-Monedero, M.A. Biochar’s Role in Mitigating Soil Nitrous Oxide Emissions: A Review and Meta-Analysis. Agric. Ecosyst. Environ. 2014, 191, 5–16. [Google Scholar] [CrossRef]
- Ok, J.-H.; Cho, J.-L.; Lee, B.-M.; An, N.-H.; Shin, J.-H. Monitoring for Change of Soil Characteristics by Repeated Organic Supply of Comport and Green Manures in Newly Reclaimed Organic Upland Field. Korean J. Org. Agric. 2015, 23, 813–827. [Google Scholar] [CrossRef]
- Cai, F.; van Vliet, J.; Verburg, P.H.; Pu, L. Land Use Change and Farmer Behavior in Reclaimed Land in the Middle Jiangsu Coast, China. Ocean Coast. Manag. 2017, 137, 107–117. [Google Scholar] [CrossRef]
- Gross, C.D.; Bork, E.W.; Carlyle, C.N.; Chang, S.X. Biochar and Its Manure-Based Feedstock Have Divergent Effects on Soil Organic Carbon and Greenhouse Gas Emissions in Croplands. Sci. Total Environ. 2022, 806, 151337. [Google Scholar] [CrossRef]
- Tarin, M.W.K.; Khaliq, M.A.; Fan, L.; Xie, D.; Tayyab, M.; Chen, L.; He, T.; Rong, J.; Zheng, Y. Divergent Consequences of Different Biochar Amendments on Carbon Dioxide (CO2) and Nitrous Oxide (N2O) Emissions from the Red Soil. Sci. Total Environ. 2021, 754, 141935. [Google Scholar] [CrossRef]
- Deng, B.; Yuan, X.; Siemann, E.; Wang, S.; Fang, H.; Wang, B.; Gao, Y.; Shad, N.; Liu, X.; Zhang, W.; et al. Feedstock Particle Size and Pyrolysis Temperature Regulate Effects of Biochar on Soil Nitrous Oxide and Carbon Dioxide Emissions. Waste Manag. 2021, 120, 33–40. [Google Scholar] [CrossRef]
- Yin, X.; Peñuelas, J.; Sardans, J.; Xu, X.; Chen, Y.; Fang, Y.; Wu, L.; Singh, B.P.; Tavakkoli, E.; Wang, W. Effects of Nitrogen-Enriched Biochar on Rice Growth and Yield, Iron Dynamics, and Soil Carbon Storage and Emissions: A Tool to Improve Sustainable Rice Cultivation. Environ. Pollut. 2021, 287, 117565. [Google Scholar] [CrossRef] [PubMed]
- Farrar, M.B.; Wallace, H.M.; Xu, C.-Y.; Joseph, S.; Dunn, P.K.; Thu, T.; Nguyen, N.; Hosseini Bai, S. Biochar Co-Applied with Organic Amendments Increased Soil-Plant Potassium and Root Biomass but Not Crop Yield. J. Soils Sediments 2021, 21, 784–798. [Google Scholar] [CrossRef]
- Park, J.-H.; Kang, S.-W.; Yun, J.-J.; Lee, S.-G.; Kim, S.-H.; Beak, J.-S.; Cho, J.-S. Effects of Co-Application of Biochars and Composts on Lettuce Growth. Korean J. Soil Sci. Fertil. 2021, 54, 151–160. [Google Scholar] [CrossRef]
- Wang, M.; Wang, C.; Lan, X.; Abid, A.A.; Xu, X.; Singla, A.; Sardans, J.; Llusià, J.; Peñuelas, J.; Wang, W. Coupled Steel Slag and Biochar Amendment Correlated with Higher Methanotrophic Abundance and Lower CH4 Emission in Subtropical Paddies. Environ. Geochem. Health 2020, 42, 483–497. [Google Scholar] [CrossRef] [PubMed]
- Mawof, A.; Prasher, S.O.; Anderson, E.C.; Nzediegwu, C. Barley Straw Biochar and Compost Affect Heavy Metal Transport in Soil and Uptake by Potatoes Grown under Wastewater Irrigation. Sustainability 2022, 14, 5665. [Google Scholar] [CrossRef]
- Wang, H.; Dai, J.; Chen, H.; Wang, F.; Zhu, Y.; Liu, J.; Zhou, B.; Yuan, R. Adsorption of Phosphate by Mg/Fe-Doped Wheat Straw Biochars Optimized Using Response Surface Methodology: Mechanisms and Application in Domestic Sewage. Environ. Eng. Res. 2022, 28, 210602. [Google Scholar] [CrossRef]
- Yang, W.; Feng, G.; Miles, D.; Gao, L.; Jia, Y.; Li, C.; Qu, Z. Science of the Total Environment Impact of Biochar on Greenhouse Gas Emissions and Soil Carbon Sequestration in Corn Grown under Drip Irrigation with Mulching. Sci. Total Environ. 2020, 729, 138752. [Google Scholar] [CrossRef]
- Van Zwieten, L.; Kimber, S.; Downie, A.; Morris, S.; Petty, S.; Rust, J.; Chan, K.Y. A Glasshouse Study on the Interaction of Low Mineral Ash Biochar with Nitrogen in a Sandy Soil. Aust. J. Soil Res. 2010, 48, 569–576. [Google Scholar] [CrossRef]
- NIAS. Prescription of Fertilizer Use by Crop; National Institute of Agricultural Sciences: Wanju, Korea, 2019; ISBN 978-89-480-6048-5 93520.
- Zeng, W.Z.; Xu, C.; Wu, J.W.; Huang, J.S.; Ma, T. Effect of Salinity on Soil Respiration and Nitrogen Dynamics. Ecol. Chem. Eng. S 2013, 20, 519–530. [Google Scholar] [CrossRef]
- Maucieri, C.; Zhang, Y.; McDaniel, M.D.; Borin, M.; Adams, M.A. Short-Term Effects of Biochar and Salinity on Soil Greenhouse Gas Emissions from a Semi-Arid Australian Soil after Re-Wetting. Geoderma 2017, 307, 267–276. [Google Scholar] [CrossRef]
- Haque, M.M.; Kim, S.Y.; Ali, M.A.; Kim, P.J. Contribution of Greenhouse Gas Emissions during Cropping and Fallow Seasons on Total Global Warming Potential in Mono-Rice Paddy Soils. Plant Soil 2015, 387, 251–264. [Google Scholar] [CrossRef]
- RDA (Rural Development Administration). Agricultural Science and Technology Research and Analysis Criteria; Sambo Printing Company: Des Plaines, IL, USA, 2012; ISBN 978-89-480-1649-9.
- Lee, H.I.; Yim, Y.; Bae, K.; Park, S. Role of Electron Acceptor-Donor on Elemental Mercury Removal Using Nano-Silver-Plated Activated Carbons Complexes. Compos. Res. 2018, 31, 76–81. [Google Scholar] [CrossRef]
- Chen, K.; Peng, J.; Li, J.; Yang, Q.; Zhan, X.; Liu, N.; Han, X. Stabilization of Soil Aggregate and Organic Matter under the Application of Three Organic Resources and Biochar-Based Compound Fertilizer. J. Soils Sediments 2020, 20, 3633–3643. [Google Scholar] [CrossRef]
- Bai, S.H.; Reverchon, F.; Xu, C.Y.; Xu, Z.; Blumfield, T.J.; Zhao, H.; Van Zwieten, L.; Wallace, H.M. Wood Biochar Increases Nitrogen Retention in Field Settings Mainly through Abiotic Processes. Soil Biol. Biochem. 2015, 90, 232–240. [Google Scholar] [CrossRef]
- Liu, Y.; Lu, H.; Yang, S.; Wang, Y. Impacts of Biochar Addition on Rice Yield and Soil Properties in a Cold Waterlogged Paddy for Two Crop Seasons. Field Crop. Res. 2016, 191, 161–167. [Google Scholar] [CrossRef]
- Amoakwah, E.; Arthur, E.; Frimpong, K.A.; Parikh, S.J.; Islam, R. Soil Organic Carbon Storage and Quality Are Impacted by Corn Cob Biochar Application on a Tropical Sandy Loam. J. Soils Sediments 2020, 20, 1960–1969. [Google Scholar] [CrossRef]
- Nguyen, B.T.; Phan, B.T.; Nguyen, T.X.; Nguyen, V.N.; Van Tran, T.; Bach, Q.V. Contrastive Nutrient Leaching from Two Differently Textured Paddy Soils as Influenced by Biochar Addition. J. Soils Sediments 2020, 20, 297–307. [Google Scholar] [CrossRef]
- Zhang, Y.; Hou, W.; Chi, M.; Sun, Y.; An, J.; Yu, N.; Zou, H. Simulating the Effects of Soil Temperature and Soil Moisture on CO2 and CH4 Emissions in Rice Straw-Enriched Paddy Soil. Catena 2020, 194, 104677. [Google Scholar] [CrossRef]
- Duan, M.; Liu, G.; Zhou, B.; Chen, X.; Wang, Q.; Zhu, H.; Li, Z. Effects of Modified Biochar on Water and Salt Distribution and Water-Stable Macro-Aggregates in Saline-Alkaline Soil. J. Soils Sediments 2021, 21, 2192–2202. [Google Scholar] [CrossRef]
- Woolf, D.; Lehmann, J. Modelling the Long-Term Response to Positive and Negative Priming of Soil Organic Carbon by Black Carbon. Biogeochemistry 2012, 111, 83–95. [Google Scholar] [CrossRef]
- Lee, S.-I.; Kang, S.-S.; Choi, E.-J.; Gwon, H.-S.; Lee, H.-S.; Lee, J.-M.; Lim, S.-S.; Choi, W.-J. Soil Carbon Storage in Upland Soils by Biochar Application in East Asia. Korean J. Environ. Agric. 2021, 40, 219–230. [Google Scholar] [CrossRef]
- Uchida, Y.; Moriizumi, M.; Shimotsuma, M. Effects of Rice Husk Biochar and Soil Moisture on the Accumulation of Organic and Inorganic Nitrogen and Nitrous Oxide Emissions during the Decomposition of Hairy Vetch (Vicia Villosa) Mulch. Soil Sci. Plant Nutr. 2019, 65, 409–418. [Google Scholar] [CrossRef]
- Shi, Y.; Liu, X.; Zhang, Q.; Li, G.; Wang, P. Soil & Tillage Research Biochar Rather than Organic Fertilizer Mitigated the Global Warming Potential in a Saline-Alkali Farmland. Soil Tillage Res. 2022, 219, 105337. [Google Scholar] [CrossRef]
- Dai, Z.; Xiong, X.; Zhu, H.; Xu, H.; Leng, P.; Li, J.; Tang, C.; Xu, J. Association of Biochar Properties with Changes in Soil Bacterial, Fungal and Fauna Communities and Nutrient Cycling Processes. Biochar 2021, 3, 239–254. [Google Scholar] [CrossRef]
- Van Zwieten, L.; Singh, B.P.; Kimber, S.W.L.; Murphy, D.V.; Macdonald, L.M.; Rust, J.; Morris, S. An Incubation Study Investigating the Mechanisms That Impact N2O Flux from Soil Following Biochar Application. Agric. Ecosyst. Environ. 2014, 191, 53–62. [Google Scholar] [CrossRef]
- Liu, Q.; Zhang, Y.; Liu, B.; Amonette, J.E.; Lin, Z.; Liu, G.; Ambus, P.; Xie, Z. How Does Biochar Influence Soil N Cycle? A Meta-Analysis. Plant Soil 2018, 426, 211–225. [Google Scholar] [CrossRef]
- Liu, L.; Shen, G.; Sun, M.; Cao, X.; Shang, G.; Chen, P. Effect of Biochar on Nitrous Oxide Emission and Its Potential Mechanisms. J. Air Waste Manag. Assoc. 2014, 64, 894–902. [Google Scholar] [CrossRef] [PubMed]
- Han, J.; Zhang, A.; Kang, Y.; Han, J.; Yang, B.; Hussain, Q.; Wang, X.; Zhang, M.; Khan, M.A. Biochar Promotes Soil Organic Carbon Sequestration and Reduces Net Global Warming Potential in Apple Orchard: A Two-Year Study in the Loess Plateau of China. Sci. Total Environ. 2022, 803, 150035. [Google Scholar] [CrossRef] [PubMed]
- Cao, H.; Jia, M.; Xun, M.; Wang, X.; Chen, K.; Yang, H. Nitrogen Transformation and Microbial Community Structure Varied in Apple Rhizosphere and Rhizoplane Soils under Biochar Amendment. J. Soils Sediments 2021, 21, 853–868. [Google Scholar] [CrossRef]
- Qian, J.; Liu, J.; Wang, P.; Wang, C.; Hu, J.; Li, K.; Lu, B.; Tian, X.; Guan, W. Effects of Riparian Land Use Changes on Soil Aggregates and Organic Carbon. Ecol. Eng. 2018, 112, 82–88. [Google Scholar] [CrossRef]
- Oo, A.Z.; Gonai, T.; Sudo, S.; Win, K.T.; Shibata, A. Surface Application of Fertilizers and Residue Biochar on N2O Emission from Japanese Pear Orchard Soil. Plant Soil Environ. 2018, 64, 597–604. [Google Scholar] [CrossRef]
- Feng, Z.; Zhu, L. Impact of Biochar on Soil N2O Emissions under Different Biochar-Carbon/Fertilizer-Nitrogen Ratios at a Constant Moisture Condition on a Silt Loam Soil. Sci. Total Environ. 2017, 584, 776–782. [Google Scholar] [CrossRef]
- Li, J.; Wang, S.; Luo, J.; Zhang, L.; Wu, Z.; Lindsey, S. Effects of Biochar and 3,4-Dimethylpyrazole Phosphate (DMPP) on Soil Ammonia-Oxidizing Bacteria and NosZ-N2O Reducers in the Mitigation of N2O Emissions from Paddy Soils. J. Soils Sediments 2021, 21, 1089–1098. [Google Scholar] [CrossRef]

Publisher’s Note: MDPI stays neutral with regard to jurisdictional claims in published maps and institutional affiliations. |
© 2022 by the authors. Licensee MDPI, Basel, Switzerland. This article is an open access article distributed under the terms and conditions of the Creative Commons Attribution (CC BY) license (https://creativecommons.org/licenses/by/4.0/).