Article

Global Sensitivity Analysis of Key Parameters in the APSIMX-Sugarcane Model to Evaluate Nitrate Balance via Treed Gaussian Process

by
R. H. K. Rathnappriya
1,*,
Kazuhito Sakai
1,2,*,
Ken Okamoto
3,
Sho Kimura
1,2,
Tomokazu Haraguchi
1,4,
Tamotsu Nakandakari
1,2,
Hideki Setouchi
1,2 and
W. B. M. A. C. Bandara
1
1
United Graduate School of Agricultural Sciences, Kagoshima University, 1-21-24 Korimoto, Kagoshima-shi, Kagoshima 890-0065, Japan
2
Faculty of Agriculture, University of the Ryukyus, 1 Senbaru, Nishihara-cho, Okinawa 903-0213, Japan
3
Tropical Agriculture Research Front, Japan International Research Center for Agricultural Sciences, 1091-1 Maezato-Kawarabaru, Ishigaki, Okinawa 907-0002, Japan
4
Faculty of Agriculture, Saga University, 1 Honjo-machi, Saga 840-8502, Japan
*
Authors to whom correspondence should be addressed.
Agronomy 2022, 12(8), 1979; https://doi.org/10.3390/agronomy12081979
Submission received: 3 August 2022 / Revised: 15 August 2022 / Accepted: 18 August 2022 / Published: 22 August 2022

Abstract

:
Difficulties in direct monitoring of nitrate balance in agricultural fields reveal the importance of modeling and quantifying the affecting parameters on nitrate balance. We constructed meta-models for APSIMX-Sugarcane using the treed gaussian process and conducted a global sensitivity analysis for nitrate uptake and leaching under three conditions: (1) bare land (BL) to examine the influence of soil hydraulic characteristics, (2) N-free treatment under radiation use efficiency (RUE) ranges (i) 1.2–1.8 [N-free(a)] and (ii) 1.8–2.5 [N-free(b)], and (3) urea conditions to examine the influence of plant growth. Generated meta-models showed good accuracy (for all conditions: R2 > 0.70; NRMSE < 16%; AI > 0.90). The most influential parameters (sensitivity indices ≥ 0.02) were as follows: for leached NO3−N in BL: the parameter rerated to saturated flow-proportion of water between saturation and field capacity (SWCON) of all soil layers; for NO3 uptake and leached NO3−N in N-free(a) and urea: RUE of the phenological stage (PS) 3 (RUE3) and 4, tt_emerg_to_begcane, green_leaf_no, and y_n_conc_crit_leaf of PS 4 (NCL4); in N-free(b): RUE3, NCL4, and SWCON of soil layers 0–15 cm; 15–30 cm, which confirmed that influential parameters were depended on N-stress. The outcomes of this study are useful for enhancing the accuracy and efficiency of crop modeling.

1. Introduction

Sugarcane production in Japan is limited to the southwestern islands of Kagoshima and Okinawa Prefectures [1]. The sugarcane industry supports the local economy of Okinawa, as sugarcane is one of the major crops cultivated in the region. In Okinawa Prefecture, 190–270 kg/ha of N fertilizer per season is applied to sugarcane fields [2], but sugarcane’s N fertilizer recovery efficiency is 23–45% [3]. According to the research findings of Agata, Satake, and Tokuyama [4]; Nakanishi [5]; and Shuhei [6], nitrate leaching from sugarcane cultivation lands due to excessive application of chemical fertilizers is a major source of elevated nitrate levels in groundwater in Okinawa. However, it is difficult to monitor nitrate balance (nitrate uptake and leaching) on a large scale in commercial sugarcane cultivation lands. Modeling approaches are of great importance in evaluating the nitrate balance of a sugarcane crop system, quantifying the nitrate uptake, analyzing N use efficiency, and quantifying the potential nitrate leaching levels.
Process-based crop models are efficient and are widely used to explore the complex nature of interactions among plant growth, soil water, and plant nutrients under various management and environmental conditions; these models can be used to evaluate the nitrate balance of sugarcane crop systems and to quantitatively predict nitrate uptake and nitrate leaching by altering each of the important input parameters. There are several crop models that use for modeling sugarcane systems, including Agricultural Production Systems sIMulator Next Generation (APSIMX)-Sugarcane [7,8], MOSICAS [9], DSSAT-Canegro [10], QCANE [11] STICS-Sugarcane [12]. Among these models, APSIMX-Sugarcane, which contains comprehensive, interconnected biophysical and management models [7,8], is one of the most widely used platforms for the modeling and simulation of sugarcane production systems [13,14]. Moreover, the advantage of APSIMX is that users can write manager scripts using C# and arrange the model easily to describe precise field-level management decisions [7].
In order to run a successful simulation, the model needs to be supplied with parameters by which individual processes are accurately quantified and with data on local weather, soil conditions, and management practices [15]. As the parameters may vary and may have different complex distributions in various environmental conditions [16], the reliability of model simulations is directly impacted by the uncertainty, variability, and quality of the parameters [17]. Since the crop models are used to conduct simulations under various environmental conditions, it is essential to understand how the sensitivities and uncertainties of input parameters influence the output simulations [18]. Among a large number of input data and parameters used in agricultural simulation models, only a few parameters may strongly affect the output, while the others may have smaller effects [19]. Thus, in a crop model used to evaluate nitrate balance, it is important to identify the influence of different parameters on nitrate uptake and nitrate leaching to reduce the number of parameters required for calibration without affecting model accuracy. For instance, in the APSIMX-Sugarcane [7,8], the underlying physiological processes are controlled by several parameter categories: climate and soil parameters, cultivar-specific parameters, and plant and ratoon class parameters [20]. Therefore, in the application of APSIMX for modeling sugarcane farming systems, values of the above parameters and numerous data (i.e., meteorological, management data, etc.) should be added to the model to generate accurate simulations. Meteorological data, soil parameters, and management data can be determined from field observations and included in the model, whereas other data and parameters should be optimized to match the calculation results of the model with observations.
Sensitivity analysis (SA) is important in evaluating the effects of changes in input parameters on model performance by quantifying the influence of each parameter on model output variability [21]. The results of SA are useful for model calibration because SA identifies the most influential parameters [22,23]. Then, the lesser influential parameters can be fixed at default values [23,24]. Typical SA techniques can be divided into local SA (LSA) and global SA (GSA) [25]. LSA is a ‘one at a time’ approach and is used for linear models to identify how a single input parameter influences the model outputs while the other input parameters are constant [26]. GSA identifies the response of model outputs when all parameters are varied simultaneously within a given range [27]. Unlike LSA, GSA determines both the effect of each individual parameter on the output and the potential parameter interactions and non-linear responses [27].
GSA can be divided into the Morris design, meta-modeling, regression-based, and variance-based approaches [28]. Various methods are used to conduct GSA of process-based crop models, such as Sobol’ method [29,30], Fourier amplitude sensitivity test (FAST) [31], extended FAST (EFAST), and random-based-design FAST [32]. The GSA approach was adopted by several recent crop–soil modeling studies conducted by Wang et al. [33]; DeJonge et al. [34]; Kumar et al. [35]; Xu et al. [36]; Vanuytrecht, Raes, and Willems [23]; Liang et al. [27]; Varella, Guérif, and Buis [37]; Zhao, Bryan, and Song [38]; Qin et al. [39]. Wang et al. [33] conducted a GSA based on the EFAST method and evaluated the DSSAT CERES-Maize model for Summer Maize (Zea mays L.) under water and fertilizer stress and found that water stress showed a significant effect on GSA, whereas N stress had little effect on GSA. Another study on the CERES-Maize model by DeJonge et al. [34] used Morris’ one-at-a-time screening and Sobol’ variance-based methods to conduct GSA and uncertainty analysis (UA) under different irrigation treatments and concluded that under full irrigation conditions, crop cultivar parameters had a strong influence on output responses of the model; under limited irrigation condition, yield, leaf area index (LAI), and evapotranspiration were highly influenced by soil lower limit (LL) and drained upper limit (DUL). Kumar et al. [35] conducted a SA of the DSSAT CROPGRO-Cotton model for cotton under different growing environments and reported that the changes in maximum, minimum temperatures, and rainfall had influences on the cotton yield. The SA conducted by Xu et al. [36] on the CROPGRO-Canola model for rapeseed found that parameters that affect critical growth period durations, DUL, LL, and drainage rate were the most sensitive on outputs of days to flowering, maturity, yield, above-ground biomass, and maximum LAI. Liang et al. [27] performed a GSA and UA simulation of crop yield and nitrate leaching under various conditions of N and water management practices and concluded that parameter sensitivities and uncertainties in crop yield and nitrate leaching simulation were highly influenced by irrigation practice. Qin et al. [39] conducted SA and UA for the DeNitrification–DeComposition (DNDC) model and recommended Morris and Sobol’ estimated methods as the most reliable techniques for conducting SA and UA, respectively. Vanuytrecht, Raes, and Willems [23] used Morris screening and EFAST to conduct a GSA of the AquaCrop water productivity model for maize, rice, and winter wheat in different environmental conditions, and concluded that parameter sensitivity was influenced by soil and root parameters that determine water availability. Varella, Guérif, and Buis [37] computed GSA indices by EFAST and proposed GSA-based criteria for ranking the parameters based on the estimation quality and various configurations based on the ability to estimate the entire set of parameters. Zhao, Bryan, and Song [38] conducted SA and UA of the APSIM-Wheat model and concluded that cultivar parameters should be carefully calibrated for a new cultivar in a new environment to minimize cultivar-related uncertainty.
We conducted GSA to identify the parameters important for the optimization of APSIMX-Sugarcane output variability in the prediction of nitrate uptake and nitrate leaching via the treed gaussian process (TGP) method [40]. Yang et al. [28] compared four SA methods (i.e., FAST, Morris design, standardized regression coefficient, and TGP) in building energy assessment and recommended the TGP method due to its good accuracy and low computational cost. However, to the best of our knowledge, there is a lack of studies on analyzing the sensitivity of parameters in APSIMX-Sugarcane that influence nitrate balance. This emphasizes the need to identify the parameters that highly influence nitrate uptake and nitrate leaching under different fertilizer management practices. In this study, we set three conditions as treatments: (1) bare land (BL), (2) sugarcane crop with no N application (N-free), and (3) sugarcane crop plus urea application (urea). The purpose of the BL condition was to confirm the influence of soil hydraulic characteristics on nitrate balance in APSIMX-Sugarcane. As many parameters of soil hydraulic characteristics used in APSIMX-Sugarcane can be measured in sampled soil columns, this study used only the parameter rerated to saturated flow-proportion of water between saturation and field capacity (SWCON), which is difficult and costly to measure. We set the N-free and urea treatment conditions to confirm the influence of fertilizer on nitrate balance in APSIMX-Sugarcane. Under these conditions, soil parameters, as well as cultivar-specific and plant parameters that influence sugarcane growth [8], were used in the GSA. Cultivar-specific and plant parameters related to plant N content, development, and assimilate partitioning were selected based on the previous studies conducted on APSIMX-Sugarcane for modeling sugarcane systems [7,8], GSA [20,41,42], and optimization [43].

2. Materials and Methods
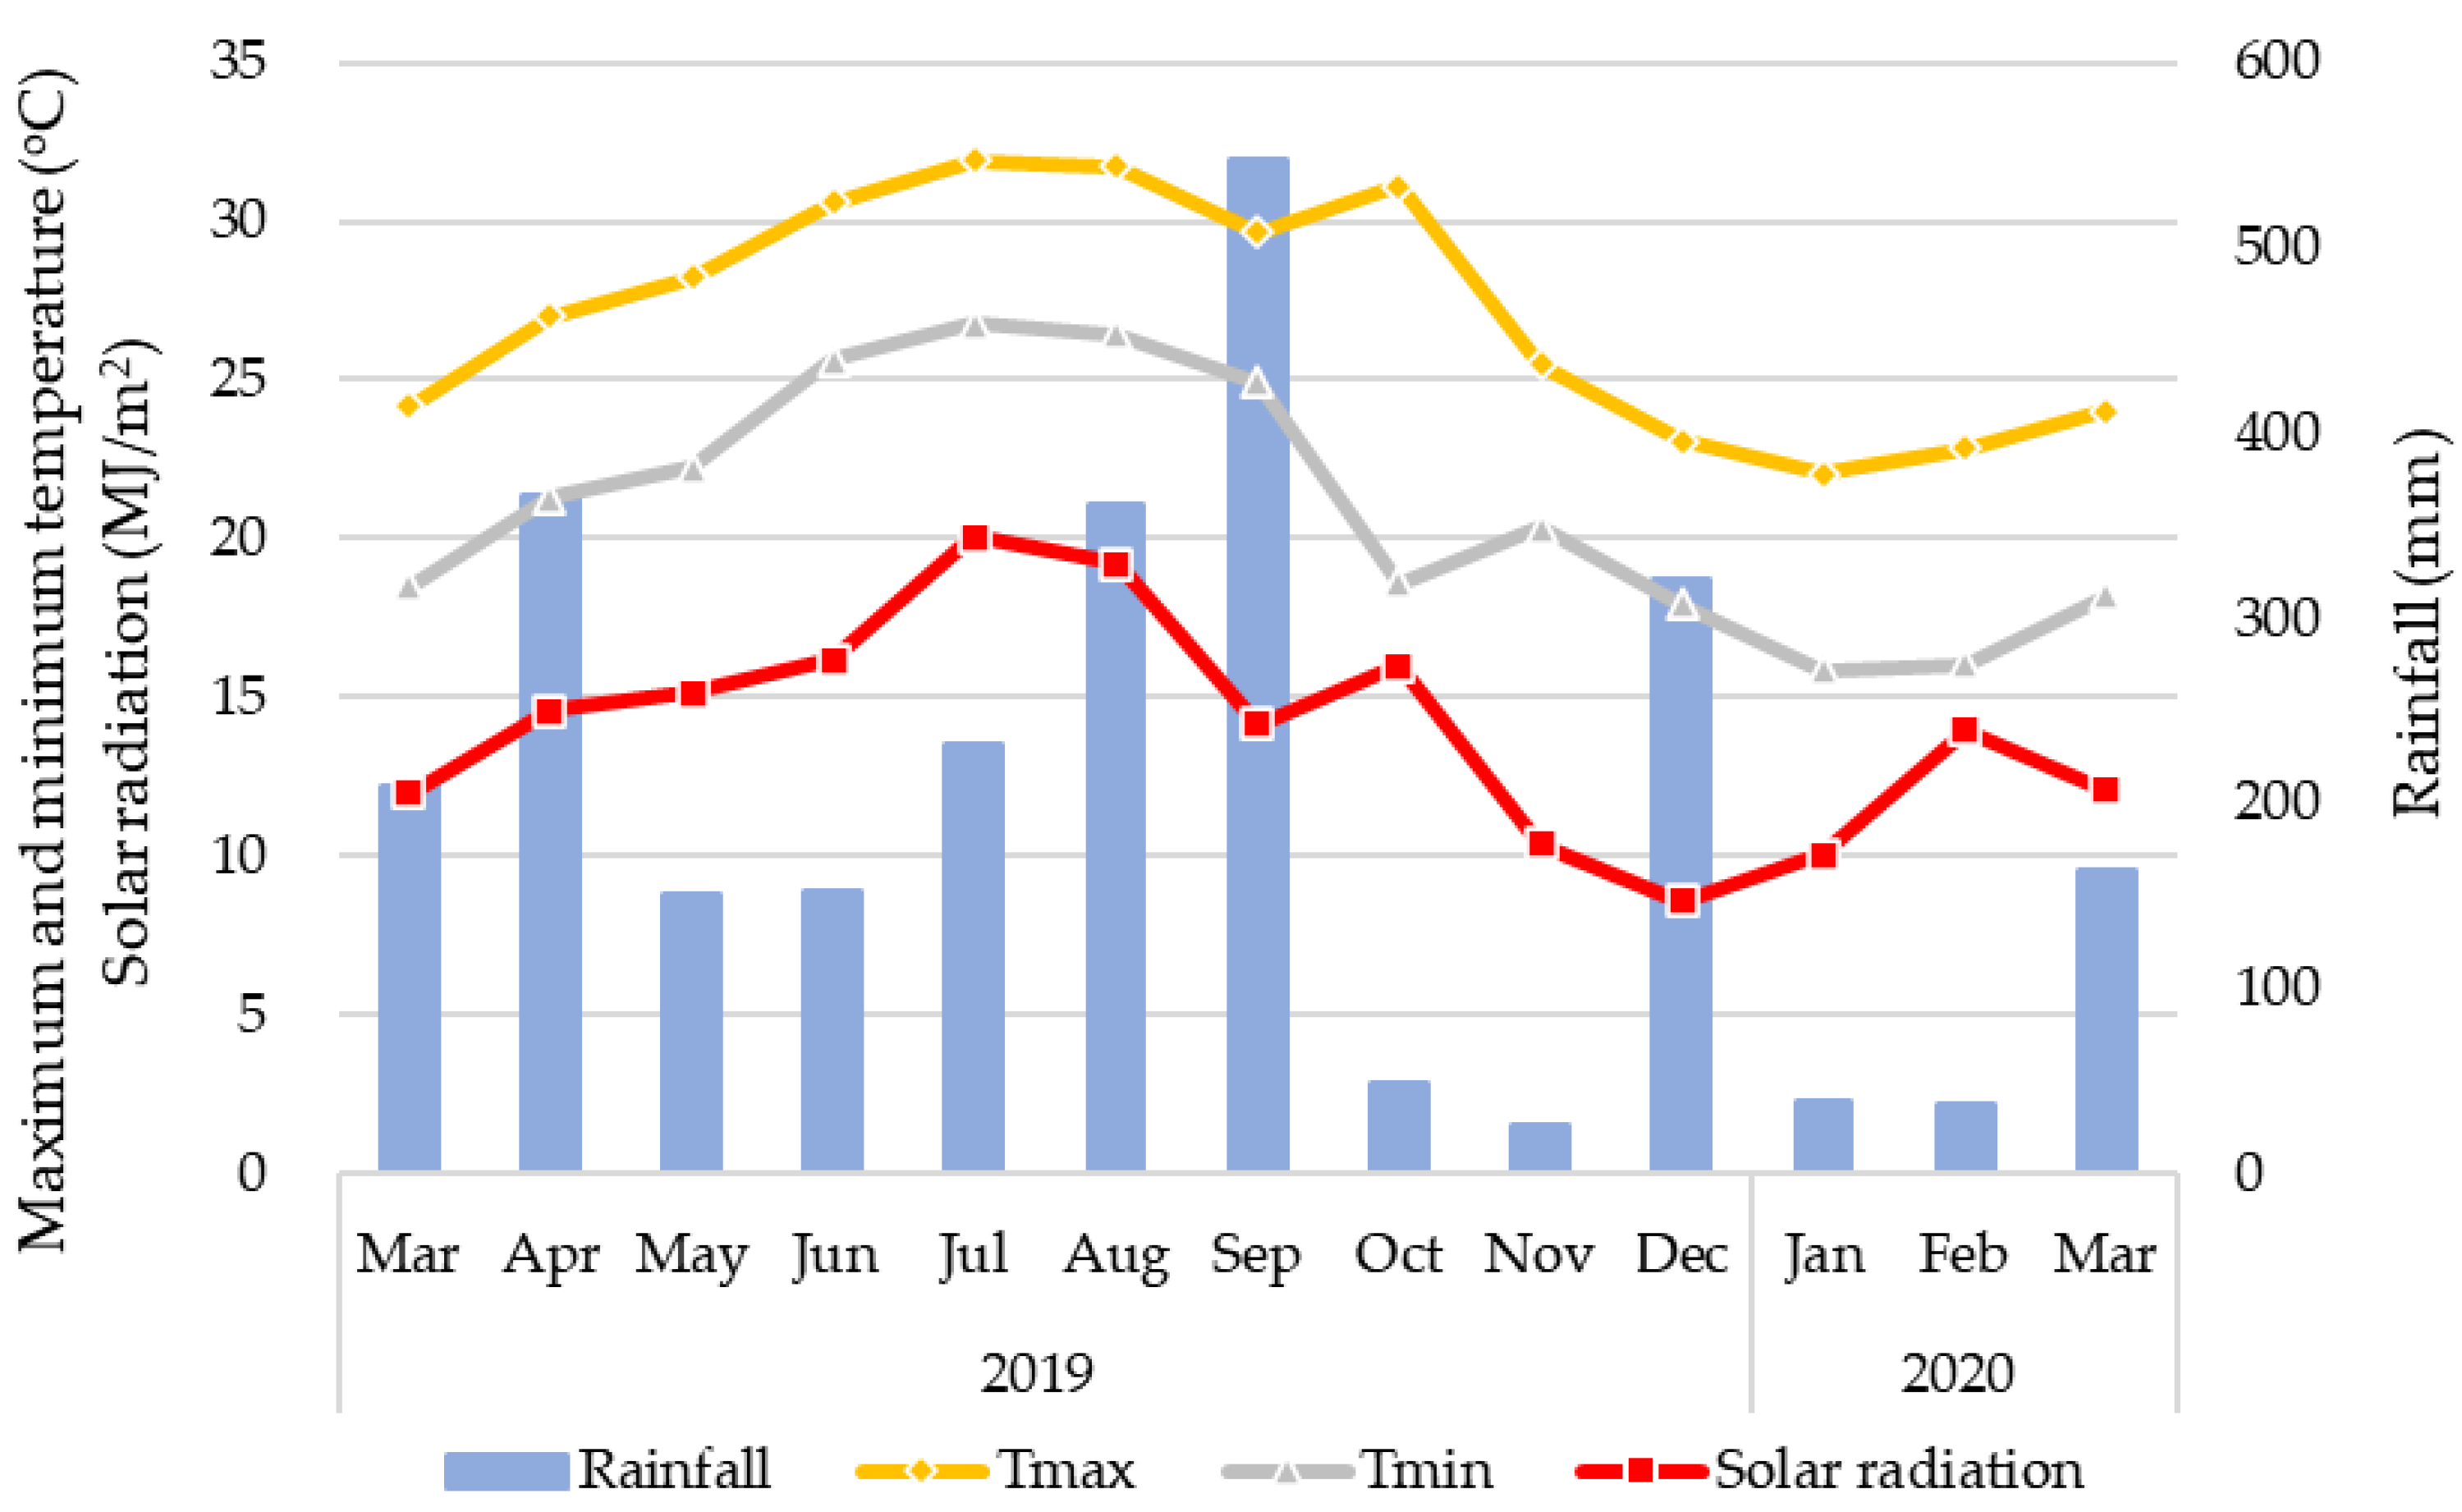
The study was conducted in the following steps. We configured the APSIMX-Sugarcane model according to the conditions of the experimental site (Section 2.1 and Section 2.2) and simulated nitrate uptake and leaching during the sugarcane crop cycle (from sowing to harvesting) with respect to the fertilizer treatments used (Section 2.2). By using the prepared APSIMX-Sugarcane simulations, we generated training design points, which were required to build the meta-models (Section 2.3.2). We generated meta-models for each experimental condition by the TGP method and evaluated their accuracy (Section 2.3.3). Then, we conducted GSA using the trained meta-models instead of APSIMX-Sugarcane, also by the TGP method (Section 2.3.3).

2.1. Study Field

The data were obtained from a lysimeter field experiment conducted by Rathnappriya et al. [44] in the Tropical Agriculture Research Front (TARF), Japan International Research Center for Agricultural Sciences (JIRCAS), Ishigaki, Okinawa, Japan (24°22′43′′ N, 124°11′41′′ E) and were used for APSIMX simulations. The climate in the study area is classified as humid subtropical climate (Cfa) in the Köppen–Geiger climate classification system [45]. Monthly rainfall, the mean daily maximum and minimum temperatures, and solar radiation at the experimental site from March 2019 to March 2020 are shown in Figure 1. The soil type is Shimajiri Maji (Alfisols according to USDA Soil Taxonomy) [46], which is calcareous dark red soil derived from coral limestone [47]. Shimajiri Maji soil is weakly acidic to alkaline, has high clay content; low plant available water capacity due to high permeability [47,48,49,50].

2.2. APSIMX Simulation

APSIMX is an open-source, freely available agricultural modeling platform for non-commercial use [7]. The platform can be used to simulate various plant, climate, soil, animal, and management interactions through the suite of its modules. APSIM-Sugarcane [8] is one of several process-level crop models in the APSIM platform [51], which has been used for sugarcane yield forecasting [52], irrigation scheduling [53], and water allocation [54]. The model is used to determine yield potentials [55] by extending the experimental data on soil, management, and climatic conditions to those different from the actual conditions in a particular experiment [56].
The N supply from the soil in the APSIMX-Sugarcane model is simulated through the SoilN module in the APSIM platform based on the dynamics of soil C and N [57]. According to Keating et al. [8], the N demand and uptake in the Sugarcane model in the APSIM platform can be described as follows. The N demand of a crop on any day is derived as the product of the maximum concentration of tissue N and the tissue weight increment. Sugarcane growth is influenced by green leaf N concentration and only when it decreases below a critical level. The maximum, minimum, and critical concentrations of N are functions of thermal time that were selected according to Catchpoole and Keating [58] and Muchow and Robertson [59]. For instance, the critical concentrations in green leaves differ for photosynthesis, leaf expansion, and stalk growth. A detailed description of the Sugarcane model in the APSIM platform can be found in Keating et al. [8].
We configured the APSIMX-Sugarcane model with the daily meteorological data (Figure 1), soil properties in the lysimeters (Table 1), initial soil water content, and soil chemical and organic properties (Table 2; default values of APSIMX-Sugarcane were used) and crop management practices (sowing date (16 April 2019), harvesting date (16 March 2020), and fertilization). The fertilizer treatments were: (1) BL, (2) N-free, and (3) urea (first fertilization: 100 kg/ha at 30 days after planting (DAP) and second fertilization: 100 kg/ha at 90 DAP). The amounts of nitrate uptake and nitrate leaching during the sugarcane crop cycle were simulated for each treatment.

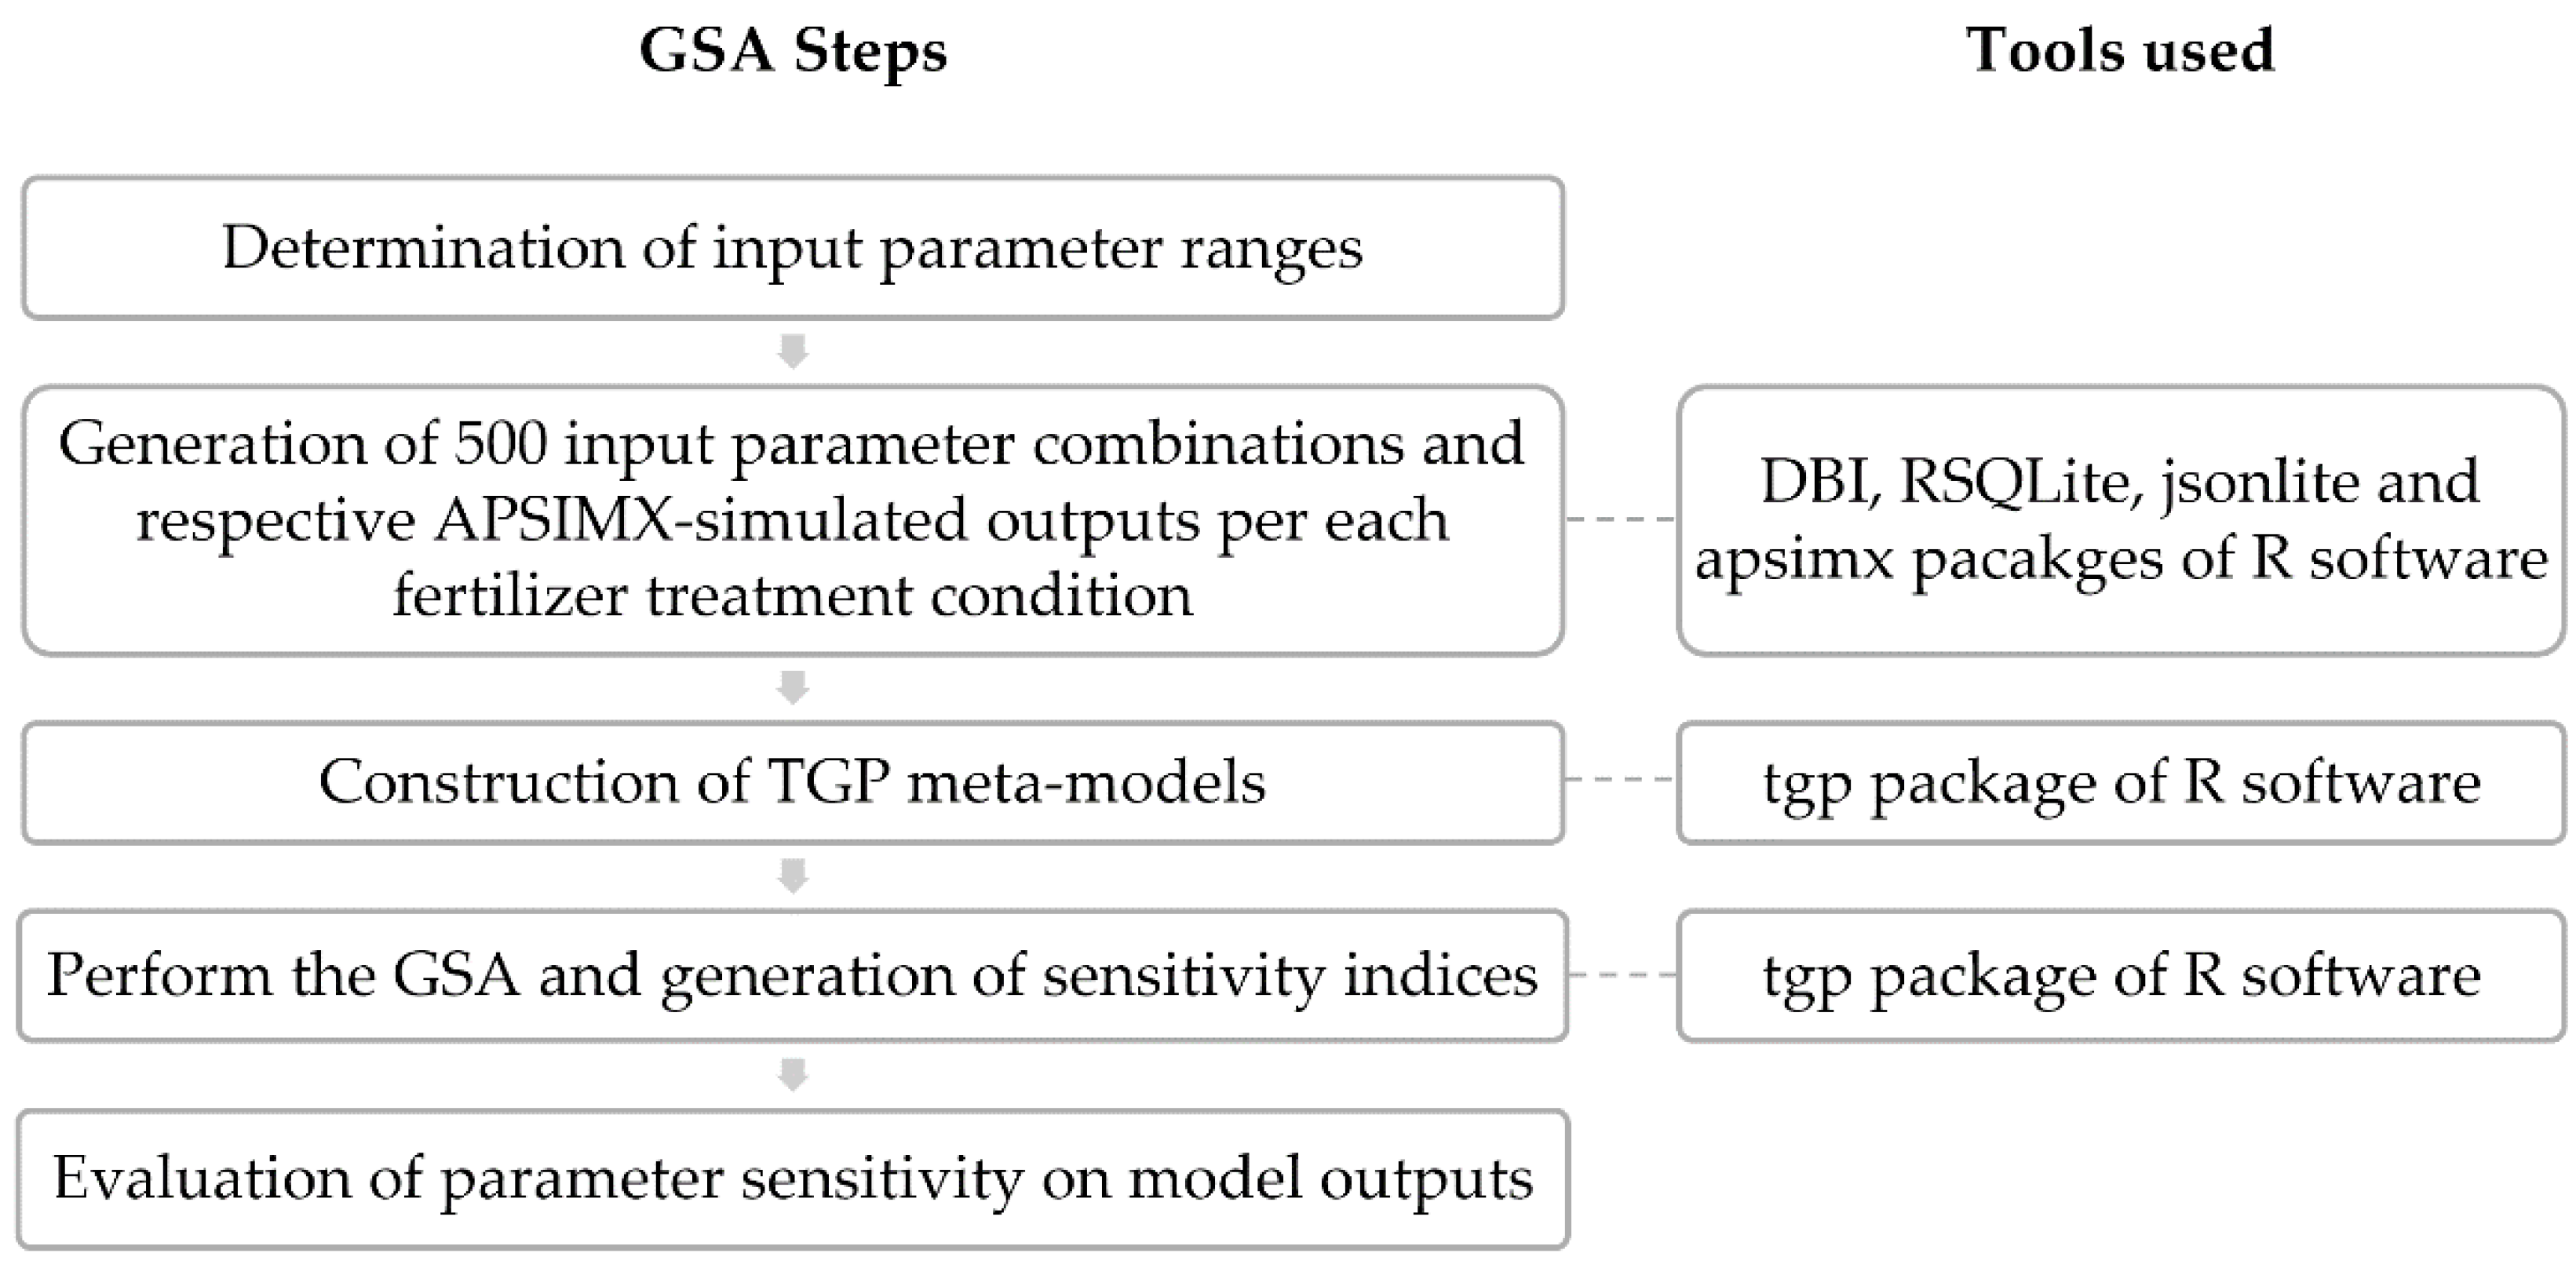
2.3. Sensitivity Analysis

2.3.1. Parameters Used for GSA

The names, descriptions, and ranges of cultivar-specific, plant, and soil parameters used in this study are shown in Table 3. The ranges of parameters responsible for canopy development, partitioning of assimilates, phenological development based on thermal time, dry matter assimilation, and the rate of water flow under saturated conditions were selected on the basis of the available literature [20,41,42,43]. The ranges of parameters responsible for sugarcane growth were obtained by adding a ±30% deviation from the default values assigned in the APSIMX-Sugarcane model. Soil parameters except SWCON were fixed at field-measured values (Table 1), and SWCON was checked for its sensitivity to nitrate leaching. All other parameters were fixed at default values of the APSIMX-Sugarcane model.

2.3.2. Training Design Point Generation

Training and accuracy evaluation of the meta-models were performed with 500 parameter ensembles, which were created using 500 random numbers with a uniform distribution between the minimum and maximum values of each parameter space (Table 3) in R software [60]. Each parameter ensemble consisted of 65 parameters (Table 3).
APSIMX-Sugarcane was run in R software separately for each fertilization level (BL, N-free, urea) using the parameter ensembles. For each experiment, 500 APSIMX simulations were produced. The apsimx [61], DBI [62], RSQLite [63], and jsonlite [64] packages of R software were used to create the required scripts.

2.3.3. Treed Gaussian Process

This study used the TGP method [40] to conduct the GSA to determine the key parameters of APSIMX-Sugarcane [8] that affect the variability of the outputs (nitrate uptake and nitrate leaching). The tgp package [65] of R software [60] was used to estimate the variability of the responses of outputs from a probability distribution over the entire input space [40].
The TGP method is a fully Bayesian non-stationary, semiparametric non-linear regression technique [66]. It is a variance-based method by which the importance of parameters is estimated via a variance ratio by decomposing the variance of outputs into the contributions of different input parameters [67,68]. For instance, if z represents the response of a simulation model to changes in x (i.e., the input parameters), the variance decomposition is represented by Equation (1) [40,66,67,69].
V = v a r ( E [ z x ] ) = i = 1 n V i + 1 j i n V j i + + V 1 , 2 , 3 , , n ,
where V is the total variance of the model output, n is the number of input variables, Vi is the variance of the first-order effect for the ith variable xi, and Vji is the interaction term of the jth and ith input variables.
Since many input parameters and their ranges of variation would result in many interactions, variance decomposition methods are highly suitable for models that have numerous parameters [66]. However, these methods are computationally intensive as they require many model evaluations, so we used the meta-modeling approach to simplify the calculation steps and accelerate model runs. Meta-modeling-based SA consists of two steps. First, a meta-model approximates the original complex conceptual or physical models by simulating the response function between input variables and model output by incorporating different methods of experimental or statistical design. Second, sensitivity indices are calculated to evaluate the influence of variation in the input parameters on model output [66]. In the meta-modeling approach, it is important to select the proper sampling design method for the accurate simulation of the actual phenomena; sampling design methods should be selected to cover a wide range of parameters. In this study, Latin Hypercube sampling (LHS) was used to conduct the TGP-based GSA [40,70]. LHS is one of the most widely used sampling techniques due to its ability to cover small and large design spaces, ability to provide data based on various statistical assumptions, and flexibility [8]. LHS improves the efficiency of sampling methods [69,71] and can reduce the computational cost [71].
Two indices can be calculated using variance-based methods: the first-order sensitivity index (Si) (Equation (2)) and the total-effect index (STi) (Equation (3)) [40,67]. The Si and STi values range between zero and one [67].
S i = v a r E z x i v a r ( z ) ,
S T i = E v a r z x i v a r ( z ) ,
Si measures the contribution of variability in the main effects of input variables to the variance of the response, and STi measures both the Si of each input variable and the interaction effects between input variables. Input variables with the highest Si and STi are considered the most influential parameters for the output variability. The difference between Si and STi is considered a measure of the interaction between a particular input factor and other inputs [72]; a large difference indicates strong interaction [67,73]. In TGP-based SA, sensitivity indices can be calculated by combining variability from the Monte Carlo integral estimation and the function output [28,74]. A detailed description of conducting GSA using the tgp package in R software is available in Gramacy and Taddy [40] and Gramacy [70].
We created meta-models for nitrate uptake and nitrate leaching under each fertilizer application using the tgp package in R software [65]. The meta-models were trained for the total amounts (from sugarcane sowing to harvesting) of nitrate uptake (NO3 uptake) and leached nitrate−N (leached NO3−N) using 300 APSIMX-simulated outputs at each fertilization level. It is important to check the accuracy of meta-models, i.e., whether they can approximate the APSIMX-Sugarcane. Accurate meta-models can then be used for SA instead of APSIMX-Sugarcane to reduce the computational burden. Meta-models were tested for their prediction accuracy using the remaining 200 APSIMX-simulated outputs. The meta-models were evaluated using the coefficient of determination (R2), normalized root mean square error (NRMSE), and Willmott’s agreement index (AI) [75]. The R2 was calculated from the linear regression between APSIMX-simulated outputs and meta-model-predicted outputs; a strong linear relationship is indicated by R2 close to 1 and a weak linear relationship by R2 close to 0. The root mean square error (RMSE) between the APSIMX-simulated outputs and meta-model-predicted outputs was calculated according to Equation (4), and the NRMSE (reported as a percentage) according to Equation (5). In order to understand the relationship between the APSIMX-simulated outputs and meta-model-predicted outputs, we used the following categories: NRMSE ≤ 20% (good relationship), 20% < NRMSE < 30% (fair relationship), and NRMSE ≥ 30% (poor relationship). Almost similar NRMSE categorization was used by Liu et al. [76]. The AI is based on the ratio of the mean square error and the potential error (Equation (6)); a perfect match is indicated by AI = 1 and no match by AI = 0 [75,76].
R M S E = i = 1 n O i E P i 2 n ,
N R M S E = R M S E O a v g × 100
A I = 1 i = 1 n O i E P i 2 i = 1 n E P i O ¯ + O i O ¯ 2
where Oi is the value of the ith observation, EPi is the meta-model-predicted value of the ith observation, Oavg is the average value of the observations, and n is the number of observations.
Then, we performed the GSA using the TGP method to calculate the sensitivity indices (Si and STi). Figure 2 shows a flow diagram for the GSA performed in this study.

3. Results and Discussion

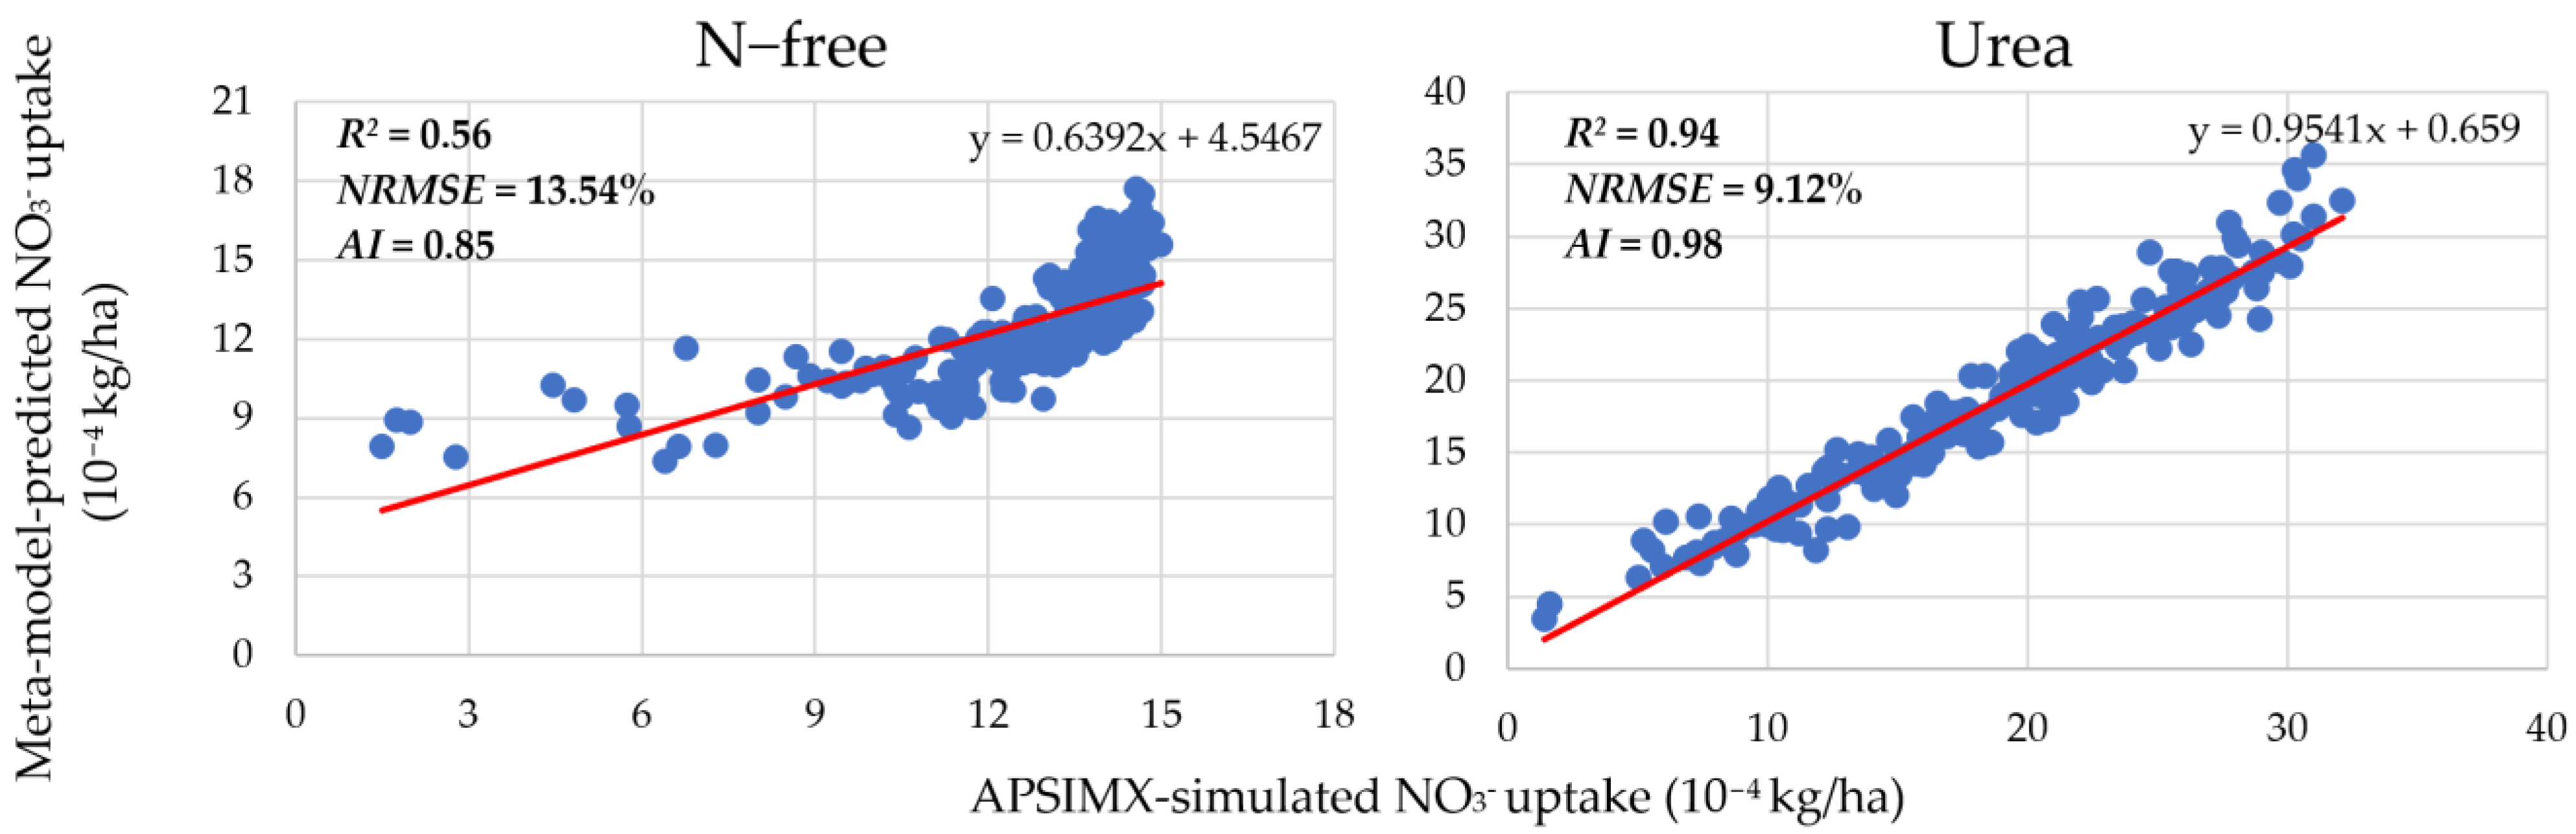
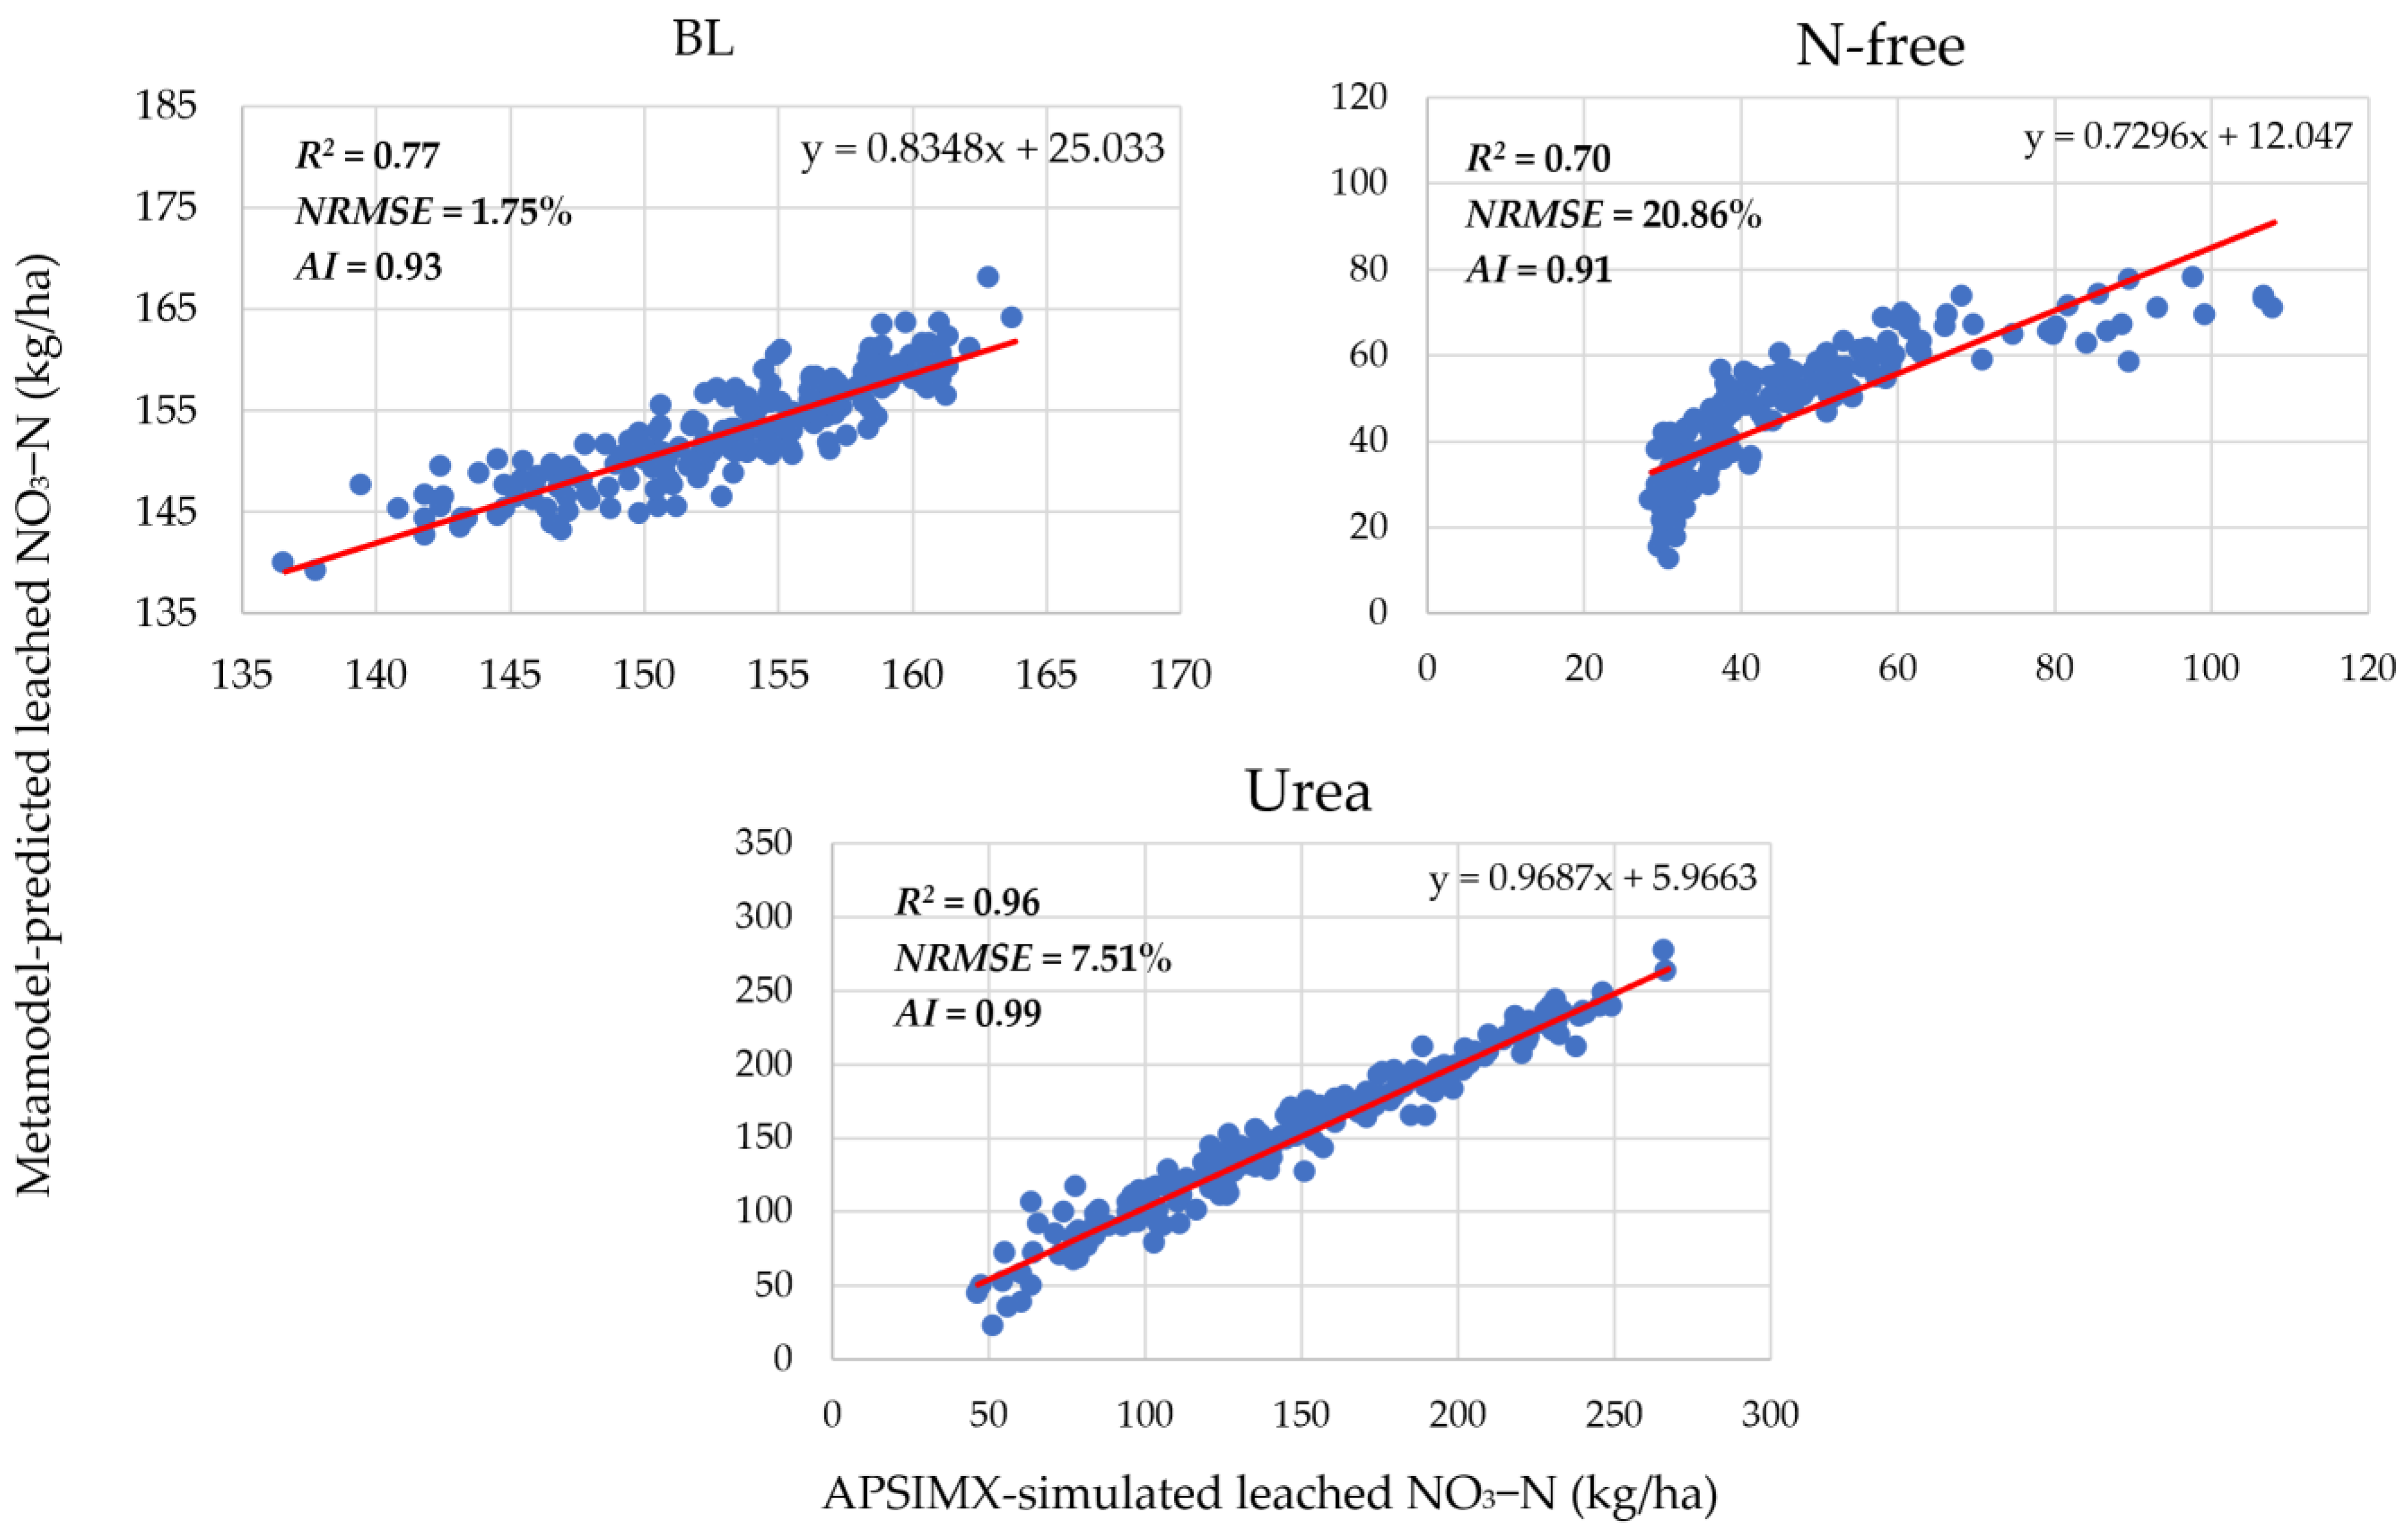
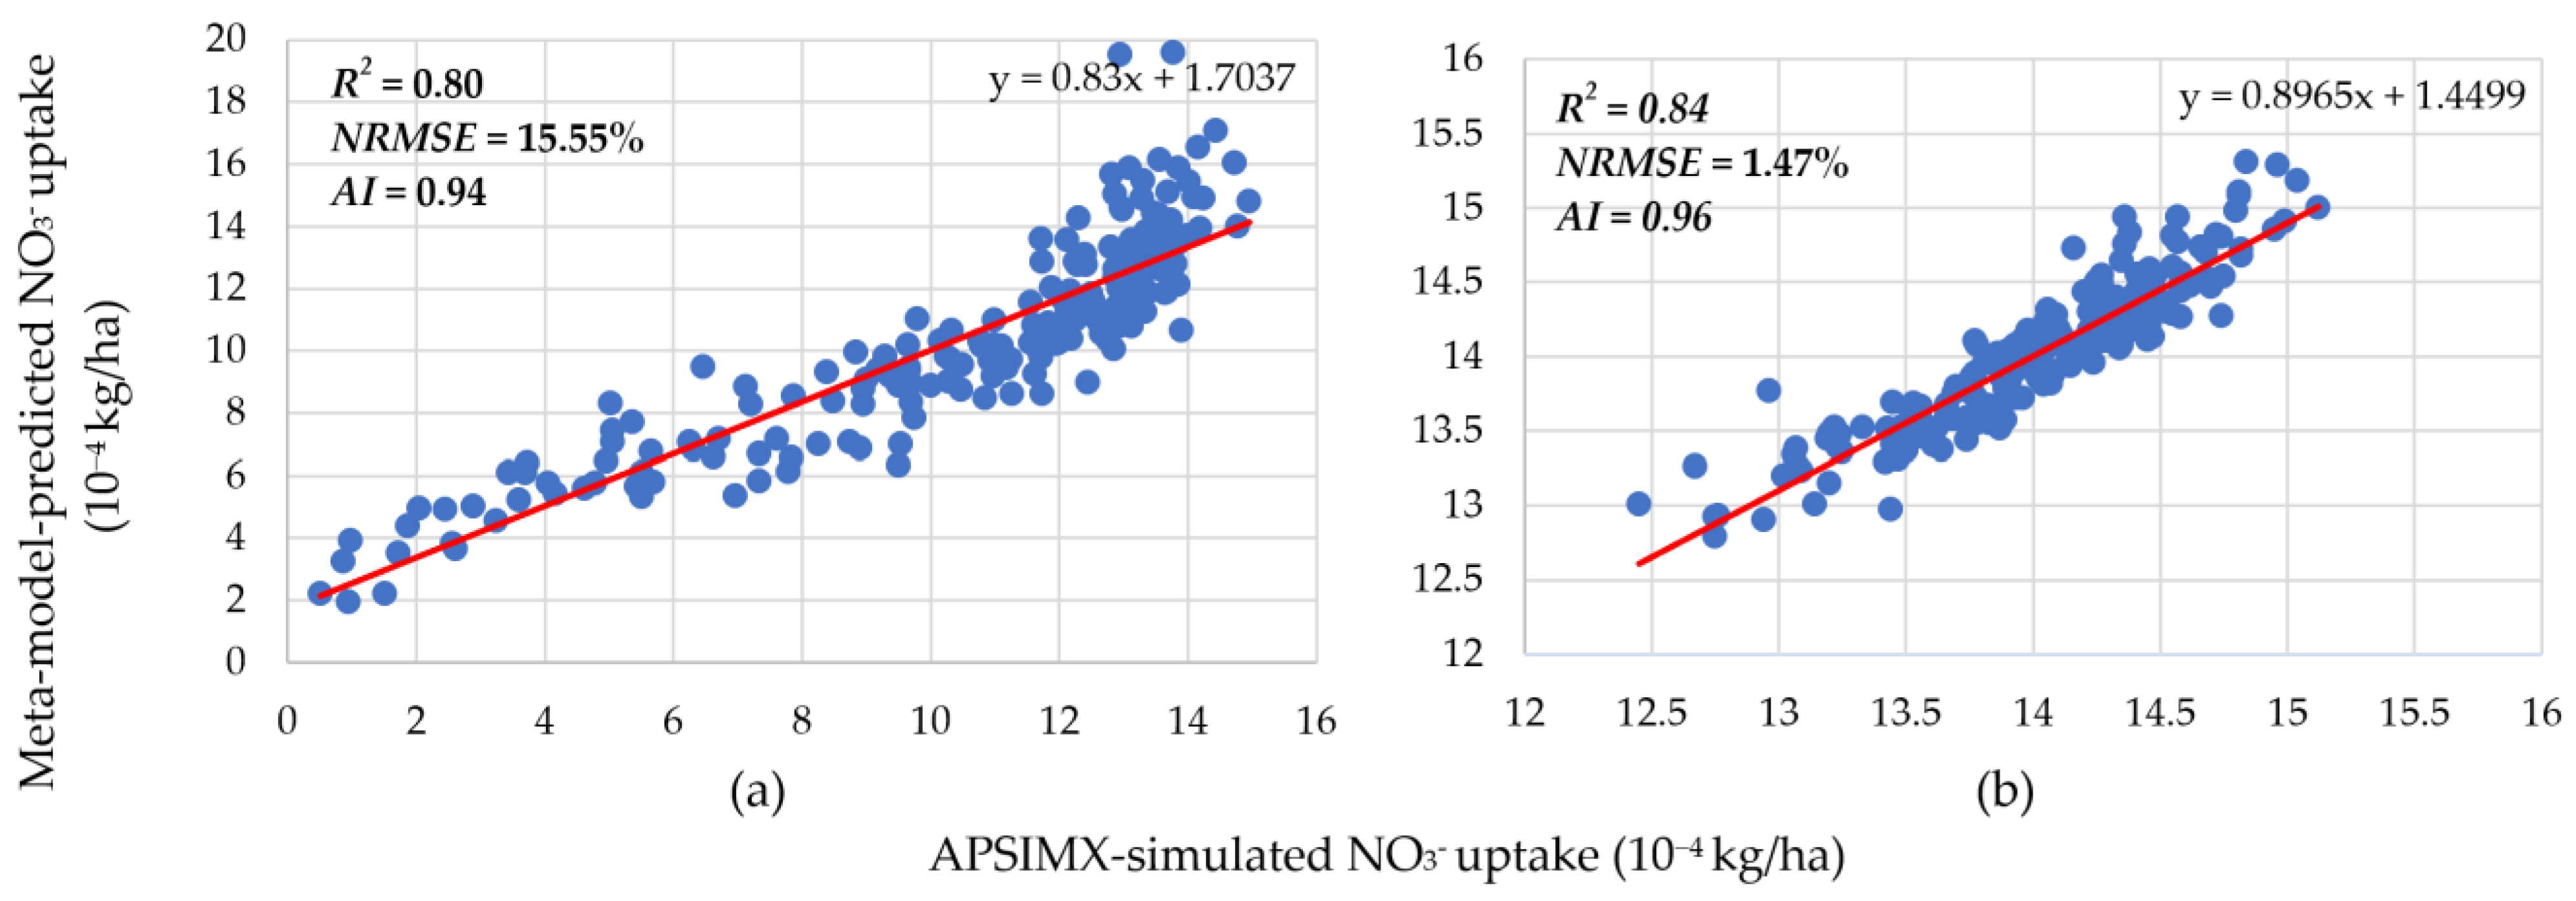
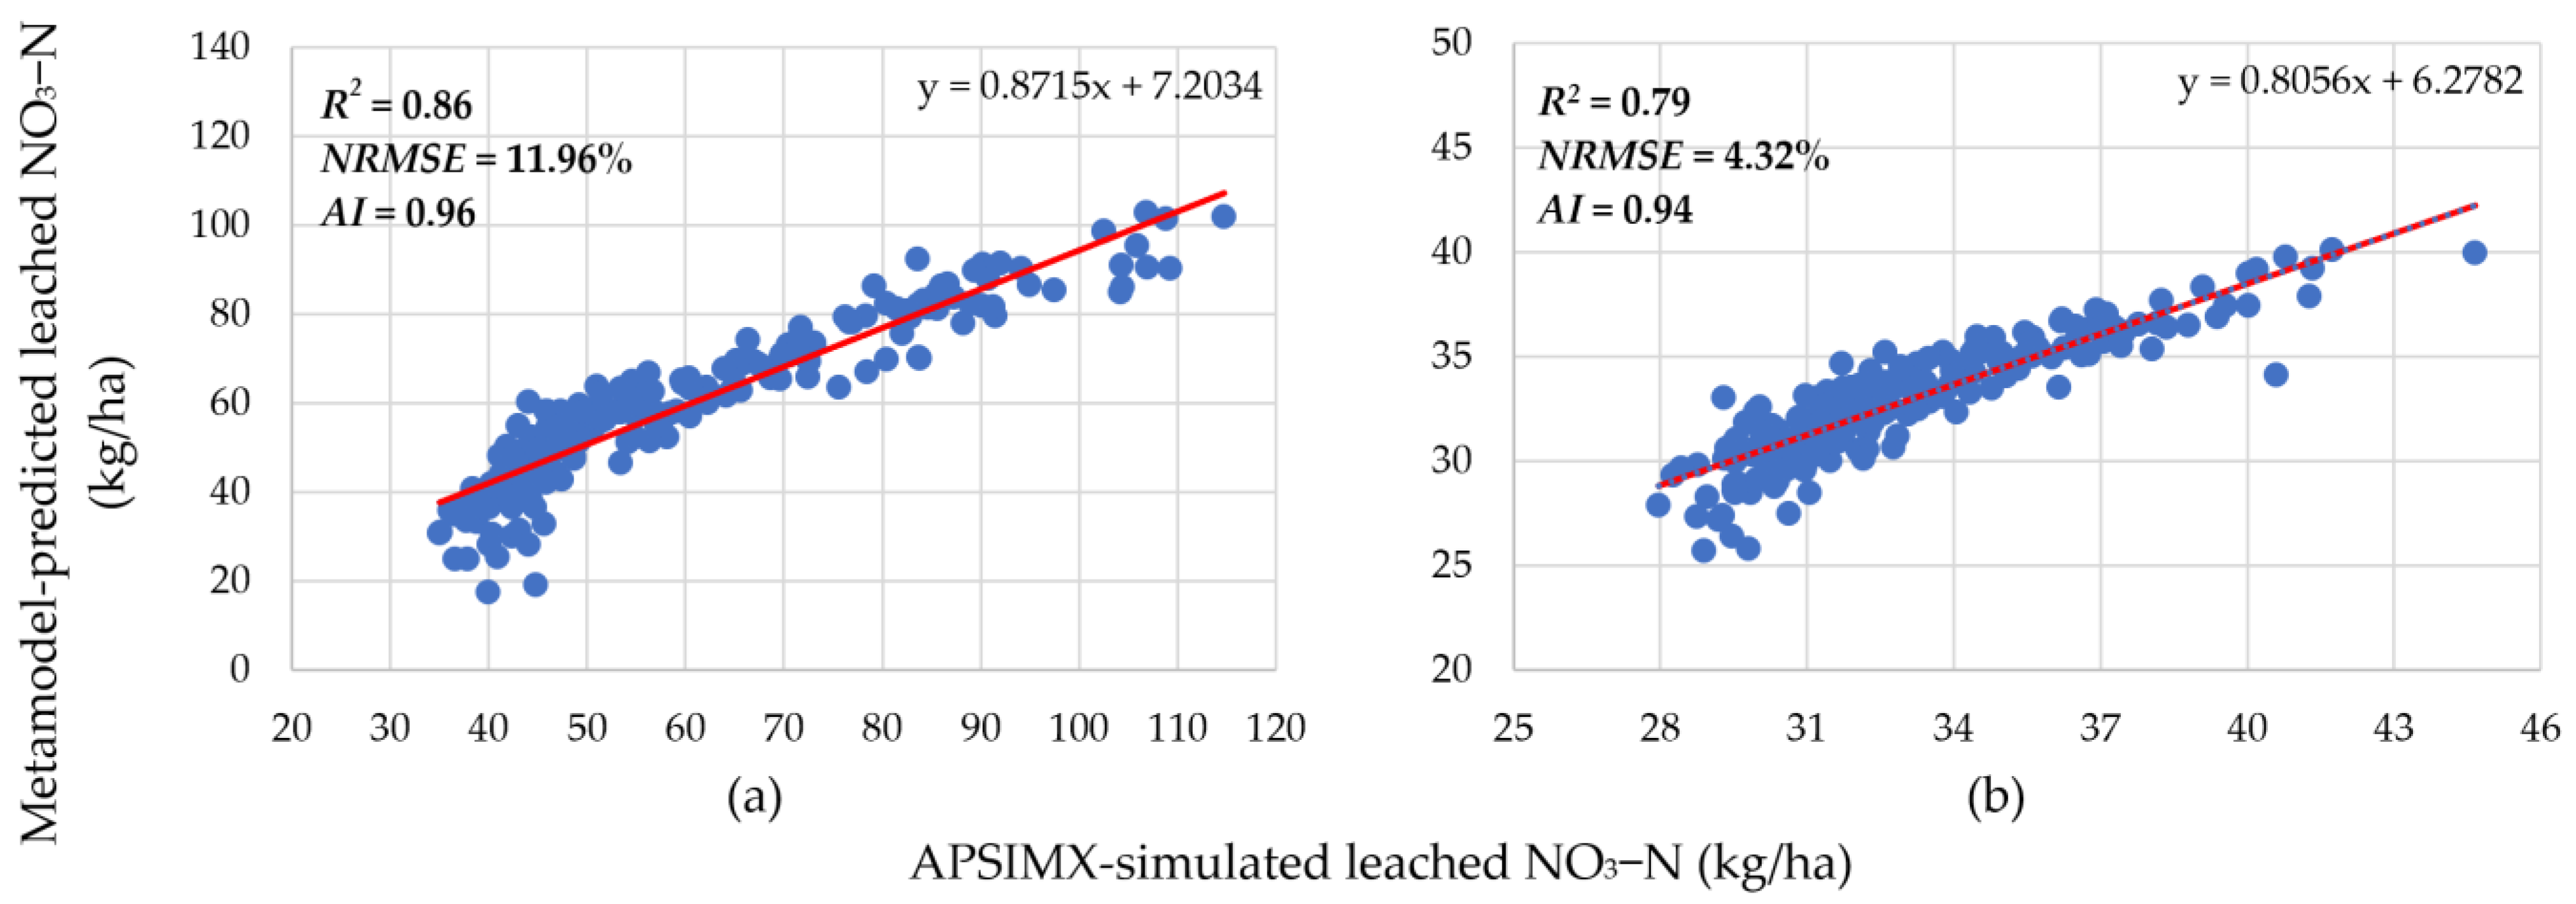
3.1. Meta-Model Accuracy

The accuracy of the generated meta-models was evaluated by R2, NRMSE, and AI (Figure 3 and Figure 4). In Figure 3, scatter plots show the linear relationship between APSIMX-simulated and meta-model-predicted NO3 uptake. In Figure 4, scatter plots show the linear relationship between APSIMX-simulated and meta-model-predicted leached NO3−N.
The linear relationship between the APSIMX-simulated and meta-model-predicted NO3 uptake was moderate under the N-free treatment (R2 = 0.56) and strong under the urea treatment (R2 = 0.94), whereas the NRMSE and AI values for both treatments showed good agreement between APSIMX-simulated and meta-model-predicted values (N-free: NRMSE 13.54%, AI 0.85; urea: NRMSE 9.12%, AI 0.98) (Figure 3). For nitrate leaching, BL and urea treatments showed a strong relationship (R2: BL, 0.77; urea, 0.96), and N-free treatment showed a moderate relationship (N-free R2 = 0.70) between the meta-models and the APSIMX simulator, whereas the computed NRMSE (BL, 1.75%; N-free, 20.86%; urea, 7.51%) and AI (BL, 0.93; N-free, 0.91, urea, 0.99) values indicated good agreement between APSIMX-simulated and meta-model-predicted values (Figure 4).
According to the R2 values, moderate relationships were observed in the N-free condition between the APSIMX simulator and the generated meta-models (Figure 3 and Figure 4). Although the APSIMX-simulated values did not vary considerably at high values (12–15 (10−4) kg/ha) for NO3 uptake and at low values (20–40 kg/ha) for leached NO3−N, the meta-model-predicted values were increased. We reasoned that these discrepancies might be related to plant growth, so we checked the relationship between the parameters in the APSIMX-Sugarcane model and the results of APSIMX-Sugarcane simulations (e.g., the relationships of APSIMX-simulated NO3 uptake and leached NO3−N) with the RUE3 parameter (Figure 5).
Higher RUE3 was associated with higher NO3 uptake and smaller NO3−N leaching in both N-free and urea conditions. However, in the N-free condition, the increase in NO3 uptake and the decrease in NO3−N leaching became shallower at larger RUE3. We considered that this was because plant growth is limited by N-stress at high RUE3. Therefore, we separated the parameter range of rue into two ranges (1.2–1.8 and 1.8–2.5) by visually checking Figure 5 and developed the meta-models again for the N-free condition. We selected rue and separated the rue parameter range because rue was identified as the most sensitive parameter for sugarcane biomass accumulation [42] and for cane dry weight [41]; hence, rue would influence nitrate balance. The accuracy of the developed meta-models was evaluated using R2, NRMSE, and AI (Figure 6 and Figure 7).
In the N-free condition with the rue parameter range 1.2–1.8 (hereafter referred to as N-free(a)), R2 was 0.80 for NO3 uptake (Figure 6) and 0.86 for leached NO3−N (Figure 7). In the N-free condition with the rue parameter range 1.8–2.5 (hereafter referred to as N-free(b)), R2 was 0.84 for NO3 uptake (Figure 6) and 0.79 for leached NO3−N (Figure 7). These R2 values indicate stronger positive linear relationships between the generated meta-models and the APSIMX simulator in the new rue parameter ranges than in the 1.2–2.5 range. In addition, the NRMSE and AI values for both N-free(a) and N-free(b) showed good agreement between meta-model-predicted and APSIMX-simulated values for NO3 uptake (N-free(a): NRMSE 15.55%, AI 0.94; N-free(b): NRMSE 1.47%, AI 0.96; Figure 6) and leached NO3−N (N-free(a): NRMSE 11.96%, AI 0.96; N-free(b): NRMSE 4.32%, AI 0.94; Figure 7). Hence, we confirmed that the generated meta-models successfully approximated the APSIMX simulators.

3.2. Sensitivity Analysis

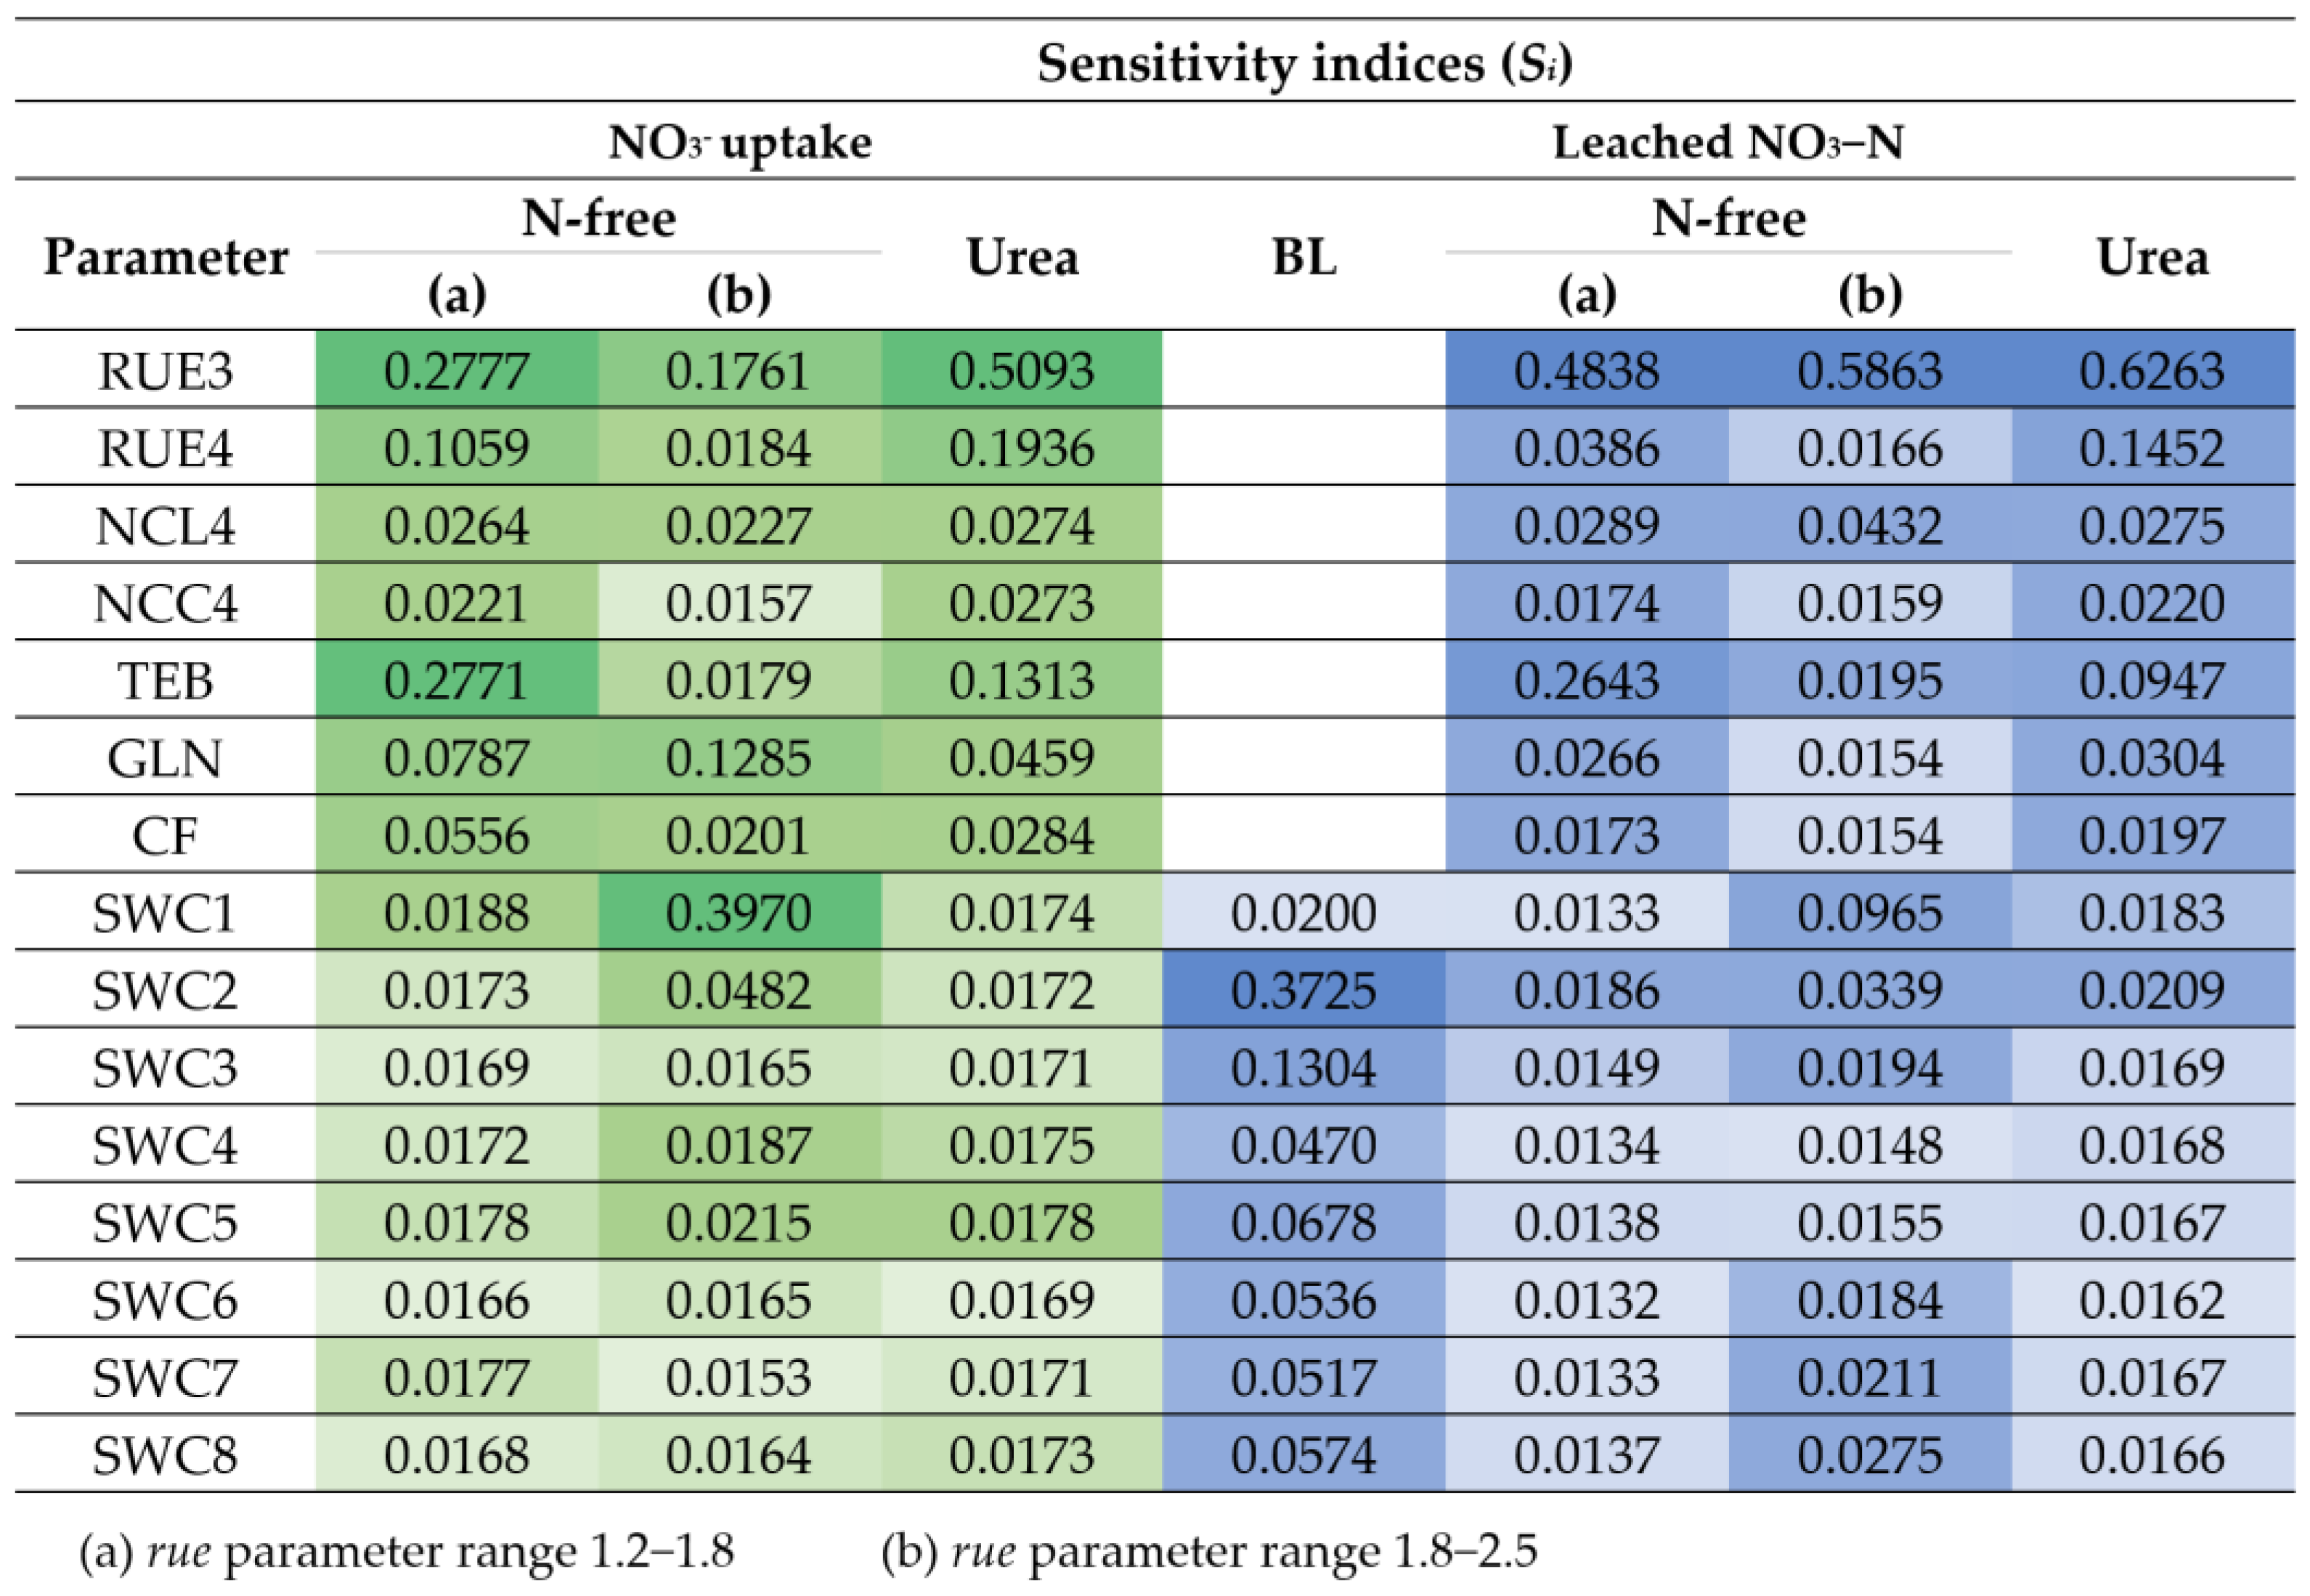
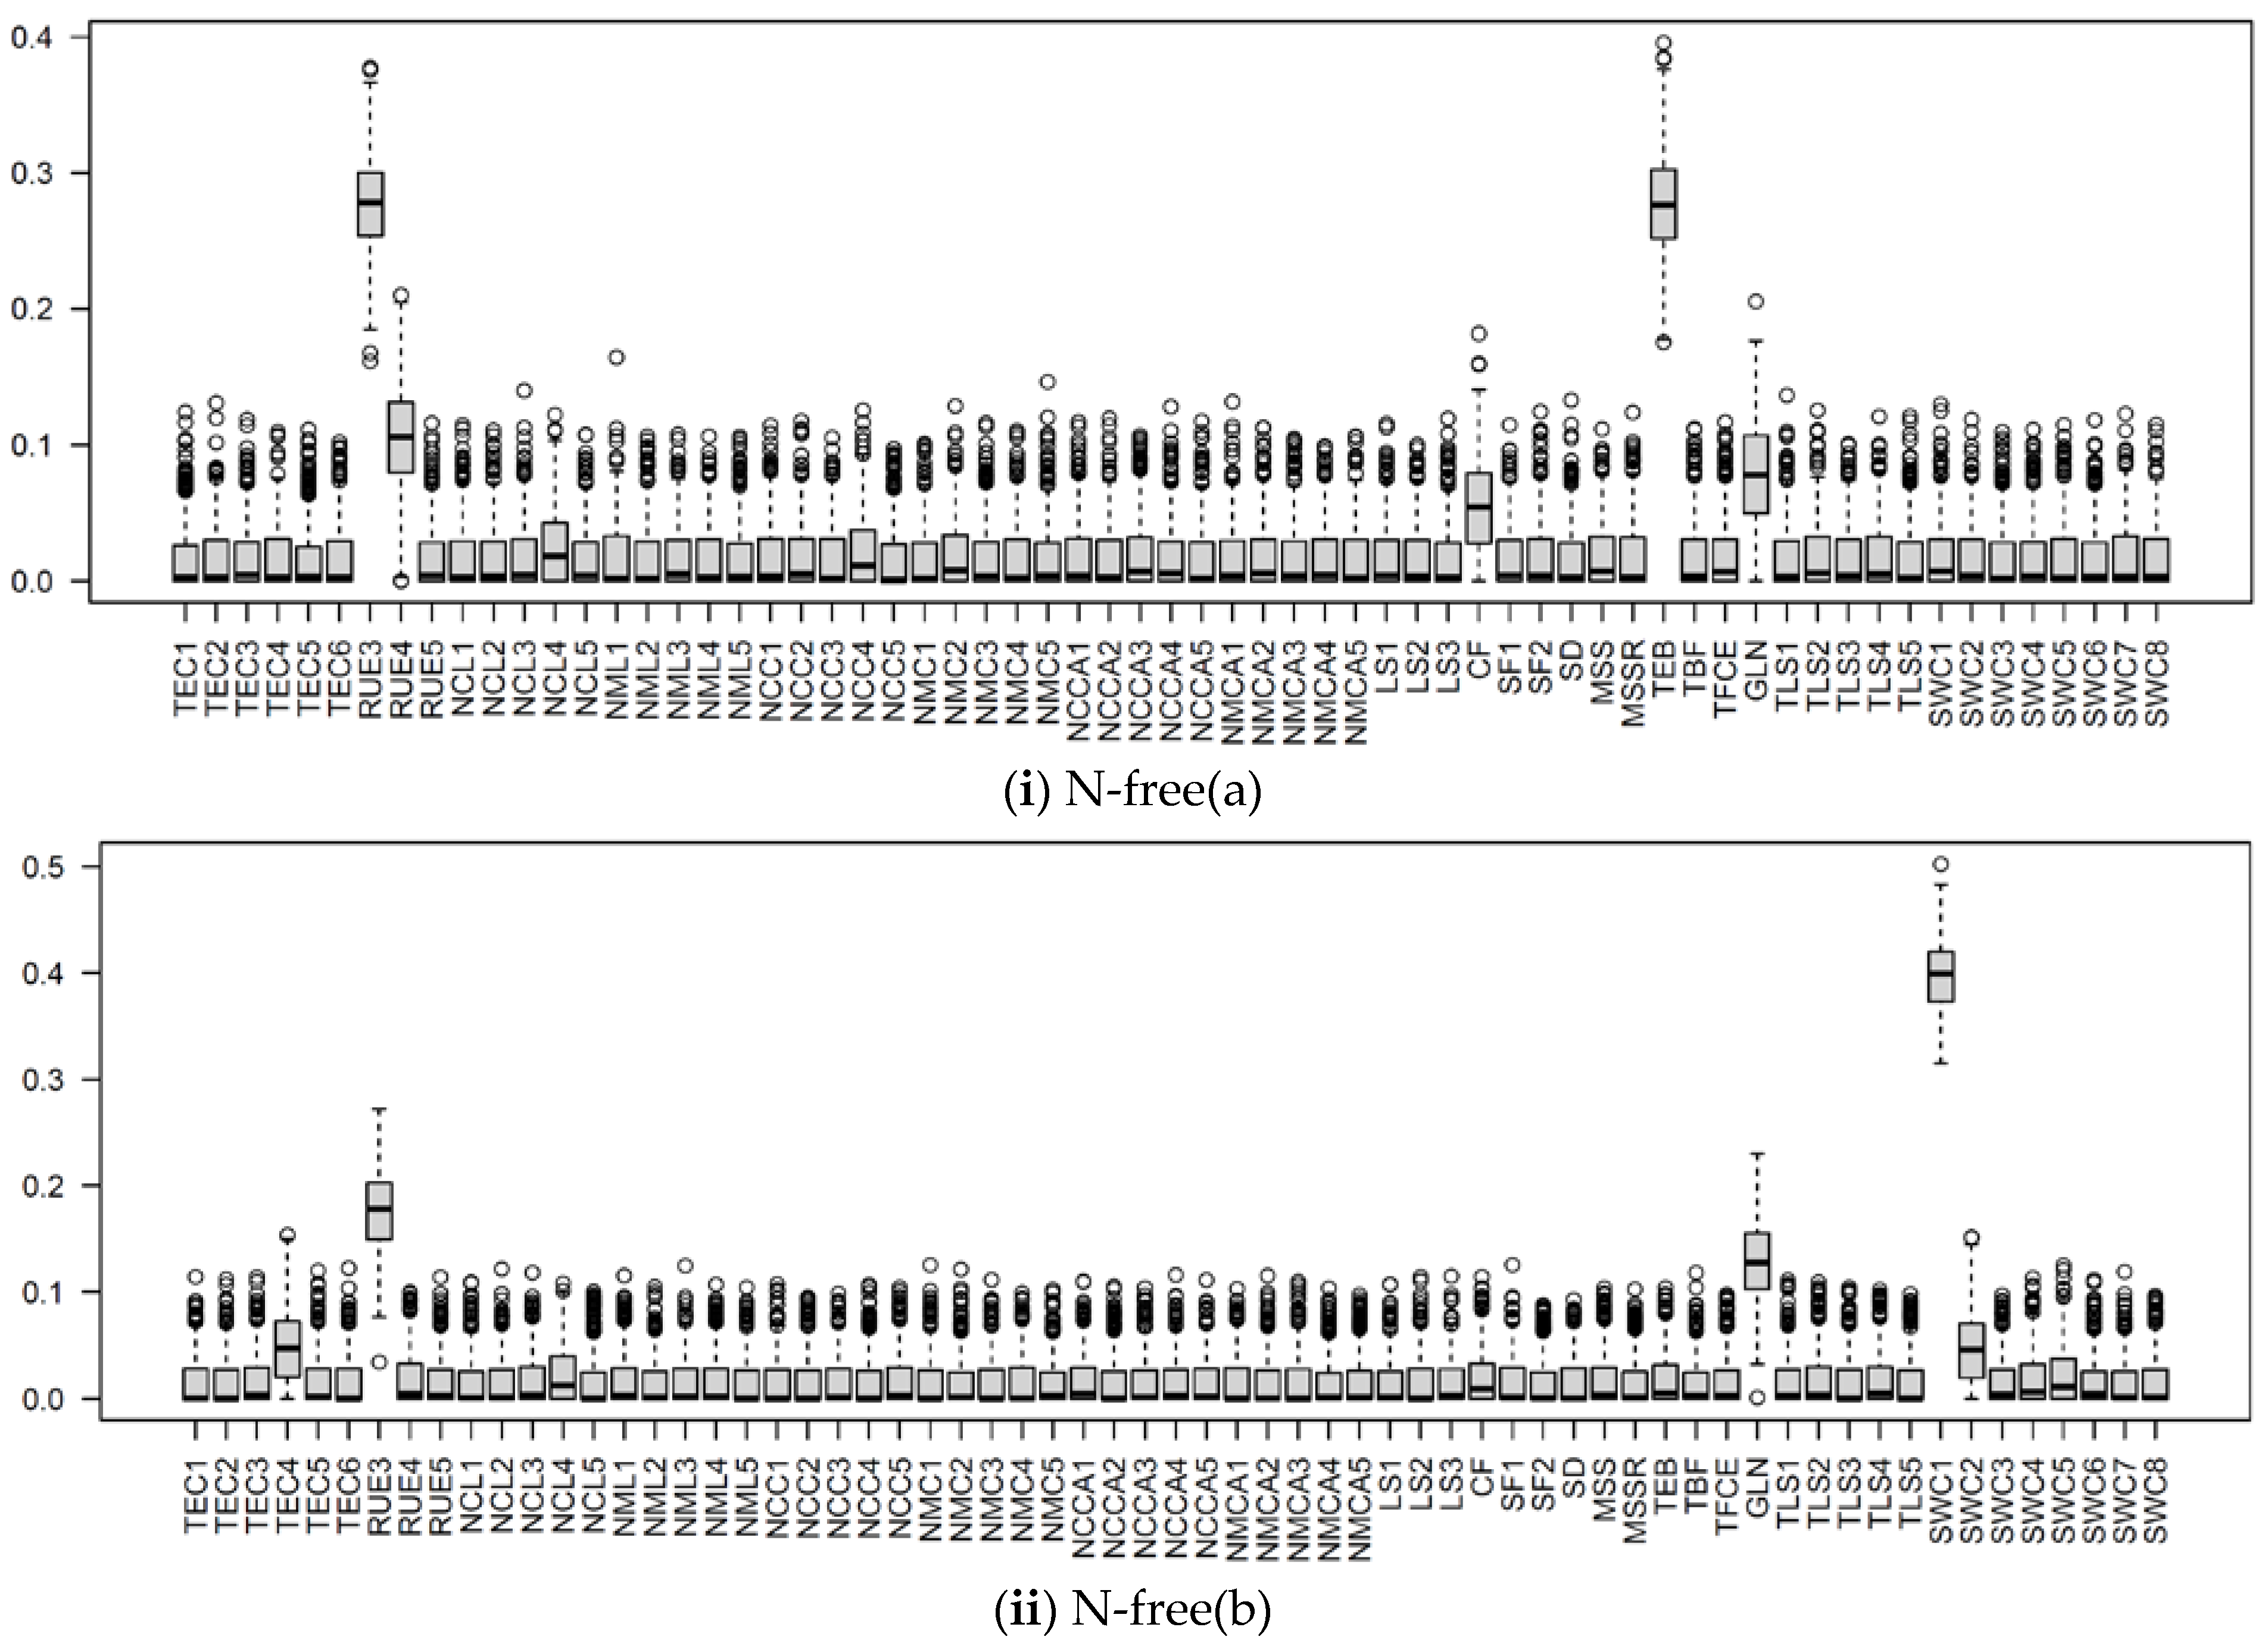
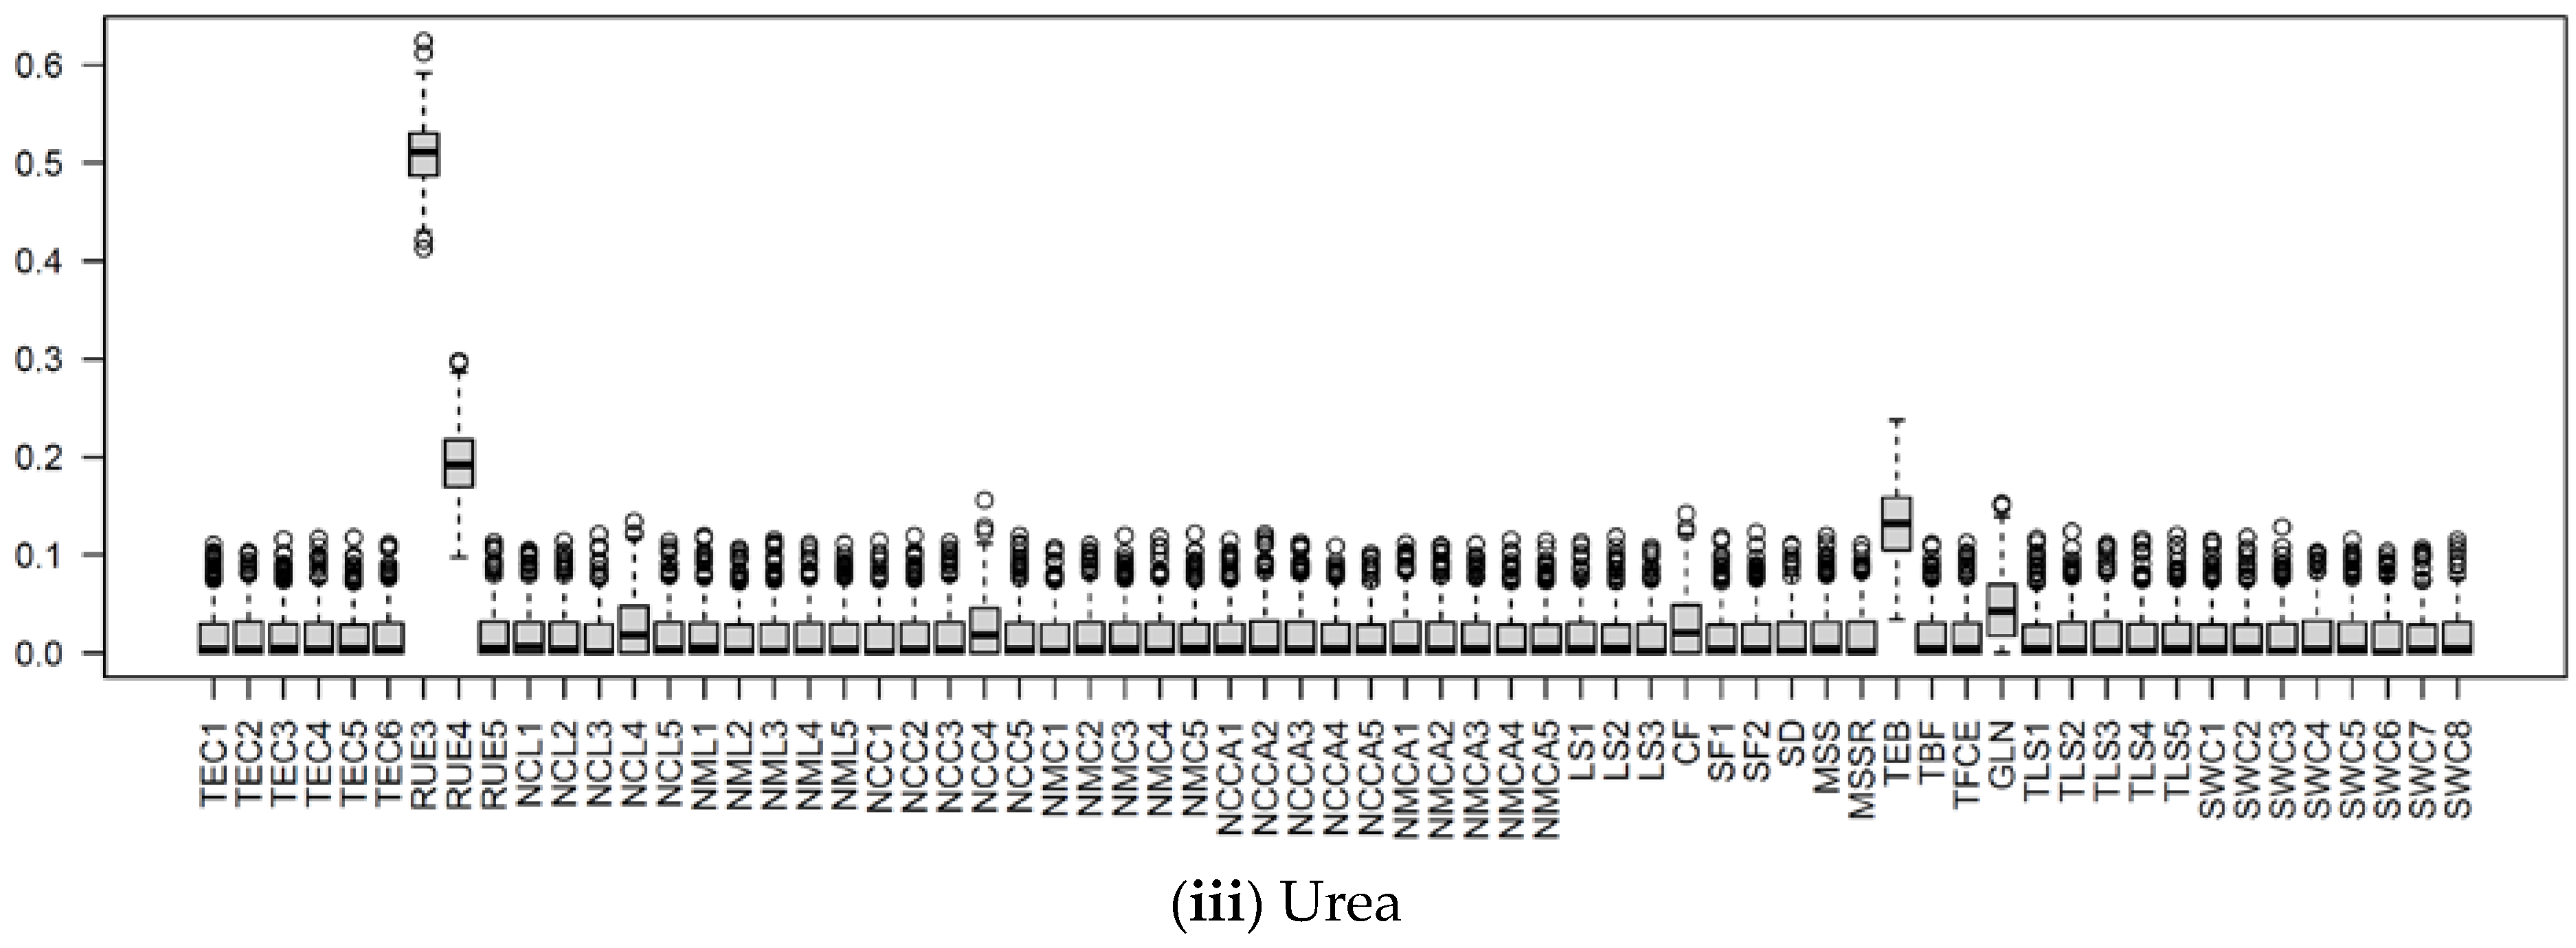
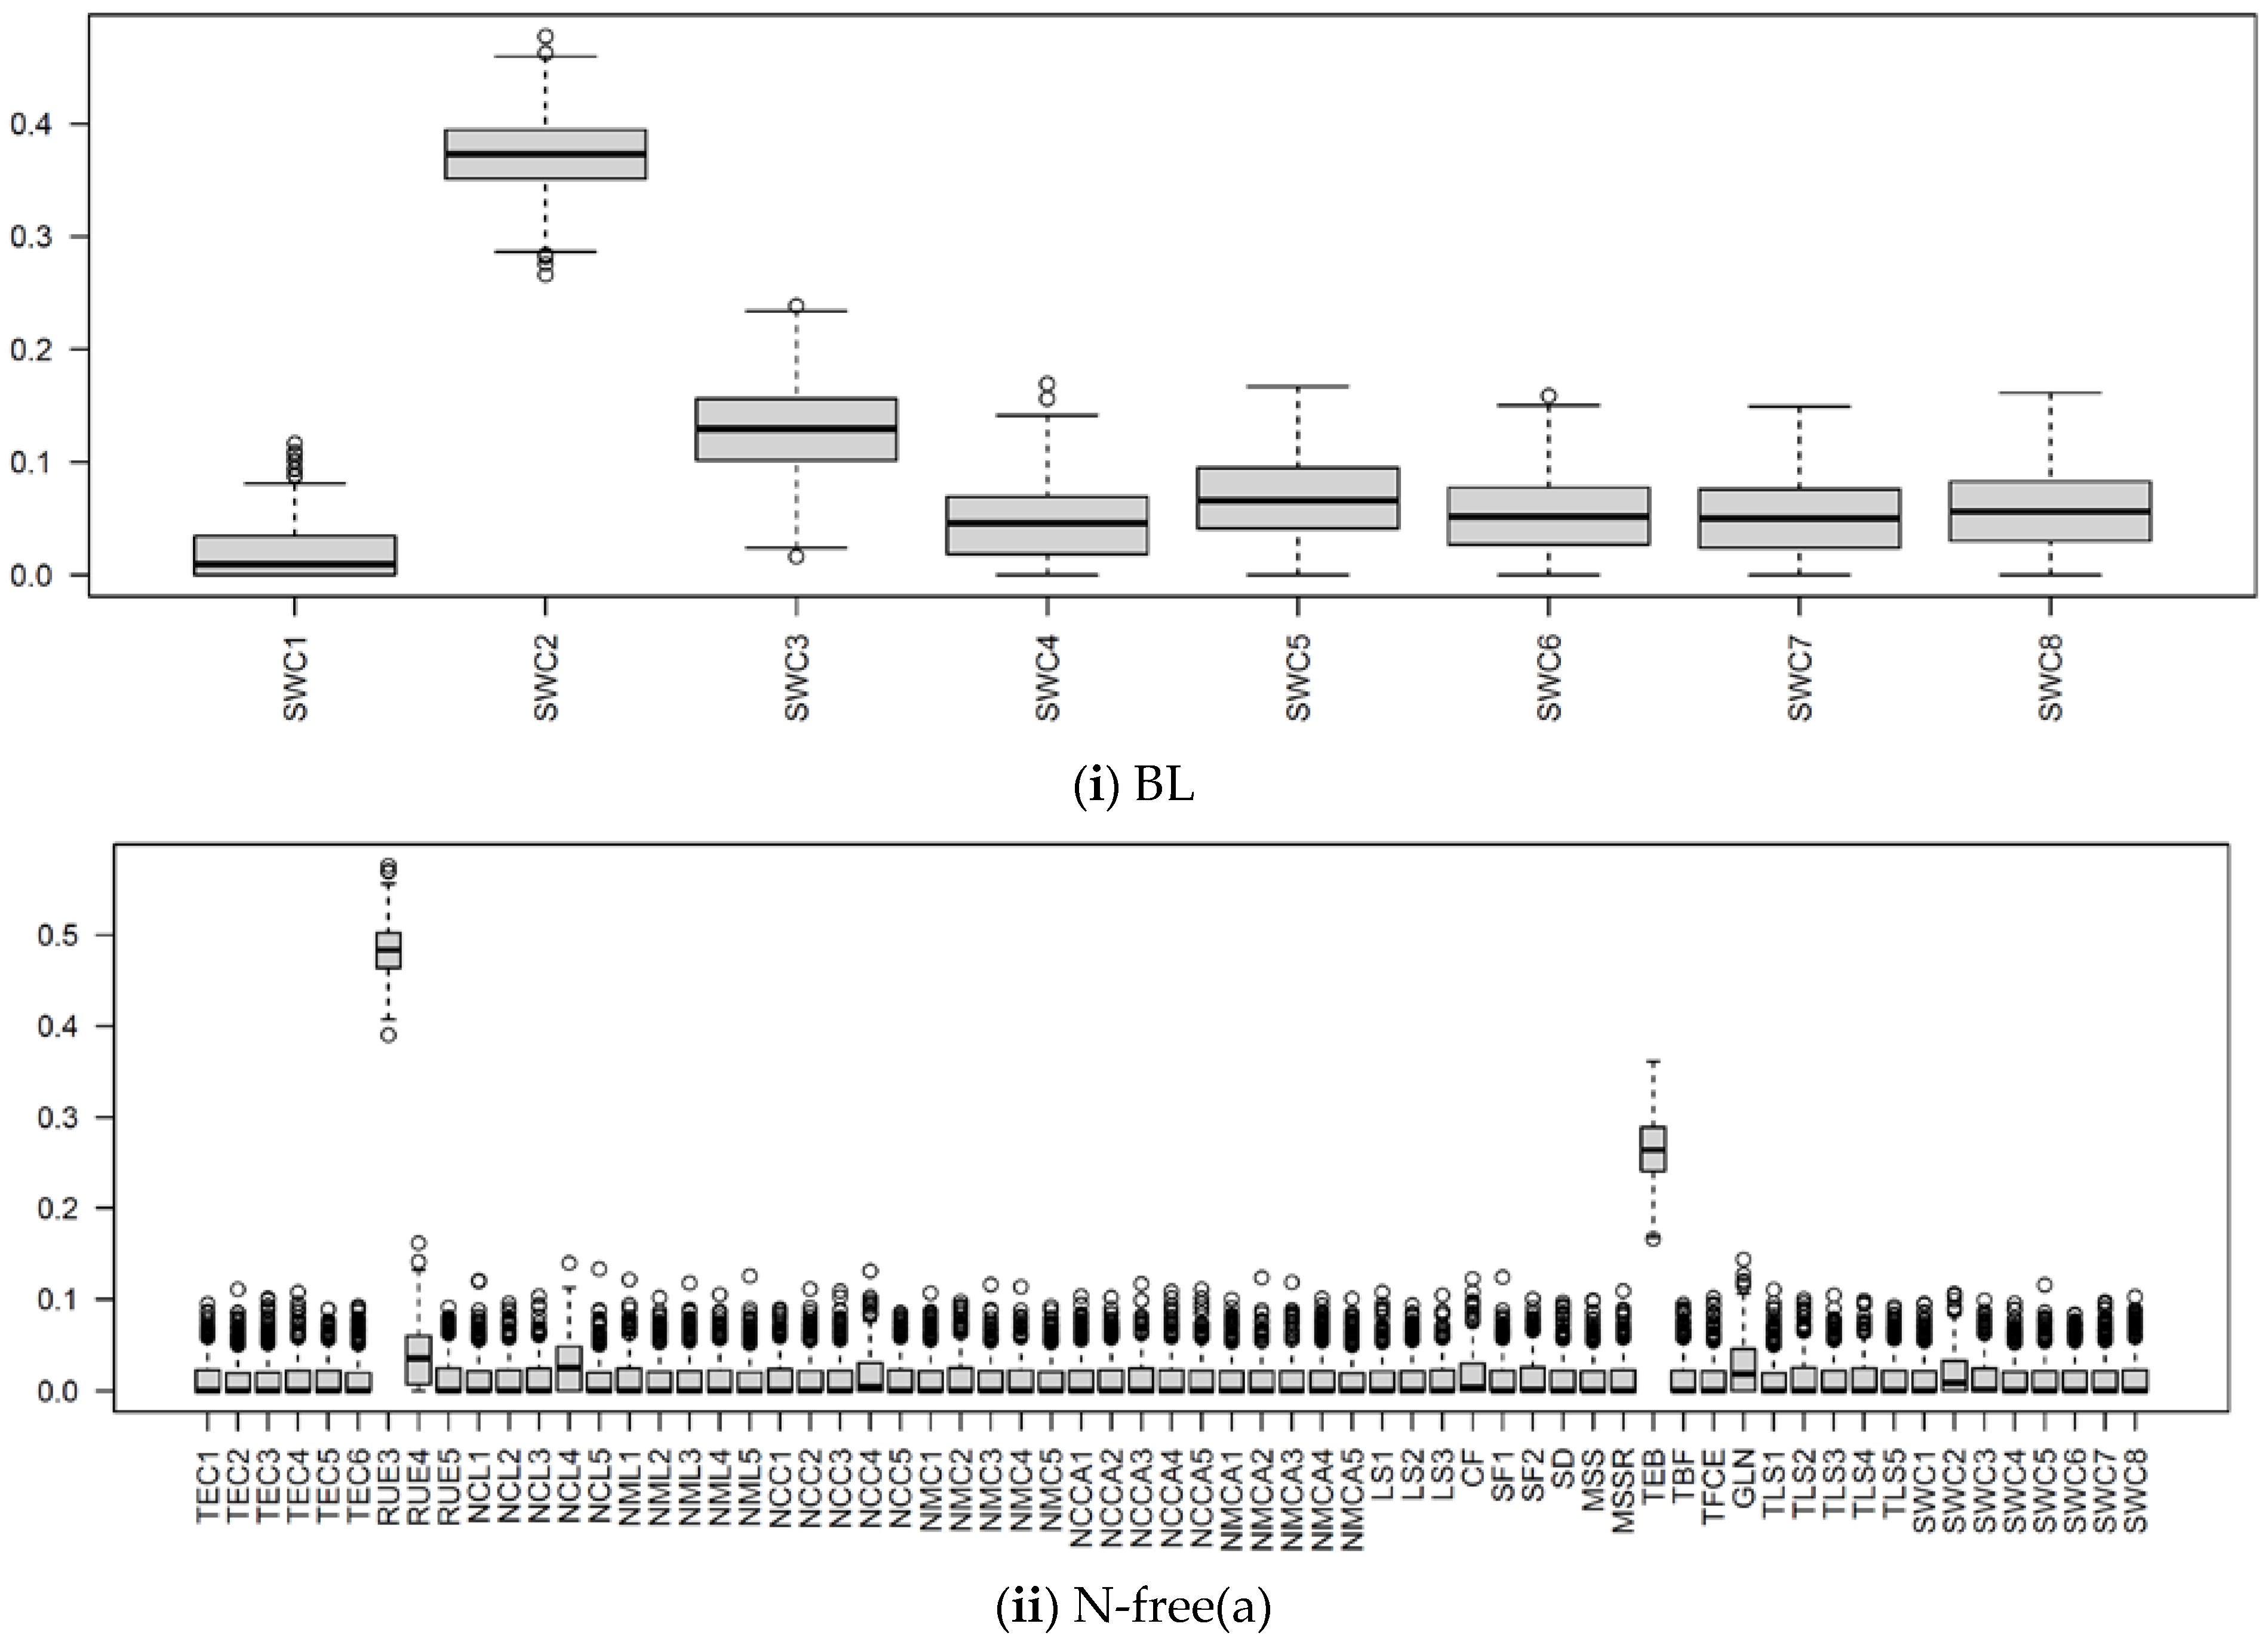
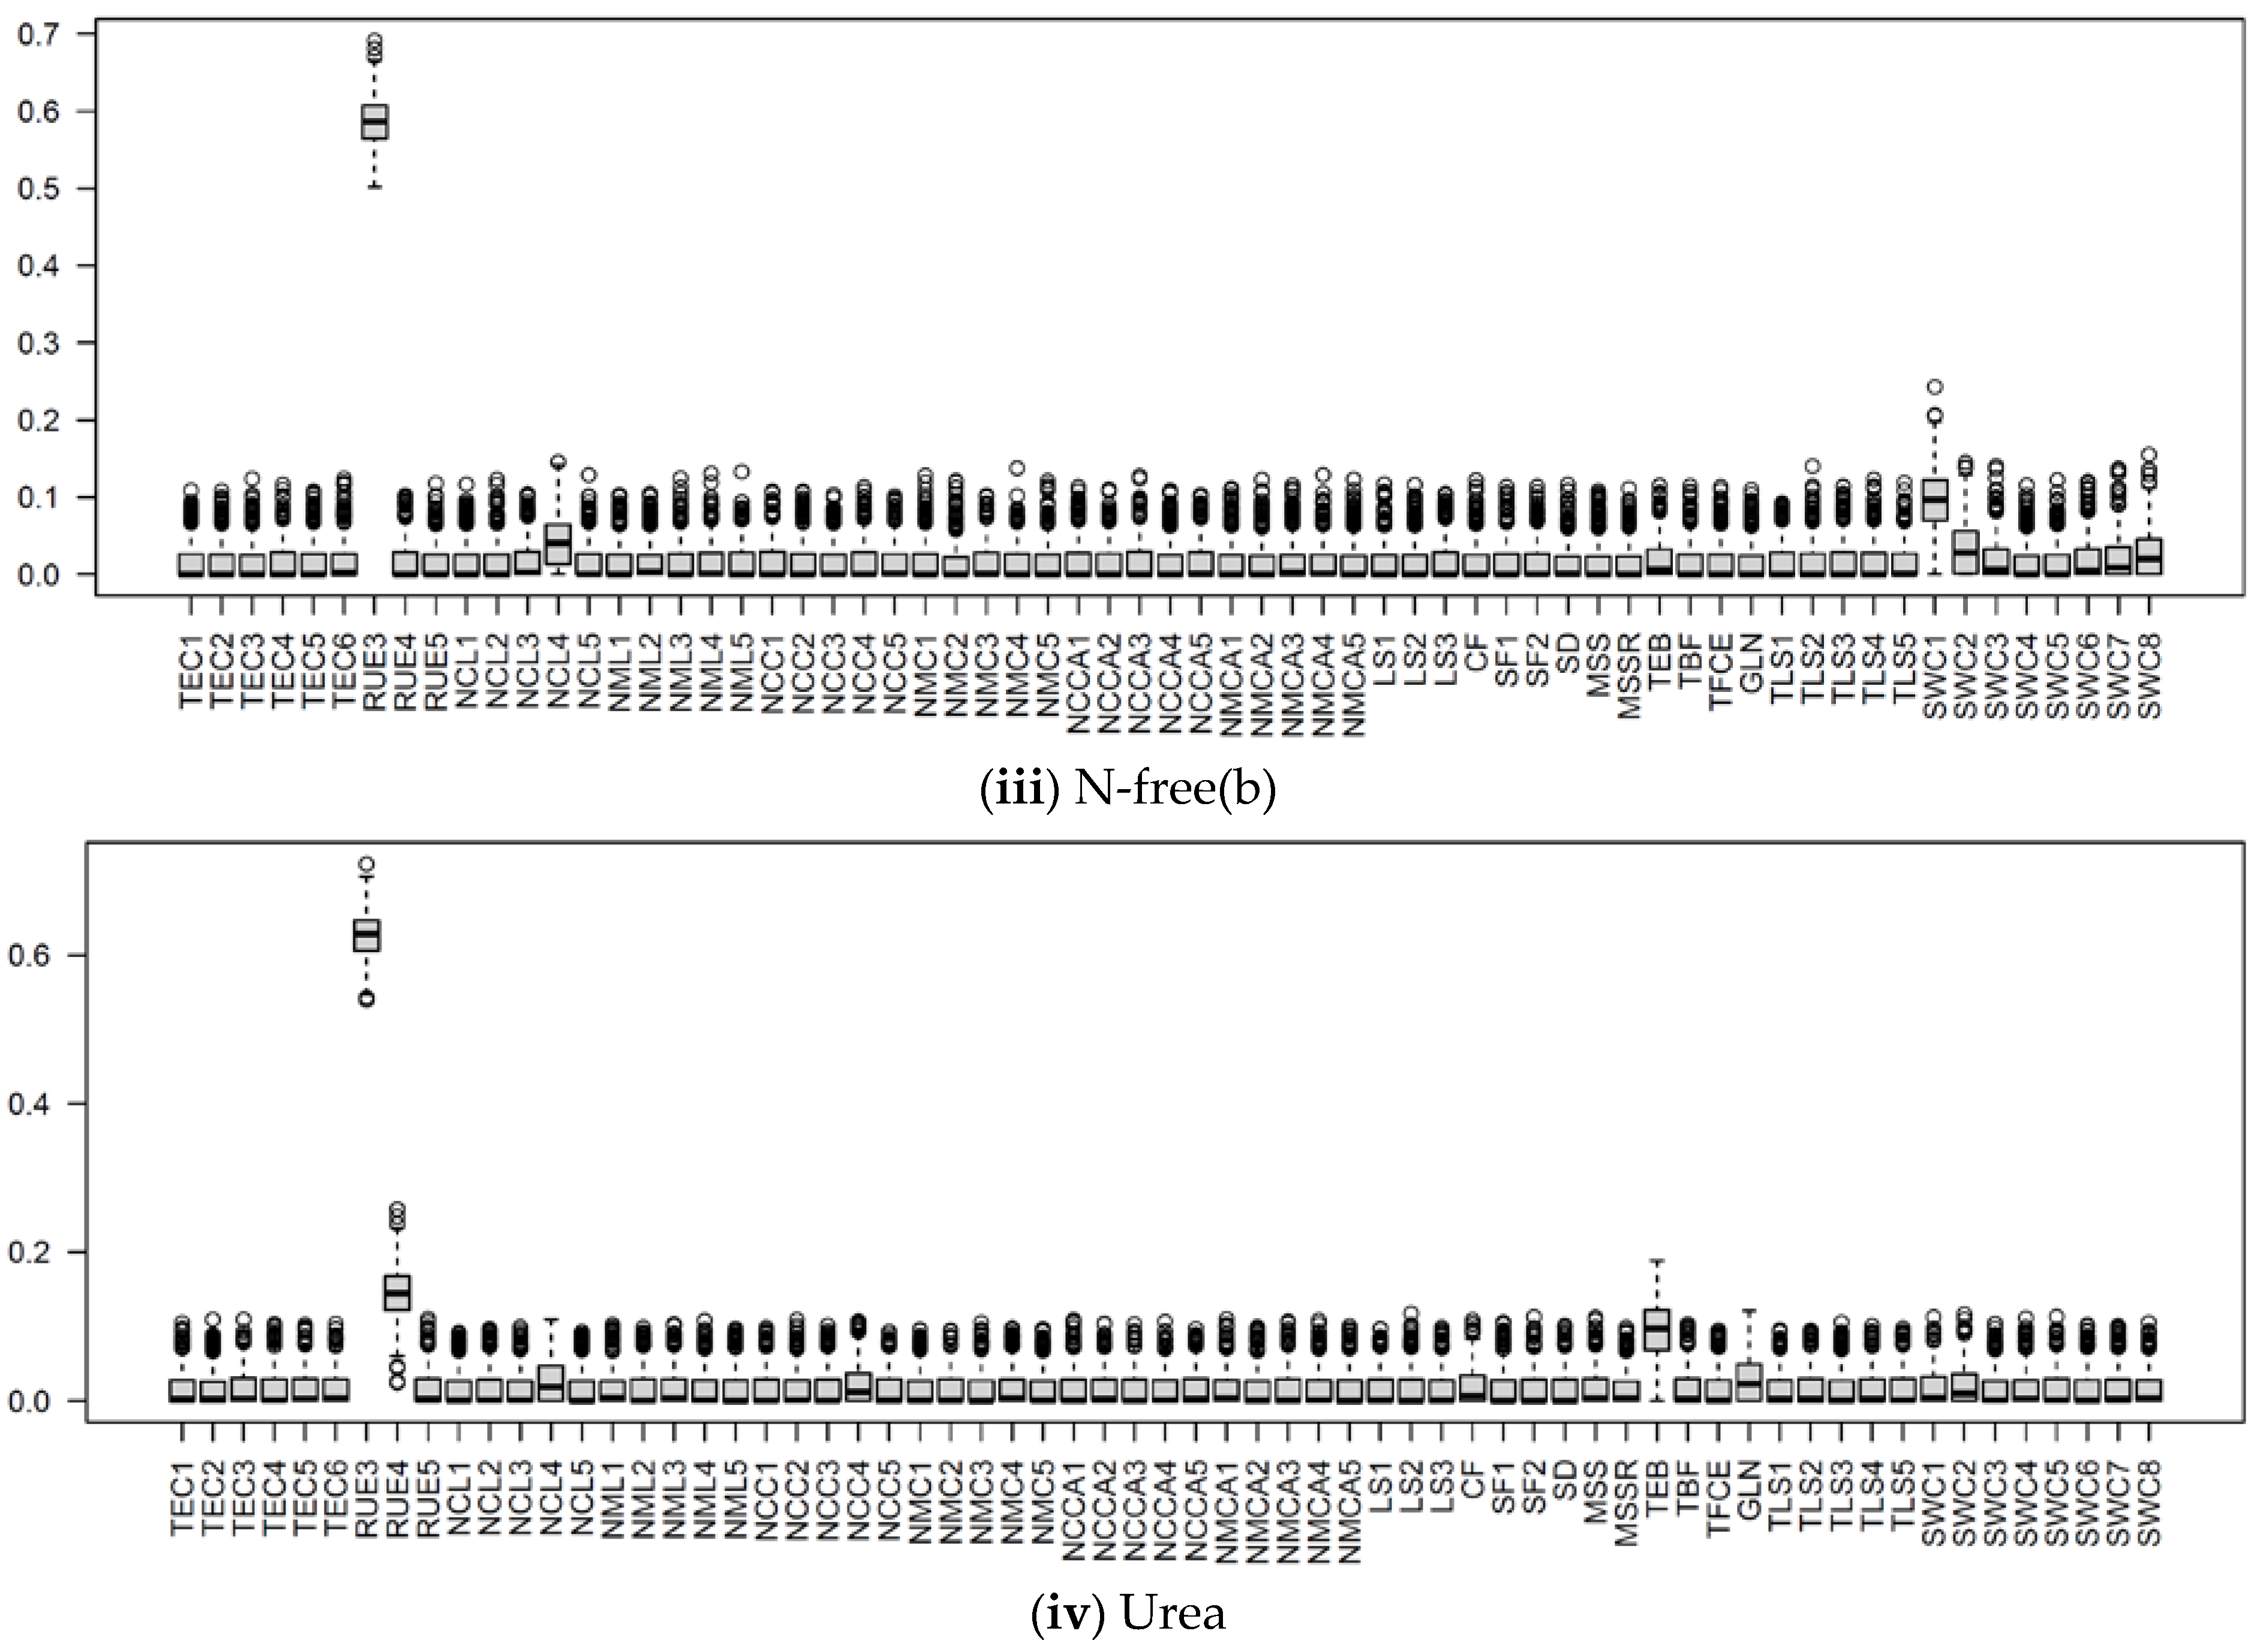
3.2.1. Parameter Sensitivity

The heat maps of sensitivity indices of highly influential parameters (Si ≥ 0.02) for NO3 uptake and leached NO3−N for at least one treatment are shown in Figure 8; other parameters (Table 3) were less influential (Si < 0.02). Figure 9 and Figure 10 show the boxplots of Si of the considered input parameters in the APSIMX-Sugarcane model for the variability of NO3 uptake and leached NO3−N under the fertilizer treatments used.
In the BL condition, we considered the SWCON parameters (parameters related to the rate of flow of water under saturated conditions) of eight soil layers. According to the Si values, the influence of SWCON parameters for leached NO3−N can be ranked from highest to lowest as SWC2, SWC3, SWC5, SWC8, SWC6, SWC7, SWC4, and SWC1 (Figure 8 and Figure 10).
SWCON specifies the proportion of water higher than DUL that could drain from each soil layer per day [77,78]. SWCON is linked to soil hydraulic conductivity and also depends on water storage in near-saturated conditions (SAT–DUL) and soil layer thickness [78]. In APSIMX, the computation of solute redistribution is based on the saturated and unsaturated soil water flows, with the assumption of water and solutes being completely mixed when entering or leaving a soil layer [78]. This explains the strong influence of SWCON on leached NO3−N in BL condition, in which nitrate leaching was determined largely by the soil parameters.
In the urea treatment, SWC2 showed a strong influence for leached NO3−N, whereas SWCON parameters showed a weak influence for NO3 uptake (Figure 8, Figure 9 and Figure 10). In the N-free(a) treatment, SWCON parameters showed a weak influence on both NO3 uptake and leached NO3−N. In the N-free(b) condition, SWC1, SWC2, and SWC5 showed a strong influence on NO3 uptake, and SWC1, SWC2, SWC7, and SWC8 on leached NO3−N (Figure 8, Figure 9 and Figure 10).
The reason for these results may be related to N-stress. In the N-free(b) condition, N-stress was high because of the limited availability of soil N, which would have resulted in lower nitrate uptake and plant growth. Thus, SWCON parameters were highly influential for both NO3 uptake and leached NO3−N in N-free(b), as water movement near the saturation influenced the N balance.
RUE3 was the most influential parameter for NO3 uptake in the N-free(a) and urea conditions and for leached NO3−N in the N-free(a), N-free(b), and urea conditions; it was the second most influential parameter for NO3 uptake in the N-free(b) condition (Figure 8, Figure 9 and Figure 10). RUE4 was the second most influential parameter for NO3 uptake and leached NO3−N in the urea condition and the third most influential parameter in the N-free(a) condition; it was less influential for NO3 uptake and leached NO3−N in N-free(b) (Figure 8, Figure 9 and Figure 10).
In APSIMX-Sugarcane, daily biomass production is driven by rue via radiation interception [8]. Sexton et al. [20] and Gunarathna et al. [42] found that biomass accumulation in APSIM-Sugarcane is most sensitive to rue. In addition, GSA conducted on the APSIMX-Eucalyptus model by Elli et al. [79]; APSIM-Wheat model by Casadebaig et al. [80] also reported rue as one of the most important traits of the crop yield. APSIMX-Sugarcane calculates sugarcane N demand as the product of maximum N concentration in tissue and tissue weight increment [8]. Therefore, being one of the main factors involved in tissue weight increment, rue would affect the sugarcane N demand, which is directly related to N uptake. RUE3 belongs to the phenological stage of ‘emergence to the beginning of cane growth’ and RUE4 to ‘the beginning of cane growth to flowering’ [8]. These two stages are responsible for high sugarcane biomass accumulation and partitioning. Thus, during these stages, high nitrate uptake would result in low nitrate leaching. Further, rue is affected by soil factors [79]; under sufficient water and nutrient availability conditions, sugarcane biomass accumulation is primarily driven by the intercepted solar radiation by the green leaf canopy and the photosynthetic efficiency [81]; plant growth and productivity are affected by N fertilizer by changing the crop canopy size which has an effect on the rue [82]. The results showed that the sensitivity of parameters for the N balance depended on soil N availability. Both RUE3 and RUE4 showed a strong influence on NO3 uptake and leached NO3−N in the urea condition. In N-free treatment, plant N uptake depended solely on soil N. Thus, even in N-free(a) and N-free(b) conditions, RUE3 was highly influential for NO3 uptake and NO3−N leaching during growth stage 3, in which soil N is considerably higher than in later growth stages. RUE4 was highly influential on both NO3 uptake and leached NO3−N in the N-free(a) condition but less influential in the N-free(b) condition. The latter may be explained by N-stress in the high rue parameter range (1.8–2.5) in combination with low soil N availability during growth stage 4, which reduced plant growth.
TEB and GLN parameters were highly influential on NO3 uptake and leached NO3−N in the N-free(a) and urea conditions (Figure 8, Figure 9 and Figure 10). In the N-free(b) condition, GLN was influential on NO3 uptake but had no influence on leached NO3−N, while TEB was less influential on NO3 uptake and leached NO3−N (Figure 8, Figure 9 and Figure 10).
Peng et al. [13] found that TEB and GLN parameters were amongst the most sensitive parameters for sugarcane stem dry weight, fresh weight, sucrose dry weight, and LAI. APSIMX-Sugarcane drives phenological development and canopy expansion using thermal time [8]; the latter is regulated by thermal time with a base temperature of 9 °C [83]. The range from 1200 °C days to 1800 °C days is defined as the duration of thermal time between emergence and the beginning of stalk growth (TEB) [8]. During the first 1400 °C days from emergence, the stalk number rapidly increases, peaks, decreases, and then stabilizes [84]. Higher stalk number and subsequent nitrate uptake during phenological stage 4 would explain the strong influence of TEB on NO3 uptake and leached NO3−N in the N-free(a) and urea conditions. GLN parameter with a combination of leaf areas and tillering factors according to the leaf numbers derives the LAI [83]. The GLN parameter is one of the most influential parameters for biomass in APSIMX-Sugarcane in different production environments [20]. Extreme conditions of air temperature, nitrogen deficiency, water deficit, or surplus affect rue and canopy expansion [83]. The above reasons confirm the strong influence of GLN on NO3 uptake and leached NO3−N in the N-free(a) and urea conditions and on NO3 uptake in the N-free(b) condition. N-stress conditions in N-free(b) possibly caused the weak influence of TEB on NO3 uptake and leached NO3−N and of GLN on leached NO3−N.
NCL4 was highly influential for NO3 uptake and leached NO3−N in the N-free(a), N-free(b), and urea conditions (Figure 8, Figure 9 and Figure 10). NCC4 was highly influential for NO3 uptake in the N-free(a) and urea conditions and for leached NO3−N in the urea condition (Figure 8, Figure 9 and Figure 10). The vegetative growth of a crop is directly influenced by the soil N availability [85]. In APSIMX-Sugarcane, NCL4 and NCC4 are categorized as parameters that influence sugarcane growth. In APSIMX-Sugarcane, (i) minimum N concentration is the N concentration in a particular plant part required for the formation of plant structure, and this N is not re-translocatable; (ii) critical N concentration is the minimum N concentration that a particular plant part demands; and (iii) maximum N concentration is the N accumulation capacity of a particular plant part up to a maximum N threshold [8]. Sugarcane growth is influenced by green leaf N concentration and only when it decreases below a critical level [8]. The abundant N uptake observed in Sugarcane [59] is simulated by the difference between the maximum and critical leaf N concentrations. The increased leaf area and photosynthesis rate in the initial growth stages increase the crop N demand; in conditions with sufficient soil N supply, the tissue N concentrations are increased [85]. Because crop growth is influenced by critical leaf N concentration, NCL4 became highly influential for NO3 uptake and leached NO3−N in the N-free(a), N-free(b), and urea conditions in stage 4. NCC4 was influenced only on NO3 uptake in no or low N-stress conditions (i.e., urea and N-free(a)) and leached NO3−N in the urea condition, but it was not influential in the N-stressed N-free(b) condition.
CF was an influential parameter for NO3 uptake in the N-free(a), N-free(b), and urea treatments (Figure 8, Figure 9 and Figure 10). CF governs the partitioning of accumulated biomass to cane. Bandara et al. [41] found that CF had a strong influence on cane dry weight in APSIM-Sugarcane; Gunarathna et al. [42] found that CF influences biomass in APSIM-Sugarcane. The phenological stage 4 in APSIMX-Sugarcane partitions 0.7 of above-ground biomass to the stalk [81]. After the accumulated stalk biomass reached a minimum, the daily biomass is partitioned to the structural component of millable stalk and sucrose content of millable stalk, based on the framework developed by Robertson et al. [81] and Muchow et al. [86], as mentioned in Keating et al. [8]. In addition, N-stress conditions also cause for limiting the biomass partitioning in the stem [8]. These reasoned the strong influence of CF on NO3 uptake.
In the APSIMX-Sugarcane model, SWCON parameters were highly influential for leached NO3−N in the BL condition. The plant- and cultivar-specific parameters were most influential for NO3 uptake and leached NO3−N in the N-free(a) and urea conditions. In addition to plant and cultivar-specific parameters, SWCON parameters were highly influential for NO3 uptake and leached NO3−N in the N-free(b) condition. Liang et al. [27] found that crop parameters had a strong influence on crop yield and nitrate leaching. In general, according to the Si values, the influence of parameters was greater in the urea condition than in the N-free(a) and N-free(b) conditions for NO3 uptake and leached NO3−N. RUE3 and RUE4 had a stronger influence in urea treatment than in N-free(a) and N-free(b) treatments for NO3 uptake and leached NO3−N. The influence of TEB in N-free(a) was stronger than in N-free(b) and urea treatments for NO3 uptake and NO3−N leaching, while that of GLN in N-free(b) was stronger than in N-free(a) and urea for NO3 uptake. The influence of other influential parameters on the model outputs was more or less similar in all conditions. All other considered parameters in each treatment were less influential on NO3 uptake and leached NO3−N.
These results confirmed that the parameters that influence nitrate balance in APSIMX-Sugarcane depend on N-stress.

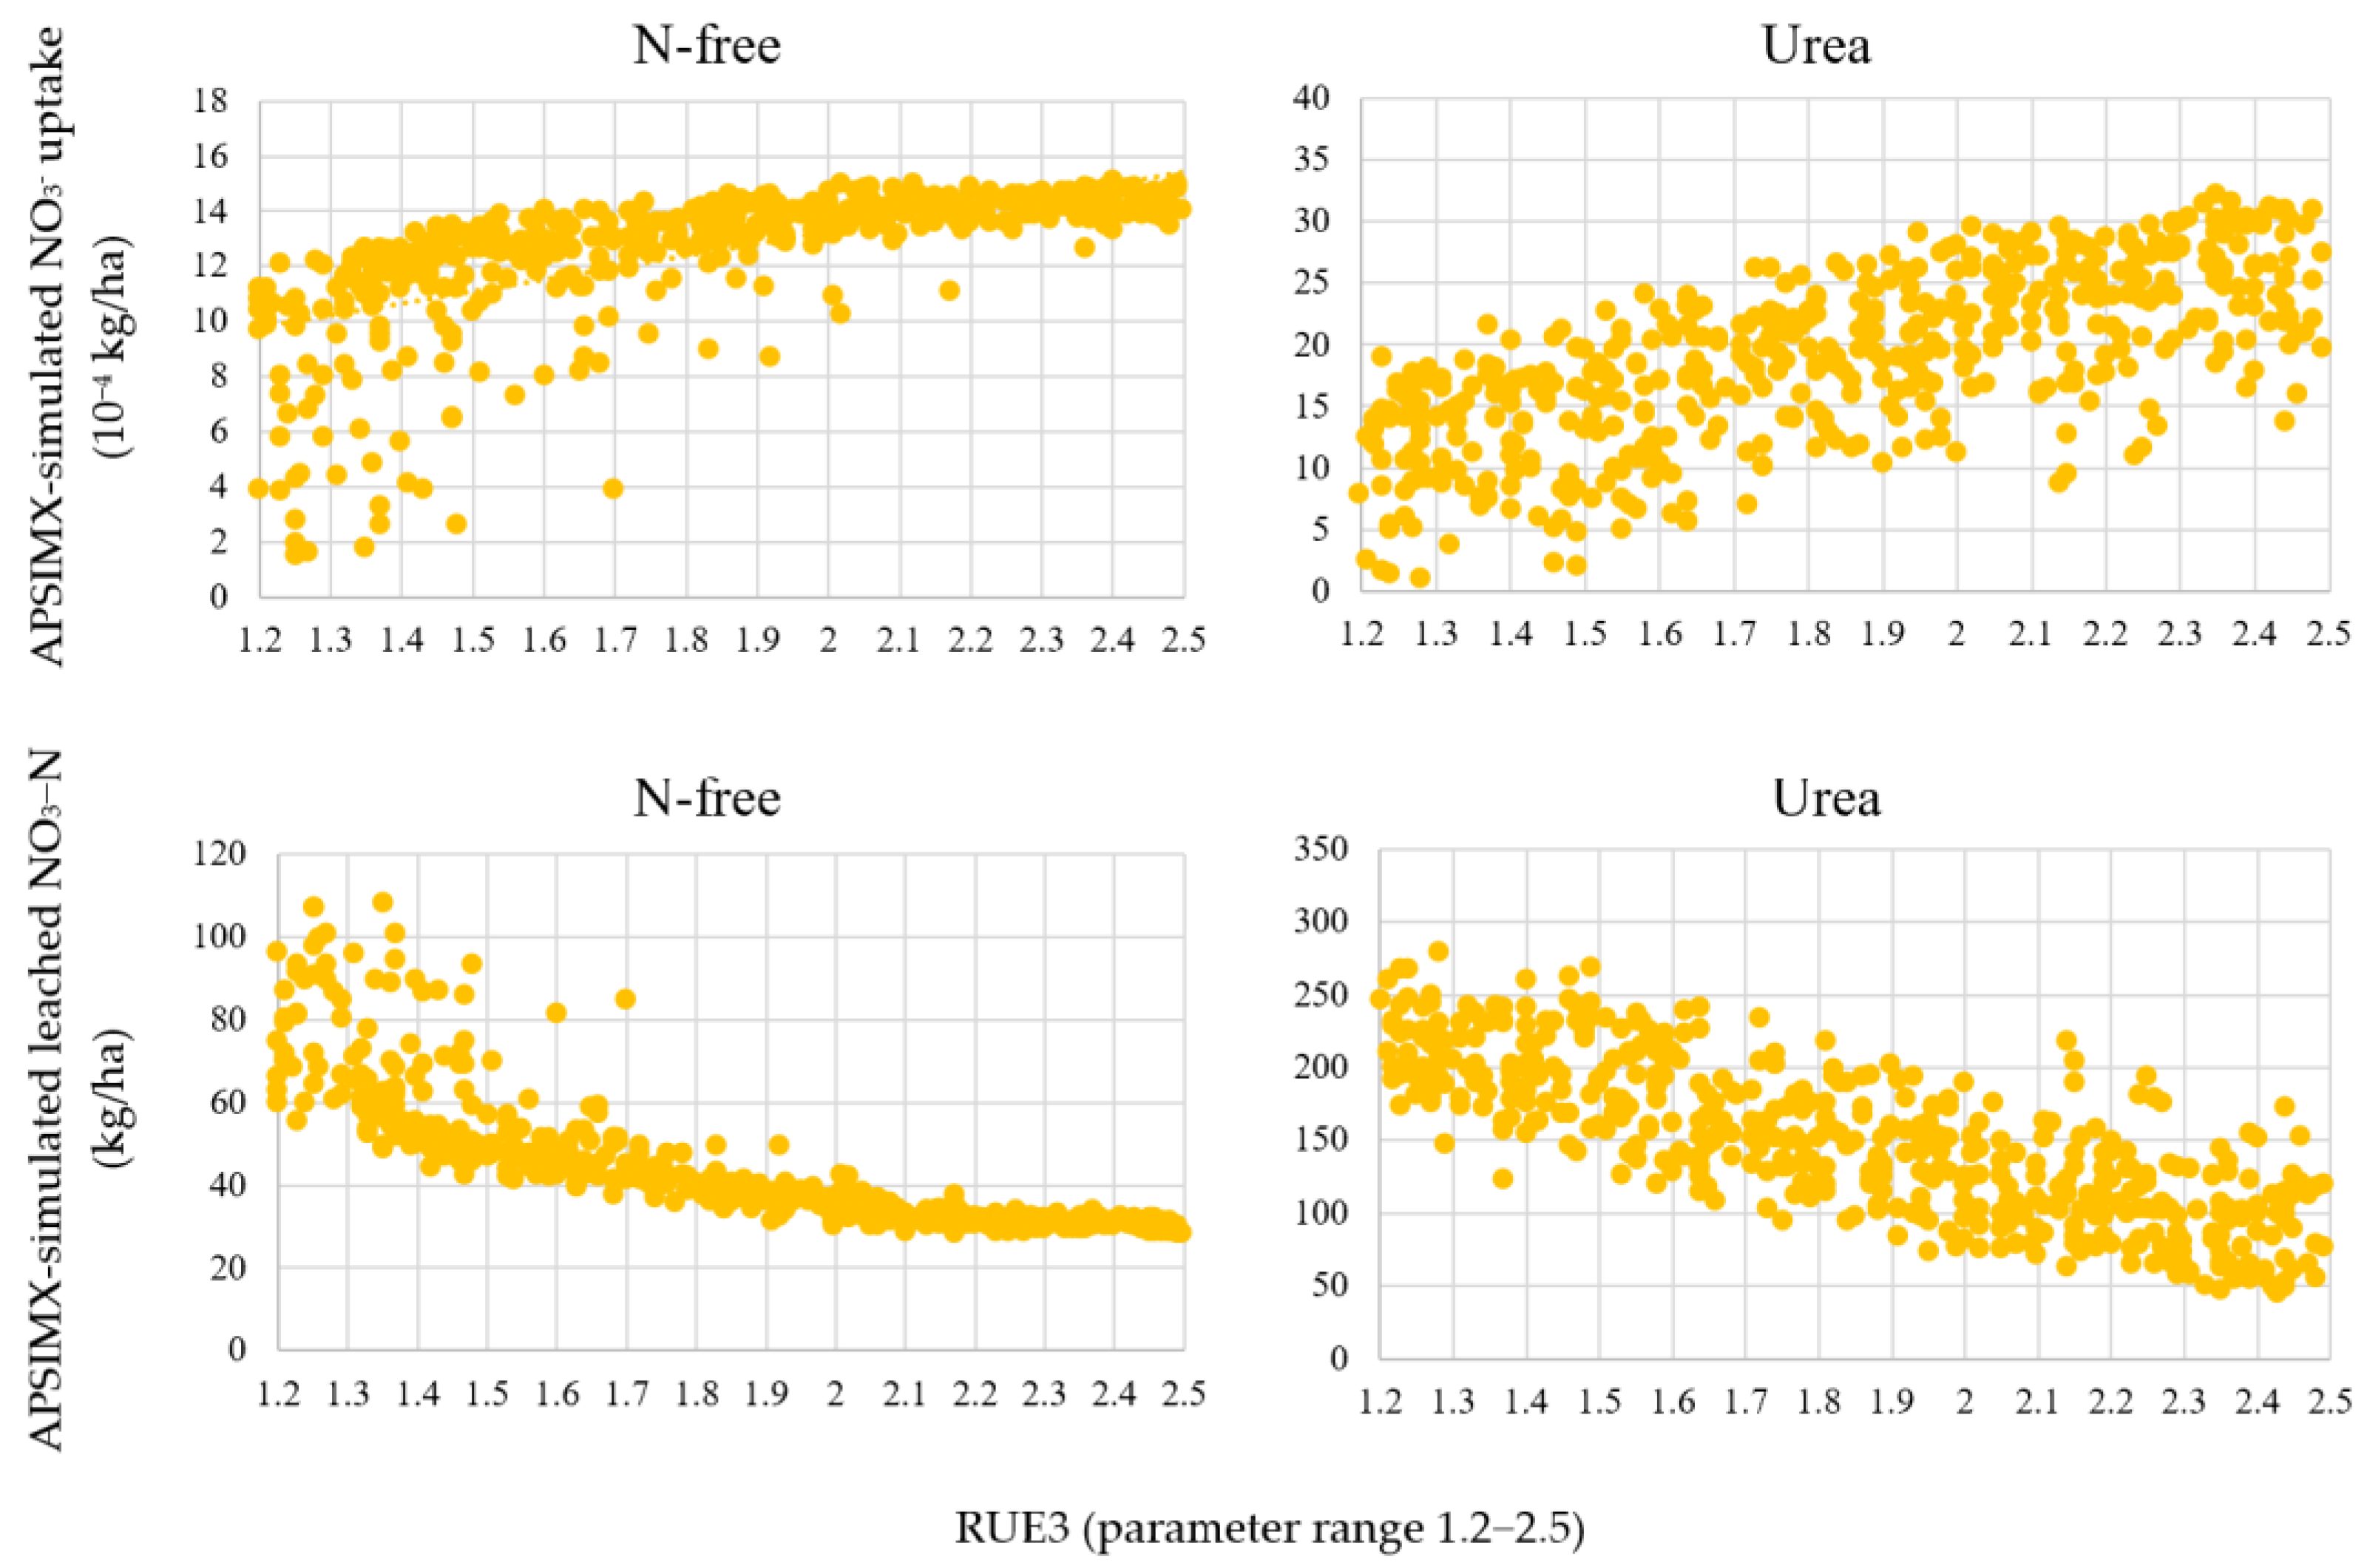
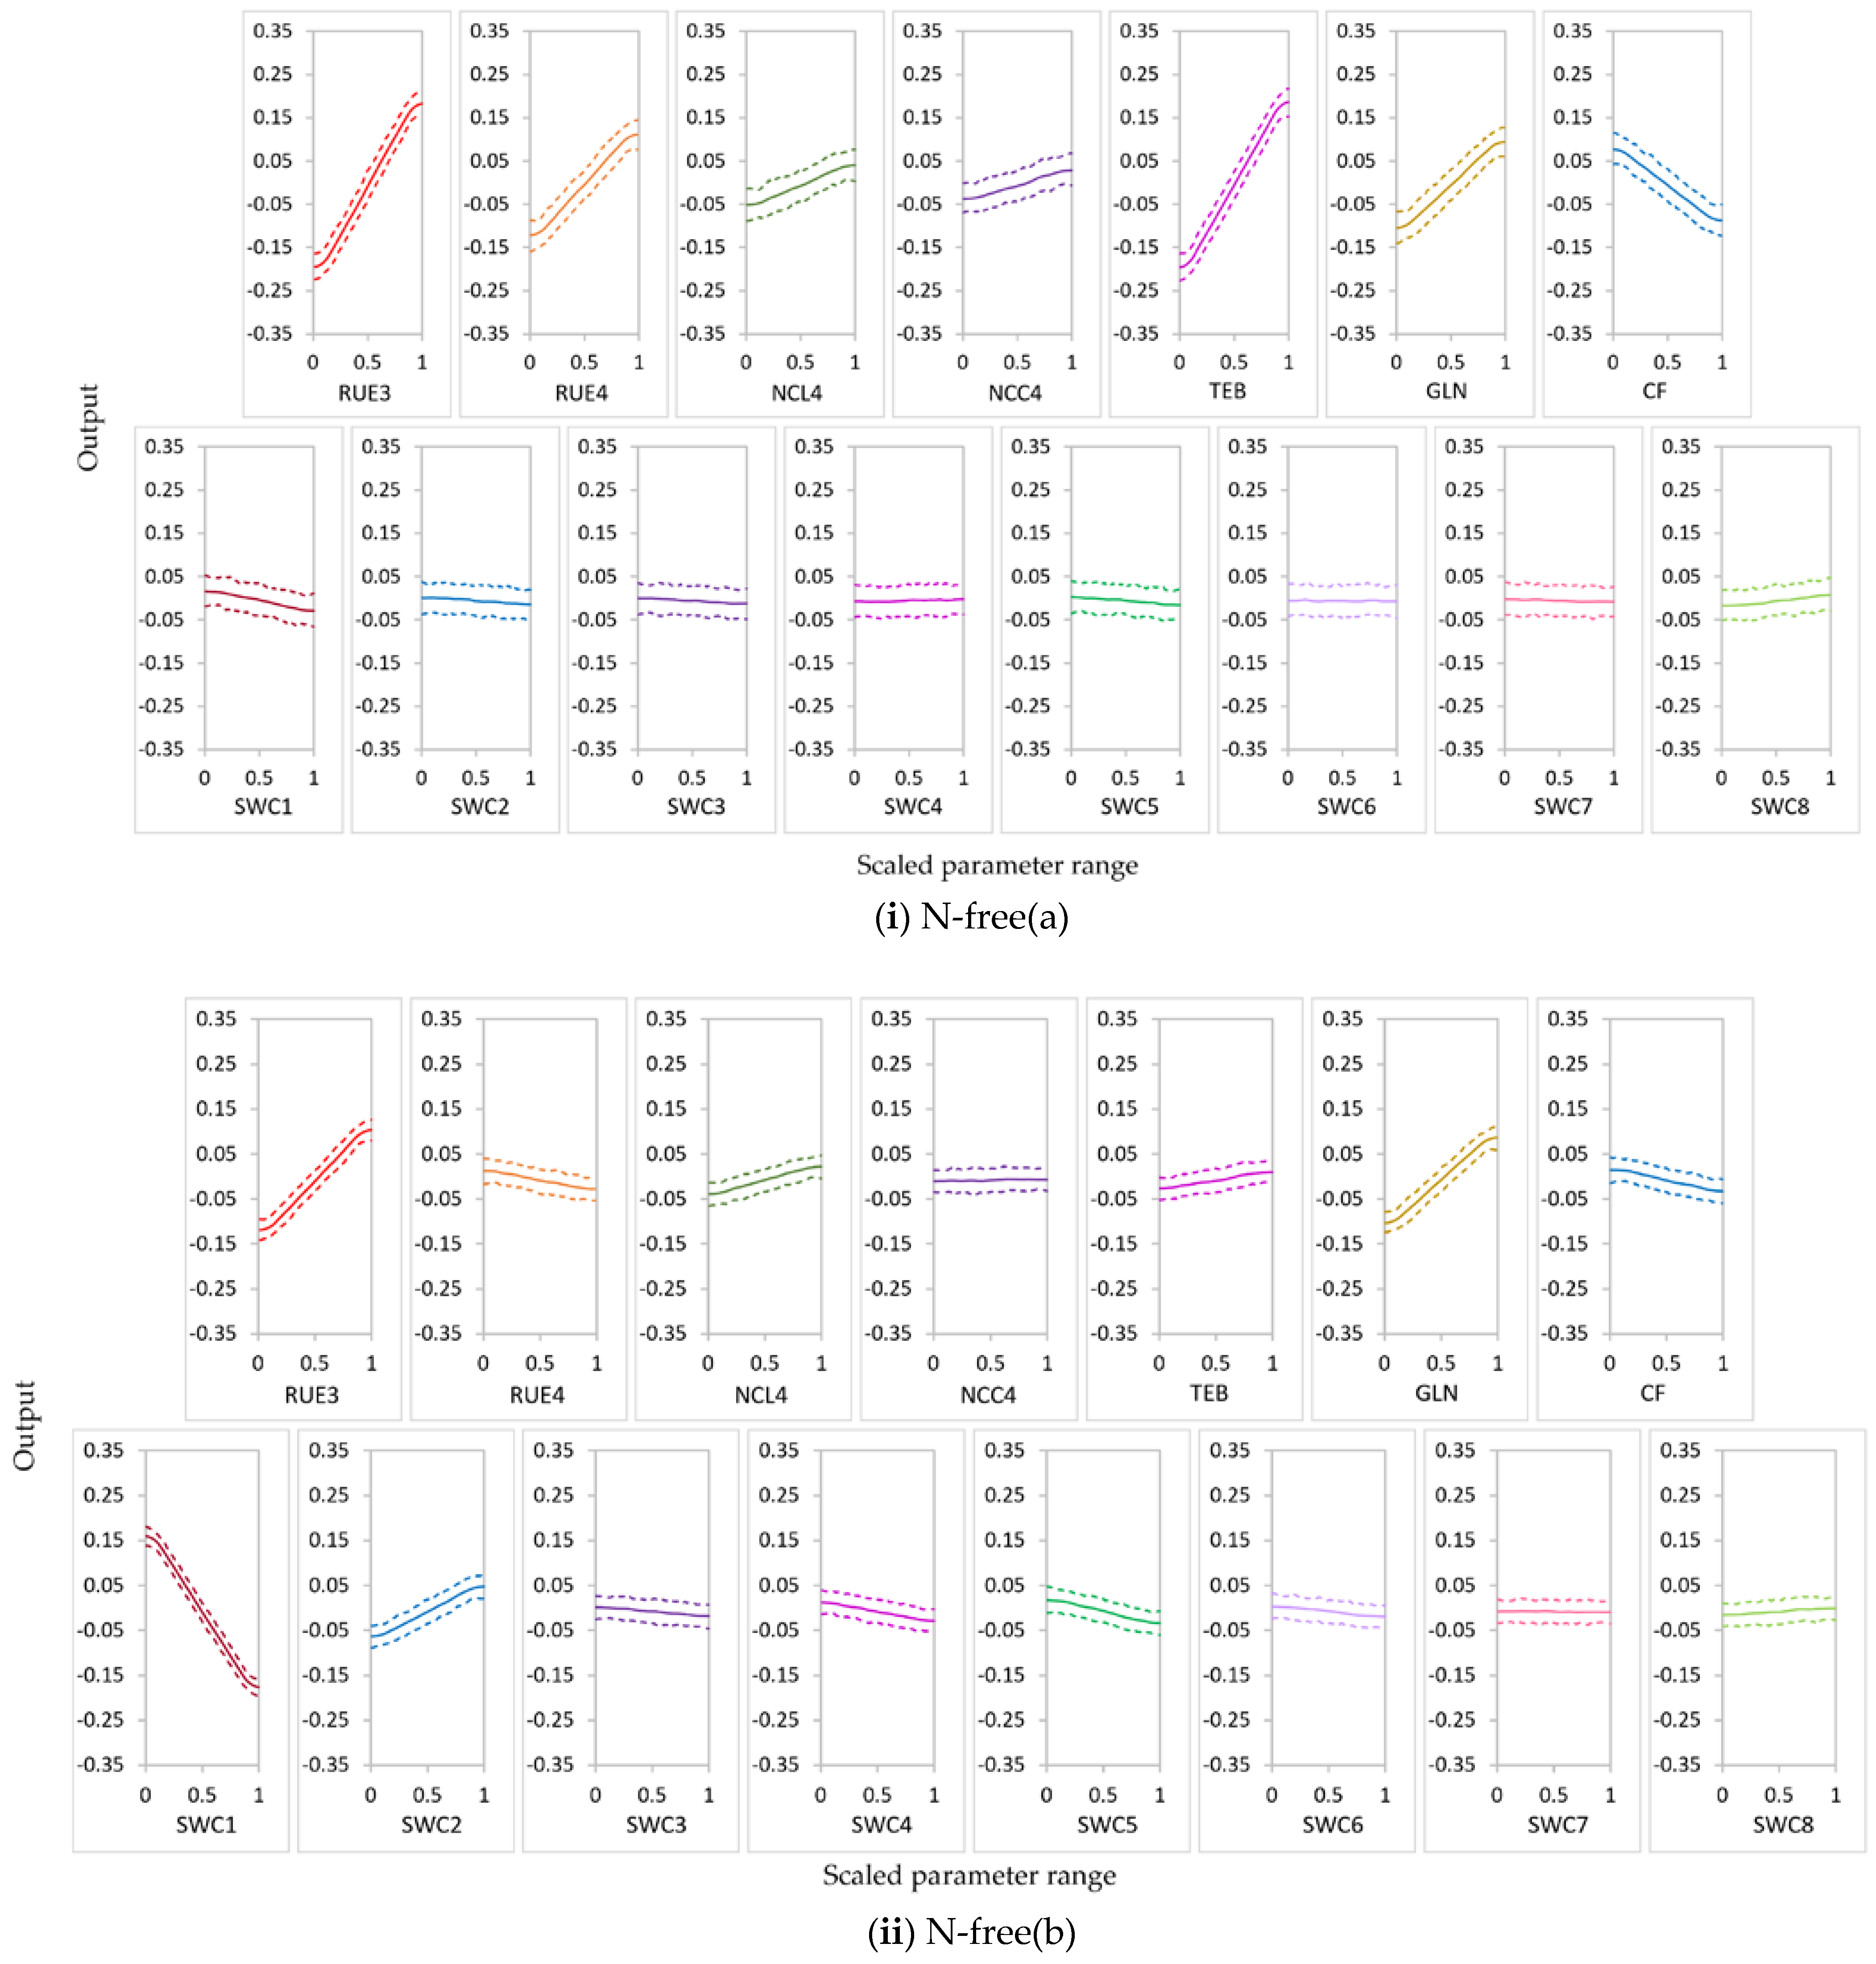
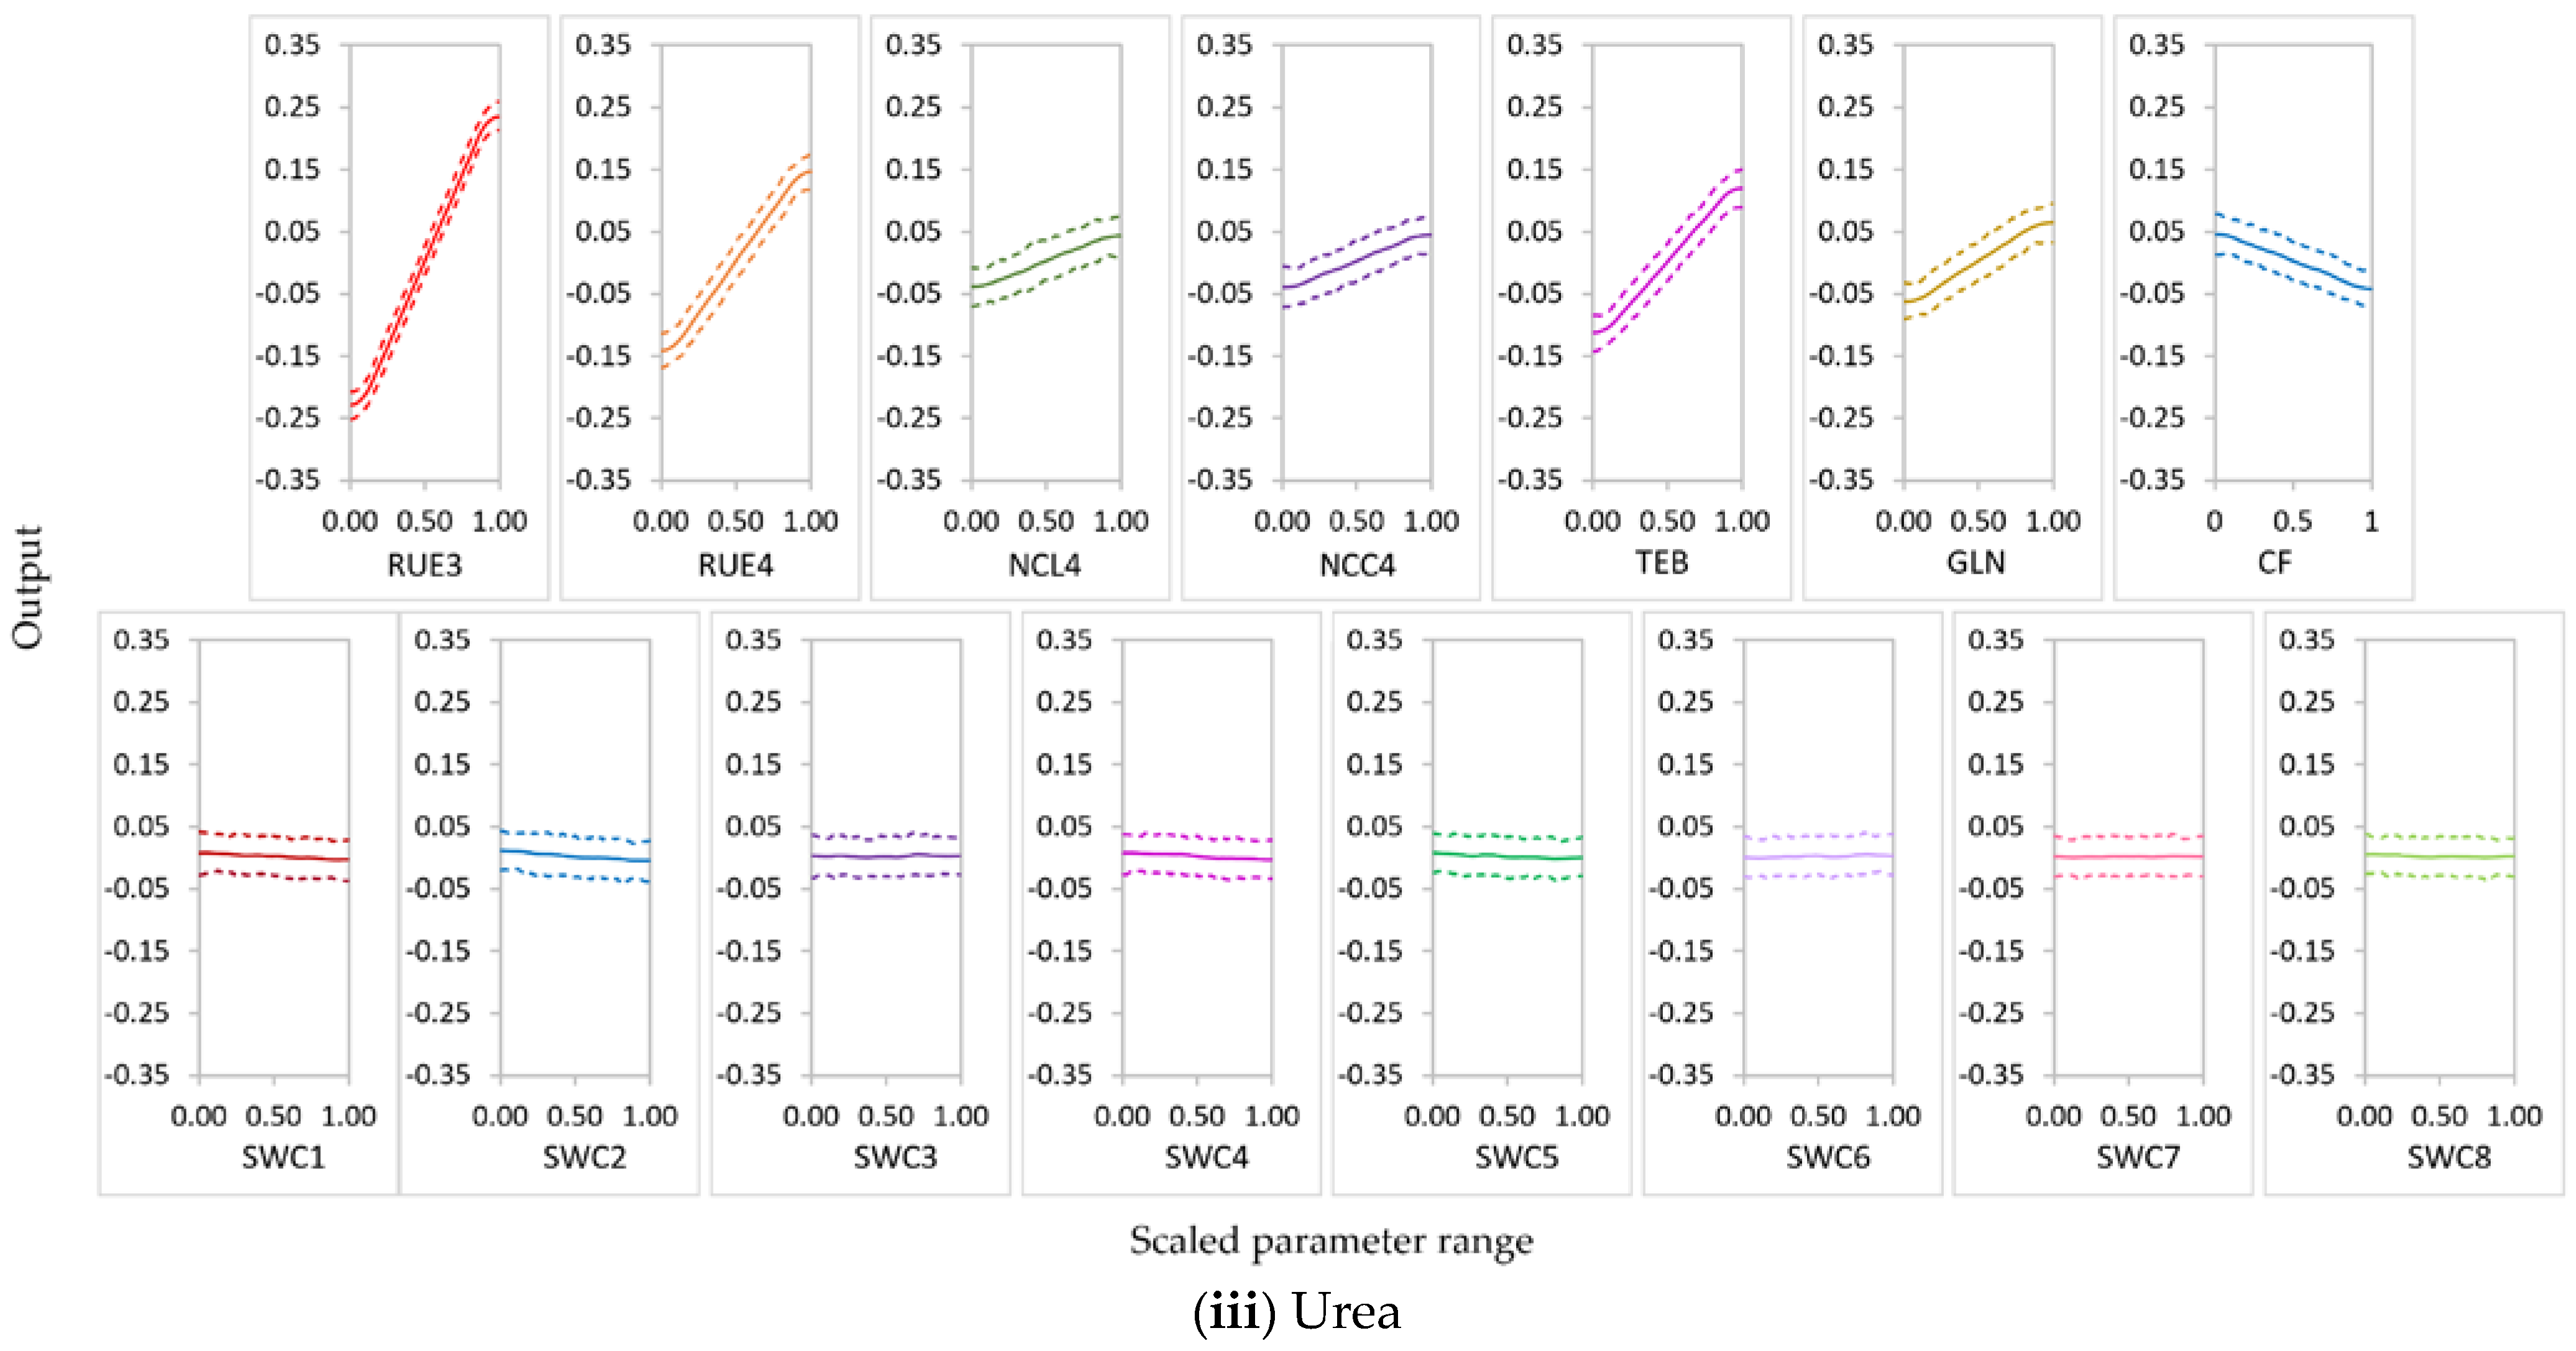
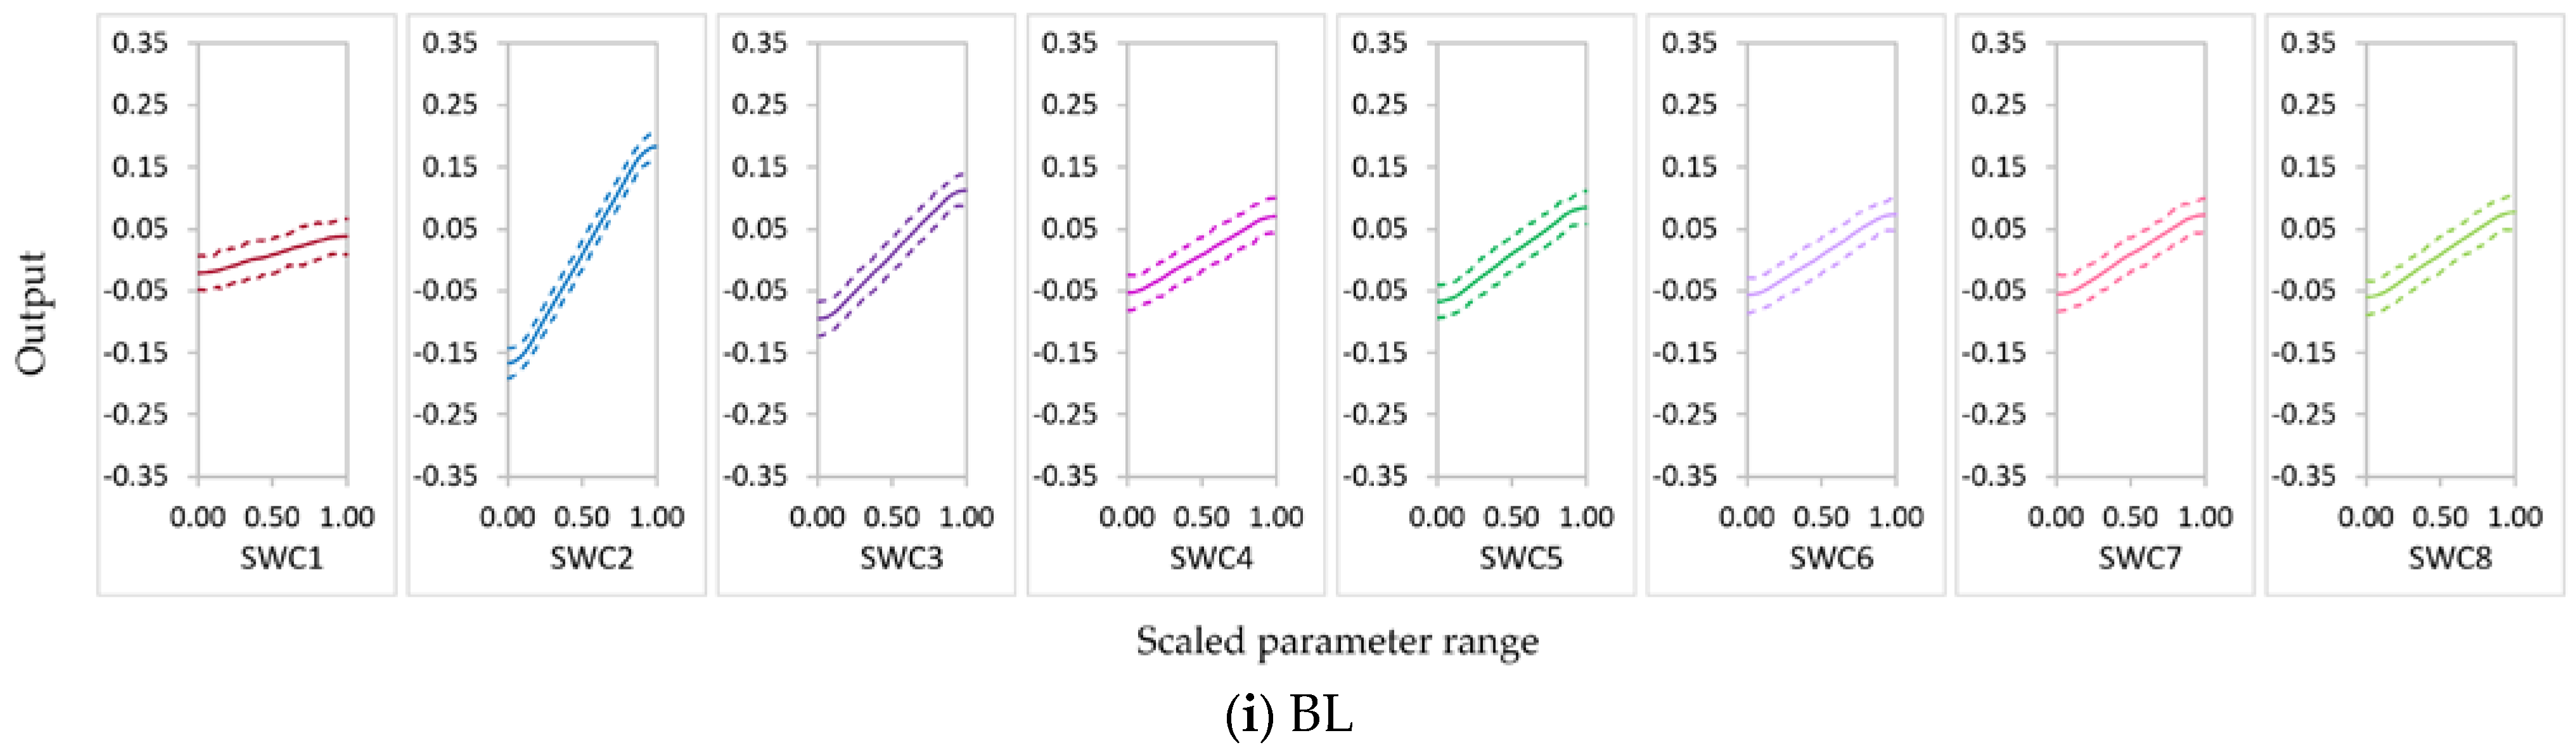
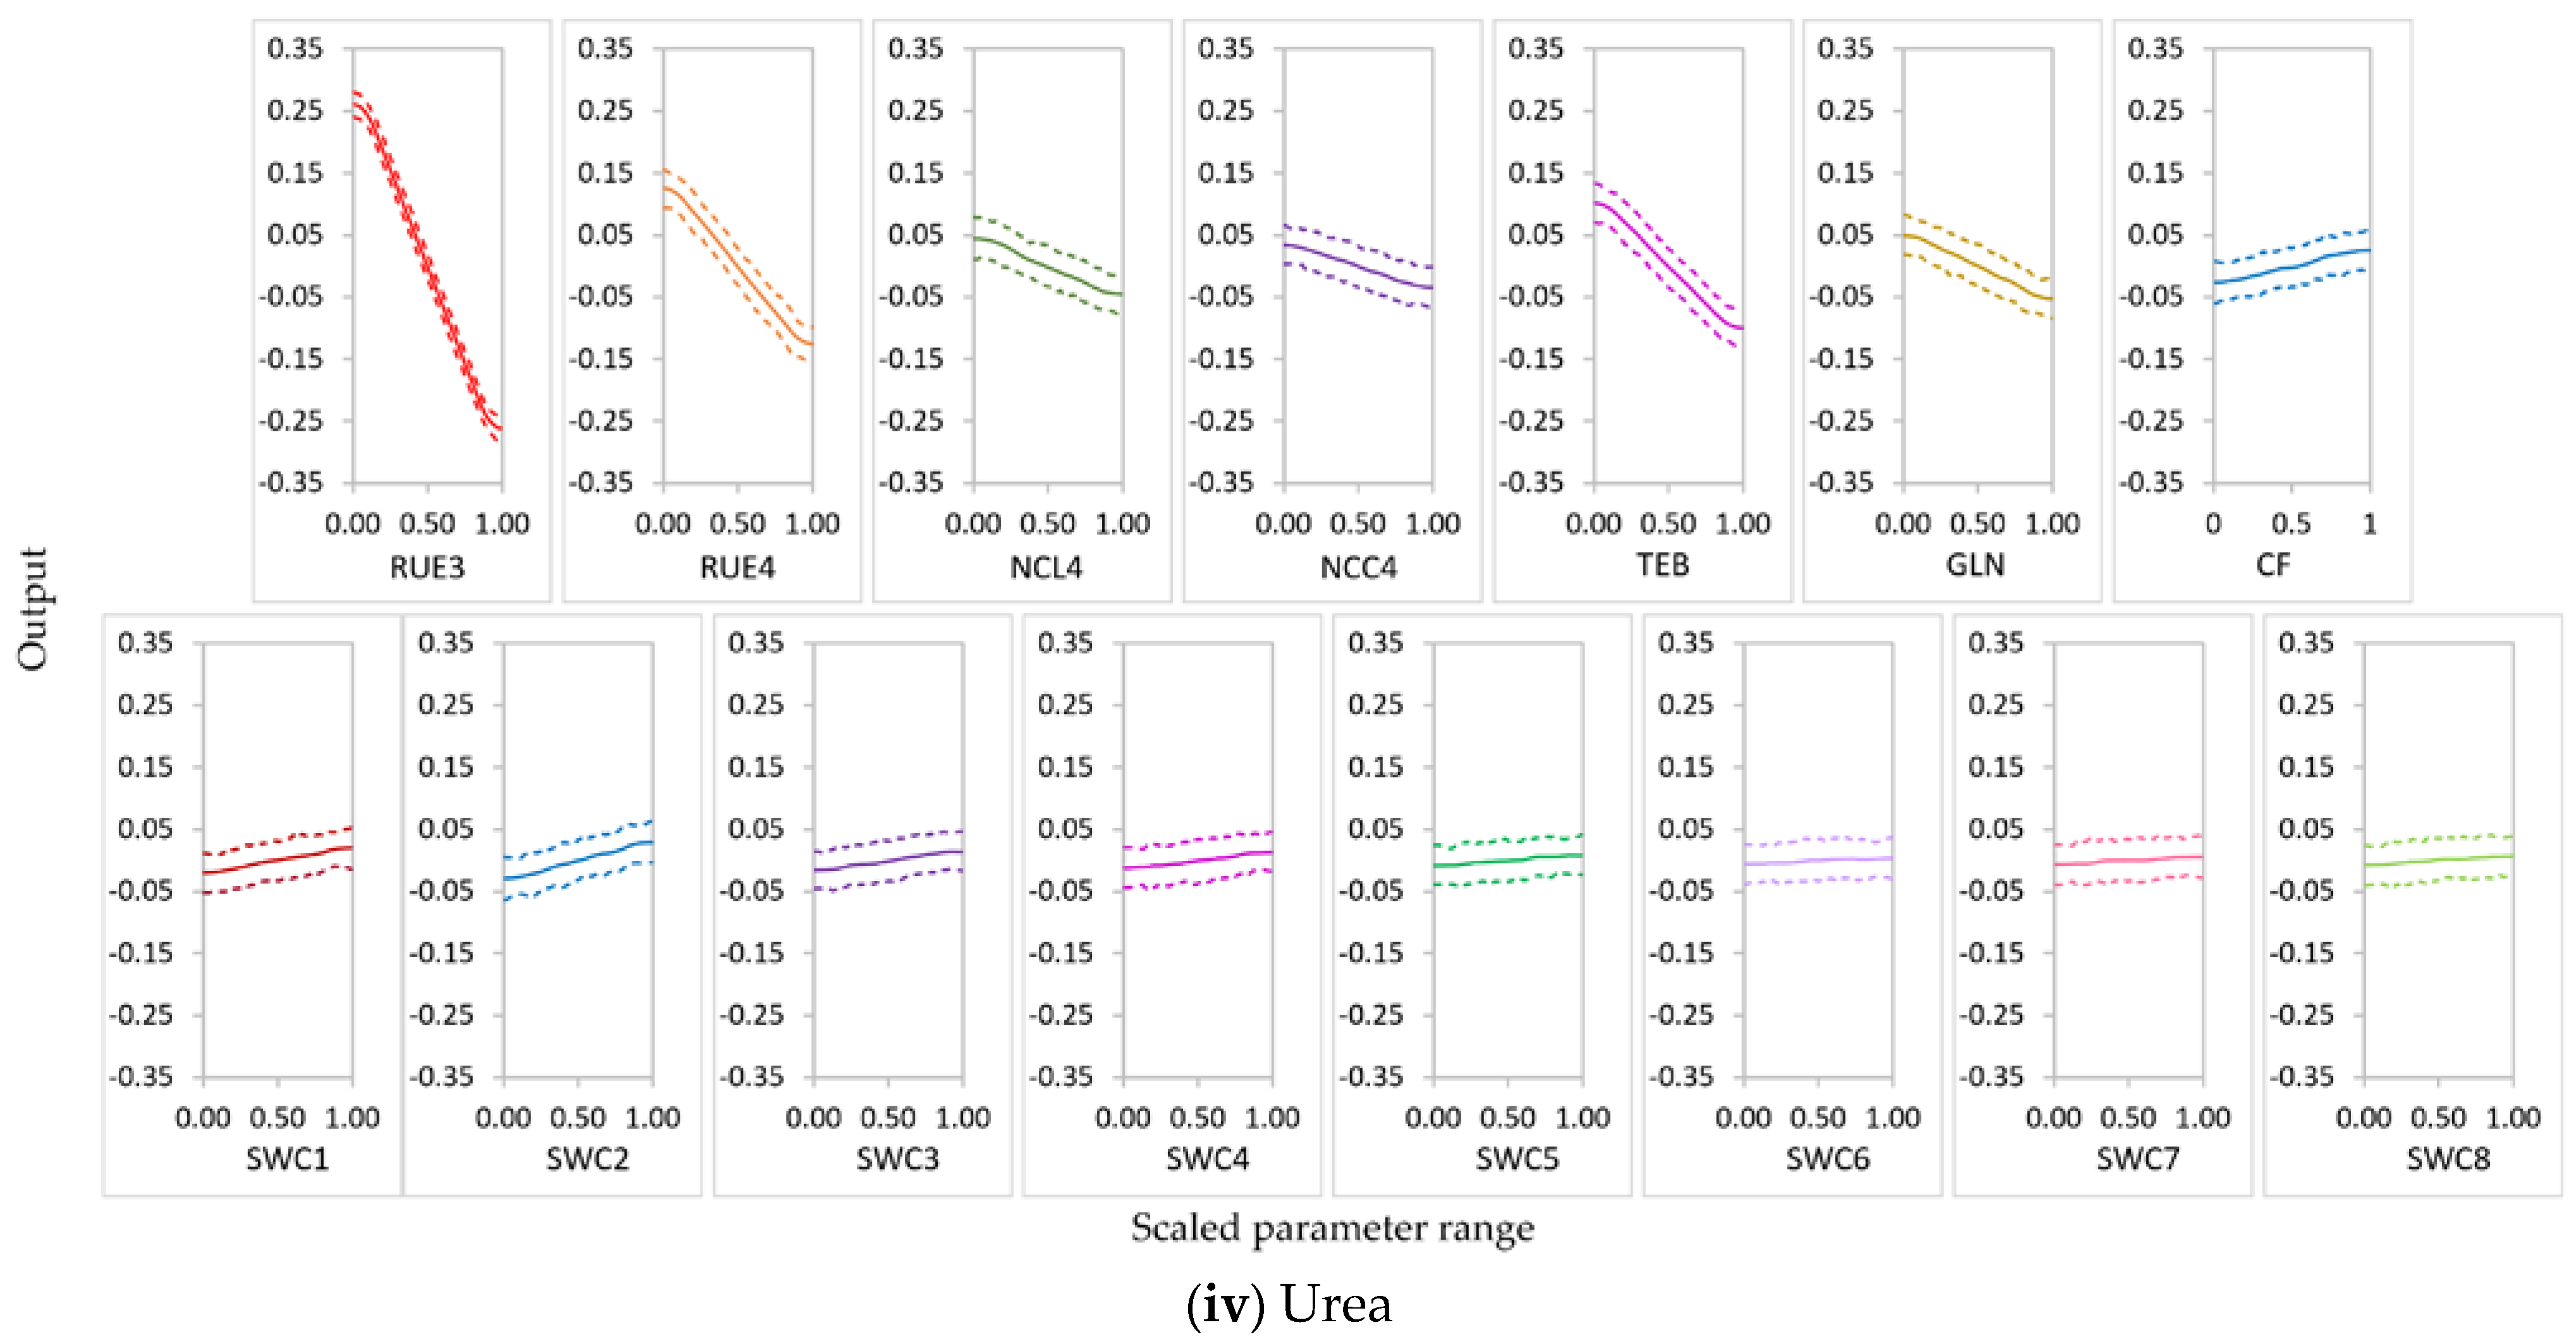
3.2.2. Behavior of Highly Influential Parameters

In order to improve model simulations, it is important to understand how the model output responses vary with changes in influential parameters. We further analyzed the responses of NO3 uptake and leached NO3−N to the variations in highly influential parameters. Plots of the main effects (with 90% intervals) of highly influential input parameters (Si ≥ 0.02 for at least one treatment) on NO3 uptake and leached NO3−N are shown in Figure 11 and Figure 12.
Calibration of SWCON parameters would be of great importance in modeling nitrate balance in sugarcane systems. In the BL condition, NO3−N leaching increased with an increase in SWCON values. In the N-free(b) condition, NO3 uptake decreased with an increase in SWC1. Leached NO3−N increased with an increase in SWC1–SWC3 in the conditions under which these parameters were influential. Thus, particular care is needed when setting the values for SWCON, especially SWC1–SWC3, in the APSIMX-Sugarcane model. We highly recommend model calibration using site-specific measurements of SWC1–SWC3. However, there is a lack of data available on SWCON because measuring this parameter is costly and time-consuming. Cichota et al. [78] suggested using pedotransfer functions or water-flow-theory-derived functions to determine this value. It is possible to use the generic values suggested for SWCON for some soil textural classes (clays, 0.3; loams, 0.5; and sands, 0.8), and careful judgment is needed for other soil textures [87].
In the nitrate uptake and leaching modeling, statistical calibration of the highly influential rue parameter (RUE3 and RUE4) would increase the output accuracy. When RUE3 and RUE4 increased, the main-effect plots of sugarcane NO3 uptake (Figure 11) showed a high increment for the conditions in which RUE3 and RUE4 were highly influential. This relationship was strongest in the urea condition and weakest in the N-free (b) condition. The main effects of RUE3 and RUE4 on leached NO3−N decreased with an increase in the values of these parameters (Figure 12); a high decrement was observed for leached NO3−N in the conditions in which RUE3 and RUE4 were highly influential. This relationship was strongest in urea for RUE3 and RUE4 but weakest in N-free (a) for RUE3 and N-free(b) for RUE4. As many plant species, including sugarcane crops, sustain a constant rue throughout the crop cycle, many crop models, including APSIM, use constant rue values for modeling sugarcane growth [88]. Sugarcane is considered as most productive for biomass accumulation in the relatively high values of maximum rue [81,88]. However, the maximum yields would be obtained if the maximum rue is maintained during the entire crop cycle [88]. Studies by Robertson et al. [81], Van Heerden et al. [88], and Donaldson et al. [89] found that rue is not constant during the entire sugarcane growth period [90]. In the standard APSIM-Sugar version (version 7.5 r3124 and earlier), the rue is allowed to be changed as a function of the growth stages. However, lodging is also caused to reduce the rue after lodging by invoking the reduced growth phenomenon (RGP) in sugarcane plants through the lodge_redn_photo coefficient [83]; consequently, the rue would change during the same growth stage. Dias et al. [83] proposed a new APSIM-Sugar version (version 7.9 r4404 and later) that allows altering rue with respect to growth stages defined by leaf number. In addition, the rue parameter in APSIM-Sugar is not calibrated between varieties, which would possibly make the model less sensitive to different sugarcane varieties [91]. Therefore, when modeling sugarcane systems with APSIMX-Sugarcane, calibration of highly influential rue parameters would improve the accuracy of model simulations.
Cultivars with high TEB and GLN would have high NO3 uptake and low NO3−N leaching in conditions these parameters are highly influential. An increase in TEB tended to increase NO3 uptake (Figure 11) and to decrease leached NO3−N (Figure 12). Temperature influences the duration of crop phenological phases and the rate of crop development; thermal time expresses the thermal requirements in relation to the phenological development of a crop [92]. Air temperature affects sugarcane emergence; thermal time regulates all processes related to canopy development, including emergence [83]. Therefore, TEB plays a considerable role during the emergence phase of sugarcane, which affects the accuracy of the sugarcane growth simulation models. The results showed an increase in GLN, increased NO3 uptake (Figure 11), and decreased leached NO3−N (Figure 12). High GLN would enhance the light interception by the canopy and consequently have an impact on sugarcane yield. Leaf appearance rates decrease on the basis of the accumulation of degree days; photosynthesis rates of a single leaf or the entire plant normally decrease with the crop growth process [83]. In addition, lodging would reduce the GLN via the lodge_redn_green_leaf coefficient and invoke the RGP in sugarcane [83]. Thus, model calibration with GLN has a strong influence in terms of the accuracy of sugarcane growth modeling.
In conditions in which NCL4 and NCC4 parameters were highly influential, we observed that an increase in NCL4 and NCC4 showed an increase in NO3 uptake (Figure 11) and a decrease in leached NO3−N (Figure 12). Nitrogen is considered the most limiting nutrient for sugarcane crop growth [93]. Thus, critical tissue N concentrations in different crop growth stages can be considered an essential requirement to reach optimum development during those growth stages. Our results suggest that cultivars with high NCL4 and NCC4 values would have high NO3 uptake and low NO3−N leaching. Further, since the critical tissue N concentrations would differ in different sugarcane varieties [93], using variety-specific parameter values for critical leaf and cane N concentrations would provide more accurate model simulations. Therefore, parameterization of APSIMX-Sugarcane with NCL4 and NCC4 parameters is essential in achieving accurate model predictions.
An increase in CF decreased NO3 uptake (Figure 11) and increased leached NO3−N (Figure 12) in conditions in which CF was highly influential. Thus, cultivars with low CF values would have high NO3 uptake and low NO3−N leaching when modeling sugarcane under similar conditions.
Thus, parameterization of the APSIMX-Sugarcane model with these highly influential parameters would enhance the efficiency and accuracy of crop modeling. It would also considerably facilitate studies evaluating nitrate leaching from sugarcane systems and the selection of appropriate region-specific fertilizer management.

4. Conclusions

This study focused on the analysis of the sensitivity of key parameters in the APSIMX-Sugarcane model to evaluate nitrate balance under three conditions: (1) bare land (BL); (2) sugarcane crop with no N application (N-free) at rue parameter range (a) 1.2–1.8 and (b) 1.8–2.5; and (3) sugarcane crop with urea application (urea treatment). We used TGP-based meta-models to conduct the GSA using the TGP method. The generated meta-models corresponding to each fertilizer level showed good agreements with APSIMX simulators, as confirmed by R2, NRMSE, and AI, indicating that the meta-models could successfully replace the simulators. For BL treatment, SWCON parameters of all layers were identified as influential parameters (Si ≥ 0.02) for leached NO3−N. For N-free(a) and urea treatments, RUE3 and RUE4, TEB, GLN, and NCL4 were identified as the most influential parameters for both NO3 uptake and leached NO3−N. For N-free(b) treatment, RUE3, NCL4, SWC1, and SWC2 were the most influential parameters for both NO3 uptake and leached NO3−N. Thus, we confirmed that the influential parameters in the APSIMX-Sugarcane model of N balance depend on N-stress. Therefore, these parameters should be calibrated to obtain accurate model predictions. All other analyzed parameters had a weaker influence on NO3 uptake and leached NO3−N. The outcomes of this study can be useful for enhancing the accuracy and efficiency of crop modeling.

Author Contributions

Conceptualization, methodology, and formal analysis, R.H.K.R. and K.S.; investigation and writing—original draft preparation, R.H.K.R.; writing—review and editing, R.H.K.R. and W.B.M.A.C.B.; supervision, K.S., K.O., S.K., T.H., T.N. and H.S. All authors have read and agreed to the published version of the manuscript.

Funding

This work was supported by JSPS KAKENHI Grant-in-Aid for Scientific Research(B) Number 21H02307.

Data Availability Statement

Data is contained within the article.

Conflicts of Interest

The authors declare no conflict of interest.

References

  1. Matsuoka, M. Sugarcane cultivation and sugar industry in Japan. Sugar Tech. 2006, 8, 3–9. [Google Scholar] [CrossRef]
  2. Department of Agriculture, Forestry and Fisheries, Okinawa Prefectural Government. Manual Guide for Sugarcane Cultivation; Okinawa Prefectural Government: Okinawa, Japan, 2018; pp. 10–12. (In Japanese)
  3. Kingstone, G. Mineral nutrition of sugarcane. In Sugarcane: Physiology, Biochemistry, and Functional Biology, 1st ed.; Moore, P.H., Botha, F.C., Eds.; John Wiley & Sons, Inc.: Hoboken, NJ, USA, 2014; Volume 1, pp. 85–120. [Google Scholar]
  4. Agata, S.; Satake, H.; Tokuyama, A. Chemical characteristics and isotopic compositions of spring and river waters in Okinawa Island. Chikyukagaku 2001, 35, 27–41. (In Japanese) [Google Scholar] [CrossRef]
  5. Nakanishi, Y. Correlation between actual fertilizing to sugarcane and nitrate concentration in groundwater of Miyako Island, Okinawa. Jpn. J. Soil Sci. Plant. Nutr. 2001, 72, 499–504. (In Japanese) [Google Scholar]
  6. Shuhei, Y. Dynamics of Groundwater Nitrates in Limestone Aquifer of the Southern Okinawa Island. Bull. Natl. Inst. Rural Eng. Jpn. 2013, 52, 59–110. [Google Scholar]
  7. Holzworth, D.; Huth, N.I.; Fainges, J.; Brown, H.; Zurcher, E.; Cichota, R.; Verrall, S.; Herrmann, N.I.; Zheng, B.; Snow, V. APSIM Next Generation: Overcoming challenges in modernising a farming systems model. Environ. Model. Softw. 2018, 103, 43–51. [Google Scholar] [CrossRef]
  8. Keating, B.A.; Robertson, M.J.; Muchow, R.C.; Huth, N.I. Modelling sugarcane production systems I. Development and performance of the sugarcane module. Field Crop Res. 1999, 61, 253–271. [Google Scholar] [CrossRef]
  9. Martiné, J.F.; Todoroff, P. Le Modèle de Croissance Mosicas et Sa Plateforme de Simulation Simulex:État Des Lieux et Perspectives. Rev. Agric. Sucr. Maurice 2002, 80, 133–147. [Google Scholar]
  10. Jones, M.R.; Singels, A. Refining the Canegro Model for Improved Simulation of Climate Change Impacts on Sugarcane. Eur. J. Agron. 2018, 100, 76–86. [Google Scholar] [CrossRef] [Green Version]
  11. Liu, D.L.; Bull, T.A. Simulation of Biomass and Sugar Accumulation in Sugarcane Using a Process-Based Model. Ecol. Modell. 2001, 144, 181–211. [Google Scholar] [CrossRef]
  12. Brisson, N.; Gary, C.; Justes, E.; Roche, R.; Mary, B.; Ripoche, D.; Zimmer, D.; Sierra, J.; Bertuzzi, P.; Burger, P.; et al. An Overview of the Crop Model. Stics. Eur. J. Agron. 2003, 18, 309–332. [Google Scholar] [CrossRef]
  13. Peng, T.; Fu, J.; Jiang, D.; Du, J. Simulation of the Growth Potential of Sugarcane as an Energy Crop Based on the APSIM Model. Energies 2020, 13, 2173. [Google Scholar] [CrossRef]
  14. Dias, H.B.; Inman-Bamber, G.; Everingham, Y.; Sentelhas, P.C.; Bermejo, R.; Christodoulou, D. Traits for Canopy Development and Light Interception by Twenty-Seven Brazilian Sugarcane Varieties. Field Crop Res. 2020, 249, 107716. [Google Scholar] [CrossRef]
  15. Shan, Y.; Huang, M.; Harris, P.; Wu, L.A. Sensitivity analysis of the SPACSYS model. Agriculture 2021, 11, 624. [Google Scholar] [CrossRef]
  16. Liu, X.; Zhao, Y.; Shi, X.; Liu, Y.; Wang, S.; Yu, D. Sensitivity and uncertainty analysis of CENTURY-modeled SOC dynamics in upland soils under different climate-soil-management conditions: A case study in China. J. Soils Sediments 2016, 17, 85–96. [Google Scholar] [CrossRef]
  17. Krishnan, P.; Aggarwal, P. Global sensitivity and uncertainty analyses of a web based crop simulation model (web InfoCrop wheat) for soil parameters. Plant Soil 2018, 423, 443–463. [Google Scholar] [CrossRef]
  18. Loucks, D.P.; van Beek, E. Water Resource Systems Modeling: Its Role in Planning and Management. In Water Resource Systems Planning and Management; Springer: Cham, Switzerland, 2017; pp. 51–71. [Google Scholar] [CrossRef] [Green Version]
  19. Marino, S.; Hogue, I.B.; Ray, C.J.; Kirschner, D.E. A methodology for performing global uncertainty and sensitivity analysis in systems biology. J. Theor. Biol. 2008, 254, 178–196. [Google Scholar] [CrossRef] [Green Version]
  20. Sexton, J.; Everingham, Y.L.; Inman-Bamber, G. A global sensitivity analysis of cultivar trait parameters in a sugarcane growth model for contrasting production environments in Queensland, Australia. Eur. J. Agron. 2017, 88, 96–105. [Google Scholar] [CrossRef]
  21. Confalonieri, R. Monte Carlo based sensitivity analysis of two crop simulators and considerations on model balance. Eur. J. Agron. 2010, 33, 89–93. [Google Scholar] [CrossRef]
  22. Specka, X.; Nendel, C.; Wieland, R. Analysing the parameter sensitivity of the agro-ecosystem model MONICA for different crops. Eur. J. Agron. 2015, 71, 73–87. [Google Scholar] [CrossRef]
  23. Vanuytrecht, E.; Raes, D.; Willems, P. Global sensitivity analysis of yield output from the water productivity model. Environ. Model. Softw. 2014, 51, 323–332. [Google Scholar] [CrossRef] [Green Version]
  24. Dzotsi, K.A.; Basso, B.; Jones, J.W. Development, uncertainty and sensitivity analysis of the simple SALUS crop model in DSSAT. Ecol. Modell. 2013, 260, 62–76. [Google Scholar] [CrossRef]
  25. Song, X.; Zhan, C.; Kong, F.; Xia, J. Advances in the study of uncertainty quantification of large-scale hydrological modeling system. J. Geogr. Sci. 2011, 21, 801–819. [Google Scholar] [CrossRef]
  26. Cariboni, J.; Gatelli, D.; Liska, R.; Saltelli, A. The role of sensitivity analysis in ecological modelling. Ecol. Modell. 2007, 203, 167–182. [Google Scholar] [CrossRef]
  27. Liang, H.; Qi, Z.; DeJonge, K.C.; Hu, K.; Li, B. Global sensitivity and uncertainty analysis of nitrate leaching and crop yield simulation under different water and nitrogen management practices. Comput. Electron. Agric. 2017, 142, 201–210. [Google Scholar] [CrossRef]
  28. Yang, S.; Tian, W.; Cubi, E.; Meng, Q.; Liu, Y.; Wei, L. Comparison of Sensitivity Analysis Methods in Building Energy Assessment. Procedia Eng. 2016, 146, 174–181. [Google Scholar] [CrossRef] [Green Version]
  29. Sobol’, L.M. On sensitivity estimation for nonlinear mathematical models. Matem. Mod. 1990, 2, 112–118. [Google Scholar] [CrossRef]
  30. Saltelli, A. Making best use of model evaluations to compute sensitivity indices. Comput. Phys. Commun. 2002, 145, 280–297. [Google Scholar] [CrossRef]
  31. Cukier, R.I.; Fortuin, C.M.; Shuler, K.E.; Petschek, A.G.; Schaibly, J.H. Study of the sensitivity of coupled reaction systems to uncertainties in rate coefficients. I Theory. J. Chem. Phys. 1973, 59, 3873–3878. [Google Scholar] [CrossRef]
  32. Mara, T.A.; Tarantola, S. Application of global sensitivity analysis of model output to building thermal simulations. Build. Simul. 2008, 1, 290–302. [Google Scholar] [CrossRef] [Green Version]
  33. Wang, Y.; Guo, F.; Shen, H.; Xing, X.; Xiaoyi, M. global sensitivity analysis and evaluation of the DSSAT model for summer maize (Zea mays L.) under irrigation and fertilizer stress. Int. J. Plant Prod. 2021, 15, 523–539. [Google Scholar] [CrossRef]
  34. Dejonge, K.C.; Ascough, J.C., II; Ahmadi, M.; Andales, A.A.; Arabi, M. Global sensitivity and uncertainty analysis of a dynamic agroecosystem model under different irrigation treatments. Ecol. Modell. 2012, 231, 113–125. [Google Scholar] [CrossRef]
  35. Kumar, S.; Niwas, R.; Khichar, M.L.; Kumar, Y.; Premdeep, A.S. Sensitivity analysis of DSSAT CROPGRO-Cotton model for cotton under different growing environments. Indian J. Ecol. 2017, 44, 237–241. [Google Scholar]
  36. Xu, M.; Wang, C.; Ling, L.; Batchelor, W.D.; Zhang, J.; Kuai, J. Sensitivity analysis of the CROPGRO-Canola model in China: A case study for rapeseed. PLoS ONE 2021, 16, 17. [Google Scholar] [CrossRef] [PubMed]
  37. Varella, H.; Guérif, M.; Buis, S. Global sensitivity analysis measures the quality of parameter estimation: The case of soil parameters and a crop model. Environ. Model. Softw. 2010, 25, 310–319. [Google Scholar] [CrossRef]
  38. Zhao, G.; Bryan, B.A.; Song, X. Sensitivity and uncertainty analysis of the APSIM-wheat model: Interactions between cultivar, environmental, and management parameters. Ecol. Modell. 2014, 279, 1–11. [Google Scholar] [CrossRef]
  39. Qin, F.; Zhao, Y.; Shi, X.; Xu, S.; Yu, D. Sensitivity and uncertainty analysis for the DeNitrification–DeComposition model, a case study of modeling soil organic carbon dynamics at a long-term observation site with a rice–bean rotation. Comput. Electron. Agric. 2016, 124, 263–272. [Google Scholar] [CrossRef]
  40. Gramacy, R.B.; Taddy, M. Categorical Inputs, Sensitivity Analysis, Optimization and Importance Tempering with tgp Version 2, an R Package for Treed Gaussian Process Models. J. Stat. Softw. 2010, 33, 1–48. [Google Scholar] [CrossRef] [Green Version]
  41. Bandara, W.B.M.A.C.; Sakai, K.; Nakandakari, T.; Kapetch, P.; Rathnappriya, R.H.K. A Gaussian-Process-Based Global Sensitivity Analysis of Cultivar Trait Parameters in APSIM-Sugar Model: Special Reference to Environmental and Management Conditions in Thailand. Agronomy 2020, 10, 984. [Google Scholar] [CrossRef]
  42. Gunarathna, M.H.J.P.; Sakai, K.; Nakandakari, T.; Momii, K.; Kumari, M.K.N. Sensitivity Analysis of Plant- and Cultivar-Specific Parameters of APSIM-Sugar Model: Variation between Climates and Management Conditions. Agronomy 2019, 9, 242. [Google Scholar] [CrossRef] [Green Version]
  43. Bandara, W.B.M.A.C.; Sakai, K.; Nakandakari, T.; Kapetch, P.; Anan, M.; Nakamura, S.; Setouchi, H.; Rathnappriya, R.H.K. Global Optimization of Cultivar Trait Parameters in the Simulation of Sugarcane Phenology Using Gaussian Process Emulation. Agronomy 2021, 11, 1379. [Google Scholar] [CrossRef]
  44. Rathnappriya, R.H.K.; Sakai, K.; Okamoto, K.; Kimura, S.; Haraguchi, T.; Nakandakari, T.; Setouchi, H.; Bandara, W.B.M.A.C. Examination of the Effectiveness of Controlled Release Fertilizer to Balance Sugarcane Yield and Reduce Nitrate Leaching to Groundwater. Agronomy 2022, 12, 695. [Google Scholar] [CrossRef]
  45. Okamoto, K.; Goto, S.; Anzai, T.; Ando, S. Nitrogen Leaching and Nitrogen Balance under Differing Nitrogen Fertilization for Sugarcane Cultivation on a Subtropical Island. Water 2021, 13, 740. [Google Scholar] [CrossRef]
  46. Iwata, Y.; Miyamoto, T.; Kameyama, K.; Nishiya, M. Effect of sensor installation on the accurate measurement of soil water content. Eur. J. Soil Sci. 2017, 68, 817–828. [Google Scholar] [CrossRef] [Green Version]
  47. Kubotera, H. Analysis of problems in certain soils of the Kyushu Okinawa region for suitable management. Soil Sci. Plant Nutr. 2020, 66, 15–20. [Google Scholar] [CrossRef]
  48. Shinogi, Y.; Miyamoto, T.; Kameyama, K.; Yan, C. Optimal use of biomass in an isolated environment: Case study at Miyako Island, Japan. In Proceedings of the 27th International Society of Sugar Cane Technologists Congress, Veracruz, Mexico, 7–11 March 2010. [Google Scholar]
  49. Kameyama, K.; Miyamoto, T.; Shinogi, Y. Increases in available water content of soils by applying bagasse-charcoals. In Proceedings of the 19th World Congress of Soil Science, Soil Solutions for a Changing World, Brisbane, Australia, 1–6 August 2010. [Google Scholar]
  50. Sakai, K.; Nakamura, S. N2O emissions from shimajiri-maji (calcaric dark red soil) after applying two chemical fertilizers. Appl. Ecol. Environ. Res. 2015, 13, 339–348. [Google Scholar] [CrossRef]
  51. Singels, A. Crop Models. In Sugarcane: Physiology, Biochemistry, and Functional Biology; Moore, P.H., Botha, F.C., Eds.; John Wiley & Sons Ltd.: Chichester, UK, 2013; pp. 541–577. [Google Scholar]
  52. Everingham, Y.L.; Inman-Bamber, N.G.; Thorburn, P.J.; McNeill, T.J. A Bayesian modelling approach for long lead sugarcane yield forecasts for the Australian sugar industry. Aust. J. Agric. Res. 2007, 58, 87–94. [Google Scholar] [CrossRef]
  53. Inman-Bamber, N.G.; Attard, S.A.; Baillie, C.; Lawson, D.; Simpson, L. A web-based system for planning use of limited irrigation water in sugarcane. Proc. Aust. Soc. Sugar Cane Technol. 2005, 27, 170–181. [Google Scholar]
  54. Everingham, Y.; Baillie, C.; Inman-Bamber, G.; Baillie, J. Forecasting water allocations for Bundaberg sugarcane farmers. Clim. Res. 2008, 36, 231–239. [Google Scholar] [CrossRef] [Green Version]
  55. Marin, F.R.; Jones, J.W.; Singels, A.; Royce, F.; Assad, E.D.; Pellegrino, G.Q.; Justino, F. Climate change impacts on sugarcane attainable yield in southern Brazil. Clim. Chang. 2013, 117, 227–239. [Google Scholar] [CrossRef] [Green Version]
  56. Thorburn, P.J.; Antwerpen, R.V.A.N.; Meyer, J.H.; Bezuidenhout, C.N. The impact of trash management on soil carbon and nitrogen: I Modelling long-term experimental results in the South African sugar industry. Proc. S. Afr. Sug Technol. Ass. 2002, 76, 260–268. [Google Scholar]
  57. SoilN. Available online: https://www.apsim.info/documentation/model-documentation/soil-modules-documentation/soiln/ (accessed on 2 August 2022).
  58. Catchpoole, V.R.; Keating, B.A. Sugarcane yield and nitrogen uptake in relation to profiles of mineral-nitrogen in the soil. In Proceedings of the 17th Conference of the Australian Society of Sugar Cane Technologists, Bundaberg, Australia, 2–5 May 1995. [Google Scholar]
  59. Muchow, R.C.; Robertson, M.J. Relating crop nitrogen uptake to sugarcane yield. In Proceedings of the 16th Conference of the Australian Society of Sugar Cane Technologists, Townsville, Australia, 26–29 April 1994. [Google Scholar]
  60. R Core Team. R: A Language and Environment for Statistical Computing; R Foundation for Statistical Computing: Vienna, Austria, 2022; Available online: https://www.R-project.org/ (accessed on 2 August 2022).
  61. Miguez, F. Inspect, Read, Edit and Run ‘APSIM’ “Next Generation” and ‘APSIM’ Classic. Available online: https://cran.r-project.org/package=apsimx (accessed on 2 August 2022).
  62. Wickham, H.; Müller, K. R Database Interface. Available online: https://cran.r-project.org/package=DBI (accessed on 2 August 2022).
  63. Müller, K.; Wickham, H.; James, D.A.; Falcon, S.; Hipp, D.R.; Kennedy, D.; Mistachkin, J.; Healy, L.; SQLite Authors; R Consortium. RStudio SQLite Interface for R. Available online: https://cran.r-project.org/package=RSQLite (accessed on 2 August 2022).
  64. Ooms, J. The Jsonlite Package: A Practical and Consistent Mapping between JSON Data and R Objects. arXiv 2022, arXiv:1403.2805. [Google Scholar]
  65. Gramacy, R.B.; Taddy, M.A. Bayesian Treed Gaussian Process Models. R Package Version 2.4-18. 2022. Available online: https://cran.r-project.org/web/packages/tgp/index.html (accessed on 2 August 2022).
  66. Song, X.; Zhang, J.; Zhan, C.; Xuan, Y.; Ye, M.; Xu, C. Global sensitivity analysis in hydrological modeling: Review of concepts, methods, theoretical framework, and applications. J. Hydrol. 2015, 523, 739–757. [Google Scholar] [CrossRef] [Green Version]
  67. Zhu, L.; Chen, S.; Yang, Y.; Tian, W.; Sun, Y.; Lyu, M. Global sensitivity analysis on borehole thermal energy storage performances under intermittent operation mode in the first charging phase. Renew. Energy 2019, 143, 183–198. [Google Scholar] [CrossRef]
  68. Saltelli, A.; Tarantola, S.; Chan, K.P.-S. A Quantitative Model-Independent Method for Global Sensitivity Analysis of Model Output. Technometrics 1999, 41, 39. [Google Scholar] [CrossRef]
  69. Saltelli, A.; Ratto, M.; Andres, T.; Campolongo, F.; Cariboni, J.; Gatelli, D.; Saisana, M.; Tarantola, S. Global Sensitivity Analysis: The Primer; John Wiley & Sons Ltd.: Chichester, UK, 2008; p. 305. [Google Scholar]
  70. Gramacy, R.B. tgp: An R Package for Bayesian Nonstationary, Semiparametric Nonlinear Regression and Design by Treed Gaussian Process Models. J. Stat. Softw. 2007, 19, 1–46. [Google Scholar] [CrossRef] [Green Version]
  71. Olsson, A.; Sandberg, G.; Dahlblom, O. On Latin hypercube sampling for structural reliability analysis. Struct. Saf. 2003, 25, 47–68. [Google Scholar] [CrossRef]
  72. Massmann, C.; Holzmann, H. Analysis of the behavior of a rainfall–runoff model using three global sensitivity analysis methods evaluated at different temporal scales. J. Hydrol. 2012, 475, 97–110. [Google Scholar] [CrossRef]
  73. Svenson, J.; Santner, T.; Dean, A.; Moon, H. Estimating sensitivity indices based on Gaussian process metamodels with compactly supported correlation functions. J. Stat. Plan. Inference 2014, 144, 160–172. [Google Scholar] [CrossRef] [Green Version]
  74. Zhang, J.; Li, Y.; Li, H.; Wang, X. Sensitivity analysis of thermal performance of granary building based on machine learning. In Proceedings of the 24th International Conference of the Association for Computer-Aided Architectural Design Research in Asia (CAADRIA), Hong Kong; 2019. Available online: http://papers.cumincad.org/data/works/att/caadria2019_245.pdf (accessed on 2 August 2022).
  75. Willmott, C.J. Some Comments on the Evaluation of Model Performance. Bull. Am. Meteorol. Soc. 1982, 63, 1309–1313. [Google Scholar] [CrossRef] [Green Version]
  76. Liu, S.; Yang, J.Y.; Zhang, X.Y.; Drury, C.F.; Reynolds, W.D.; Hoogenboom, G. Modelling crop yield, soil water content and soil temperature for a soybean–maize rotation under conventional and conservation tillage systems in Northeast China. Agric. Water Manag. 2013, 123, 32–44. [Google Scholar] [CrossRef]
  77. Probert, M.E.; Dimes, J.P.; Keating, B.A.; Dalal, R.C.; Strong, W.M. APSIM’s Water and Nitrogen Modules and Simulation of the Dynamics of Water and Nitrogen in Fallow Systems. Agric. Syst. 1998, 56, 28. [Google Scholar] [CrossRef]
  78. Cichota, R.; Vogeler, I.; Sharp, J.; Verburg, K.; Huth, N.; Holzworth, D.; Dalgliesh, N.; Snow, V. A protocol to build soil descriptions for APSIM simulations. MethodsX 2021, 8, 101566. [Google Scholar] [CrossRef]
  79. Elli, E.F.; Huth, N.; Sentelhas, P.C.; Carneiro, R.L.; Alvares, C.A. Global sensitivity-based modelling approach to identify suitable Eucalyptus traits for adaptation to climate variability and change. In Silico Plants 2020, 2, diaa003. [Google Scholar] [CrossRef]
  80. Casadebaig, P.; Chapman, S.; Huth, N.; Faivre, R.; Chenu, K. Assessment of the Potential Impacts of Wheat Plant Traits across Environments by Combining Crop Modeling and Global Sensitivity Analysis. PLoS ONE 2016, 11, 27. [Google Scholar] [CrossRef] [PubMed] [Green Version]
  81. Robertson, M.J.; Wood, A.W.; Muchow, R.C. Growth of sugarcane under high input conditions in tropical Australia. I. Radiation use, biomass accumulation and partitioning. Field Crop Res. 1996, 48, 11–25. [Google Scholar] [CrossRef]
  82. Wajid, N.; Ashfaq, A.; Asad, A.; Muhammad, T.; Muhammad, A.; Muhammad, S.; Jabran, K.; Shah, G.M.; Sultana, S.R.; Hammad, H.M.; et al. Radiation efficiency and nitrogen fertilizer impacts on sunflower crop in contrasting environments of Punjab, Pakistan. Environ. Sci. Pollut. Res. 2018, 25, 1822–1836. [Google Scholar] [CrossRef]
  83. Dias, H.B.; Inman-Bamber, G.; Bermejo, R.P.; Sentelhas, C.; Christodoulou, D. New APSIM-Sugar features and parameters required to account for high sugarcane yields in tropical environments. Field Crop Res. 2019, 235, 38–53. [Google Scholar] [CrossRef]
  84. Inman-Bamber, N.G. Temperature and seasonal effects on canopy development and light interception of sugarcane. Field Crop. Res. 1994, 36, 41–51. [Google Scholar] [CrossRef]
  85. De Oliveira, E.C.A.; De Castro Gava, G.J.; Trivelin, P.C.O.; Otto, R.; Franco, H.C.J. Determining a critical nitrogen dilution curve for sugarcane. J. Plant Nutr. Soil Sci. 2013, 176, 712–723. [Google Scholar] [CrossRef]
  86. Muchow, R.C.; Robertson, M.J.; Wood, A.W. Growth of sugarcane under high input conditions in tropical Australia. II. Sucrose accumulation and partitioning, and commercial yield. Field Crop Res. 1996, 48, 11–25. [Google Scholar] [CrossRef]
  87. Dalgliesh, N.; Hochman, Z.; Huth, N.; Holzworth, D. Field Protocol to APSoil Characterisations; Version 4; CSIRO: Perth, Australia, 2016; p. 25. [Google Scholar]
  88. van Heerden, P.D.R.; Donaldson, R.A.; Watt, D.A.; Singels, A. Biomass accumulation in sugarcane: Unravelling the factors underpinning reduced growth phenomena. J. Exp. Bot. 2010, 61, 2877–2887. [Google Scholar] [CrossRef] [PubMed] [Green Version]
  89. Donaldson, R.A.; Redshaw, K.A.; Rhodes, R.; Van Antwerpen, R. Season effects on productivity of some commercial south African sugarcane cultivars, I: Biomass and Radiation Use Efficiency. In Proceedings of the 81st Annual Congress of South African Sugar Technologists’ Association, Durban, South Africa, 29–31 July 2008. [Google Scholar]
  90. Park, S.E.; Robertson, M.; Inman-Bamber, N.G. Decline in the growth of a sugarcane crop with age under high input conditions. Field Crop. Res. 2005, 92, 305–320. [Google Scholar] [CrossRef]
  91. Thorburn, P.; Biggs, J.; Jones, M.R.; Singels, A.; Marin, F.; Martine, J.F.; Chinorumba, S.; Viator, R.; Nunez, O. Evaluation of the APSIM-Sugar model for simulating sugarcane yield at sites in seven countries: Initial results. In Proceedings of the 87th Annual Congress of South African Sugar Technologists’ Association, Pietermaritzburg, South Africa, 17–22 August 2014. [Google Scholar]
  92. Romero, E.R.; Scandaliaris, J.; Rufino, M.; Zamora, F.P. Biothermal models to predict plant cane emergence. In Proceedings of the XXIV International Society of Sugar Cane Technologists Congress, Brisbane, Australia, 17–21 September 2001. [Google Scholar]
  93. De Santana, A.C.; De Oliveira, E.C.A.; Da Silva, V.S.G.; Dos Santos, R.L.; Da Silva, M.A.; Freire, F.J. Critical nitrogen dilution curves and productivity assessments for plant cane. Rev. Bras. Eng. Agric. Ambient. 2020, 24, 244–251. [Google Scholar] [CrossRef]
Figure 1. Monthly rainfall (mm); Tmax: mean daily maximum temperature (°C); Tmin: mean daily minimum temperature (°C); solar radiation (MJ/m2) for the period of 1 March 2019 to 31 March 2020 at the experimental site.
Agronomy 12 01979 g001
Figure 2. Schematic flow diagram of GSA.
Agronomy 12 01979 g002
Figure 3. Relationship between APSIMX-simulated and meta-model-predicted NO3 uptake. Red lines are the best-fit linear regression lines.
Agronomy 12 01979 g003
Figure 4. Relationship between APSIMX-simulated and meta-model-predicted leached NO3−N. Red lines are the best-fit linear regression lines.
Agronomy 12 01979 g004
Figure 5. Relationships between the RUE3 parameter and the APSIMX-simulated NO3 uptake and leached NO3−N.
Agronomy 12 01979 g005
Figure 6. Relationship between APSIMX-simulated and meta-model-predicted NO3 uptake in N-free condition for rue parameter ranges (a) 1.2–1.8 and (b) 1.8–2.5. Red lines are the best-fit linear regression lines.
Agronomy 12 01979 g006
Figure 7. Relationship between APSIMX-simulated and meta-model-predicted leached NO3−N in N-free condition for rue parameter ranges (a) 1.2–1.8 and (b) 1.8–2.5. Red lines are the best-fit linear regression lines.
Agronomy 12 01979 g007
Figure 8. Heat maps of the main-effect indices of influential parameters for NO3 uptake and leached NO3−N. Dark green or blue indicates high Si values, and light green or blue indicates low Si values.
Agronomy 12 01979 g008
Figure 9. The boxplots of Si of input parameters considered in the APSIMX-Sugarcane model for NO3 uptake, (i) N-free(a); (ii) N-free(b); (iii) urea. The Si values range between 0 and 1. The interquartile range (IQR) is indicated by the boxes, the median by thick black lines, 1.5 times the IQR by whiskers, and the outliers beyond 1.5 times the IQR by circles.
Agronomy 12 01979 g009aAgronomy 12 01979 g009b
Figure 10. The boxplots of Si of input parameters considered in the APSIMX-Sugarcane model for leached NO3−N, (i) BL; (ii) N-free(a); (iii) N-free(b); (iv) urea. The Si values range between 0 and 1. The interquartile range (IQR) is indicated by boxes, the median by thick black lines, 1.5 times the IQR by whiskers, and the outliers beyond 1.5 times the IQR by circles.
Agronomy 12 01979 g010aAgronomy 12 01979 g010b
Figure 11. The main-effect plots of highly influential input parameters on NO3 uptake, (i) N-free(a); (ii) N-free(b); (iii) urea. Mean values of the main effects are indicated by the thick middle line in each plot; 90% intervals are indicated by the upper and lower dotted lines.
Agronomy 12 01979 g011aAgronomy 12 01979 g011b
Figure 12. The main-effect plots of highly influential input parameters on leached NO3−N, (i) BL; (ii) N-free(a); (iii) N-free(b); (iv) urea. Mean values of the main effects are indicated by thick middle lines; 90% intervals are indicated by the upper and lower dotted lines.
Agronomy 12 01979 g012aAgronomy 12 01979 g012bAgronomy 12 01979 g012c
Table 1. Soil properties of the lysimeters used for APSIMX-Sugarcane simulations.
Soil Depth (cm)BD (g/cm3)Air Dry (mm/mm)LL15 (mm/mm)DUL (mm/mm)SAT (mm/mm)KS (mm/day)Sugarcane LL (mm/mm)Sugarcane KL (/day)Sugarcane XF (0–1)Sugarcane PAWC (mm)
0–151.5300.0560.1110.2070.36511051.80.1310.1111.3
15–301.5200.0860.1080.1980.3659287.70.1270.1110.6
30–601.3400.1250.1250.2250.4213572.10.1480.08123
60–901.2600.1260.1260.2050.4718129.80.1500.06116.4
90–1201.3400.1420.1420.2090.4544780.70.1760.04110
120–1501.3400.1420.1420.2090.4544780.70.1760.01110
150–1801.3400.1420.1420.2090.4544780.70.1760.0100
180–2001.3400.1420.1420.2090.4544780.70.1760.0100
BD, bulk density; Airdry, air-dried soil moisture limit; LL15, wilting point; DUL, drained upper limit or field capacity; SAT, saturated soil moisture; KS, saturated hydraulic conductivity; Sugarcane LL, lower limit for water extraction by sugarcane; Sugarcane KL, fraction of soil water extraction by sugarcane per day; Sugarcane XF, sugarcane root hospitality factor; PAWC, plant available water capacity.
Table 2. Soil chemical and organic parameter values used for APSIMX-Sugarcane simulations.
Depth (cm)Carbon (Total %)C:N (g/g)FOM (kg/ha)NO3−N (ppm)NH4−N (ppm)pH
0–201.3011343.13921.006
20–400.9011245.87021.006
40–600.5411176.17411.006
60–900.4011106.85510.506
90–1200.401164.81110.506
120–1500.401139.31010.506
150–1800.401123.84210.506
C:N, soil C:N ratio; FOM, fresh organic matter.
Table 3. Description of parameters with their ranges.
Function of ParametersParameter NameDescriptionLevelCodeUnitsRange
Canopy developmentleaf_sizeArea of the respective leafleaf_size_no = 1LS1mm2500–2000
leaf_size_no = 14LS2mm225,000–70,000
leaf_size_no = 20LS3mm225,000–70,000
green_leaf_noMaximum number of fully expanded green leaves GLNNo.9–14
tillerf_leaf_sizeTillering factors according to the leaf numbersTiller_leaf_size_no = 1TLS1mm2/mm21–6
Tiller_leaf_size_no = 4TLS2mm2/mm21–6
Tiller_leaf_size_no = 10TLS3mm2/mm21–6
Tiller_leaf_size_no = 16TLS4mm2/mm21–6
Tiller_leaf_size_no = 26TLS5mm2/mm21–6
Partitioning of assimilatescane_fractionFraction of accumulated biomass partitioned to cane CFg/g0.65–0.80
sucrose_fraction_stalkFraction of accumulated biomass partitioned to sucrose SF1g/g0.50–0.70
stress_factor_stalkStress factor for sucrose accumulation SF2n/a0.2–1.0
sucrose_delaySucrose accumulation delay SDg/m20–600
min_sstem_sucroseMinimum stem biomass before partitioning to sucrose commences MSSg/m2450–1500
Phenological development based on thermal timemin_sstem_sucrose_rednReduction to minimum stem sucrose under stress MSSRg/m20–20
tt_emerg_to_begcaneAccumulated thermal time from emergence to beginning of cane TEB°C day1200–1900
tt_begcane_to_floweringAccumulated thermal time from beginning of cane to flowering TBF°C day5500–6500
tt_flowering_to_crop_endAccumulated thermal time from flowering to end of the crop TFCE°C day1750–2250
Dry matter assimilationtransp_eff_cfTranspiration efficiency coefficientFrom sowing to sproutingTEC1kg kPa/kg0.008–0.014
From sprouting to emergenceTEC2
From emergence to the beginning of cane growthTEC3
From the beginning of cane growth to floweringTEC4
From flowering to the end of the cropTEC5
At the end of the cropTEC6
rueRadiation use efficiencyFrom emergence to the beginning of cane growthRUE3g/MJ1.2–2.5
From the beginning of cane growth to floweringRUE4
From flowering to the end of the cropRUE5
Influencing the sugarcane growth processy_n_conc_crit_leafCritical N concentration in leavesFrom sowing to sproutingNCL1g/g0.0175–0.0325
From sprouting to emergenceNCL2g/g0.0175–0.0325
From emergence to the beginning of cane growthNCL3g/g0.0105–0.0195
From the beginning of cane growth to floweringNCL4g/g0.0105–0.0195
From flowering to the end of the cropNCL5g/g0.0035–0.0065
y_n_conc_min_leafMinimum N concentration in leavesFrom sowing to sproutingNML1g/g0.0105–0.0195
From sprouting to emergenceNML2g/g0.0105–0.0195
From emergence to the beginning of cane growthNML3g/g0.0035–0.0065
From the beginning of cane growth to floweringNML4g/g0.0035–0.0065
From flowering to the end of the cropNML5g/g0.0028–0.0052
y_n_conc_crit_caneCritical N concentration in caneFrom sowing to sproutingNCC1g/g0.0063–0.0117
From sprouting to emergenceNCC2g/g0.0063–0.0117
From emergence to the beginning of cane growthNCC3g/g0.0063–0.0117
From the beginning of cane growth to floweringNCC4g/g0.0042–0.0078
From flowering to the end of the cropNCC5g/g0.00035–0.00065
y_n_conc_min_caneMinimum N concentration in caneFrom sowing to sproutingNMC1g/g0.0014–0.0026
From sprouting to emergenceNMC2g/g0.0014–0.0026
From emergence to the beginning of cane growthNMC3g/g0.00035–0.00065
From the beginning of cane growth to floweringNMC4g/g0.00035–0.00065
From flowering to the end of the cropNMC5g/g0.00035–0.00065
y_n_conc_crit_cabbageCritical N concentration in cabbageFrom sowing to sproutingNCCA1g/g0.0133–0.0247
From sprouting to emergenceNCCA2g/g0.0133–0.0247
From emergence to the beginning of cane growthNCCA3g/g0.0042–0.0078
From the beginning of cane growth to floweringNCCA4g/g0.0042–0.0078
From flowering to the end of the cropNCCA5g/g0.0007–0.0013
y_n_conc_min_cabbageMinimum N concentration in cabbageFrom sowing to sproutingNMCA1g/g0.007–0.013
From sprouting to emergenceNMCA2g/g0.007–0.013
From emergence to the beginning of cane growthNMCA3g/g0.0021–0.0039
From the beginning of cane growth to floweringNMCA4g/g0.0021–0.0039
From flowering to the end of the cropNMCA5g/g0.00056–0.00104
The rate of flow of water undersaturated conditionsSWCONParameter rerated to saturated flow-proportion of water between saturation and field capacity (Whole profile drainage rate coefficient)Soil layer 0–15 cmSWC1/day0.2–0.8
Soil layer 15–30 cmSWC2
Soil layer 30–60 cmSWC3
Soil layer 60–90 cmSWC4
Soil layer 90–120 cmSWC5
Soil layer 120–150 cmSWC6
Soil layer 150–180 cmSWC7
Soil layer 180–200 cmSWC8
Publisher’s Note: MDPI stays neutral with regard to jurisdictional claims in published maps and institutional affiliations.

