1. Introduction
Korla fragrant pear (
Pyrus sinkiangensis Yu) is a profitable crop which supports the local economy in Xinjiang. At present, about 60,000 hectares in Xinjiang are cultivated, and the region ranks first in China in terms of production [
1]. Since 2000, drip irrigation, a well-established irrigation method (first developed for cotton), has become popular and has been applied to orchards in Xinjiang. In 2013, more than 266,666 ha were under irrigation, but by 2019, the drip irrigation of fruit trees covered less than 66,666 ha, mainly because it failed to meet the water demand. The shallow layer of soil kept moist by the method and the application of fertilizers through drip irrigation confine the growth of roots to that layer, reducing their ability to compete for resources and their resistance to stress [
2,
3,
4]; both of the outcomes seriously affect the yield and quality of fruit trees and lead to lower financial returns. As a result, growers are gradually returning to border or flood irrigation, applying as much as 15,000 m³/ha [
5]—an excessive amount that far exceeds the ‘three red lines’ water control requirements (the most strict water resources management system). In addition, soils in most orchards are highly saline, with a salt content of up to 9 g/kg near the surface. The normal growth of pear during the growth period can only be guaranteed by a high irrigation amount in the non-growth period, which results in a low utilization efficiency of irrigation water. Therefore, a more efficient method of irrigation and lower volumes of irrigation are necessary to regulate the distribution of water and salt in the soils of pear orchards.
The irrigation method and volume are important for such regulation and for promoting the growth of fragrant pear, and both of these aspects have been studied in recent years. Liu [
6], who used round-pipe surface drip irrigation, micro-spray irrigation, and small-pipe outflow tests for Korla pear, recommended the round-pipe layout and proposed that the optimal volume of irrigation for the surface drip irrigation of Korla pear was 4650 m³/ha. Zhang [
7] compared surface drip irrigation using single-ring pipes, double-ring pipes, and row and double pipes for Korla fragrant pear and found that double-ring pipes resulted in the best growth and the highest yield. The irrigation water is introduced to a certain depth below the field surface to wet the soil in the root zone through soil capillary action to meet the needs of crop growth. This type of irrigation, also known as seepage irrigation, is suitable for areas where the upper soil has good capillary properties and the lower soil is weak in permeability, but it is not suitable for areas where the soil is salinized. At present, infiltration irrigation has been applied successfully to vegetables, fruits, trees, and other crops in greenhouses [
8,
9,
10,
11,
12]. Current studies on infiltration irrigation focus mainly on its effects on the physical and chemical properties of soil. Infiltration irrigation can reduce nitrate leaching, improve water-use efficiency, increase the organic carbon content of surface soil, and affect soil humus and soil nutrients [
11,
13,
14,
15,
16,
17]. Some studies have found that root zone irrigation [
4,
18,
19] promoted the deeper penetration by roots, changed the root pattern compared to that obtained with surface irrigation, and produced more roots, thereby enhancing the plant’s ability to adapt to a semi-arid climate. Some scholars [
20,
21,
22,
23] compared the root distribution characteristics of fruit trees under subsurface drip irrigation and surface drip irrigation and found that subsurface drip irrigation had a positive impact on trunk and total root growth, and the number of fine roots and root length density increased significantly. Bi [
24] conducted a comparative study on underground hole irrigation and surface irrigation, and the results showed that underground hole irrigation stabilized soil water in the layer in which roots are concentrated and improved the rates of photosynthesis and water utilization. Zhang [
25] compared the effects of surface drip irrigation and drip irrigation under root holes on the growth of Xinjiang jujube and found that drip irrigation under root holes increased root biomass significantly.
Most growers of Korla fragrant pear adopt the traditional method of flood irrigation, which is not only wasteful but also makes the soil more saline. The Xinjiang region is dry and has high temperatures. Soil water evaporation is rapid, and flood irrigation will make the groundwater level rise and lead to the formation of rising capillary water, resulting in the salt in the soil with water moving to the surface soil, leading to soil salinization. Drip irrigation and infiltration irrigation save water, increase water-use efficiency, and improve the soil. It is against this background that the present experiment sought to evaluate the effects of different methods of irrigation and of regulating the volume of irrigation by considering evapotranspiration on the growth of fragrant pear, on its resource-use efficiency (water and fertilizers), on soil water, and on the distribution of salts to provide a sound theoretical basis and practical guidelines on irrigation.
2. Materials and Methods
2.1. Experimental Site
The experiment was conducted from April to September 2021 in Korla city, Xinjiang (85°88′ N, 41°79′ E, elevation 909 m). The site has a typical temperate continental arid desert climate, with annual rainfall of 57 mm, annual evaporation of 2800 mm, total sunshine for 2990 h, and a frost-free period of 210 d. The annual average temperature is 11.4 °C, the extreme low temperature is −28 °C, and the average wind speed is 11.6 km/h. (
Figure 1 shows the temperature, relative humidity, and rainfall during the experimental period; namely, 27 April to 24 September 2021). The soil, when fully irrigated, is a sandy loam. The groundwater depth is 3 m, the average bulk density of the soil in the 0–100 cm layer is 1.44 g/cm³ (soil bulk density of each soil layer: −20 cm: 1.38 g/cm
3, 20–40 cm: 1.43 g/cm
3, 40–60 cm: 1.50 g/cm
3, 60–80 cm: 1.51 g/cm
3, 80–100 cm: 1.39 g/cm
3), the salt content is 9.18 g/kg, the field capacity is 25.9%, the permanent wilting point is 8.9%, the available water-holding capacity is 17.0%, the pH is 7.8, and the soil organic matter is 15.0 g/kg. The total nitrogen is 0.6 g/kg; the alkali-hydrolyzed nitrogen is 53.82 mg/kg; the available phosphorus is 22.2 mg/kg; and the available potassium is 200.9 mg/kg. The Korla fragrant pear orchard covers 1.1 ha, the dimensions of the plot being 240 m × 47.5 m. The tested variety of the Korla fragrant pear was 5a (
P. sinkiangensis), which was planted in rows oriented east–west and 1 m apart. The spacing within each row was 5 m, the experiment comprised a total of nine rows (
Figure 2), and the planting density was 1650–1950 plants /ha.
2.2. Experimental Design
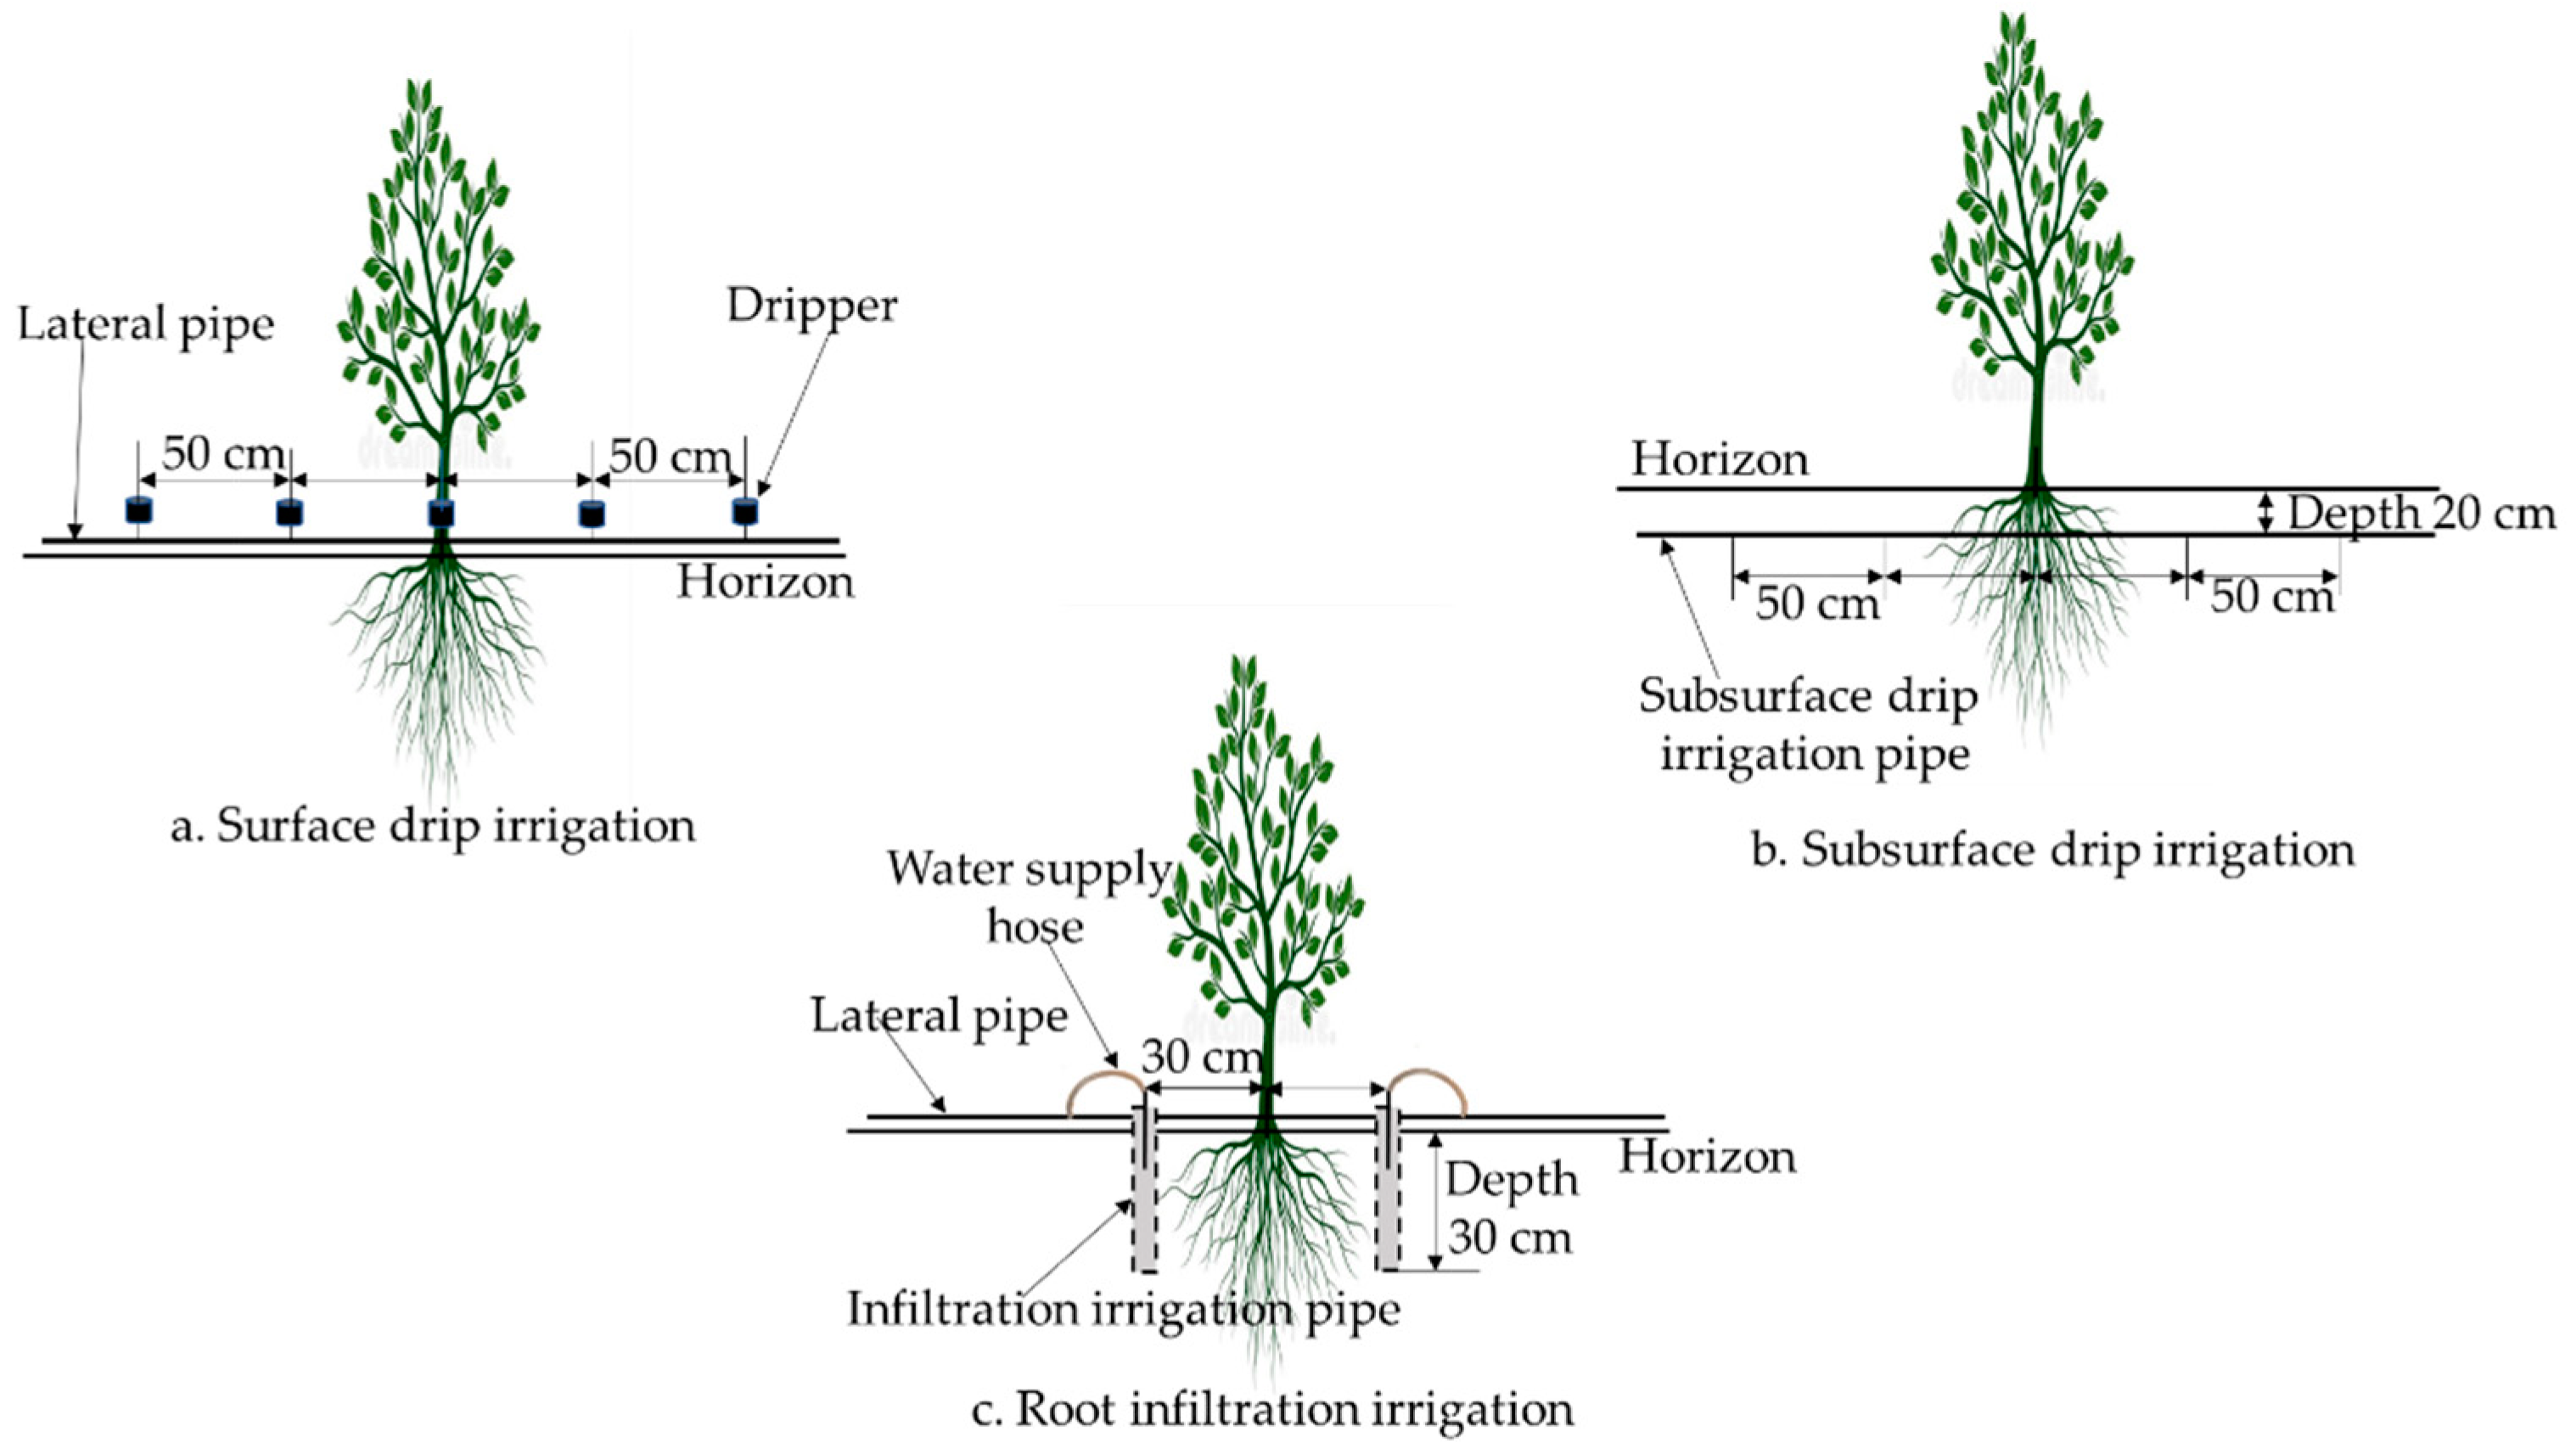
The source of irrigation water was a well; the salinity of the water was 3.0–3.5 g/L; and its pH was 7.3–7.5. The experiment tested two factors, namely, the method of irrigation and the volume (quantity) of irrigation. The three methods were surface drip (F1), subsurface drip (F2), and root zone infiltration (F3). For surface drip irrigation, a row consisting of two pipes was laid on both sides of the tree row, the drip head flow was 2 L/h, the distance between the drip heads was 50 cm, and the pipes were 40 cm away from the trees. For subsurface drip irrigation, a row of two pipes was buried 20 cm below the surface, the drip head flow was 2 L/h, the distance between the drip heads was 50 cm, and the pipes were 40 cm away from the trees. For root zone infiltration irrigation, a pipe to supply water was laid at the bottom of the tree in each row. Holes to supply the water pipe were drilled every 50 cm, and polyethylene (PE) microtubes connected the holes to the seepage pipe. Two seepage pipes per plant were buried on either side, 30 cm from the rows of trees. Two rows of symmetrical water seepage holes with a diameter of 2 mm that were spaced 1 cm apart were drilled into the wall of the tube, which was buried 30 cm below the surface. A nozzle with a flow rate of 2 L/h connected by PE microtubes was placed inside the tube (
Figure 3). At the end of March 2021, before irrigating the trees, the subsurface infiltration pipes were placed manually, and the subsurface drip irrigation pipes were also laid manually by opening shallow ditches.
According to the strictest system for managing water in Korla, the uniform quota of irrigation (from the Shibatuan canal) allotted to the irrigation district of the test site to irrigate fragrant pears is 6600 m³/ha. In the present experiment, we set three levels or volumes of irrigation, each expressed as a percentage of evapotranspiration estimated for the crop, namely, 70%
ETC (W1), 85%
ETC (W2), and 100%
ETC (W3) (
Table 1).
ETC was calculated as follows [
26] (Equation (1)):
In the formula,
ET0 is the reference evapotranspiration of the Korla fragrant pear during its growth period, calculated according to FAO-56 Penman Monteith (FPM) in the test area (
Figure 1), and
Kc is the crop coefficient of the Korla fragrant pear, determined according to its growth stage [
26]. Intelligent ecological sensors from Shang and Tian Qi Weather Station (INSENTEK Oriental Zhigan Co., Ltd., Hangzhou, China) were buried in the field.
ETC and
ET0 were obtained based on the measured soil moisture and meteorological data. Irrigation began in early May, was repeated every 15 days, and ended in late August—a total of eight rounds of irrigation during the whole growth period were conducted (
Table 2). The actual volumes for the three levels were 4549.20 m³/ha (70%
ETC), 5550.02 m³/ha (85%
ETC), and 6604.53 m³/ha (100%
ETC).
The experiment comprised a total of nine treatments, each replicated three times. The experiment began in early April 2021, and the fruits were harvested on 6 September. The whole growth period amounted to 150 days. Fertilizers were given along with irrigation water. The water-soluble fertilizer mix (Shaanxi Qifeng Meinong Biotechnology Co., Ltd., Baoji, China) consisted of N, P, and K (5-10-35) and potassium sulfate (N, P, and K; 10-30-10), mixed in a ratio of 2:5 (N, P, and K as 1-1.23-1.66), and the dose was 750 kg/ha, given in five equal doses of 150 kg/ha each on 10 May, 9 June, 24 June, 9 July, and 8 August. The dissolved fertilizer mix was applied to each experimental plot through a differential pressure fertilizer tank. In each treatment, the basal fertilizer was applied close to the root zone that was shaded by the tree canopy of the pear tree at the early flowering stage. The basal fertilizer was supplemented with sheep manure (49.95 m³/ha) and a fungal biofertilizer (1249.95 kg/ha), applied in strips 25 cm wide and 30 cm deep. Winter irrigation (flood irrigation) was given in mid and late October of each year, and spring irrigation (flood irrigation) was given at the end of March (each at 1200 m³/ha). These irrigation methods and volumes were common to each treatment in order to enable the influence of each unique treatment on the test indexes to be isolated.
2.3. Measurement and Evaluation
2.3.1. Measurement of Soil Salinity and Moisture
The Trime-pico IPH/T3 TDR soil water salinity measurement system (IMKO, Ettlingen, Germany) was used, which is based on time domain reflectometry: the TDR measuring tube was placed 30, 60, 90, or 120 cm away from the trunk and perpendicular to the soil surface, and a monitoring system (Shang) of INSENTEK Oriental Zhigan (China) was placed between two trees along the tree line (
Figure 4). The data were corrected for drying before the measurements, and the volume of water was monitored in the 0–100 cm soil layer at depth intervals of 20 cm from 4 to 9 months before and after irrigation and after rainfall.
2.3.2. Measurement of Growth
The length of new shoots and the leaf area were measured at the flowering stage, the fruiting stage, and the fruit expansion stage. Three plants were randomly selected from each treatment and marked. The lengths of five new shoots were measured (five shoots from the upper, middle, and lower parts of the canopy) using a tape measure, and the average value was taken. Fully formed leaves of different sizes were selected from each of the sampled trees, and 12 leaves were randomly selected from the four directions (east, south, west, and north) of the upper, middle, and lower parts of the tree. The area of each leaf was measured after scanning each leaf by using an image-measuring device (ymJ-B, Topyunong Technology, Hangzhou, China).
2.3.3. Measurement of Quality
Twenty-four fruits were randomly selected from four directions (east, south, west, and north) in the middle and lower parts of the marked trees. Digital calipers were used to measure the length and the width of each fruit, and the hardness of each fruit was tested using a gY-1 fruit hardness tester (Topyunong Technology, Hangzhou, China). The content of vitamin C was determined by 2, 6-dichlorophenol titration; the content of soluble sugar was determined by a hand-held saccharometer; and the content of stone cells was determined by the freezing, separation, drying, and weighing methods.
2.3.4. Measurement of Yield, Water-Use Efficiency, and Nitrogen Partial Factor Productivity
At maturity, two or three fruits were selected from each of the four sides of the tree to be sampled and from its center. Each fruit was weighed using an MP200 (Zhejiang Top Yunnong Technology, Zhejiang, China) electronic balance. The measurements were repeated three times, and the average value was taken. Three other trees were selected at random from each treatment, and the weight of all the pears on each tree was recorded to calculate the average yield per plant. Equation (2) was used to calculate the yield from each treatment:
where
Y is the yield (kg) per treatment,
N is the number of trees in the treatment area, and
M is the yield per plant (kg) [
27].
The irrigation water-use efficiency was calculated using Equation (3):
where
Y is the yield (kg) in each treatment,
I is the corresponding volume of irrigation (m³) for that treatment, and
IWUE is the irrigation water-use efficiency (kg/m³) [
28,
29].
The nitrogen partial factor productivity was calculated using Equation (4):
where
Y is the yield (kg) in each treatment,
F is the amount of nitrogen (kg) applied in the corresponding treatment, and
PFPN is the nitrogen partial factor productivity (kg/kg) [
30].
The net profit was determined according to Equation (5).
where
N is the net profit (CNY/ha),
G is the economic income (CNY/ha),
WC is the water and electricity cost during the entire fertility period,
FC is the fertilizer cost (CNY/ha), and
L is other costs such as the field management fee, pesticide charges, and labor charges [
31].
According to a previous study [
31], the grade of the commercial fruit of Korla fragrant pear was classified into A, B, and C. In 2021, the purchase guide price of Korla fragrant pear was as follows: A grade fruit: 11 CNY/ha; B grade fruit: 7.9 CNY/ha; C grade fruit: 6 CNY/ha. Economic income
G is determined according to Equation (6).
where
a,
b, and
c denote the mass of the A, B, and C grade fruits per hectare (kg/ha), respectively.
2.4. Statistical Analysis
Calculations of the total score and the score of the principal component analysis (PCA) [
32] are shown in Equations (7) and (8), respectively:
where
Fi is the i
th principal component score;
U1i,
U2i...,
Upi is the score coefficient of the i
th principal component;
Xp is the value after standardized treatment;
F is the principal component comprehensive score; and
Wi is the i
th principal component weight or the contribution of each principal component factor.
The data were sorted using Excel 2010 (Microsoft, Redmond, WA, USA). SPSS ver. 22.0 (IBM, Armonk, NY, USA) was used for the analysis of variance (the least significant difference method; the significance level was set at p = 0.05) and for the PCA of the test data. Origin 2017 (OriginLab, Northampton, MA, USA)was used for producing the graphs.
3. Results
3.1. Effects of Irrigation Patterns on Soil Water and Salt Distribution
3.1.1. Soil Water Distribution
Figure 5 shows the average pattern of such distribution under the different methods and volumes of irrigation, mainly from the 0–70 cm layer of soil, which is where most of the root biomass, including the absorbing roots, occurs in Korla pear [
33].
It can be seen from
Figure 5 that both the method of irrigation and its volume affect the distribution of water significantly.
Under the same irrigation method, the soil moisture content and the extent of displacement of the wetting front increased with the increase in irrigation volume. For example, the soil moisture content under W3 increased by 23.7% and 12.3%, respectively, compared to that under W1 and W2, when water was supplied through root zone infiltration.
Under the same Irrigation quota, the soil moisture vertical diffusion values after root zone infiltration irrigation and underground drip irrigation were higher than those for the other treatments, the layers of soil water distribution uniformity were good, and the surface drip irrigation treatment at the 0–20 cm depth produced soil moisture that was more concentrated in the water below, which showed that there was obvious horizontal diffusion.
Flood irrigation produced obvious soil moisture stratification. There was only a marked change in soil water in the vertical direction. The soil moisture content in the 0–60 cm soil layer under CK was lower than that under F1W3, F2W3, and F3W3, and the soil moisture content in the 60–100 cm soil layer under CK was 5.33–28.09% higher than that under F1W3 and lower than that under F2W3 and F3W3.
In general, F3W3 recorded the largest wet area and soil moisture content, with uniform distribution and the horizontal and vertical displacements reaching 120 cm and 100 cm, respectively, a pattern particularly suitable for the root growth of the pear.
3.1.2. Distribution of Soil Salinity
Changes in the distribution of salt and the rate of desalting in the root region under each treatment are shown in
Figure 6 and
Figure 7, respectively. Areas with a low salt content and high desalting rate are basically the same as the irrigated and humid areas. Under F1, the main desalting areas were mainly distributed in the 0–40 cm layer and in the shape of a funnel.
Under F2 and F3, the desalting areas were distributed mainly in the 30–80 cm layer, in an oval or circular pattern, respectively. Under flood irrigation, the areas with low salt content were distributed mainly in the surface layer (0–40 cm), and the changes in the salt distribution and desalting rate showed a vertical stratification.
Under a given volume of irrigation and compared to F1, the main desalting areas under F2 and F3 occurred in the 30–80 cm layer, whereas the salt-rich areas were confined mostly to depths greater than 80 cm.
The lowest salt content and maximum desalting rate among different irrigation volumes were attained under F3, whereas the salt content was maximum under F1. The distribution of salt under F2 and F3 showed a similar pattern, whereas the salt content was lower under F3, although not significantly different from that under F2.
For a given method of irrigation, the salt distributions among different volumes of irrigation were similar. As the volume increased, the area with low salt content and low desalting became larger, while the maximum salt content and the extent of the salt-rich area decreased and gradually moved to the deeper soil layer.
Under W1, the lowest salt content was 2.83 (under F3), and the maximum desalting rate was 40.67%; under W2 and W3, the lowest salt content was 2.53 (under F3) and 2.30 (under F3), levels that were 10.6% and 18.7% lower, respectively, than those under W1, and the maximum desalting rate was 46.96% and 51.57%, respectively.
Under W3, the salt in the 0–20 cm layer under flood irrigation was 2.4% lower than that under F1, 8.3% lower than that under F2, and 11.0% lower than that under F3. In the 20–100 cm soil layer, the soil salt content after flooding irrigation in the soil 0–80 cm away from the tree trunk in the horizontal direction was higher than that for the F2 and F3 treatments, but the soil salt content after flooding irrigation in the soil 80–120 cm away from the trunk in the horizontal direction was lower than that for the F2 and F3 treatments.
3.2. Effect of the Pattern of Irrigation on Growth
3.2.1. Length of New Shoots
The length of new shoots increased gradually as the growth period advanced (
Table 3) and rapidly from the growing period to the flowering stage, only to slow down again after the flowering stage.
For a given method of irrigation, the new shoots under W3 were significantly longer than those under W1 and W2 at all growth stages, except for the initial stage of growth (beginning 10th April). On average, the new shoots grew at the rate of 0.88 cm/d under W1, 0.99 cm/d under W2, and 1.1 cm/d under W3. However, for a given volume of irrigation, the method of irrigation had no effect on the rate of growth of new shoots.
3.2.2. Leaf Area
Changes in the leaf area from April to June under different treatments are shown in
Table 4. The leaf area was significantly influenced by the volume of irrigation: the larger the volume, the larger the leaves. As irrigation continued, the leaves continued to become larger and reached their maximum size by the end of June.
Treatment W3 produced the largest leaves (average leaf area was 4699.48 mm²), followed by W2 (4491.40 mm²) and W1 (4065.11 mm²), the corresponding increase over W1 being 9.49% and 13.50%, respectively.
For a given volume of irrigation, however, the method of application made no significant difference to the leaf size.
3.3. Fruit Quality
The volume of irrigation and the method of irrigation had extremely significant (
p < 0.01) effects on the content of volatile compounds (VC) and stone cells in the Korla fragrant pear (
Table 5); the method had a significant influence on the content of soluble sugar (0.01 <
p < 0.05), as did the volume (
p < 0.01). The interaction between the volume and the method had significant effects on the levels of soluble sugar, titratable acid, VC, total sugar, and stone cells and on the sugar:acid ratio and solids:acid ratio (
p < 0.01).
Compared to the levels under W2 and W3, those of soluble sugar, VC, and total sugar under W1 were lower by 6.47%, 4.65%, and 7.67% and by 4.08%, 4.93%, and 6.09%, respectively, whereas the proportion of stone cells increased by 40.00% and 10.53%, respectively. For a given volume of irrigation, the average value of the measures of flavor quality under F2 and F3 was always higher than that under F1 and CK, and the values of soluble sugar, VC, and total sugar and the sugar:acid ratio and solids:acid ratio peaked under F3W2. In general, the flavor was superior under F2 and F3, and the contents of soluble sugar, titratable acid, VC, and total sugar increased with the increase in the volume of irrigation; however, the volume had no significant effect on the contents of titratable acid and total sugar.
3.4. Effects of Irrigation Pattern on Physical Quality of Fruit
The method of irrigation had a significant (
p < 0.01) effect on fruit weight (
Table 6), the hardness of the peel, and fruit diameter (0.01 <
p < 0.05), and the volume of irrigation had a significant effect on the hardness of the peel (0.01 <
p < 0.05) and on the transverse diameter of the stone (
p < 0.01). The interaction between the method and the volume had a significant effect on the hardness of the peel, the diameter of the fruit core (0.01 <
p < 0.05), and fruit weight (
p < 0.01). On the other hand, neither the amount nor the method nor their interaction had any significant effect on fruit shape index (
p > 0.05), and there was no significant difference between them (
p > 0.05).
Fruit weight increased with the volume of irrigation, whereas the hardness of the peel decreased as the volume increased. The diameter of the fruit core was affected neither by volume nor by the method of irrigation. Fruits under W1 were lighter by 6.98% than those under W2 and by 7.83% than those under W3 but were harder by 6.22% and 10.12%, respectively. For a given volume of irrigation, fruits under F2 and F3 were heavier than those under F1 and CK (flood irrigation) but also softer than those under F1. The heaviest and the softest fruits were produced under the combination F2W3.
3.5. Yield, Partial Nitrogen Fertilizer Productivity, and Irrigation Water-Use Efficiency
Table 7 shows the effects of different methods and volumes of irrigation on yield, partial nitrogen fertilizer productivity (PEP
N), irrigation water-use efficiency, and Net Profits. Irrigation at higher volumes increased the yield significantly up to a point, but the extent of the increase went down beyond that point. Yields under W3 were significantly higher by 5.89–13.85% compared to those under W2 and by 4.08–13.13% compared to those under W1. For a given volume of irrigation, the yield under F2 and F3 was significantly higher than that under F1 but showed no significant difference between F2 and F3. The highest yield was obtained under F3W3, followed by that under F3W2.
As the volume of irrigation increased, IWUE decreased but PEPN increased. Compared to that under W1, the IWUE under W3 was lower by 26.22–32.49% (p < 0.05), and PEPN was significantly higher, by 5.88–13.85% (p < 0.05); however, W3 and W2 showed no significant difference between them in terms of IWUE and PEPN. For a given volume of irrigation, IWUE and PEPN under F3 and F2 were always higher than those under F1. Under W1, the IWUE of F3 and F2 was higher by 3.61% than that under F1, whereas PEPN increased by 3.49% and 3.51%, respectively. Similarly, IWUE increased by 6.28% and 5.08%, respectively, under W2, and PEPN increased by 6.18% and 5.03%; under W3, IWUE increased by 5.08% and 3.61%, and PEPN increased by 5.14% and 3.77%, respectively.
With the increase in the irrigation amount; both the income and net benefit increased. The irrigation method and irrigation amount had significant effects on the economic income and net profit (p < 0.01); the coupling of the two has no significant effect on the economic income and net profit (p < 0.05); the maximum income and maximum net benefit occurred in the F3W3 treatment; and the minimum economic income and minimum net profit occurred in the F1W1 treatment. Compared with W1; the economic income of W2 and W3 increased by 6.53–19.52% (0.01 < p < 0.05); and the net profit increased significantly by 8.09–22.36% (0.01 < p < 0.05). Under the same irrigation amount; compared with F1; the economic income of the F2 and F3 treatments increased significantly by 3.61–6.58% (0.01 < p < 0.05); and the net profit increased significantly by 3.68–7.00% (0.01 < p < 0.05)
3.6. Optimization of Irrigation Based on Yield and Quality
Principal component analysis makes such an evaluation possible [
26]. The present study chose the following measures of quality: soluble sugar (X1), vitamin C (X2), titratable acid (X3), total sugar (X4), proportion of stone cells (X5), fruit weight (X6), hardness of peel (X7), and yield (X8). The load of each factor and the variance of its contribution are shown in
Table 8.
The eigenvalues of two principal components were extracted by principal component analysis >1. Their cumulative contribution reached 82.267%, indicating that the two principal components contained most of the information from the eight indicators. Therefore, these two principal components were used instead of the original eight measures to evaluate quality. The first principal component explained 68.877% of the total variation, mainly reflecting the effects of soluble sugar (X1), vitamin C (X2), total sugar (X4), stone cell (X5), fruit weight (X6), peel hardness (X7), and yield (X8). The second principal component explained 11.018% of the total variation, mainly reflecting the influence of titratable acid (X3).
Combined with Equations (7) and (8), the principal component scores and comprehensive scores were calculated and sorted according to the comprehensive score values. The results are shown in
Table 9. Fruits of the best quality were obtained under F3W2. The volumes of irrigation were ranked as W3 > W2 > W1; too low or too high volumes were not conducive to quality. For a given volume of irrigation, the methods were ranked as F2 > F3 > F1 > CK. However, there was little on the basis of which to choose between F2 and F3, indicating that both methods are comparable in improving the quality of fragrant pears.
4. Discussion
The distribution of soil water influences the root system profoundly, thereby contributing to a greater yield, superior quality, and higher efficiency of resource utilization. In this study, different methods and volumes of irrigation affected the distribution of soil water significantly: for a given method of irrigation, its volume influenced the content of soil water and the displacement of the wetting front, with higher volumes leading to a more uniform distribution of soil water among different layers of the soil. However, for a given volume, surface drip irrigation resulted in soil moisture being confined only to the top (0–20 cm) layer, although it did promote more uniform distribution on the horizontal plane. Ji [
34] showed that pear roots are found mostly in the region 50–80 cm away from the trunk in the horizontal direction and 20–60 cm away in the vertical direction during the entire growth period. Higher volumes of irrigation can promote the growth of roots [
35,
36], and it is root density that determines the absorption of water and nutrients [
27]. Under F3W3, in this experiment, the extent of the wetted area and moisture content were at the maximum, and its distribution was more uniform. The wet displacement reached 120 cm horizontally and 100 cm vertically, thereby ensuring good root growth and, ultimately, the quality of fragrant pear. Liu [
6] examined the distribution of soil water under different methods of micro-irrigation and found that the distribution was relatively uniform under the different irrigation methods and was concentrated mainly in the 20–60 cm layer vertically and within 120 cm from the tap root horizontally, which matches the results of our study. Wang [
37] studied the soil water content and salt migration under drip irrigation in fragrant pear and reported that, as the volume of irrigation increased, the soil moisture content showed greater variation vertically, and the salts migrated over longer distances in humid areas. These observations are also consistent with our results.
In fragrant pear orchards in saline soils, the method of irrigation and its volume also affect the shape of the moist zone of soil, thereby affecting the distribution of soil salinity. Zhao [
38] showed this clearly with micro-irrigation as compared to flood irrigation: both methods led to salt accumulation, mainly at depths up to 50 cm, with micro spray irrigation resulting in a higher salt content than that from ground drip irrigation and subsurface drip irrigation showing the lowest salt content; this is a trend that matches the pattern found in our study. We found that, compared to surface drip irrigation, the zone with the lower salt content was deeper (30–80 cm) under subsurface drip irrigation and root zone infiltration irrigation, the salt-rich zone being even farther (deeper than 80 cm). The lowest salt content was obtained under the root zone infiltration method, and the highest was obtained with the surface drip method. It must be noted that appropriate salt stress can improve fruit quality [
39]. The zone with low salt content seen with the root infiltration method closely matched the zone in which most of the root system was concentrated and thus ensured optimal salt stress, leading to higher fruit quality.
In arid areas, the amount of soil water is the key factor limiting plant growth [
33], ultimately affecting such variables as the length of new shoots, the stem diameter, the leaf area, and, eventually, the yield. Root zone infiltration can also increase the content of humus and nutrients to some extent [
17], thereby indirectly improving the structure of soil aggregates, making them more conducive to conserving soil water and nutrients and providing suitable soil conditions for the growth of fragrant pear. Different volumes and methods of irrigation can affect the root growth and, in turn, the yield. The volume, for example, can affect water absorption and transpiration: insufficient irrigation leads to shorter internodes in new shoots and smaller leaves; both, in turn, affect dry matter accumulation and, ultimately, the yield. The irrigation method affects the distribution of soil water: it can lead to the deeper penetration of roots, thereby promoting water absorption from the deeper layers; that, in turn, promotes the growth of above-ground organs and, ultimately, increases the yield. In the present experiment, new shoots were longer and leaves were larger—irrespective of the method of irrigation—under an adequate volume of irrigation (W3) compared to those under moderate (W2) or low (W1) volumes. These results are consistent with those reported by most scholars [
40,
41,
42,
43]. The maximum volume of irrigation tested in the present experiment was 6604.53 m³/ha, which is fairly close to the 6723.00–7401.00 m³/ha volume used by Liu and Zhao et al. [
6,
38]. However, these studies on micro-irrigation with respect to growth, including those by Zhao [
38] and Yan [
43], have a few limitations: the study by Liu [
6] found that neither the length nor the stem diameter of new shoots were affected by the method of irrigation, which is contrary to the reports by Yan and Zhao et al.; the discrepancy may be because fragrant pear is a perennial, and the effect of the irrigation method on tree growth may vary from year to year. A multi-year experiment is necessary to confirm the results.
Zhao [
38] reported that the output for micro-sprinkling irrigation was higher than that of flood irrigation, while the outputs for surface drip irrigation and subsurface drip irrigation were basically the same as that for flood irrigation. This result is inconsistent with the research results from this experiment, which may be due to the comprehensive influence of the irrigation amount, the tree age, and the planting management method. In the present experiment, for a given volume of irrigation, root zone and subsurface drip irrigation led to significantly higher yields, mainly because both these methods lead to larger volumes of moist soil, extending horizontally as well as vertically. Therefore, the root systems tap a larger volume of soil to absorb moisture, which leads to a higher water-use efficiency and, ultimately, to a higher yield. We also noted that, although higher volumes of irrigation led to higher yields, they also lowered water-use efficiency, the lowest efficiency being recorded with the highest volume. When Yan [
39] compared underground drip, surface drip, sprinklers, and surface irrigation in terms of the quality of fragrant pear, subsurface drip was found to result in maximum levels of soluble solids, sugar, and acid—a finding that matches the finding of our experiment. The method of irrigation affected the content of soluble sugar significantly (
p < 0.05), as did the volume of irrigation (
p < 0.01), and the interaction between the volume and the method also affected the following values significantly: soluble sugar, titratable acid, VC, total sugar, proportion of stone cells, sugar:acid ratio, and solids:acid ratio (
p < 0.01).
5. Conclusions
The distribution of water and salt in the soil was significantly affected by the method and the volume of irrigation. The wet zone was more uniform and the soil water content was significantly higher under root zone infiltration than under surface drip or subsurface drip. For a given method of irrigation, higher volumes of irrigation promoted the leaching of salt, and the lowest salt content was recorded under the root zone infiltration method.
For a given method of irrigation, higher volumes of irrigation also promoted growth, yield, and fruit quality, the best results being under the treatment in which the volume of irrigation was equivalent to evapotranspiration. For a given volume of irrigation, the growth and fruit quality under root-zone infiltration were significantly better than those under surface drip, whereas surface drip and subsurface drip gave comparable results.
Principal component analysis showed that, as far as the comprehensive quality of fruit was concerned, the volume of irrigation that matched evapotranspiration gave the best results, followed by the intermediate volume and then the lowest volume. The best method in those terms was subsurface drip, followed by, in order, root zone infiltration, surface drip, and flooding. Overall, irrigation that equals evapotranspiration in terms of volume and that is applied as root zone infiltration irrigation gives the highest yield, quality, and resource utilization efficiency (water and fertilizers) in Korla fragrant pear.


 ,
, 


