Article

Protective Effects of Systiva® Seed Treatment Fungicide for the Control of Winter Wheat Foliar Diseases Caused at Early Stages Due to Climate Change

by
Ioannis Vagelas
1,
Chris Cavalaris
1,*,
Lefkothea Karapetsi
1,2,
Charalambos Koukidis
3,
Dimitris Servis
3 and
Panagiotis Madesis
1,2
1
Department of Agriculture Crop Production and Rural Development, University of Thessaly, Fytokou Str., GR-38446 Volos, Greece
2
Institute of Applied Biosciences, CERTH, GR-57001 Thessaloniki, Greece
3
BASF Hellas, Technical Market Development, Crop Protection, 2 Paradissou Str., GR-15125 Athens, Greece
*
Author to whom correspondence should be addressed.
Agronomy 2022, 12(9), 2000; https://doi.org/10.3390/agronomy12092000
Submission received: 2 August 2022 / Revised: 17 August 2022 / Accepted: 19 August 2022 / Published: 24 August 2022
(This article belongs to the Section Pest and Disease Management)

Abstract

:
Foliar fungal diseases are a serious threat to winter wheat production and climate change appears to favor pathogens associated with leaf blotch and tan spot symptoms in the Mediterranean area. The present work aimed to highlight these risks and propose appropriate disease management strategies by evaluating the seed treatment with the Systiva® (BASF) fungicide as a means to protect the crop against foliar fungal infections during the early growing stages. Towards that aim, plant tissue symptoms affected by the pathogens Pyrenophora tritici-repentis and Septoria spp. were systematically recorded in a study field in the region of Larissa, central Greece for three years (2016–2018), and the findings were associated with the monthly weather anomalies. Consequently, for the growing period of 2021–2022, a field experiment was established in the same disease prone field, comparing different doses of the seed treatment with Systiva® fungicide against leaf blotch and tan spot diseases. The evaluation was made by visual disease assessments, remote sensing with an unmanned aerial vehicle (UAV) and metagenomics analysis. Parallel measurements on straw residues were also made to characterize the plant residues perithecia (pseudothecia). Visual leaf disease assessments and UAV remote sensing data showed that Systiva® treatments at doses of 125 cc and 150 cc per 100 kg of wheat seed can reduce the percentage of infected wheat plants caused by foliar fungal pathogens at wheat growth stages GS23-25 and GS30-31. Moreover, the metagenomics analyses performed on the microbial communities revealed that Systiva® can decrease the degree of infection by P. tritici-repentis and Z. tritici but do not provide sufficient protection against P. nodorum. Foliar diseases were influenced by the soil surface area covered with straw residue with a high proportion of natural inoculum (pseudothecia/ascospores).

1. Introduction

Wheat is one of the world’s most important staple crops in temperate zones, characterized as a major source of calories and plant-based protein while also providing plenty of nutrients, fibers, and antioxidants for human nutrition [1,2]. According to Simón et al. [2], agriculture in 2050 will need to produce about 50% more food because of the increase in world population, and thus wheat production must also increase as the consumption of wheat products is rising.
Wheat productivity is threatened by climate change [3]. It is recognized that for a disease to spread, a compatible pathogen should interact with a susceptible host when the environmental conditions favor the disease development (disease triangle). The overwintering, survival, and infection efficiency of wheat pathogens can all change as a result of a change in temperature and other climatic factors, such as precipitation. This could change the prevalence and severity of a disease at a specific location [3,4]. Thus, future demand must be met by coordinated management of the most severe wheat diseases to sustain growth.
Pathogenic fungi causing wheat rusts and blotch diseases represent a significant constraint to wheat production. Blotch diseases (Septoria diseases and tan spot) caused by Zymoseptoria tritici (syn. Mycosphaerella graminicola or Septoria tritici), Parastagonospora nodorum (syn. Phaeosphaeria nodorum, S. nodorum, Stagonospora nodorum, or Leptosphaeria nodorum), and Pyrenophora tritici-repentis are the most devastating diseases of wheat [5,6,7]. Nowadays in Greece, the winter wheat crop suffers from those three important fungal leaf spot diseases—Z. tritici, P. nodorum, and P. tritici-repentis—tillering through the ripening stage of wheat [7]. Although these diseases are occurring predominantly in the central part of Greece, they are now causing also damage in the north and northeastern parts of Greece as well. In Greece during the last decade, the grain losses caused by those three pathogens displayed temporal and geographical variation. Furthermore, the economic significance of the wheat blotch diseases (Septoria infections and tan spot) are substantial including direct losses and control costs [7].
In central Greece, the tan spot caused by the fungal pathogen, P. tritici-repentis, has been identified as the most important pathogen in affected areas that have used minimum or zero tillage practices (unpublished observations). In those areas [8], straw segments serve as the refugee of the pathogen with high pseudothecia densities. Pseudothecia release ascospores (primary inoculum) infect plants during the early growing season, resulting in a significant decrease in wheat yield and quality [9].
Wheat foliar diseases, such as the tan spot and Septoria blotch, have a propensity for rapid epidemic development from low levels of inoculum through ascospores infection [10,11,12] given suitable conditions for conidia or pycnidial formation and infection after the tillering growth stage through the ripening stage [7]. It is known that leaf blotch diseases of wheat, such as Septoria nodorum blotch (P. nodorum), Septoria tritici blotch (Z. tritici) and Tan spot (P. tritici-repentis), can cause severe yield losses (up to 50%) worldwide and are mainly controlled by fungicide applications [13,14]. Moreover, it is well recognized that yield responses to fungicide applications are significantly affected by the disease severity of leaf blotch diseases, which is driven by weather and host susceptibility [15,16,17]. Epidemics of disease [18,19,20,21] caused by leaf blotch diseases of wheat in fields under minimum tillage, or more systematic studies, e.g., metagenomic data analysis [22,23], are lacking in central Greece.
The use of fungicides, such as Propiconazole in wheat against P. tritici-repentis and Septoria spp. complex in wheat, in the central region of Greece was examined in [7]. Propiconazole (Group 3, triazole) is a high performing, low-cost fungicide and essential to maintain control of the Septoria disease complex. Propiconazole is also known as a demethylation inhibiting fungicide due to its binding with and inhibiting of the 14-alpha demethylase enzyme from demethylating a precursor to ergosterol. Applications of Propiconazole at the growth stages GS32/33 and GS37/39 significantly reduced the yield loss due to P. tritici-repentis and Septoria spp. fungal pathogens, compared with the untreated control [7]. However, wheat pathogen populations, such as Septoria spp., have genetic diversity [20,21] and typically present a greater risk of developing fungicide resistance to traditional fungicides, such as Propiconazole, especially when Propiconazole is employed alone (not in mixture with other strobilurin fungicides). Apart from the existing standard fungicides for controlling foliar diseases, such as propiconazole, new fungicides, e.g., the seed treatment product Systiva®, (BASF) could potentially change the management strategies of foliar diseases of wheat in Greece by controlling disease pressure in the early crop growth stages.
Systiva® (i.e., Fluxapyroxad) is a seed treatment fungicide that controls multiple devastating fungal diseases. Fluxapyroxad belongs to the carboxamide class of chemicals and its mode of action is an inhibition of succinate dehydrogenase complex (SDHI, complex II) of the respiratory chain and disrupts cellular respiration [24]. SDHIs have a narrower spectrum of control but longer residual activity than other fungicides and are highly active in the diseases that they target. Fluxapyroxad provides preventative and curative activity by inhibiting spore germination. In 2015, it became the best-selling SDHI fungicide, with global market sales of USD 390 million [25]. Fluxapyroxad has been also reported to be very toxic to aquatic organisms, such as Cyprinus carpio [26]. However, due to its excellent antifungal activity, Fluxapyroxad has been widely used to control various crop diseases caused by fungi [27].
The objective of the present article is to provide some evidence that the severity of leaf blotch diseases in winter wheat have increased during the recent years due to more favorable conditions related to climate change and to explore the aim that seed treatment products, such as Systiva®, can provide protection against some foliar pathogens that occur in early growing crop stages.

2. Materials and Methods

2.1. Study Field

A 0.85 ha field cultivated constantly with winter wheat using minimum tillage practices was selected in the region of Larissa, central Greece (22,4735588 39,4826641, EPSG 4326). Visual assessments of leaf blotch and tan spot fungicide diseases were carried out during the 2016–2017 and 2017–2018 growing period focusing on the initial growing stages of the crop, from tillering to stem elongation (Zadocks scale GS25–GS31) [28]. During that period, the infestations come from the inoculum that survives in the previous crop residues. The visual assessment methodology is described in 2.4. The findings were also analyzed in view of climate condition changes assessed from historical weather information.
For the 2020–2021 growing period, a trial was established on the same field to evaluate the potential of using the Systiva® fungicide (Fluxapyroxad 33% w/v, other ingredients 69.81 w/w) as a means to protect initially the crop. In parallel, previous crop residues were sampled and examined to access the pathogen inoculum. The crop was established again with minimum tillage practices comprising of one pass of a disk harrow and one pass of a field cultivator. The trial consisted of wheat variety MONASTIR R2 produced by commercial seed company Efthymiadis (www.efthymiadis.gr, assessed 18 August 2022) that was treated with Systiva® fungicide at different doses (S0, S100, S125 and S150). The treatments were:
(1)
S100: wheat seeds treated with 100 cc Systiva® per 100 kg of wheat seed
(2)
S125: wheat seeds treated with 125 cc Systiva® per 100 kg of wheat seed
(3)
S150: wheat seeds treated with 150 cc Systiva® per 100 kg of wheat seed and
(4)
S0, control: wheat seeds without Systiva® treatment
The sowing rate was 250 kg per ha. A randomized complete block design was used with four replicates of four treatments, as presented in Figure 1. Each plot was 15 m × 3 m and the total area of each treatment 180 m2. As though, 25 kg of seed was required for each treatment. In our case, we treated 40 kg of seed with a dilution that consisted of 4 kg of water and the corresponding doses of Systiva® (4.50 g, 5.62 g and 6.75 g for treatments S100, S125 and S150 respectively). The seed was sprayed and mixed in a pot and then added to a 3 m wide drilling machine. After sowing each treatment, the residual seed was removed from the drill and the machine was thoroughly cleaned before adding the next mixture.
The performance of the Systiva® treatments was evaluated on four basis; (i) through assessment of the microbial community profile in the crop residues and evaluation of its epidemic potential (ii) through visual disease assessments on crop leaves, (iii) through identification of symptoms from remote sensing with an unmanned aerial vehicle (UAV) and (iv) through a metagenomics fungal analysis. Throughout the research, no fungicide was applied to the leaves.

2.2. Climatic Anomalies

The purpose of the study was to illustrate the regional trends in temperature and precipitation during the last decade due to climate change and how these have potentially become more favorable for the diseases. To that end, historical monthly temperature (°C) and precipitation (mm) data for the region of Larissa and the period 1980–2020 were obtained from the latest versions of the Meteoblue database (www.meteoblue.com/el/ assessed 13 June 2022). Consequently, monthly anomalies on mean temperatures and precipitation from January to June for the last decade (2011–2020) were monitored.

2.3. Residue Sampling

Wheat straw residues were collected over the cropping season 2021–2022. In detail, a sample was collected in September 2021, to characterize the plant residues perithecia (pseudothecia), before the residues come into contact with the soil. Residues samples were collected at the soil surface from five different points in each of the four replications (Repl.1 to Repl.4, Figure 1). Each sample was composed of 25 pieces of wheat residue. Residues were cut to take off remaining roots, rinsed with water to remove the soil, and air-dried in laboratory conditions. They were then cut into 1 cm pieces, in total 6 cm from the base for every 25 pieces of wheat residue, and approximately 150 pieces (25 × 6) of straw were observed under a microscope. Finally, from the wheat residue samples, the microbial community profile (pseudothecia and ascospores) was obtained. In details, the diversity of the microbial community profile was estimated as pseudothecia mean number per 1 cm of residue material, and the ascospores mean number per pseudothecia.

2.4. Visual Disease Assessment

Tan spot and Septoria blotch diseases of wheat were visually evaluated in fields based on the plant tissue symptoms affected by the pathogens Pyrenophora tritici-repentis and Septoria spp. Estimates of the percentage of disease (intensity of symptoms) [29,30] were made by determining the area of blotched, yellowing, and dead leaves on the affected plant by looking at 8–10 plants every 1 m between 2 rows of crop and deciding on the overall score. A standard area diagram (SAD) (Figure 2) was used for scoring the severity of the symptoms. The scores 1, 5, 25, 50, and 75 were used to address the percentage of leaf area covered by the disease. SAD diagrams have been broadly used to aid the validation of the severity of crop diseases [31].
Examined wheat plants were assessed at 40 sites (0.35 m distance from each site) along each treatment path. The measurements were made from the crop tillering to stem elongation growing stages (GS23-25 and G30-31, respectively). In that period, we expected that the natural dispersal of ascospores had been released and that the foliar fungal diseases had the potential to cause significant yield losses in wheat due to lower leaves infection. Further, we tested the hypothesis that the pathogens increased across cultivated years due to favored climate conditions.

2.5. Remote Sensing Assessment

The Parrot Sequoia multispectral sensor on board the Parrot Bluegrass UAV was used for aerial monitoring of the crop. Flight paths were designed with Pix4DCapture at an above-ground level of 45 m with a forward image overlap of 80% and a side overlap of 70%. Four observations were made from 23 November 2021 after crop establishment was completed, until 31 March 2022 when the crop was at the Zadoks 30–31 growing stage [28] and the seed treatment protection was ceased because second-order infections were started by releases of ascospores. Before each flight, a calibration panel provided by Parrot was pictured to calibrate the multispectral images. All the flights were carried out at noon (between 12:00 and 15:00) under clear sky conditions. Ground control points (GCPs) were also established for precise georeferences of all images. Additional RGB images of the whole experiment were obtained with a DJI Phantom P4 UAV with its onboard 4K, RGB CMOS 16Mpix camera from a height of 120 m, and a ground resolution of 3.9 cm.
The multispectral images included four channels: green 550 ± 40 nm, red 660 ± 40 nm, red-edge 735 ± 10 nm, and near-infrared 790 ± 40 nm and had a ground resolution of 6.5 cm. The images were post-processed with Pix4DMapper (https://pix4d.com, assessed 18 August 2022) software to build orthomosaics of the study area. These orthomosaics were imported by georeferencing using the GCPs into the QGIS software (www.qgis.org, assessed 18 August 2022) as multiband raster layers. RGB images from the DJI Phantom P4 sensor were also georeferenced with the same GSPs providing a multilayer project. Accordingly, the multispectral images were used to estimate two common vegetation indices, the normalized difference vegetation index (NDVI) [32], and the soil adjusted vegetation index (SAVI) [33] according to the formulas:
N D V I = n e a r   i n f r a r e d r e d n e a r   i n f r a r e d + r e d
S A V I = ( 1 + l ) n e a r   i n f r a r e d r e d n e a r   i n f r a r e d + r e d + L
where L a soil background adjustment factor given the value of 0.5.
A flood event occurring on 12 January 2022 induced some serious damage in some parts of the experimental field. In those parts, the plants were destroyed, and the ground was left bare. These areas that would affect the results, therefore, should be excluded from the data source. For that purpose, the NDVI map of 31 March 22 was used to create a field mask. During that date, the crop was sufficiently developed and differed considerably from the bare ground. An NDVI threshold of 0.40 was used to separate severely damaged areas from normal areas with mixed vegetation and soil (Figure 3). Areas with an NDVI lower than 0.4 were considered destroyed. The same mask was applied to the previous images, even to those before the flood event, to obtain compatible time series of the two vegetation indices. From each image, mean values of NDVI and SAVI were estimated for each plot and the data were extracted in CSV files for further statistical analysis.

2.6. Metagenomics Analysis of Disease Assessment

A DNA Extraction and DNA Sequence Analysis were performed on the wheat samples obtained from the four Systiva® treatments of the 2020–2021 trial. Total DNA from pools of samples were extracted using NucleoSpin Tissue isolation kit (Macherey-Nagel, Düren, Germany) according to the manufacturer’s instructions. Three replicates of each experiment were used. We used samples belonged to S0, control: wheat seeds without Systiva® treatment, S150: wheat seeds treated with 150 cc Systiva® per 100 kg of wheat seeds, respectively. DNA quality and concentration were measured by Quawell UV-Vis Spectrophotometer (Q5000). DNA samples were stored at −20 °C until library preparation was performed.
Illumina’s 16S Metagenomics Protocol (Part # 15,044,223 Rev. B) with modifications was applied for the amplification of ITS1 and ITS2 regions of the 18S rRNA gene. Two pairs of forward and reverse primers containing the Illumina overhang adapters, were designed for the amplification of the ITS1 and ITS2 regions, respectively. Forward and reverse primer sequences are, for ITS1 region, 5′-TCGTCGGCAGCGTCAGATGTGTATAAGAGACAGAGAGTTCATGCCCGAAAGGG-3′ and 5′-GTCTCGTGGGCT CGGAGATGTGTATAAGAGACAGCTGCGTTCTTCATCGAT-3′, 5′-TCGTCGGCAGCGTCAGATGTGTATAAGA GACAGGAAGGTGAAGTCGTAACAAGG-3′ and 5′-GTCTCGTGGGCTCGGAGATGTGTATAAGAGACAGAGCGT TCTTCATCGATGTGC-3′ and for ITS2 region 5′-GTCTCGTGGGCTCGGAGATGTGTATAAGAGA CAGGGTTTTGGCAGAAGCACACC-3′ and 5′-TCGTCGGCAGCGTCAGATGTGTATAAGAGACAGATCGATG AAGAACGCAG-3′, 5′-TCGTCGGCAGCGTCAGATGTGTATAAGAGACAGCGTGAAGTGTCTTGCTGGTC-3′ and 5′-GTCTCGTGGGCTCGGAGATGTGTATAAGAGACAGCACCATACTTCGCGCAACAC-3′. 2x Kapa HiFi HotStart ReadyMix was used for PCR amplification and PCR products were then cleaned using Beckman Coulter Agencourt AMPure XP Beads according to the 16S Metagenomics protocol. Attachment of indices and Illumina sequencing adapters using the Nextera® XT Index Kit, followed by a second clean-up with Beckman Coulter Agencourt AMPure XP Beads. Libraries quantification was performed using a Qubit™ 3.0 Fluorometer (Life Technology Ltd., Paisley, UK). Moreover, 2 ul of the final libraries was run on a fragment analyzer with the method DNF-473-33-SS NGS Fragment 1–6000 bp, to check the quality and verify the size of the libraries. After library quantification, normalization, and pooling, concentrations were adjusted to 12.5 pM and prepared for loading on the Illumina Miseq according to Illumina’s 16S Metagenomics Protocol (Part # 15,044,223 Rev. B). The libraries’ pool was denatured and loaded on the Illumina Miseq at 6 pM and sequenced paired end (2 × 300) using a MiSeq® Reagent Kitv3 (600 cycle) (Illumina, Inc., San Diego, CA, USA).

2.7. Statistics

2.7.1. Bioinformatics

Raw sequence data were processed using the DADA2 ITS Pipeline Workflow [34] within Galaxy [35,36]. The starting point is a set of Illumina-sequenced paired-end fastq files that have been split (“demultiplexed”) by sample. The product is an amplicon sequence variant (ASV) table, a higher-resolution analogue of the traditional OTU table, providing records of the number of times each exact amplicon sequence variant was observed in each sample. We also assign taxanomy to the output ITS sequence variants using the UNITE database.
First, the paired-end reads were organized into a paired collection and forward and reverse reads for each sample was combined into a single FASTA file. Unlike the 16S rRNA gene, the ITS region is highly variable in length. The commonly amplified ITS1 and ITS2 regions range from 200–600 bp in length. A critical addition to ITS workflow is the removal of primers on the forward and reverse reads. For that reason, the cutadapt tool was used for removal of primers from the ITS amplicon sequencing data. Quality control and visualization of the quality profiles for both forward and reverse reads was performed. Data filtering and trimming were performed to remove sequences with ambiguous bases (DADA2 requires sequences contain no Ns). Visualization of the estimated error rates was performed as a sanity check. Optimization of the files for computation was performed to remove duplicate sequences along with merge of the paired reads. An amplicon sequence variant table (ASV) table was constructed, which is a higher-resolution version of the OTU table produced by traditional methods. Finally, chimeric sequences were also removed and sequence reads were aligned against the reference alignments of the UNITE database (sh_general_release_dynamic_s_all_10.05.2021.fasta) using a naive Bayesian classifier method for this purpose [37], kmer size 8 and 100 bootstrap replicates). The external tool Phyloseq (R package), along with dada2 were used to visualize the results of our analyses: bar-plots for abundance, Alpha diversity, sequence complexities, quality plots, error plots.

2.7.2. ANOVA and Principal Component Analysis (PCA)

Statistical analysis was performed using the JASP 0.16.1 open-source statistics software (https://jasp-stats.org, assessed 18 August 2022). An analysis of variance (ANOVA) was applied for the evaluation of the four experimental treatments and statistical graphs plots, such as Descriptive and Raincloud plots, were used to indicate the main difference between treatment and describe the heterogeneity among the samples. A principal component analysis (PCA) was employed on the weather (temperature, precipitation) and disease score components for assessing the principal factors that determine the variability of disease development.

3. Results

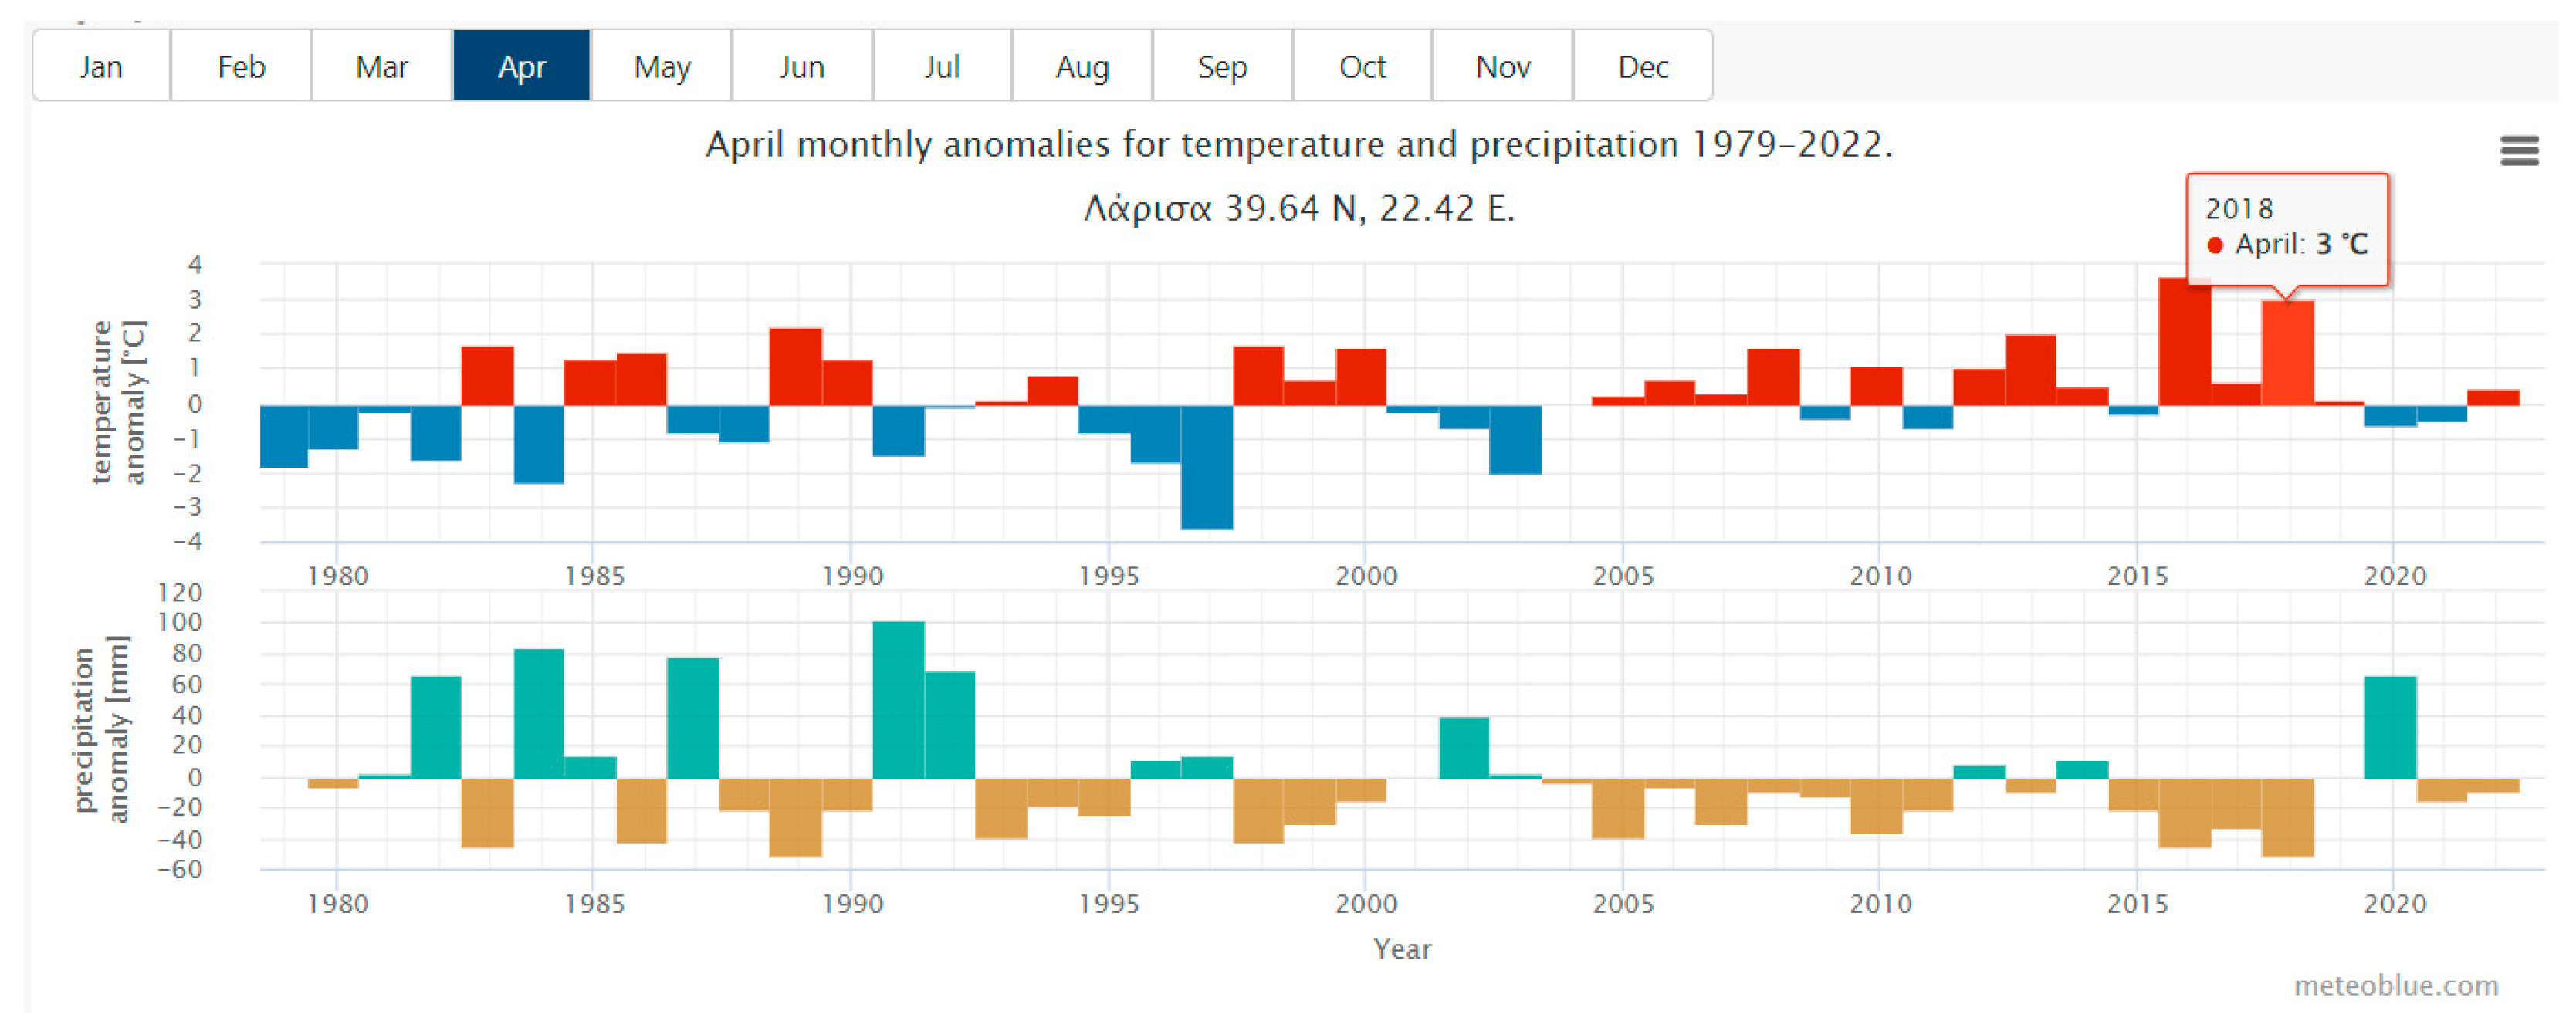
3.1. Clmate Anomalies for Monthly Temperature and Precipitation

Figure 4 shows monthly temperature anomalies detected in the region for February 2016, April 2016, and April 2018, relative to the 1980–2020 period. The considerable anomalies for February 2016 and April 2016 (5.2 °C and 3.7 °C respectively) provide some evidence of the potential future disease risks. Such a long-term change (Supplementary material Figure S1) will probably lead to a future emergence of wheat tan spot and leaf blotch diseases, such as Septoria spp. In general, the warmer years after 2012, such as 2016, 2018, and 2019 (Figure 4, and Supplementary material Figure S1), combined with the favorable rainfall conditions (Supplementary material Figure S2) were especially crucial for the occurrence of foliar diseases on wheat in the region of Larissa, central Greece (unpublished data).

3.2. Leaf Blotch Diseases Progression for Years 2016–2018 in Relation to Changing Climate Conditions

Based on the disease score displayed in Figure 5, a typical increase in the disease symptoms may be detected for both 2016 and 2018. The changes are discernable from the early crop growth stages, such as tillering. This is assessed in all reporting periods for the year 2018, leading to the hypothesis that climate change (Figure 4 and Supplementary Material Figures S1 and S2) has influenced the disease risk for persistent fungal pathogens, such as Septoria spp. and P. tritici-repentis. Moreover, the mean temperature was higher in February 2016 and in April 2016 and April 2018, which could explain the rapid spread of the symptoms and increased disease severity for pathogens, such as Septoria spp. and P. tritici-repentis, on the specific periods.
A principal components analysis was performed to determine the variability of disease development. The primary output for a PCA shows the correlation between each variable of a principal component and the variable factors PC1, PC2, and PC3 (Table 1). The three principal components PC1, PC2, and PC3 have eigenvalues higher, e.g., PC1 = 1.627, PC2 = 1.32, and PC3 = 1.017, (Table 2, Figure 6b). Further, the RC1 factor, including year, disease score, temperature, and rain, was identified according to their coefficients in the component matrix. The PC1 factor concerns the disease score and year (Figure 6a), as both components were strong positively loaded values >0.85, e.g., 0.913 for the year and 0.848 for disease score (Table 1). The PC1 factor explained 32.5% of the total variance (Table 2). The PC2 factor that includes temperature (mean) was identified as well (Figure 6a), and it explains 26.4% of the total variance (Table 2). Finally, the PC3 factor that includes calendar DAY was identified as well (Figure 6a), and it explains 20.3% of the total variance (Table 2).

3.3. Evaluation of Systiva® Treatments for Growing Period 2021–2022

3.3.1. Crop Residue Sampling

Observations of Pseudothecia density were obtained from the wheat residues from all four field plots before the sowing date. Figure 7 displays the results of Pseudothecia of the four replications (Figure 1) occurred due to straw residues. The diversity of each plot, e.g., Repl.1 to Repl.4, was estimated by calculating the mean and the standard errors of the mean (Figure 7). In our study, this natural inoculum ranged from 4.4–12.9, 4.7–15.2, 5.6–13, and 4.6–13.4 pseudothecia/cm of straw, for plots Repl.1, Repl.2, Repl.3, and Repl.4, respectively. Data show that differences between sample replicate collected from the same plot during the same sampling period were significant for perithecia communities (Figure 8). Moreover, Figure S3 in the Supplementary material indicates that there was little but not remarkable heterogeneity between the samples from the same plot. Further, we assessed the composition of these perithecia (pseudothecia), and we observed 128–270 ascospores/perithecium. The P. tritici-repentis teleomorph on all plots. Pseudothecia typically formed on the straw residue (Figure 9a), with a dome shape (Figure 9b), with the appearance of thick, dark setae and a characteristic neck structure, as described by Friesen, et al. [38].

3.3.2. Visual Winter Wheat Infections

Data presented in Figure 10 show that blotch diseases of wheat (Septoria diseases and tan spot) were influenced by the Systiva® seed treatment application doses. There was a significant interaction between Systiva® seed treatment application doses (e.g., S100, S125, and S150) and the untreated control (S0) wheat plants. The Systiva® seed treatment application 125 and 150 cc doses (S125 and S150) were verified as the most effective applications (Figure 10). Fewer symptoms (blotch diseases) were observed in these two Systiva® fungicide doses, compared to the untreated (control). This indicated that the SDHI seed treatment, fluxapyroxad (Systiva®, BASF fungicide), provided useful levels of blotch disease suppression post tillering growth stage (GS23-25) under significant natural disease pressure. Moreover, the beneficial effect of Systiva® seed treatment fungicide was recorded up to the first node (growth stage GS31), especially for treatments 125 and 150 cc (S125 and S150), which S125 and S150 treatments were not significant (Supplementary material Figure S3). The figure indicates that there was no heterogeneity between the samples for treatments 125 and 150 cc (S125 and S150) suggesting that both doses are preferable to control foliar diseases of wheat that occur at growth stages GS23-25 and GS30-31.

3.3.3. Remote Sensing Results

Figure S4 in Supplementary material presents two time series of the two vegetation indices (NDVI and SAVI) from 23 December 2021 to 31 March 2022. As can be conceived from the images, the ground cover was relatively low until the middle of February and increased considerably until the end of March. From the below images, the averages per treatment, presented in Figure 11, were estimated. The two vegetation indices reveal that at the beginning of the growing period and until the middle of January, when no diseases were yet present, there were no differences among the treatments. From the middle of February though and afterward, infections of Septoria and the tan spot had started and the Systiva® treated plots present some higher NDVI and SAVI values, compared to the control treatment. The differences were even more obvious at end of March when the infections on the plants were more severe due to the higher temperatures during that period. SAVI was more sensitive than NDVI and discerned clearer the differences among the treatments. Overall, the S125 and S150 treatments presented similar results and better protected the plants, compared to the S100 while S0 showed an obvious disadvantage compared to the Systiva® treated seeds. The ability of SAVI to discern better plant infections is due to its ability to minimize soil brightness influences, while NDVI, on the other hand, is more susceptible to saturation effects at high biomass coverages [39].

3.3.4. Metagenomics Analysis Results

There was a significant interaction between Systiva® seed treatment application dose (S150) and the untreated control (S0) wheat plants found using metagenomics analysis (Figure 12 and Figures S5–S14, Supplementary material). Metagenomics analysis of microbial communities’ sample showed directly the Systiva® effect on fungal communities’ families. In detail, fungal families were significantly influenced by the seed treatment application dose (Figure 12). Moreover, we demonstrate that the most abundant pathogenic fungal complex community were P. tritici-repentis followed by P. nodorum, M. graminicola (teleomorph of S. tritici), and Z. tritici (syn. S. tritici), (Figure 12 and Figure 13). Furthermore, there is a significantly less pathogenic fungal complex community at Systiva® treatment (S150), compared to the untreated control (S0) treatment (Figure 13). Compared to metagenomics reads between treatments (S0 and S15), metagenomics can better estimate the fungal communities’ populations among treatments providing a better tool to estimate the size of a folia fungal population of wheat leaves.

4. Discussion

The fungicide management of wheat foliar diseases in Greece has, for the last decade, been based on the use of demethylation inhibitors (DMI, Group 3), triazole fungicides, and quinone outside inhibitors (Qol or strobilurins, Group 11 fungicides). The foliar diseases of wheat, such as the blotches caused by Septoria spp., and the tan spot caused by Drechslera tritici-repentis (teleomorph = P. tritici-repentis) are the common foliar disease of wheat across central Greece due to i) the widespread cultivation of susceptible varieties, ii) the stubble retention, and iii) the favorable climatic conditions [7,40,41,42]. We suggest here that foliar diseases of wheat are influenced by the soil surface area covered with straw residue with a high proportion of natural inoculum (pseudothecia/ascospores). In detail, this natural inoculum (pseudothecia) ranges from 4.4 to 15.2 pseudothecia/cm of straw (n = 150), and approximately 128–270 ascospores/perithecium. It has been published before [7,15,18,20,21,40] that the ascospores (primary inoculum) are released from pseudothecia, which develop on crop residues (straw), and under moisture conditions germinate, penetrate, and develop mycelium within the plant tissue. Concerning the disease symptoms, the key observations of our research could be summarized as follows: (i) first symptoms of infection on wheat leaves are expressed as small irregular chlorotic lesions and 10–14 days later, necrotic lesions (dead tissues) develop at the chlorotic sites for Septoria spp., and/or for tan spot infection, (ii) as the disease progresses, the pathogen spreads to the top leaves from the lower developed leaves. We could say that pathogen spreads happen after the tillering growth stages throughout the wheat elongation growth stage. Overall, our data show that the primary source of infection occurs at the lower, more mature leaves during the tillering growth stages GS23-25.
Previous studies [21,43,44] reported that the phase of the highest sensitivity of wheat to Septoria blotch occurs during the tillering period, growth stage GS25, which is mainly associated with increased air humidity in the crop folia. As seen in Figure 13, Septoria blotch diseases was encountered by P. nodorum, M. graminicola (teleomorph of S. tritici), and Z. tritici (syn. S. tritici). Furthermore, Figure 13 suggests that P. nodorum and M. graminicola were present on the infected leaves and their ratio varied significantly between the untreated and treated with Systiva® fungicide plots. M. graminicola was eight times less in plots treated with Systiva® fungicide (Figure 13), whereas a dominance of P. nodorum was recorded in plots treated with Systiva® fungicide (Figure 13). Moreover, according to the averaged data (Figure 12 and Figure 13), an overwhelming dominance of P. tritici-repentis was revealed to be untreated plots. In untreated plots, P. nodorum, and M. graminicola were 33.8 and 48 times less common, compared to P. tritici-repentis (Figure 10), revealing that P. tritici-repentis in wheat blotch pathogenic complex in central Greece Region is a singleton. So in our case study, the necrotrophic fungus P. tritici-repentis, the causal agent of tan spot of wheat, was the most important pathogen that caused significant symptoms to the wheat plants at tillering GS23-25 growth stages and may be given special attention. Based on that, it has been found worldwide that tan spot has significant economic consequence by causing losses of up to 50% [45,46,47,48,49] and in Argentina up to 70% [50].
In addition, we found that the dominance of P. tritici-repentis was not revealed on wheat leaves in plots treated with Systiva® fungicide (Figure 10), suggesting that Systiva seed treatment is a key fungicide strategy performed well in reducing naturally foliar disease pressure occurred in tillering and stem elongation growth stages (Figure 10). Similar findings on the value of Systiva® for early control of P. teres f. maculata, a common foliar disease of barley, have been shown by McLean and Hollaway [51]. Nevertheless, the seed treatment Systiva® provided useful levels of P. teres f. maculata suppression post GS49 growth stage under moderate disease pressure and Systiva® had similar efficacy to the GS31 growth stage application of foliar fungicides when both strategies were backed up by a second foliar application at GS49 growth stage [52]. Furthermore, we show similar results where Systiva ®, as a seed treatment fungicide at doses 125 and 150 cc/100 kg of wheat seed, has sufficient disease suppression effects even at GS30-31 wheat growth stages.
Systiva® contains fluxapyroxad, a carboxamide fungicide from the Succinate Dehydrogenase inhibitors (SDHI) class and refers to a specific mode of action in FRAC group 7. SDHIs have been on the market since the late 1960s and, as defined in the FRAC info, are also used as seed treatment products. Based on specific FRAC list recommendations, SDHIs are used as a seed treatment in cereals providing foliar efficacy against pathogens with moderate/high resistance risk. Several plant pathogens, including M. graminicola (Septoria tritici blotch fungus), have already developed near-complete [53,54] or complete resistance [55], to the major fungicide classes, as the Demethylation inhibitor (DMI) and Quinone-outside inhibitors (QoIs) fungicides the succinate dehydrogenase inhibitor (SDHI) class is an effective alternative control option [56]. Moreover, when fluxapyroxad was used against P. tritici-repentis, the cause of tan spot of wheat, it gave similar results of control with the triazoles (Propiconazole and prothioconazole) when applied at GS33 (third node detection) and reduce disease progression [52]. In addition, it was found that it could also increase green leaf area duration of the crop [57,58]. Sifting the prevalence of blotch diseases of wheat relevant studies show that Z. tritici (syn. M. graminicola), the causal agent of Septoria tritici blotch, has become widespread in Europe since 1980, replacing P. nodorum [59,60], but the disease incidence of Z. tritici decreases, where Z. tritici competes with other leaf blotch diseases, such as P. nodorum and P. tritici-repentis [60,61]. Here, we presented similar data where P. tritici-repentis and P. nodorum have a direct impact on Z. tritici disease severity (Figure 13). Whereas Figure 13 shows that the use of Systiva® fungicide slightly favors the disease incidence of P. nodorum, the disease is probably not as efficiently controlled, as P. nodorum thrives best and competes with the other two leaf blotch diseases, for instance, the Z. tritici and the P. tritici-repentis.
SDHIs have a narrower spectrum of control but longer residual activity than other fungicides and are highly active in the diseases that they target. The target enzyme in the fungi is the mitochondrial succinate dehydrogenase (SDH) enzyme and the primary biochemical mode of action is the blockage of the tricarboxylic acid (TCA) cycle at the level of succinate to fumarate oxidation, leading to an inhibition of respiration [56]. Fluxapyroxad is a pyrazole/aniline fungicide classed as a Carboxamide (EPA 2012), which has preventative and curative properties operating by preventing spore germination. Their mode of action is to inhibit succinate dehydrogenase in complex II of the mitochondrial respiratory chain. The metabolic pathway of fluxapyroxad was similar in fruits, pulses and oilseeds, and cereals following foliar application, and in cereals after seed treatment [62], and after a seed treatment on wheat, fluxapyroxad was identified as the major component of the total residue, accounting for 58–79% of the TRR in forage, hay, straw, and chaff and 17% of the TRR in grains [62,63]. The residues of fluxapyroxad in wheat straw were up to 2.2 mg/kg (pyrazole label) and 2.65 mg/kg (aniline label); [62,64] suggested the occurrence of fluxapyroxad residues in plants for a long period. According to the data presented in this work, it could be concluded that Systiva ® seed treatment fungicide has a long period of protection effects against the leaf blotch diseases complex caused by Septoria spp. and P. tritici-repentis. Systiva ® fungicide application was observed to be effective against leaf blotch diseases up to wheat growth stage GS31 (Figure 10 and Figure 11).
The main factors affecting wheat yield/production are (i) inputs (soil quality, rotation, selection of variety, seed depth and rate, nutrition, irrigation), (ii) monitoring weeds, pests and diseases, and (iii) the impact of weather associated with the interaction of growing temperature and precipitation [65,66,67]. Mean wheat yield is reduced by key diseases, as mentioned above; however, nonetheless, the impacts of fungicides on the severity of foliar diseases and their effects on biomass accumulation, grain yield, milling, and end-use quality are important [2]. Wheat foliar diseases depend on local climate conditions favored by humid weather and temperatures. The fungus P. tritici-repentis, apart from the tan spot disease, causes a red discoloration, known as a red smudge [68], and is also accompanied by a seeds infection called black point [69]. In the field rather than in storage, under particular conditions, the fungus is mycotoxigenic, producing the anthraquinone mycotoxins emodin, catenarin, and islandicin [68]. Fungal growth and mycotoxin production are influenced by numerous abiotic parameters, such as water activity and temperature on fungal growth, and their complex interactions, especially the presence of competitive flora [68]. Research also showed that this major leaf spot wheat pathogen has been associated with the length of the post-inoculation wet period. Susceptible wheat varieties have been severity spotted after 6–12 h of leaf wetness, whereas resistant wheat requires a 48 h wet period for severe spotting to develop (Hosford et al., 1987). According to Hosford et al. [70], infections were few, and lesions did not grow visible after 6 h wetting at 10 C, but visible lesions were abundant after 12 or 24 h at 10 and 20 C. At that time, tan spot severity is greater on each lower leaf than on the leaf above it, especially when the temperature is raised above 10 C. In our data, as shown in Figure 3, we acquired images with the help of a drone camera to score leaf diseases. The NDVI and SAVI spectral index comparison output (Figure S4, Supplementary material) showed that the SAVI (soil adjusted vegetation index), addresses better the problem with the foliar wheat diseases (Figure 11), probably due to soil brightness when the wheat vegetative cover is low. Thus, instead of choosing SAVI or NDVI index, our data (Figure 11 and Figure S4, Supplementary material) suggested that the SAVI index gives the more realistic values for disease assessment. Nevertheless, as shown in Figure S4, (Supplementary material) the normalized difference vegetation index (NDVI) is eliminated to estimate the topographic effects due to soil influence [71], which creates SAVI, a better index related to plant properties, including green cover biomass (upper leaves) and leaf area lower leaves, infected by the foliar wheat pathogens.
In addition, results here suggest that the growth of P. tritici-repentis is probably promoted by February’s and March’s lengthening wet period and rising temperature in the region, especially in recent years (Figures S1 and S2, Supplementary material). According to data presented in Figure 4 and the association between warm weather anomalies after 2012 in the location of Larissa, we display evidence that the region’s climate anomalies potentially influence foliar wheat disease risks. We modeled those climate anomalies (Figures S1 and S2, Supplementary material), along with foliar disease scores (Figure 5). Based on our model (Figure 6, PCA analysis), we provide significant evidence that wheat foliar diseases are primarily affected by the year weather anomalies, indicating that a warmer February might impact the early establishment of wheat foliar diseases in the region.
Foliar diseases cause the most yield loss when symptoms reach the flag leaf, and if those diseases, such as leaf blotch diseases (Septoria spp., and Tan Spot), develop early and conditions favor the development of diseases, a fungicide application is required [17]. The bibliography shows that leaf blotch diseases, with severity >50% caused an average yield loss of 1072 kg/ha in winter wheat but these data verify a large regional and yearly variation in disease severity, distribution, and impact on yield, emphasizing the need to adapt fungicide applications to the actual need based on locally adapted risk assessment systems [17]. In our case, tan spot (caused by P. tritici-repentis) occurs regularly over large areas in Thessaly (central Greece), develops early and conditions favor the development of the disease (Figure 4). Plants were sensitive during the early development growth stages and temperature anomalies, and wheat residues probably had a significant impact. Finally, in this study, we found that the early occur variation in disease severity significantly decrease when wheat seeds were treated with Systiva® fungicide. This study is the first to investigate leaf blotch fungal pathogen communities’ association, detection, and control at the early growth stages of winter wheat in Greece and reveals that a treatment of 125 cc Systiva® per 100 kg of wheat seed is effective to prevent the crop during the first growing stages.

5. Conclusions

The findings of the present work suggest that climate conditions have become more favorable for pathogens associated with leaf blotch and tan spot diseases in winter wheat crops at the Mediterranean area. The foliar diseases are influenced by the soil surface area covered with straw residue with a high proportion of natural inoculum (pseudothecia/ascospores). The above diseases impose a serious threat for winter wheat production. Seeds treated with Systiva® can minimize the risk of P. tritici-repentis and Septoria spp. The beneficial effects of Systiva® seed treatment fungicide should be acknowledged, or even selected and used as (i) a first choice fungicide that provide the suppression of foliar wheat pathogens and (ii) the best possible start from day one. Moreover, this study fills the gap in the knowledge of the foliar pathogens of wheat present on early crop stages under natural conditions.

Supplementary Materials

The following supporting information can be downloaded at: https://www.mdpi.com/article/10.3390/agronomy12092000/s1, Figure S1: Descriptive plot of annual temperature change in the Larissa region. Figure S2: Descriptive plot of annual precipitation change in the Larissa region. Figure S3: Rainclouds for the Systiva® fungicide seed treatment. Figure S4: Images of NDVI and SAVI. Figure S5: Quality scores forward reads. Figure S6: Quality scores reverse reads. Figure S7: Distribution of sequence complexities, forward reads. Figure S8: Distribution of sequence complexities, reverse reads. Figure S9: Error rates. Figure S10: Sequence length distribution. Figure S11: Abundance per sample. Figure S12: Abundance per sample/division (Phylum). Figure S13: Abundance per sample/kingdom. Figure S14: Abundance per sample/family.

Author Contributions

Conceptualization, I.V.; investigation, plant pathology, and methodology; I.V.; UAV remote sensing data, C.C.; DNA methodology, P.M. and L.K.; writing—original draft preparation, I.V., P.M., and C.C.; writing—review and editing, C.K. and D.S. All authors have read and agreed to the published version of the manuscript.

Funding

This research was funded by BASF Hellas. Systivar® is a registered trade mark of BASF SE.

Data Availability Statement

Data are available upon request and will be made available on an open repository after the publication.

Acknowledgments

The authors would like to acknowledge the farmer Achileas Sourlas who offered his field for the tests.

Conflicts of Interest

The authors declare no conflict of interest.

References

  1. Curtis, B.C.; Rajaram, S.; Macpherson, H.G. Bread Wheat Improvement and Production. In FAO Plant Production and Protection Series; No. 30; FAO: Rome, Italy, 2002; Volume XI. [Google Scholar]
  2. Simón, M.R.; Börner, A.; Struik, P.C. Fungal wheat diseases: Etiology, breeding, and integrated management. Front. Plant Sci. 2021, 12, 671060. [Google Scholar] [CrossRef] [PubMed]
  3. Juroszek, P.; Racca, P.; Link, S.; Farhumand, J.; Kleinhenz, B. Overview on the review articles published during the past 30 years relating to the potential climate change effects on plant pathogens and crop disease risks. Plant Pathol. 2020, 69, 179–193. [Google Scholar] [CrossRef]
  4. Miedaner, T.; Juroszek, P. Climate change will influence disease resistance breeding in wheat in Northwestern Europe. Theor. Appl. Genet. 2021, 134, 1771–1785. [Google Scholar] [CrossRef] [PubMed]
  5. Steinberg, G. Cell biology of Zymoseptoria tritici: Pathogen cell organization and wheat infection. Fungal Genet. Biol. 2015, 79, 17–23. [Google Scholar] [CrossRef]
  6. Figueroa, M.; Hammond-Kosack, K.E.; Solomon, P.S. A review of wheat diseases—A field perspective. Mol. Plant Pathol. 2018, 19, 1523–1536. [Google Scholar] [CrossRef]
  7. Vagelas, I. Important Foliar Wheat Diseases and their Management: Field Studies in Greece. Mod. Concepts Dev. Agron. 2021, 8, 783–786. [Google Scholar] [CrossRef]
  8. Laribi, M.; Yahyaoui, A.H.; Abdedayem, W.; Kouki, H.; Sassi, K.; Ben M’Barek, S. Characterization of Mediterranean Durum Wheat for Resistance to Pyrenophora tritici-repentis. Genes 2022, 13, 336. [Google Scholar] [CrossRef]
  9. Zhang, W.; Pfender, W.F. Effect of residue management on wetness duration and ascocarp production by Pyrenophora tritici-repentis in wheat residue. Phytopathology 1992, 82, 1434–1439. [Google Scholar] [CrossRef]
  10. Adee, S.; Pfender, W.F.; Hartnett, D.C. Competition between Pyrenophora tritici-repentis and Septoria nodorum in the wheat leaf as measured with de Wit replacement series. Phytopathology 1990, 80, 1177–1182. [Google Scholar] [CrossRef]
  11. Stadlmeier, M.; Jørgensen, L.N.; Corsi, B.; Cockram, J.; Hartl, L.; Mohler, V. Genetic Dissection of Resistance to the Three Fungal Plant Pathogens Blumeria graminis, Zymoseptoria tritici, and Pyrenophora tritici-repentis Using a Multiparental Winter Wheat Population. G3 Genes Genomes Genet. 2019, 9, 1745–1757. [Google Scholar] [CrossRef] [Green Version]
  12. Abdullah, A.S.; Gibberd, M.R.; Hamblin, J. Co-infection of wheat by Pyrenophora tritici-repentis and Parastagonospora nodorum in the wheatbelt of Western Australia. Crop Pasture Sci. 2020, 71, 119–127. [Google Scholar] [CrossRef]
  13. Hjelkrem, A.G.R.; Ficke, A.; Abrahamsen, U.; Hofgaard, I.S.; Brodal, G. Prediction of leaf Bloch disease risk in Norwegian spring wheat based on weather factors and host phenology. Eur. J. Plant Pathol. 2021, 160, 199–213. [Google Scholar] [CrossRef]
  14. Andersson, B.; Djurle, A.; Ørum, J.E.; Jalli, M.; Ronis, A.; Ficke, A.; Jørgensen, L.N. Comparison of models for leaf blotch disease management in wheat based on historical yield and weather data in the Nordic-Baltic region. Agron. Sustain. Dev. 2022, 42, 42. [Google Scholar] [CrossRef]
  15. Shaw, M.W. Effects of temperature, leaf wetness and cultivar on the latent period of Mycosphaerella graminicola on winter wheat. Plant Pathol. 1990, 39, 255–268. [Google Scholar] [CrossRef]
  16. Wiik, L.; Ewaldz, T. Impact on temperature and precipitation on yield and plant diseases of winter wheat in southern Sweden 1993–2007. Crop. Prot. 2009, 28, 82–89. [Google Scholar] [CrossRef]
  17. Jalli, M.; Kaseva, J.; Andersson, B.; Ficke, A.; Jørgensen, L.N.; Ronis, A.; Kaukoranta, T.; Ørum, J.E.; Djurle, A. Yield increases due to fungicide control of leaf blotch diseases in wheat and barley as a basis for IPM decision-making in the Nordic-Baltic region. Eur. J. Plant Pathol. 2020, 158, 315–333. [Google Scholar] [CrossRef]
  18. Shaw, M.W.; Royle, D.J. Factors determining the severity of epidemics of Mycosphaerella graminicola (Septoria tritici) on winter wheat in the UK. Plant Pathol. 1993, 42, 882–899. [Google Scholar] [CrossRef]
  19. Suffert, F.; Sache, I.; Lannou, C. Early stages of septoria tritici blotch epidemics of winter wheat: Build-up, overseasoning, and release of primary inoculum. Plant Pathol. 2011, 60, 166–177. [Google Scholar] [CrossRef]
  20. Kumar, N.; Rana, M.; Kumar, B.; Chand, S.; Shiv, A.; Wani, S.H.; Kumar, S. Genomic Selection for Wheat Improvement. In Physiological, Molecular, and Genetic Perspectives of Wheat Improvement; Wani, S.H., Mohan, A., Singh, G.P., Eds.; Springer: Berlin/Heidelberg, Germany, 2021; ISBN 978-3-030-59577-7. [Google Scholar]
  21. Toropova, E.Y.; Kazakova, O.A.; Piskarev, V.V. Septoria blotch epidemic process on spring wheat varieties. Vavilov J. Genet. Breed. 2020, 24, 139. [Google Scholar] [CrossRef]
  22. Kerdraon, L.; Barret, M.; Laval, V.; Suffert, F. Differential dynamics of microbial community networks help identify microorganisms interacting with residue-borne pathogens: The case of Zymoseptoria tritici in wheat. Microbiome 2019, 7, 125. [Google Scholar] [CrossRef]
  23. Barroso-Bergadà, D.; Massot, M.; Vignolles, N.; Faivre d’Arcier, J.; Chancerel, E.; Guichoux, E.; Walker, A.; Vacher, C.; Bohan, D.A.; Laval, V.; et al. Metagenomic next-generation sequencing (mNGS) data reveals the phyllosphere microbiome of wheat plants infected by the fungal pathogen Zymoseptoria tritici. Phytobiomes J. 2022, 102, 290–297. [Google Scholar] [CrossRef]
  24. Liu, K.; Wen, Z.; Ma, Z.; Shao, W. Biological and molecular characterizations of fluxapyroxad-resistant isolates of Botrytis cinerea. Phytopathol. Res. 2022, 4, 2. [Google Scholar] [CrossRef]
  25. Lin, H.; Lin, F.; Yuan, J.; Cui, F.; Chen, J. Toxic effects and potential mechanisms of Fluxapyroxad to zebrafish (Danio rerio) embryos. Sci. Total Environ. 2021, 769, 144519. [Google Scholar] [CrossRef] [PubMed]
  26. EFSA (European Food Safety Authority). Conclusion on the peer review of the pesticide risk assessment of the active substance fluxapyroxad (BAS 700 F). EFSA J. 2012, 10, 2522. [Google Scholar] [CrossRef]
  27. Li, W.; Wu, Y.; Yuan, M.; Liu, X. Fluxapyroxad induces developmental delay in zebrafish (Danio rerio). Chemosphere 2020, 256, 127037. [Google Scholar] [CrossRef]
  28. Zadoks, J.C.; Chang, T.T.; Konzak, E.F. A decimal code for the growth stages of cereals. Weed Res. 1974, 14, 415–421. [Google Scholar] [CrossRef]
  29. James, W.E. An illustrated series of assessment keys for plant diseases, their preparation, and usage. Can. Plant Dis. Surv. 1971, 51, 39–65. [Google Scholar]
  30. Eyal, Z.; Scharen, A.L.; Prescott, J.M.; Ginkel, M.V. The Septoria Diseases of Wheat: Concepts and Methods of Disease Management; CIMMYT: Texcoco, Mexico, 1987; p. 52. Available online: http://hdl.handle.net/10883/1113 (accessed on 18 August 2022).
  31. Del Ponte, E.M.; Pethybridge, S.J.; Bock, C.H.; Michereff, S.J.; Machado, F.J.; Spolti, P. Standard Area Diagrams for Aiding Severity Estimation: Scientometrics, Pathosystems, and Methodological Trends in the Last 25 Years. Phytopathology 2017, 107, 1161–1174. [Google Scholar] [CrossRef]
  32. Rouse, J.W.; Haas, R.H.; Schell, J.A.; Deering, D.W. Monitoring Vegetation Systems in the Great Plains with ERTS (Earth Resources Technology Satellite). In Proceedings of the 3rd Earth Resources Technology Satellite Symposium, Greenbelt, MD, USA, 10–14 December 1973; Volume SP-351, pp. 309–317. [Google Scholar]
  33. Huete, A.R. A Soil Adjusted Vegetation Index (SAVI). Remote Sens. Environ. 1988, 25, 295–309. [Google Scholar] [CrossRef]
  34. Callahan, B.J.; McMurdie, P.J.; Rosen, M.J.; Han, A.W.; Johnson, A.J.; Holmes, S.P. DADA2: High resolution sample inference from Illumina amplicon data. Nat. Methods 2016, 13, 581–583. [Google Scholar] [CrossRef]
  35. Kozich, J.J.; Westcott, S.L.; Baxter, N.T.; Highlander, S.K.; Schloss, P.D. Development of a dual-index sequencing strategy and curation pipeline for analyzing amplicon sequence data on the MiSeq Illumina sequencing platform. Appl. Environ. Microbiol. 2013, 79, 5112–5120. [Google Scholar] [CrossRef] [PubMed] [Green Version]
  36. Afgan, E.; Baker, D.; Batut, B.; Beek, M.V.; Bouvier, D.; Čech, M.; Chilton, J.M.; Clements, D.; Coraor, N.; Grüning, B.A.; et al. The Galaxy platform for accessible, reproducible and collaborative biomedical analyses: 2018 update. Nucleic Acids Res. 2018, 46, W537–W544. [Google Scholar] [CrossRef] [PubMed]
  37. Wang, Q.; Garrity, G.M.; Tiedje, J.M.; Cole, J.R. Naive Bayesian Classifier for Rapid Assignment of rRNA Sequences into the New Bacterial Taxonomy. Appl. Environ. Microbiol. 2007, 73, 5261–5267. [Google Scholar] [CrossRef]
  38. Friesen, T.L.; Ali, S.; Stack, R.W.; Francl, L.J.; Rasmussen, J.B. Rapid and efficient production of the Pyrenophora tritici-repentis teleomorph. Can. J. Bot. 2003, 81, 890–895. [Google Scholar] [CrossRef]
  39. Gracia-Romero, A.; Kefauver, S.C.; Fernandez-Gallego, J.A.; Vergara-Díaz, O.; Nieto-Taladriz, M.T.; Araus, J.L. UAV and ground image-based phenotyping: A proof of concept with durum wheat. Remote Sens. 2019, 11, 1244. [Google Scholar] [CrossRef]
  40. Vagelas, I. Latest Application Technology in Wheat Crop Simulation and Disease Prediction Models. Mod. Concepts Dev. Agron. 2021, 7, 767–768. [Google Scholar] [CrossRef]
  41. Vagelas, I. A Simple Infection Model for Foliar Pathogens of Wheat. Nov. Res. Sci. 2021, 6, NRS.000635.2021. Available online: https://crimsonpublishers.com/nrs/pdf/NRS.000635.pdf (accessed on 18 August 2022).
  42. Vagelas, I. A Tool for Early Detection of Septoria Tritici Blotch of Wheat. Nov. Res. Sci. 2021, 7, NRS.000651.2021. Available online: https://crimsonpublishers.com/nrs/pdf/NRS.000651.pdf (accessed on 24 August 2022).
  43. Adolf, B.; Schofl, U.; Verreet, J.A. Effect of infection with Septoria tritici of different growth stages of wheat (GS25 to GS59) an dry matter production, nitrogen uptake and yield. Meded. Van De Fac. Landbouwwet. 1993, 58, 1167–1174. Available online: https://www.cabdirect.org/cabdirect/abstract/19942308230 (accessed on 18 August 2022).
  44. Fleitas, M.C.; Castro, A.C.; Simón, M.R. Quality and yield response to the control of Mycosphaerella graminicola in wheat as affected by nitrogen rate and cultivar bread-making characteristics. Crop Pasture Sci. 2017, 68, 317327. [Google Scholar] [CrossRef]
  45. Hunger, R.M.; Brown, D.A. Colony color, growth, sporulation, fungicide sensitivity, and pathogenicity of Pyrenophora tritici-repentis. Plant Disease 1987, 71, 907–910. [Google Scholar] [CrossRef]
  46. Cook, R.J.; Yarham, D.J. Occurrence of tan spot of wheat caused by Pyrenophora tritici-repentis on wheat in England and Wales in 1987. Plant Pathol. 1989, 38, 101–102. [Google Scholar] [CrossRef]
  47. Mehta, Y.R.; Mehta, Â.; Riede, C.R. Molecular and pathogenic variability of Pyrenophora tritici-repentis isolates causing tan spot of wheat in the state of Paraná, Brazil. Summa Phytopathol. 2004, 30, 436–444. [Google Scholar]
  48. Moreno, M.V.; Stenglein, S.A.; Balatti, P.A.; Perelló, A. Pathogenic and molecular variability among isolates of Pyrenophora tritici-repentis, causal agent of tan spot of wheat in Argentina. Eur. J. Plant Pathol. 2008, 122, 239–252. [Google Scholar] [CrossRef]
  49. Kader, K.A.; Hunger, R.M.; Payton, M.E. Pathogenic Fitness of Pyrenophora tritici-repentis Isolates Causing Tan Spot of Winter Wheat in Oklahoma. J. Plant Pathol. Microbiol. 2021, 12, 1–7. [Google Scholar] [CrossRef]
  50. Moreno, M.V.; Perelló, A.; Arya, A. Occurrence of Pyrenophora tritici-repentis causing tan spot in Argentina in Management of fungal plant pathogens. In CABI International; Arya, A., Perelló, A.E., Eds.; CABI Digital Library: Wallingford, UK, 2010; pp. 275–290. [Google Scholar] [CrossRef]
  51. McLean, M.; Hollaway, G. Spot Form of Net Blotch Yield Loss and Management in Barley Using Fungicides and Resistance in Victoria. GRDC Update. Available online: https://grdc.com.au/resources-and-publications/grdc-update-papers/tab-content/grdc-update-papers/2015/02/spot-form-of-net-blotch-yield-loss-and-management (accessed on 15 August 2022).
  52. Simpfendorfer, S.; Street, M. Evaluation of Fungicide Management Strategies to Control Spot Form of Net Blotch in Barley. GRDC Update. 2017. Available online: https://grdc.com.au/resources-and-publications/grdc-update-papers/tab-content/grdc-update-papers/2017/02/evaluation-of-fungicide-management-strategies-to-control-spot-form-of-net-blotch-in-barley (accessed on 15 August 2022).
  53. Berraies, S.; Ammar, K.; Gharbi, M.; Yahyaoui, A.H.; Rezgui, S. Quantitative inheritance of resistance to Septoria tritici blotch in durum wheat in Tunisia. Chilean J. Agric. Res. 2014, 74, 35–40. [Google Scholar] [CrossRef]
  54. Ouaja, M.; Aouini, L.; Bahri, B.A.; Ferjaoui, S.; Medini, M.; Marcel, T.C.; Hamza, S.M. Identification of valuable sources of resistance to Zymoseptoria tritici in the Tunisian durum wheat landraces. Eur. J. Plant Pathol. 2020, 156, 647–661. [Google Scholar] [CrossRef]
  55. Ferjaoui, S.; Aouini, L.; Slimane, R.B.; Ammar, K.; Dreisigacker, S.; Schouten, H.J.; Sapkota, S.; Bahri, B.A.; M’barek, S.B.; Visser, R.; et al. Deciphering resistance to Zymoseptoria tritici in the Tunisian durum wheat landrace accession ‘Agili39’. BMC Genom. 2022, 23, 1–20. [Google Scholar] [CrossRef]
  56. Sierotzki, H.; Scalliet, G. A review of current knowledge of resistance aspects for the next-generation succinate dehydrogenase inhibitor fungicides. Phytopathology 2013, 103, 880–887. [Google Scholar] [CrossRef]
  57. Harvey, I.C.; Craigie, R.; McCloy, B.L. The control of tan spot of wheat (caused by Pyrenophora tritici-repentis): A possible emerging disease in New Zealand. N. Z. Plant Prot. 2015, 68, 428–433. [Google Scholar] [CrossRef]
  58. Fleitas, M.C.; Schierenbeck, M.; Gerard, G.S.; Dietz, J.I.; Golik, S.I.; Simón, M.R. Breadmaking quality and yield response to the green leaf area duration caused by fluxapyroxad under three nitrogen rates in wheat affected with tan spot. Crop Prot. 2018, 106, 201–209. [Google Scholar] [CrossRef]
  59. Bearchell, S.J.; Fraaije, B.A.; Shaw, M.W.; Fitt, B.D.L. Wheat archive links long-term fungal pathogen population dynamics to air pollution. Proc. Natl. Acad. Sci. USA 2005, 102, 5438–5442. [Google Scholar] [CrossRef] [PubMed]
  60. Heick, T.M.; Justesen, A.F.; Jørgensen, L.N. Resistance of wheat pathogen Zymoseptoria tritici to DMI and QoI fungicides in the Nordic-Baltic region—A status. Eur. J. Plant Pathol. 2017, 149, 669–682. [Google Scholar] [CrossRef]
  61. Mäe, A.; Fillinger, S.; Sooväli, P.; Heick, T.M. Fungicide Sensitivity Shifting of Zymoseptoria tritici in the Finnish-Baltic Region and a Novel Insertion in the MFS1 Promoter. Front. Plant Sci. 2020, 11, 385. [Google Scholar] [CrossRef] [Green Version]
  62. Anastassiadou, M.; Bernasconi, G.; Brancato, A.; Carrasco Cabrera, L.; Greco, L.; Jarrah, S.; Kazocina, A.; Leuschner, R.G.; Magrans, J.O.; Miron, I.; et al. Review of the existing maximum residue levels for fluxapyroxad according to Article 12 of Regulation (EC) No 396/2005. EFSA J. 2020, 18, e06059. [Google Scholar] [CrossRef] [PubMed]
  63. EFSA (European Food Safety Authority). Reasoned opinion on the modification of the existing maximum residue levels for fluxapyroxad in grapes and potatoes. EFSA J. 2015, 13, 4223. [CrossRef]
  64. United Kingdom. Draft Assessment Report on the Active Substance Fluxapyroxad Prepared by the Rapporteur Member State UK in the Framework of Council Directive 91/414/EEC. 2011. Available online: http://www.efsa.europa.eu (accessed on 15 August 2022).
  65. Iqbal, M.A.; Fahim, M.A.; Zaman, Q.U.; Usam, M.; Sundus, H.; Rahman, A.U. Effect of various factors on wheat production. Sarhad J. Agric. 2014, 30, 135–143. [Google Scholar]
  66. Ihsan, M.Z.; El-Nakhlawy, F.S.; Ismail, S.M.; Fahad, S.; Daur, I. Wheat Phenological Development and Growth Studies As Affected by Drought and Late Season High Temperature Stress under Arid Environment. Front. Plant Sci. 2016, 7, 795. [Google Scholar] [CrossRef]
  67. Sanadya, A.; Kumar, M.; Nanda, H. Low productivity of wheat in Bastar region with special Enphasis on effect of temperature on phenology, growth and yield of wheat: A review. J. Pharmacogn. Phytochem. 2021, 10, 2558–2565. Available online: https://www.phytojournal.com/archives/2021/vol10issue1/PartAJ/10-1-159-152.pdf (accessed on 18 August 2022).
  68. Bouras, N.; Kim, Y.M.; Strelkov, S.E. Influence of water activity and temperature on growth and mycotoxin production by isolates of Pyrenophora tritici-repentis from wheat. Int. J. Food Microbiol. 2009, 131, 251–2555. [Google Scholar] [CrossRef]
  69. Menzies, J.; Gilbert, J. Diseases of wheat. In Diseases of Field Crops in Canada, 3rd ed.; Bailey, K.L., Gossen, B.D., Gugel, R.K., Morrall, R.A.A., Eds.; Canadian Phytopathological Society: Harrow, ON, Canada, 2003; pp. 94–128. [Google Scholar]
  70. Hosford, R.M.; Lárez, C.R.; Hammond, J.J. Interaction of wet period and temperature on Pyrenophora tritici-repentis infection and development in wheats of differing resistance. Phytopathology 1987, 77, 1021–1027. [Google Scholar] [CrossRef]
  71. Mróz, M.; Sobieraj, A. Comparison of several vegetation indices calculated on the basis of a seasonal SPOT XS time series, and their suitability for land cover and agricultural crop identification. Tech. Sci 2004, 7, 39–66. Available online: http://www.uwm.edu.pl/wnt/technicalsc/ts7_2004/4_7_2004.pdf (accessed on 18 August 2022).
Figure 1. Wheat field experimental design.
Agronomy 12 02000 g001
Figure 2. Standard area diagram for validation of the percentage of leaf area covered by Septoria Nodorum Blotch and Yellow Spot of wheat (source: https://www.agric.wa.gov.au/mycrop/monitoring-late-season-broad-acre-crops-leaf-and-stem-diseases assessed 18 November 2021).
Agronomy 12 02000 g002
Figure 3. RGB image at 31/3/22 (a), NDVI at the same date (b) and mask applied over the field to exclude severely damaged areas (c).
Agronomy 12 02000 g003
Figure 4. Temperatures anomalies for February 2016, April 2016, and April 2018 relative to 1980–2020 for the Larissa region. Data were obtained from the Meteoblue database (www.meteoblue.com/el/, assessed 13 June 2022).
Agronomy 12 02000 g004aAgronomy 12 02000 g004b
Figure 5. Descriptive plot. Mean disease score for periods (months) and years (white and black dots for year 2016 and 2018, respectively) with 95% confidence intervals.
Agronomy 12 02000 g005
Figure 6. Principal component analysis to determine the most significant parameters. (a) Path diagram (b); Scree plot.
Agronomy 12 02000 g006
Figure 7. Descriptive plot for Perithecia counts. Treatments were Repl.1, Repl.2, Repl.3, and Repl.4 and there were six samples per treatment. Counts are number of perithecia/cm of straw.
Agronomy 12 02000 g007
Figure 8. Raincloud plots for Pseudothecia/treatment and per sample.
Agronomy 12 02000 g008
Figure 9. Wheat straw with perithecia, black spots on straws’ surface (blue arrow), and leaf blotch symptoms—red arrows (a); Neck and setae projecting from Pyrenophora tritici-repentis pseudothecia (b).
Agronomy 12 02000 g009
Figure 10. Descriptive plot to determine Systiva® seed treatment fungicide effectivity for the control foliar wheat pathogens caused by the fungus Septoria spp. and P. tritici-repentis.
Agronomy 12 02000 g010
Figure 11. NDVI and SAVI statistics from the four Systiva® treatments.
Agronomy 12 02000 g011
Figure 12. Comparison of treatments S0 and S150 where wheat seeds were treated without or with Systiva®, respectively. The Y axis presents the fungal communities’ populations (fungal families) among the two treatments.
Agronomy 12 02000 g012
Figure 13. Wheat infection by leaf blotch diseases caused by P. tritici-repentis, P. nodorum, M. graminicola (teleomorph of S. tritici), and Z. tritici. Comparisons for treatments S0 and S150 (wheat seeds treated without or with Systiva®, respectively.
Agronomy 12 02000 g013
Table 1. Component loading for weather and disease score components.
RC1RC2RC3Uniqueness
Year0.913 0.146
Disease Score0.848 0.146
Temperature (mean) 0.841 0.291
Rain −0.759 0.434
Calendar DAY 0.9980.018
Table 2. Component characteristics for weather and disease score components.
Unrotated SolutionRotated Solution
Eigen-ValueProportion var.CumulativeSumSq. LoadingsProportion var.Cumulative
1.6270.3250.3251.5590.3120.312
1.3200.2640.5891.3640.2730.585
1.0170.2030.7931.0410.2080.793
Publisher’s Note: MDPI stays neutral with regard to jurisdictional claims in published maps and institutional affiliations.

