Article

Assessing the Impacts of Fertilization Regimes on Soil Aggregate Dynamics in Northeast China

1
Institute of Agricultural Resources and Regional Planning, Chinese Academy of Agricultural Sciences, Beijing 100081, China
2
College of Natural Resources and Environment, Northwest A and F University, Yangling 712100, China
3
Heihe Branch, Heilongjiang Academy of Agricultural Sciences, Heihe 164300, China
*
Authors to whom correspondence should be addressed.
Agronomy 2022, 12(9), 2101; https://doi.org/10.3390/agronomy12092101
Submission received: 18 July 2022 / Revised: 21 August 2022 / Accepted: 27 August 2022 / Published: 2 September 2022

Abstract

:
Determining the effects of fertilization regimes on soil aggregates, carbon (C) and nitrogen (N) distribution, and pH is essential for improving soil structure and soil organic carbon (SOC) accumulation to help in proper soil fertility management. Based on a 41-year field fertilization experiment conducted on dark brown soil in northeast China, we examined the soil aggregate size distribution and associated C, N, and pH to provide a scientific basis for elucidation of the mechanisms underlying the effects of fertilization treatments on soil structure and fertility. Six different fertilization treatments included no fertilizer (CK), low-dose chemical fertilizer (NP), moderate-dose chemical fertilizer (2NP), high-dose chemical fertilizer (4NP), normal-dose organic fertilizer (M), and normal-dose organic fertilizer plus moderate-dose chemical fertilizer (M+2NP). Our findings showed that compared to CK, M and M+2NP significantly increased the proportion of macroaggregates by 40% and 28%, respectively, whereas 4NP significantly decreased it by 19%. The mean weight diameter (MWD) and geometric mean diameter (GMD) under M and M+2NP were significantly higher than that under CK, at 12–21% and 24–36%, respectively. The fractal dimension (D) value of M+2NP was significantly lower than those of 2NP and 4NP by 4% and 5%, respectively. Soil pH under the M treatment was highest, followed by M+2NP. Soil pH under 2NP and 4NP more significantly decreased, by 0.1 and 0.2 units, than under M treatment. Soil pH values were correlated with the proportion of soil macroaggregates, MWD, and GWD, respectively (p < 0.05). Relative to CK, M and M+2NP increased the contents and stocks of SOC (by 40–49% and 89–93%, respectively) and total N (59–68% and 119–123%, respectively). Furthermore, the contents and stocks of aggregate-associated SOC and total N decreased following the order: NP > 2NP > 4NP. Overall, the long-term application of organic fertilization regimes (M and M+2NP) effectively improved soil aggregation as well as SOC accumulation and decreased soil acidification in dark brown soil in northeast China.

1. Introduction

Soil is the largest carbon pool in terrestrial ecosystems [1]. Soil organic carbon (SOC), as the main component of soil carbon pools, is crucial for the global carbon cycle. Generally, soil can be both a source and a sink of greenhouse gases [2]. Even small changes in SOC can have important impacts on regional carbon fluxes as well as climate change [3]. Soil aggregates are the basic structural units of soil. The distribution and stability of water-stable aggregates are key indicators for measuring soil physical properties and functions [4,5,6]. In recent years, the protection of SOC by soil aggregates has been generally recognized as one of the important mechanisms for SOC stabilization [7]. Soil aggregates can wrap SOC and protect SOC through spatial physical isolation. Soil aggregate-associated organic carbon (OC) was used as an important parameter for assessing soil carbon sequestration [3,8,9]. Therefore, the study of soil aggregate stability and the associated OC has important implications for the preservation of farmland ecosystems, food security, and climate change mitigation [10]. In addition, general soil properties such as soil texture, SOM content, pH, and microbial activity are significantly related to soil aggregate stability [11,12,13,14]. In particular, soil pH value was associated with soil cohesion and dispersion [15]. Soil pH has a crucial impact on the soil environment and crop growth and forms a vital part of soil quality. As one of the most critical commodity grain zones in China, the northeast plays an important part in the national food security system [16].
The black soil region in northeast China is considered to have some of the most fertile soils [17]. For many years, due to long-term high-intensity development and utilization, coupled with the influence of wind erosion and water erosion, the thickness and soil organic matter (SOM) of the black soil have decreased [17]. Soil acidification, desertification, and salinization have intensified, and soil erosion has been serious. According to the “Northeast Black Land White Paper (2020)”, in the past 60 years, the SOM of the soil plough layer has dropped by one-third, and some areas have dropped by 50%, which has seriously hindered the agricultural development and sustainability of the region. Furthermore, as a result of global climate change, soil carbon emissions and organic matter losses, and the decrease in soil fertility, will in turn affect food security [16]. Therefore, in order to maintain steady food production under global climate change, controlling soil degradation is crucial to the sustainability of agriculture in northeastern China. It is urgent to protect the black soil. In 2015, China proposed the goal of achieving zero increase in the use of chemical fertilizers, and studies related to this area have mostly focused on the effects of organic fertilizer substitution on yield [18]. Fertilization practices can have a profound impact on soil pH, aggregate composition, and C and N distribution in bulk soil and aggregates, while changes in soil aggregate structure can occur over a relatively long period. Therefore, there are significant practical implications in employing long-term field fertilization experiments to study the effects of different fertilization practices, especially chemical fertilizer reduction and organic fertilizer substitution, on soil quality.
Studies on C and N distribution in soil aggregates and their changes have always been the hotspot of soil science. Most studies have demonstrated that different long-term fertilization practices lead to changes in soil aggregates and SOC distribution [19,20,21,22]. Miao et al. [23], Zhang et al. [24], Liang et al. [25], and Shi et al. [26] have all shown that the long-term application of organic fertilizers in the black soils of northeast China increased the content of macroaggregates (>0.25 mm). Furthermore, Li et al. found that applying organic fertilizers in Lou soil after wheat cropping decreased the content of >1 mm water-stable aggregates but increased the content of 0.25–1 mm aggregates. In a 37-year long-term field experiment on black soil, Zhang et al. [19] showed that applying high-dose organic fertilizer or the combined application of organic and chemical fertilizers reduced the proportion of macroaggregates, which further decreased the stability of soil aggregates. In contrast, the long-term application of chemical fertilizers and normal-dose organic fertilizers did not alter the distribution of aggregates. The application of organic fertilizers has long been regarded as an effective means of improving soil C and N content [27,28]. Soil aggregates have different adsorption and protection effects on N, which will affect the storage and release of soil N to some extent [29]. Hence, various factors, such as different long-term fertilization practices, can affect the total nitrogen (TN) distribution in soil aggregates [30]. Geng et al. [21] showed that the long-term application of organic fertilizers increased the number of macroaggregates in fluvo-aquic soil. Applying chemical fertilizers increased the content of SOC in soil aggregates of all particle sizes. Su et al. [20] revealed that adding high-dose organic fertilizer on top of chemical fertilizer application can substantially increase the number, SOC, and C stock of macroaggregates in brown soil. It is evident from the results above that the effects of fertilization on aggregate composition and C and N distribution remain inconclusive. This may be attributed to differences in factors such as the experiment duration, soil texture, hydrothermal conditions, fertilizer type, and level of fertilization. The application of organic fertilizer can increase the pH of acidic soils, improve the growing environment of crops, and increase crop yields [18], while soil pH can also control soil aggregation and dispersion to some extent. In a study by Xu et al. [31], it was found that acid rain reduced the stability of red soil aggregates, while macroaggregates decreased with a decreasing pH and longer duration of acid rain. Hu et al. [32] showed that within a pH range of 3.0–6.0, changes in pH had little effect on aggregate stability. Thus, changes in soil aggregates caused by agricultural substances were independent of soil pH.
In summary, owing to the complexity of soil aggregates, there remains much debate over the research findings on the size distribution of soil aggregates in farmlands and the responses of SOC and TN to different fertilization practices. Additionally, studies on the factors influencing soil aggregate stability and the relationship between soil pH and soil structure are limited. Despite China’s introduction of the ‘reduced application and enhanced efficiency of chemical fertilizers and pesticides’, there is still a lack of studies on soil structure and nutrient content under the conditions of chemical fertilizer reduction and organic fertilizer substitution. Few of the previous studies have involved long-term, or even longer than 40 years, experiments. This study was based on the long-term fertilization experiment conducted at the Heihe Branch of the Heilongjiang Academy of Agricultural. We examined the responses of SOC, TN, and soil pH in water-stable aggregates of different size classes in dark brown soil to long-term fertilization practices to propose rational fertilization methods to guarantee soil quality and mitigate environmental risks.

2. Materials and Methods

2.1. Site Description

The long-term fertilization experiment on dark brown soil was conducted at the Academy of Agricultural Sciences in Heihe City (50°15’ N, 127°27’ E), Heilongjiang Province, China, and the experiment started in 1979. The study area belongs to the cold temperate continental monsoon climate. The mean annual temperature is −2–1 °C, and the frost-free period is 105–120 d. The temperature is relatively high during the growing season from May to September, and the day-night temperature difference is large. The total annual sunshine hours are 2562–2677 h, effective accumulated temperature is 1950–2300 °C, annual precipitation is 350–450 mm, and mean annual evaporation is 650 mm. This area is suited to the cultivation of soybean and wheat. The soil type of the study area is dark brown soil. Soil texture is clay loam. Dark brown soil is generally slightly acidic, with relatively high levels of SOM and TN and an abundance of available N, phosphorous (P), and potassium (K). The physical and chemical properties of the soil (0–10 cm) at the beginning of this long-term fertilization experiment were as follows: soil organic matter, 41.5 g kg−1; total nitrogen, 1.94 g kg−1; total phosphorus, 1.56 g kg−1; alkali hydrolyzable nitrogen, 51.4 mg kg−1; available phosphorus, 9.1 mg kg−1; available potassium, 56 mg kg−1; pH, 6.35 [33].

2.2. Study Design

The ‘Longmai 35’ spring wheat variety was tested in this study, which was sown in early April and harvested in mid-August. Crop varieties are changed every 10 years. The cropping system used was wheat–soybean rotation in each year, with both crops receiving the same amount of fertilizer, and field management was consistent with local practices. The experimental fertilizers applied were as follows: N fertilizer was urea (containing 46% N), and P fertilizer was diammonium phosphate (containing 18% N and 46% P2O5). Since the soil in the study area was K-rich, no K fertilizer was applied from the start of the experiment in 1979. The organic fertilizer applied was composted horse manure, which contained 175 g kg−1 of SOM, 5.8 g kg−1 of N, 3.0 g kg−1 of P, and 2.4 g kg−1 of K [33]. The pH of organic fertilizer (horse manure) is around 7.5–7.7. The amount of manure (wet weight) applied was 15,000 kg ha−1, and was applied once every 3 years. N and P chemical fertilizers were applied as a single basal application prior to the sowing of wheat and soybean.
Six different fertilization treatments were designed: (1) No fertilizer (CK); (2) application of low-dose chemical fertilizer (NP) alone; (3) application of moderate-dose chemical fertilizer (2NP) alone; (4) application of high-dose chemical fertilizer (4NP) alone; (5) application of organic fertilizer (M) alone; and (6) organic fertilizer + moderate-dose chemical fertilizer (M+2NP). See Table 1 for details on the fertilization amounts. The plot arrangement was randomized, and each plot covered an area of 212 m2 (20 m × 10.6 m). Each treatment was replicated 3 times. A 1 m-wide protection zone without fertilization was set around the perimeter of the experimental site, where crops were cultivated in the same manner as the experimental site. Rainfed agriculture was implemented in the drylands of the study area without irrigation.

2.2.1. Soil Sampling and Processing

Soil samples were collected during the wheat harvest period in August 2019. Undisturbed soil samples were collected from the 0–20 cm layer using the core-cutter method, with three sampling points for each treatment. After natural air-drying in a well-ventilated and shaded area, the soil blocks were gently separated along their natural fracture planes to remove large plant residues, stones, and gravel. The undisturbed soil samples were then passed through a 6 mm sieve to measure water-stable aggregates. A small amount of soil sample was removed before gradation to measure bulk soil SOC and TN.

2.2.2. Soil Analyses

Soil water-stable aggregates were measured by wet sieving. Aggregate gradation was performed according to the wet sieving method described by Cambardella et al. [34]. For the water-stable aggregates, 50.00 g of air-dried soil was weighed out and spread evenly on a 2 mm sieve and soaked in ultrapure water for 5 min. The sieve was agitated 50 times by hand in the vertical direction at a magnitude of 3 cm for 2 min, for a total of 50 times. The soil sample remaining on the sieve was rinsed with ultrapure water into a beaker. This method was repeated to sieve 0.25 mm and 0.053 mm aggregates, which gave the following four aggregate classes: >2 mm, 2–0.25 mm, 0.25–0.053 mm, and <0.053 mm. Beakers containing the sieved agglomerates were left to settle for 24 h. Then, the supernatant was discarded, the residue was dried completely in the oven at 40 °C, and the soil mass for each particle size was weighed to obtain the soil aggregate mass of different size classes.
Soil pH was measured by a soil pH meter (water-soil ratio was 2.5:1). The bulk soil and aggregate air-dried soil samples were then ground and passed through a 0.15 mm sieve, followed by the measurement of SOC and TN using an elemental analyzer (Vario Macro C/N/H, Berlin, Germany).
We used a ring knife method to measure soil bulk density. Specifically, a soil core was extracted using a ring knife, then sealed in a sterile plastic bag to preserve and kept dry in the lab. Soil bulk density is the weight of dried soil [35].

2.2.3. Calculation

The calculation method of the results of this study is as follows:
Mass   percentage   of   aggregates   in   each   class   ( % ) = Mass   of   aggregates   in   each   class   ( g ) Total   mass   of   soil   sample   ( g ) × 100
MWD = i = 1 n ( X i × W i )
GMD = exp [ i = 1 n ( W i × In X i ) ]
D = 3 lg lg ( W i / W o ) lg ( d i / d max )
In Equations (2) and (3), Xi is the mean diameter of agglomerates on the ith sieve, and Wi is the percentage by weight of aggregates on the ith sieve. In Equation (4), Wi is the cumulative weight of particles with a diameter smaller than di; Wo is the total weight; di is the mean particle diameter between two adjacent size classes di and di+1; and dmax is the mean particle diameter of the maximum size class.
M soil = SOC × BD × H × 10 1
M i = C i × SOC i × BD × H × 10 1
In Equations (5) and (6), Msoil [36] is the SOC stock in the 0–20 cm layer (t C ha−1); SOC is the content of soil organic carbon (g kg−1); BD is the bulk density of the 0–20 cm layer (g cm−3); H is the thickness of the soil layer, which was 20 cm; M’ i is the SOC stock of aggregates in the ith class (t C ha−1); Ci is the relative mass fraction of aggregates in the ith class; SOCi is the SOC of aggregates in the ith class (g kg−1).
C   contribution   of   a   given   aggregate   size   class   to   total   soil   C ( % ) = C   content   of   the   given   aggregate   size   class × Content   of   the   given   aggregate   size   class ( % )   Total   soil   C   content
Note: The same equations were used to calculate TN and SOC.
Data processing and graph plotting were performed using Excel 2010. Analysis of variance (ANOVA) was performed using SPSS 21. Testing of significant differences was performed using Duncan’s test, and the statistical significance level was set at p < 0.05.

3. Results and Analysis

3.1. Effects of Long-Term Fertilization Treatments on the Size Distribution and Stability of Soil Aggregates

3.1.1. Aggregate-Size Distribution

The contents of aggregates with different particle sizes varied due to different fertilization treatments (Figure 1). In general, aggregates >0.25 mm are known as macroaggregates, and those <0.25 mm are known as microaggregates. When the three treatments with chemical fertilizers alone (NP, 2NP, and 4NP) were compared with the CK treatment, 4NP showed the most significant changes in the number of aggregates, with macroaggregate content decreasing significantly by 18.8% and microaggregate content increasing significantly by 7%. Compared to CK treatment, the M and M+2NP treatments led to significant increases in macroaggregate content (by 39.7% and 27.6%, respectively) and significant decreases in microaggregate content (by 14.9% and 10.3%, respectively). Compared to that of 2NP and 4NP, the macroaggregate content of M+2NP had increased significantly by 41.5% and 56.8%, respectively, while its microaggregate content had decreased significantly by 13.5% and 16.2%, respectively.

3.1.2. Aggregate Stability

Soil aggregate mean weight diameter (MWD), geometric mean diameter (GMD), fractal dimension (D), and percentage of aggregates >0.25 mm (R > 0.25 mm) are all key indicators for characterizing soil aggregate stability (Table 2). The MWD and GMD measured under wet sieving reflect the quality of the soil structure. In general, higher values indicate better soil structure. MWD and GMD exhibited consistent variation trends. Compared to CK, M and M+2NP led to significant increases in MWD (21.2% and 12.2%, respectively) and GMD (36% and 23.9%, respectively). However, 2NP and 4NP led to significant decreases in MWD (by 10.8% and 16.2%, respectively) and GMD (by 14.3% and 19.5%, respectively). Compared to 2NP and 4NP, M+2NP showed significant increases in MWD (25.7% and 33.9%, respectively) and GMD (44.5% and 53.8%, respectively). Compared to CK, the D value of NP showed no significant difference; that of 2NP and 4NP had increased significantly by 1.9% and 2.3%, respectively, and that of M and M+2NP had decreased significantly by 3.5% and 2.5%, respectively. The D value of M+2NP was significantly lower than those of 2NP and 4NP by 4.3% and 4.7%, respectively. The R > 0.25 mm of the M treatment was higher than other treatments; compared to 2NP and 4NP, the R > 0.25 mm of M+2NP had increased significantly by 41.5% and 56.8%, respectively.

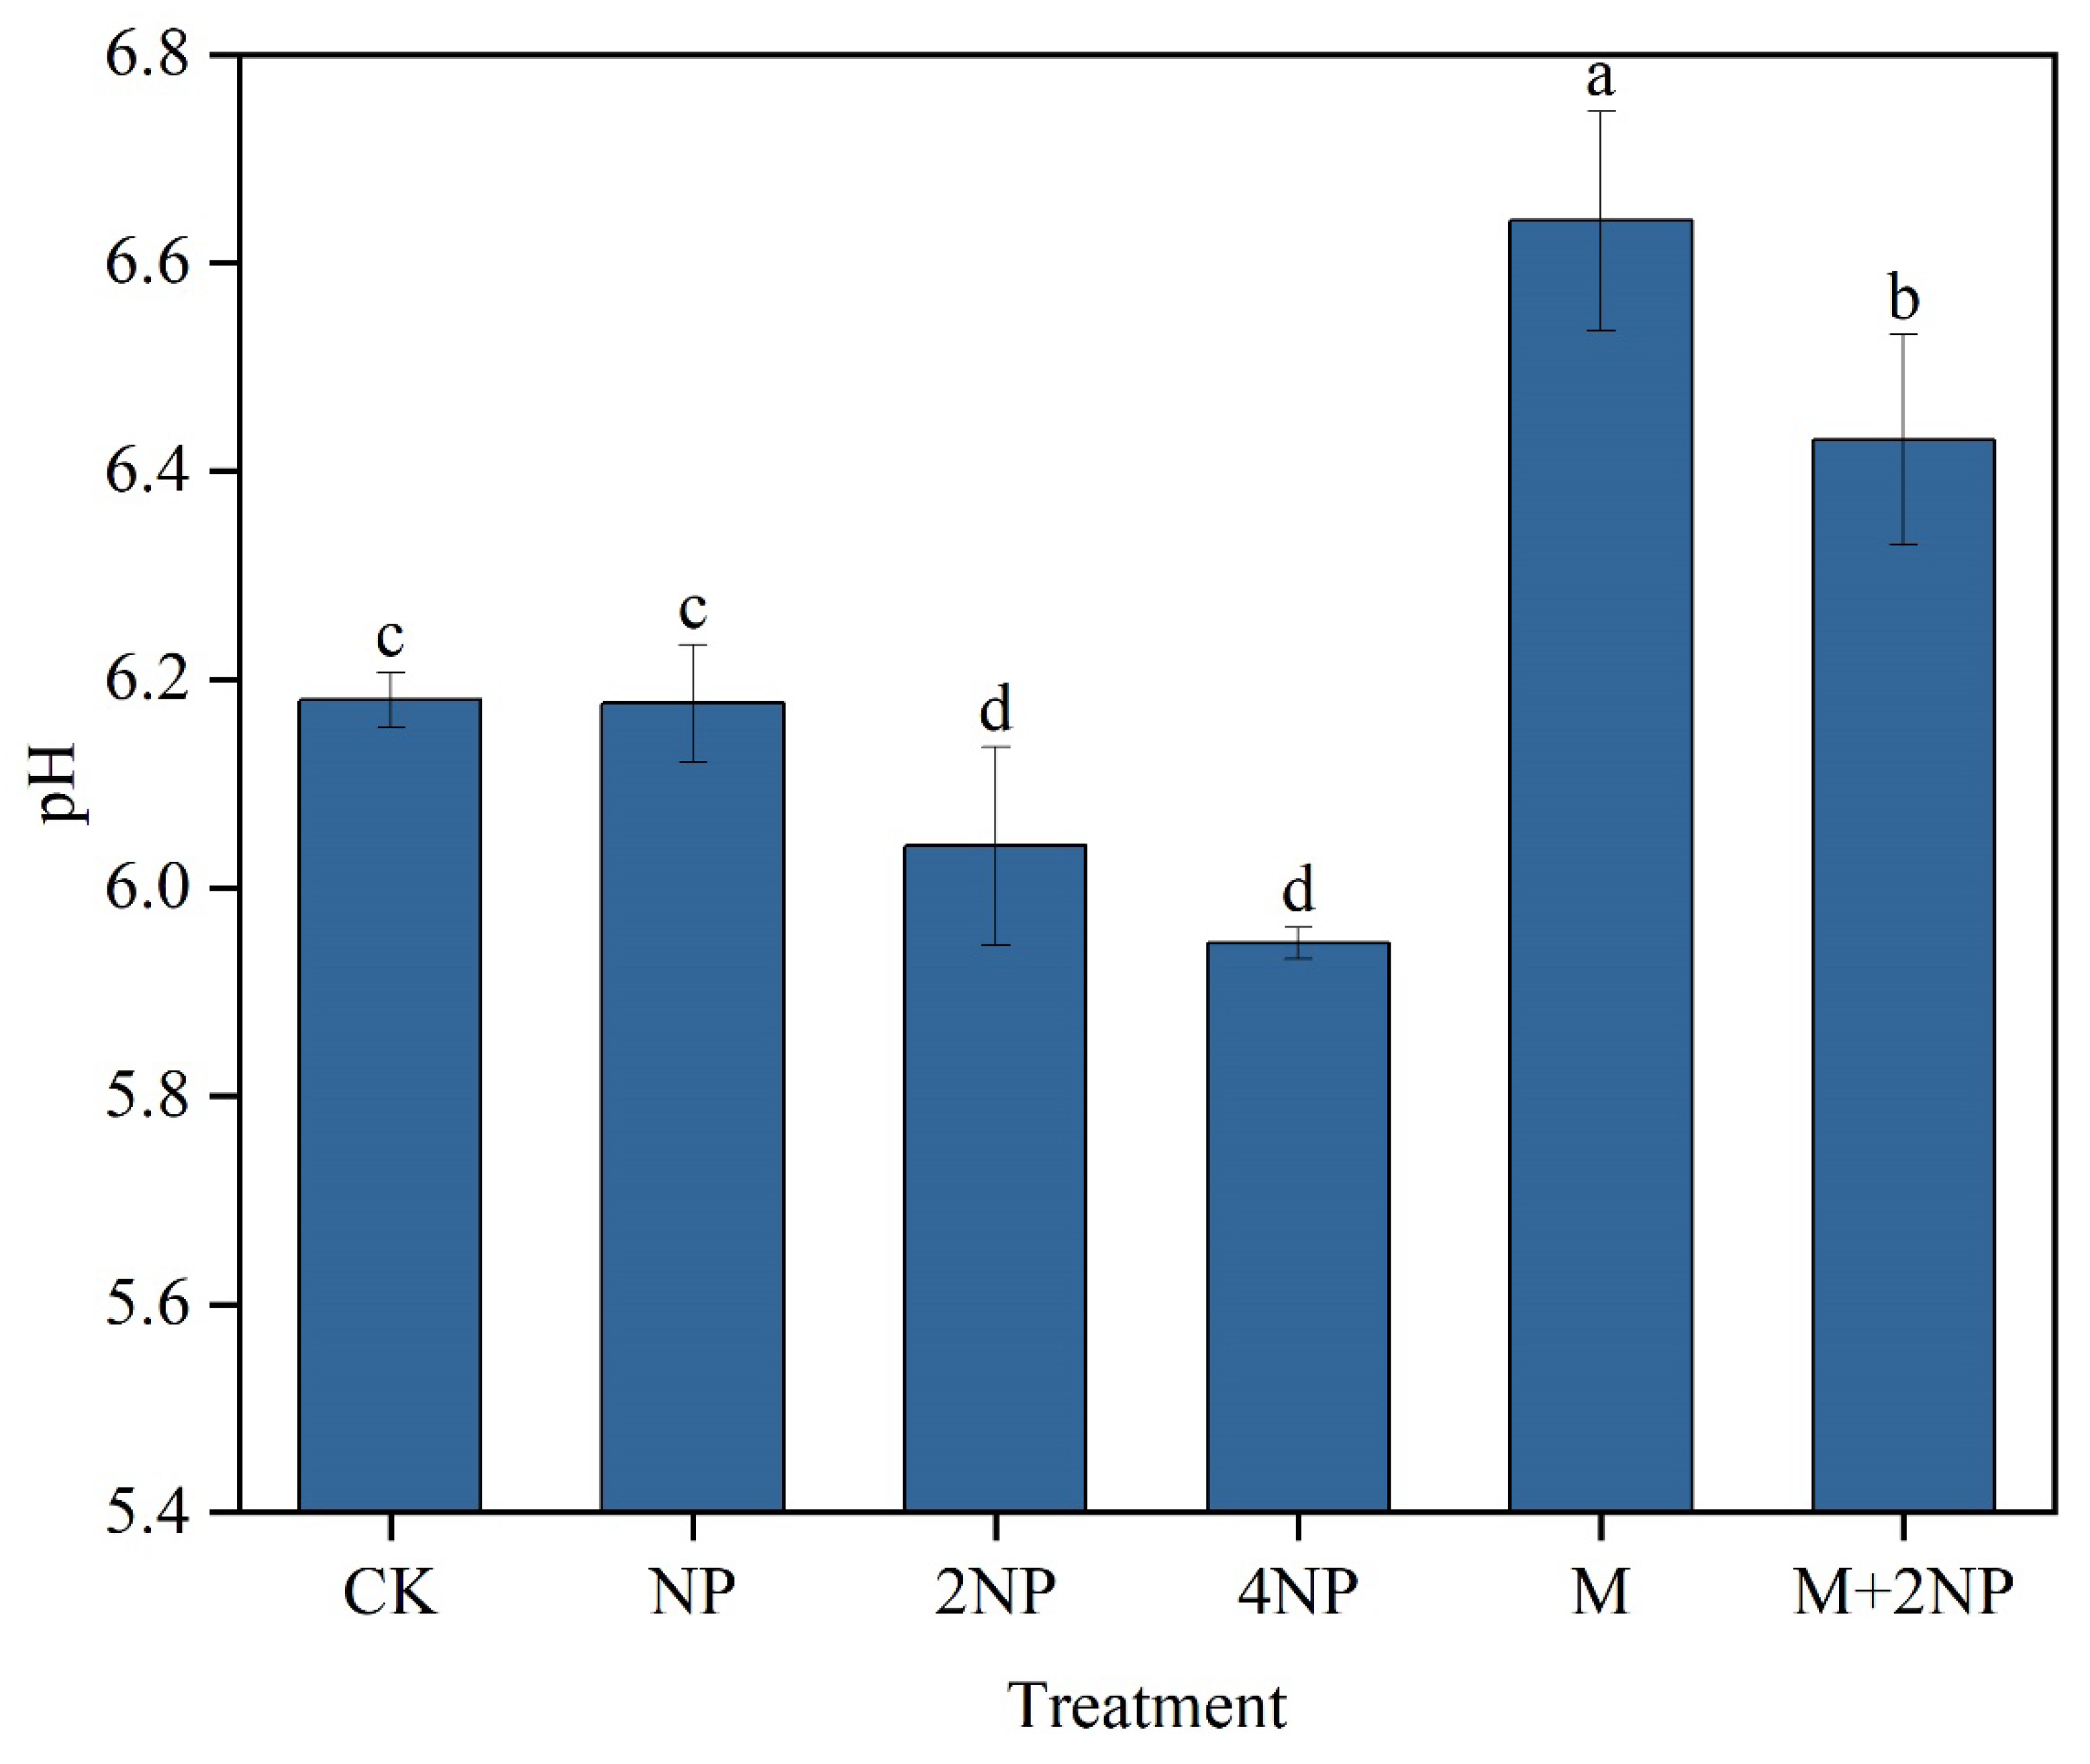
3.2. Effects of Long-Term Fertilization Treatments on Soil pH

Significant differences were observed in soil pH changes (Figure 2). Compared to CK, NP showed no significant difference in soil pH; that of 2NP and 4NP had decreased significantly by 0.1 and 0.2 units, respectively; that of M and M+2NP had increased significantly by 0.5 and 0.3 units, respectively. The soil pH of the M treatment was significantly higher than that of the other treatments, followed by M+2NP. Compared to 2NP and 4NP, the soil pH of M+2NP had increased significantly by 0.4 and 0.5 units.

3.3. Relationships between Soil pH and the Proportion of Soil MacroAggregates and Aggregate Stability

The correlation analysis of MWD, GMD, D, R > 0.25 mm, and soil pH (Table 3) revealed that there were significant positive correlations among MWD, GMD, and R > 0.25 mm, and that D was significantly negatively correlated with MWD, GMD, and R > 0.25 mm. Therefore, MWD, GMD, D, and R > 0.25 mm were all able to characterize the stability of soil aggregates. Soil pH was significantly correlated with MWD, GMD, D, and R > 0.25 mm, which suggests that higher soil pH contributed to the increase in soil macroaggregate content and accelerated the formation of soil aggregates, thereby further improving aggregate stability.

3.4. Effects of Long-Term Fertilization Treatments on SOC Content and Stock in Bulk Soil and Water-Stable Aggregates

3.4.1. SOC Content and Stock in Bulk Soil

After more than 40 years of different fertilization treatments, significant changes had occurred in SOC content (Table 4). Compared to CK, the three treatments with chemical fertilizers alone decreased SOC content to varying degrees, with that of NP, 2NP, and 4NP decreasing by 4.5%, 16.8%, and 5.4%, respectively, with 2NP reaching statistical significance. Compared to CK, the SOC content of M and M+2NP had increased significantly by 18.9% and 24.4%, respectively. Compared to 2NP and 4NP, the SOC content of M+2NP had increased significantly by 49.5% and 31.5%, respectively.
SOC stock exhibited changes similar to the trends of SOC content (Table 4). Compared to CK, the SOC stock of NP, 2NP, and 4NP had decreased by 4.1%, 15.4%, and 4.9%, respectively, with 2NP reaching statistical significance. Compared to CK, the SOC stock of M and M+2NP had increased significantly by 16.7% and 21.4%, respectively. Compared to 2NP and 4NP, the SOC stock of M+2NP had increased significantly by 43.6% and 27.7%, respectively.

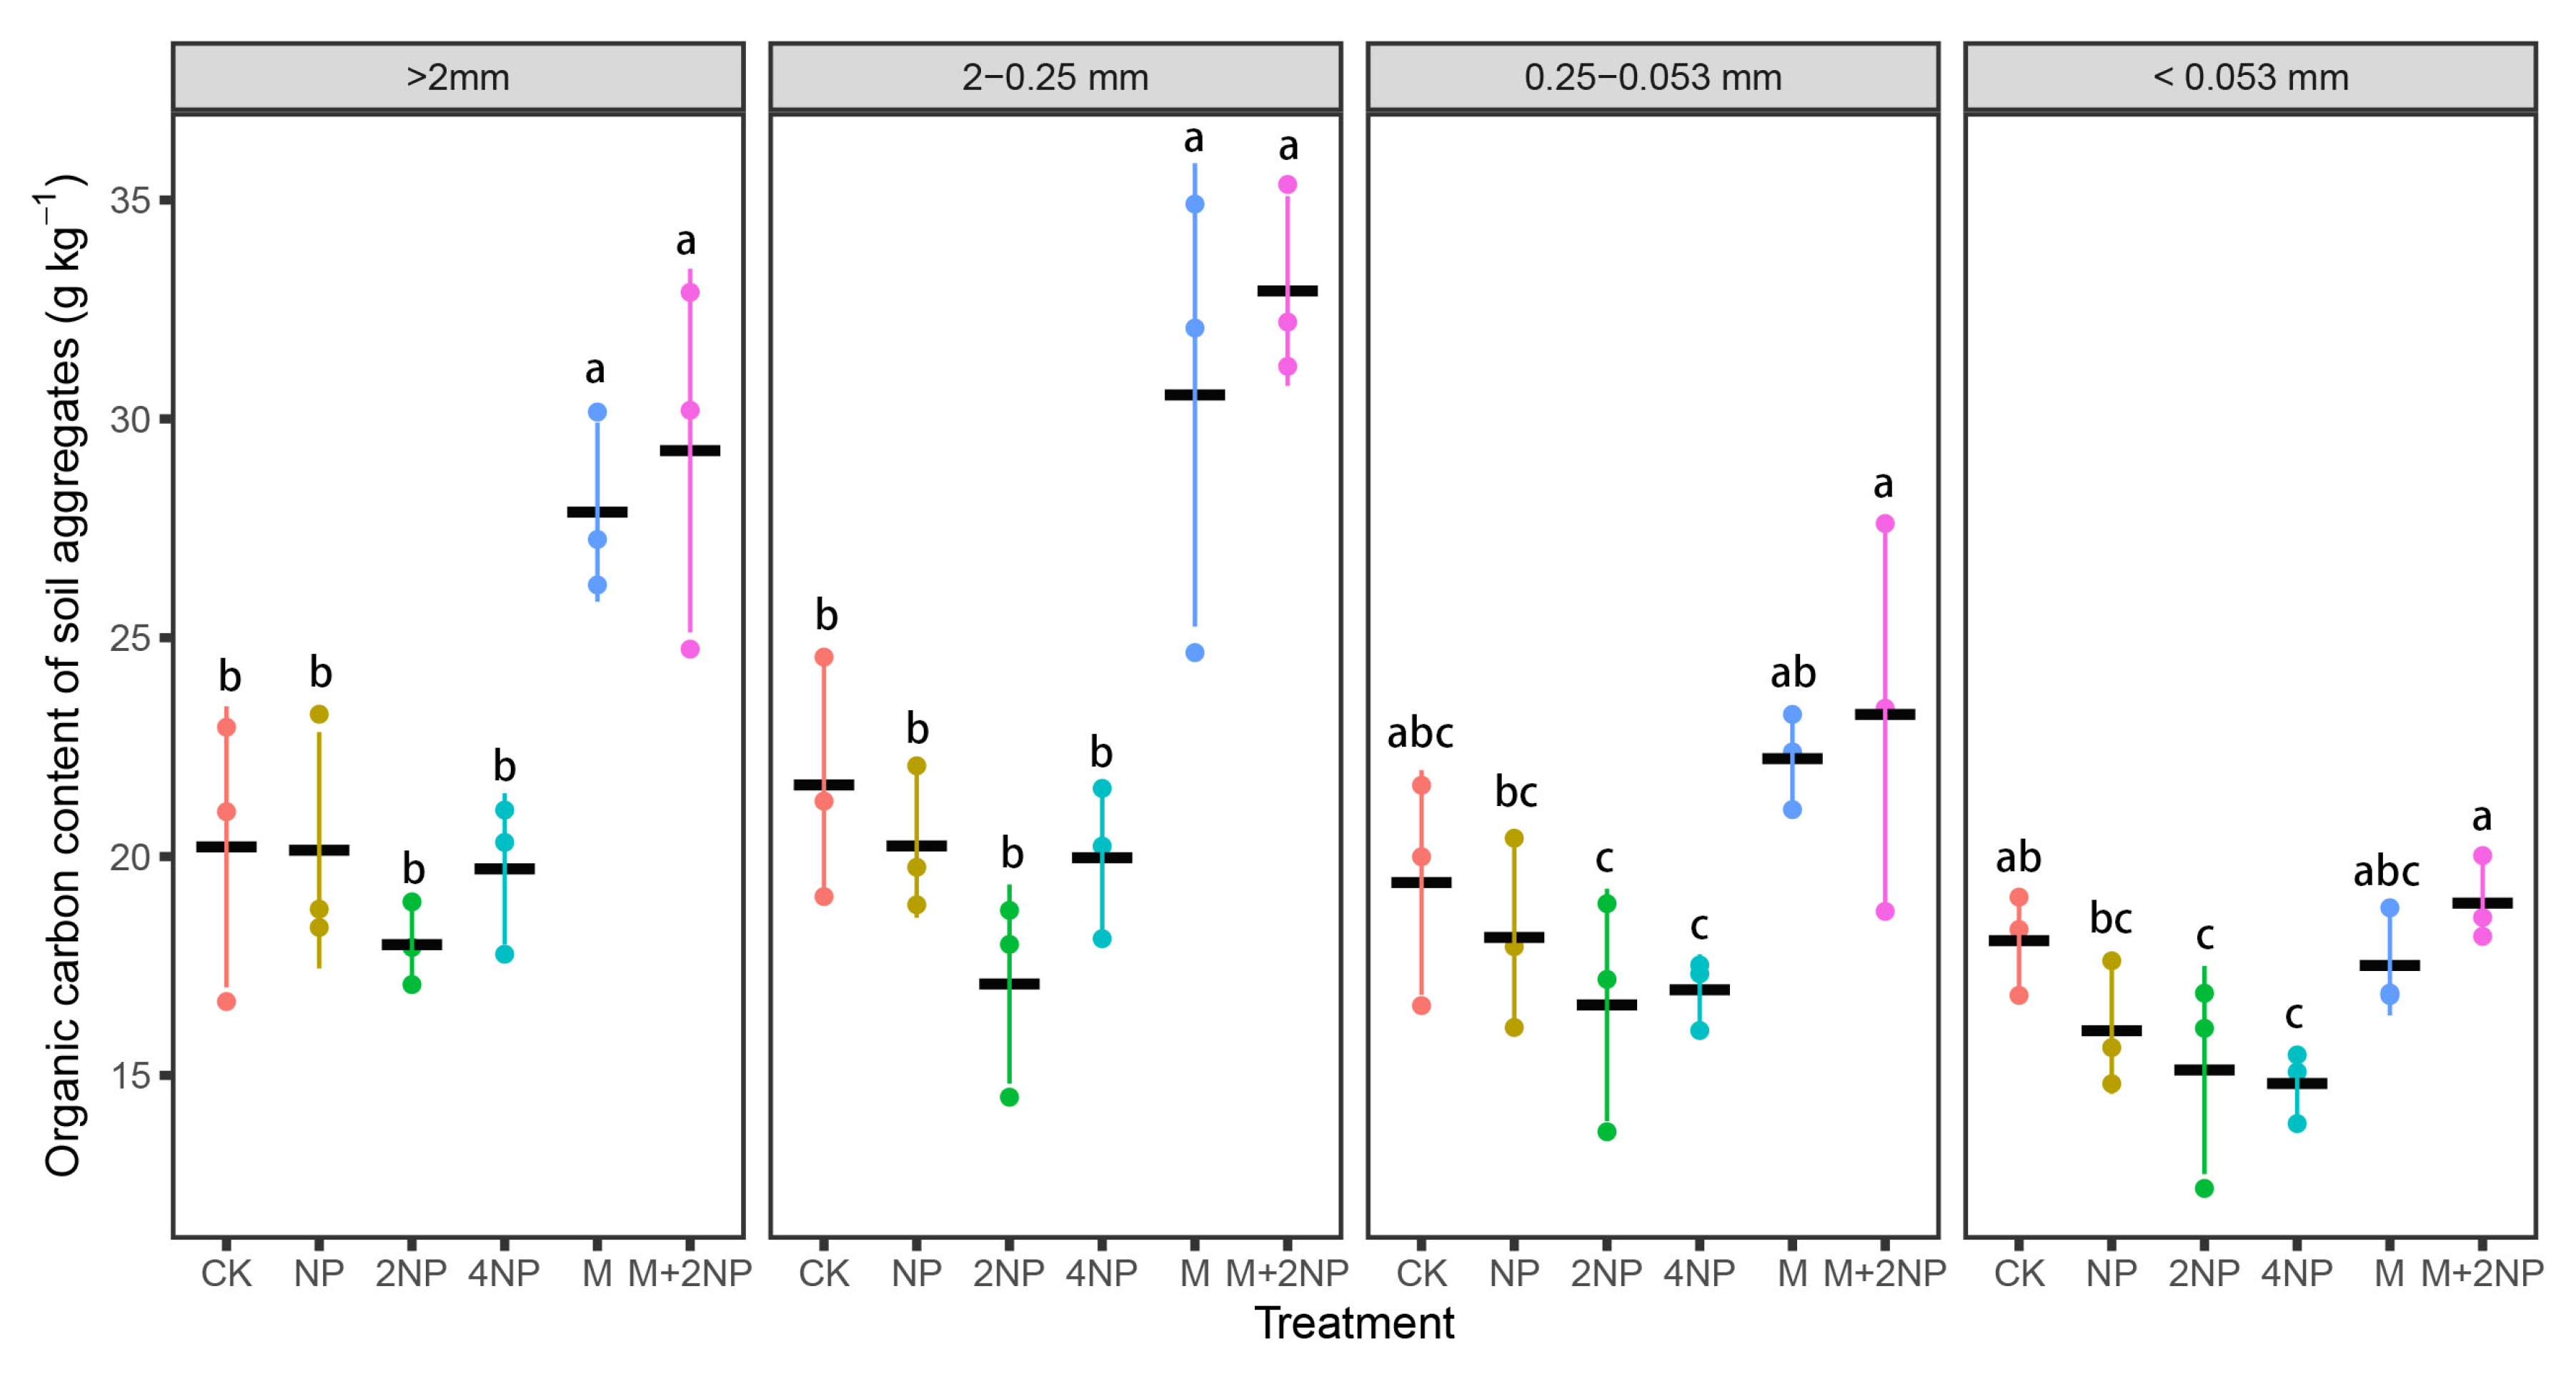
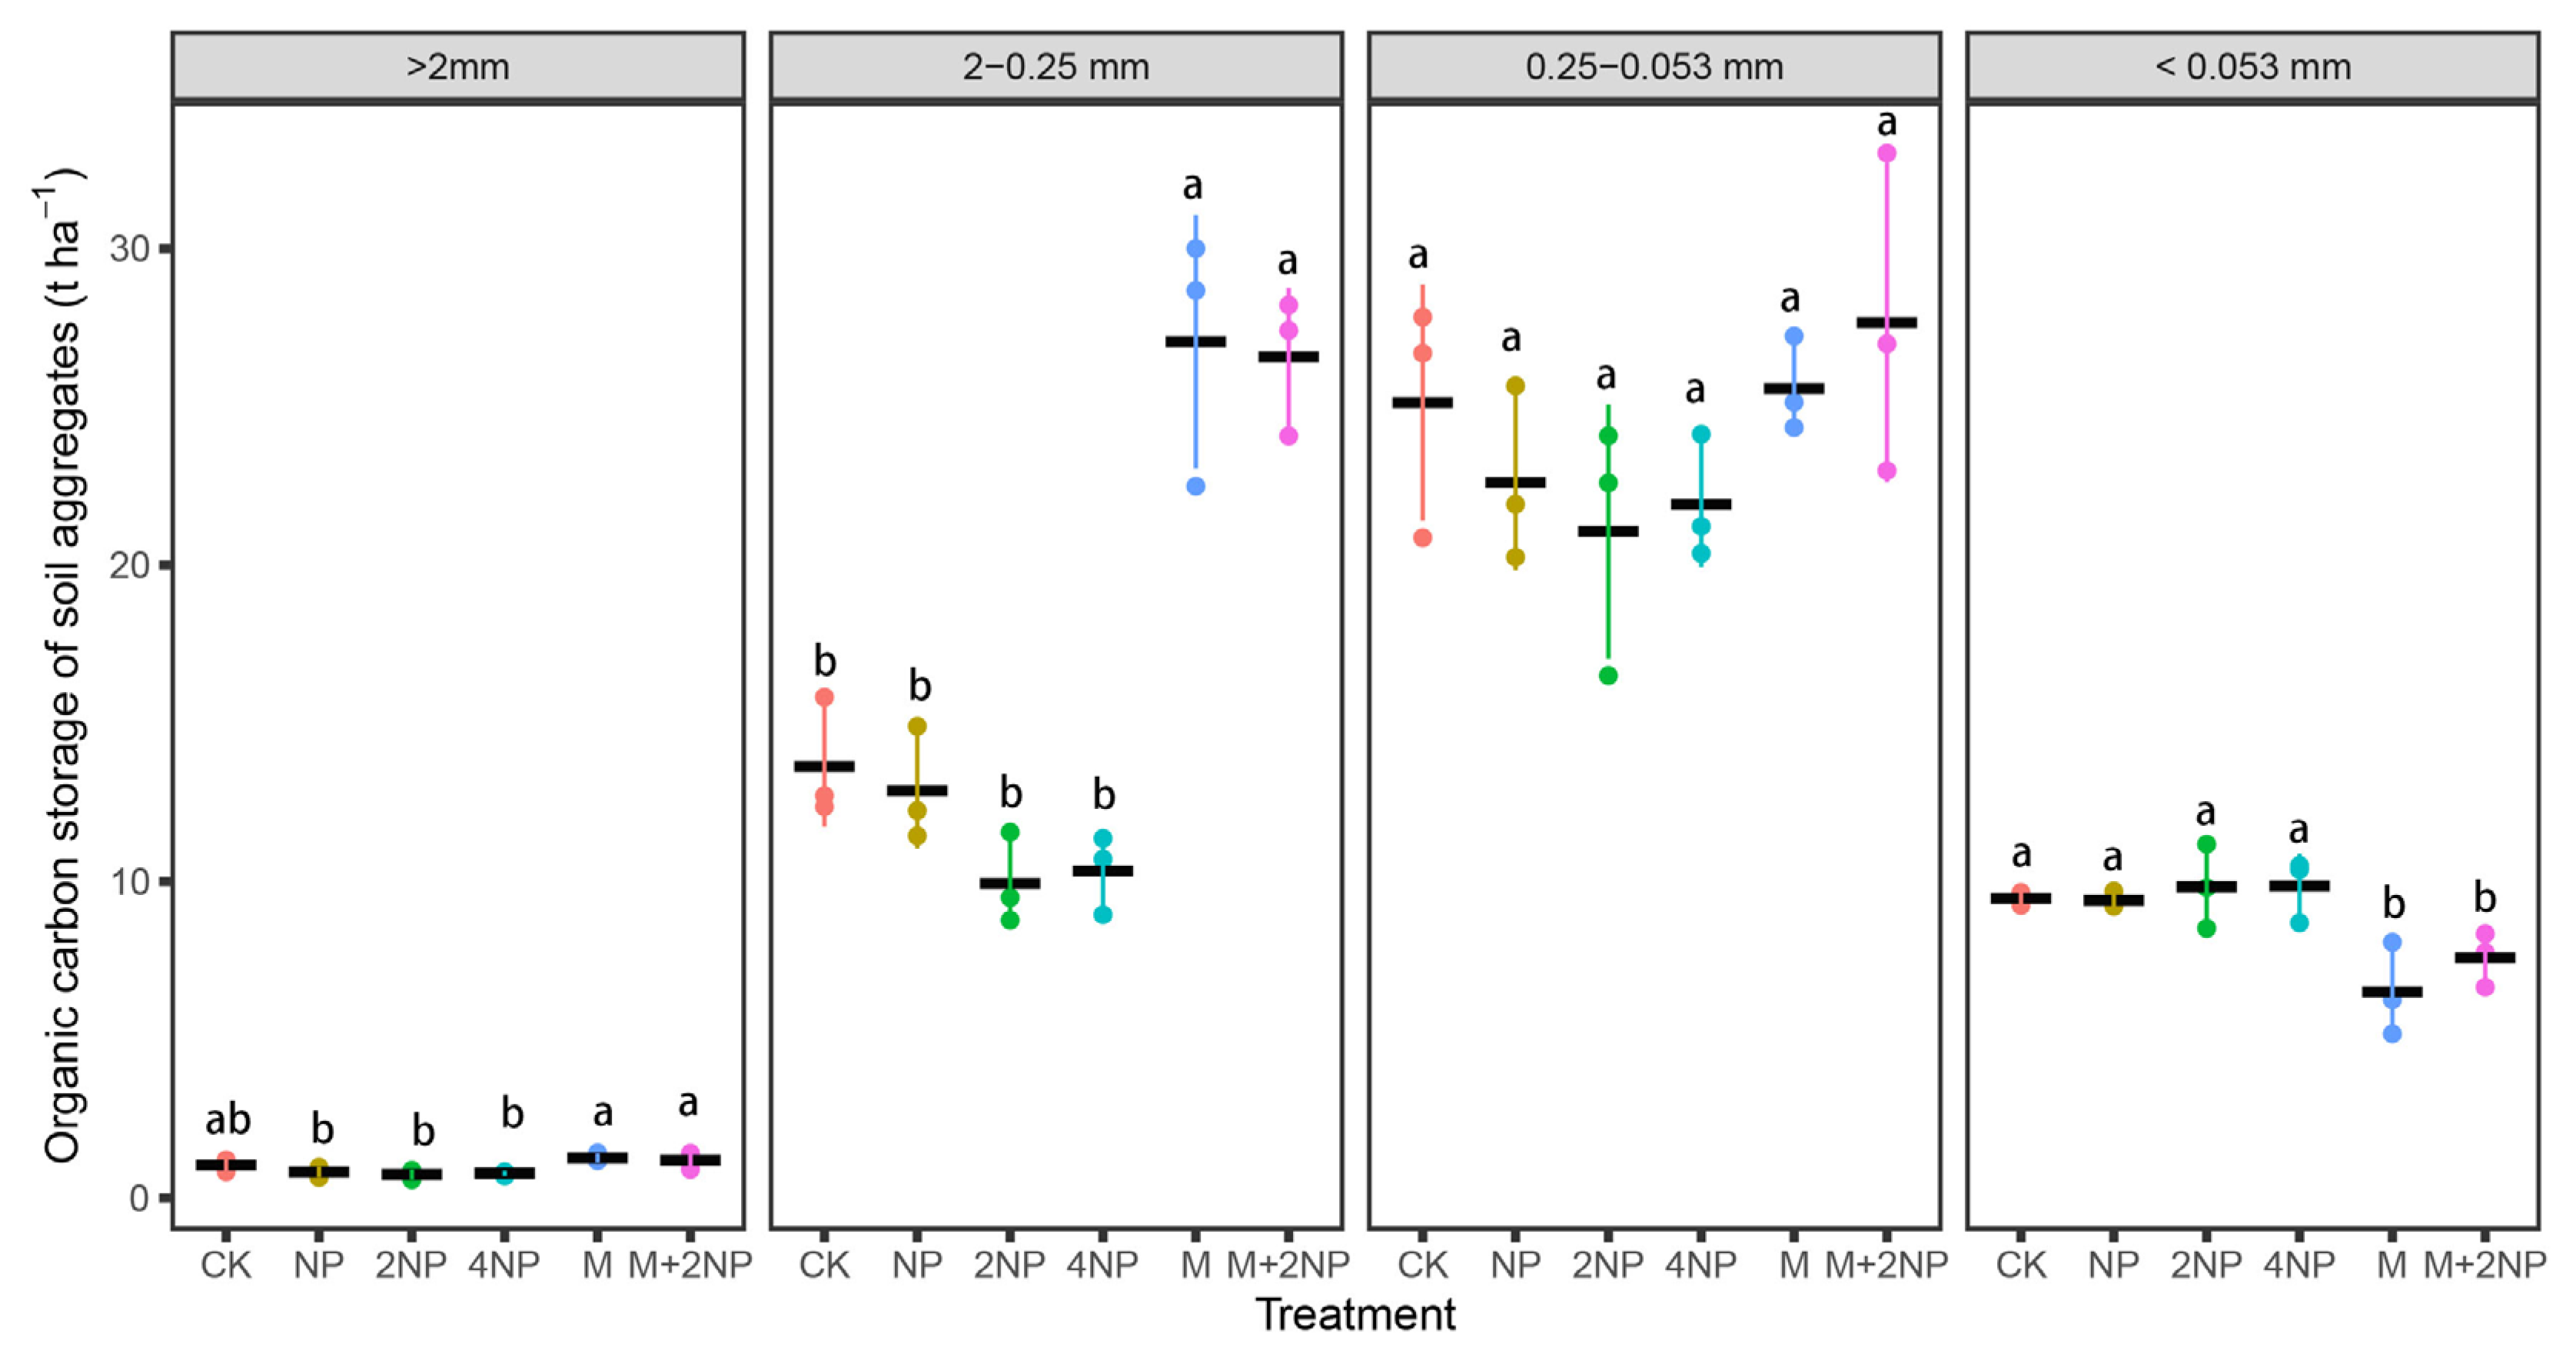
3.4.2. SOC Content and Stock in Water-Stable Soil Aggregates

The distribution of SOC content in soil aggregates across different fertilization treatments is shown in Figure 3. Compared to the macroaggregate SOC content in CK, that of M and M+2NP had increased significantly by 39.6% and 48.6%, whereas that of the three chemical fertilizer treatments did not differ significantly from CK. Compared to 2NP and 4NP, the macroaggregate SOC content of M+2NP had increased significantly by 77.3% and 56.7%, respectively, while its microaggregate SOC content had increased significantly by 32.9% and 32.8%, respectively. The microaggregate SOC content of all fertilization treatments did not differ significantly from that of CK, whereas that of M and M+2NP was significantly higher than that of 2NP and 4NP. As a whole, macroaggregates had higher SOC content than microaggregates across all treatments. Aggregates with smaller particle sizes exhibited smaller differences in aggregate SOC content among different treatments, indicating that the application of organic fertilizers mainly increased the SOC content of macroaggregates.
There were significant differences in aggregate SOC stock under different fertilization treatments across different size classes (Figure 4). Compared to the macroaggregate SOC stock in CK, the three treatments with chemical fertilizers alone showed downward trends in SOC stock but did not reach statistical significance, whereas M and M+2NP had increased significantly by 93.2% and 89.3%, respectively. Compared to 2NP and 4NP, the macroaggregate SOC stock of M+2NP had increased significantly by 159.9% and 149.8%, respectively. There were no significant differences in the microaggregate SOC stock across different treatments.

3.5. Effects of Long-Term Fertilization Treatments on TN Content and Stock in Bulk Soil and Water-Stable Aggregates

3.5.1. Soil TN Content and Stock in Bulk Soil

The trends of change in soil TN content under different fertilization treatments were similar to those of SOC content (Table 4). Compared to CK, the TN content of NP, 2NP, and 4NP had decreased by 6.5%, 21.3%, and 15.3%, respectively, with 2NP and 4NP reaching statistical significance. Compared to CK, the TN content of M and M+2NP had increased significantly by 53.6% and 60.1%, respectively. Compared to 2NP and 4NP, the TN content of M+2NP had increased significantly by 103.5% and 89.1%, respectively.
The changes in soil TN stock across different fertilization treatments are shown in Table 4. Compared to CK, the TN stock of NP, 2NP, and 4NP had decreased by 6.1%, 20%, and 14.9%, respectively, with 2NP and 4NP reaching statistical significance. Compared to CK, the TN stock of M and M+2NP had increased significantly by 50.7% and 56.3%, respectively. Compared to 2NP and 4NP, the TN stock of M+2NP had increased significantly by 95.4% and 83.6%, respectively.

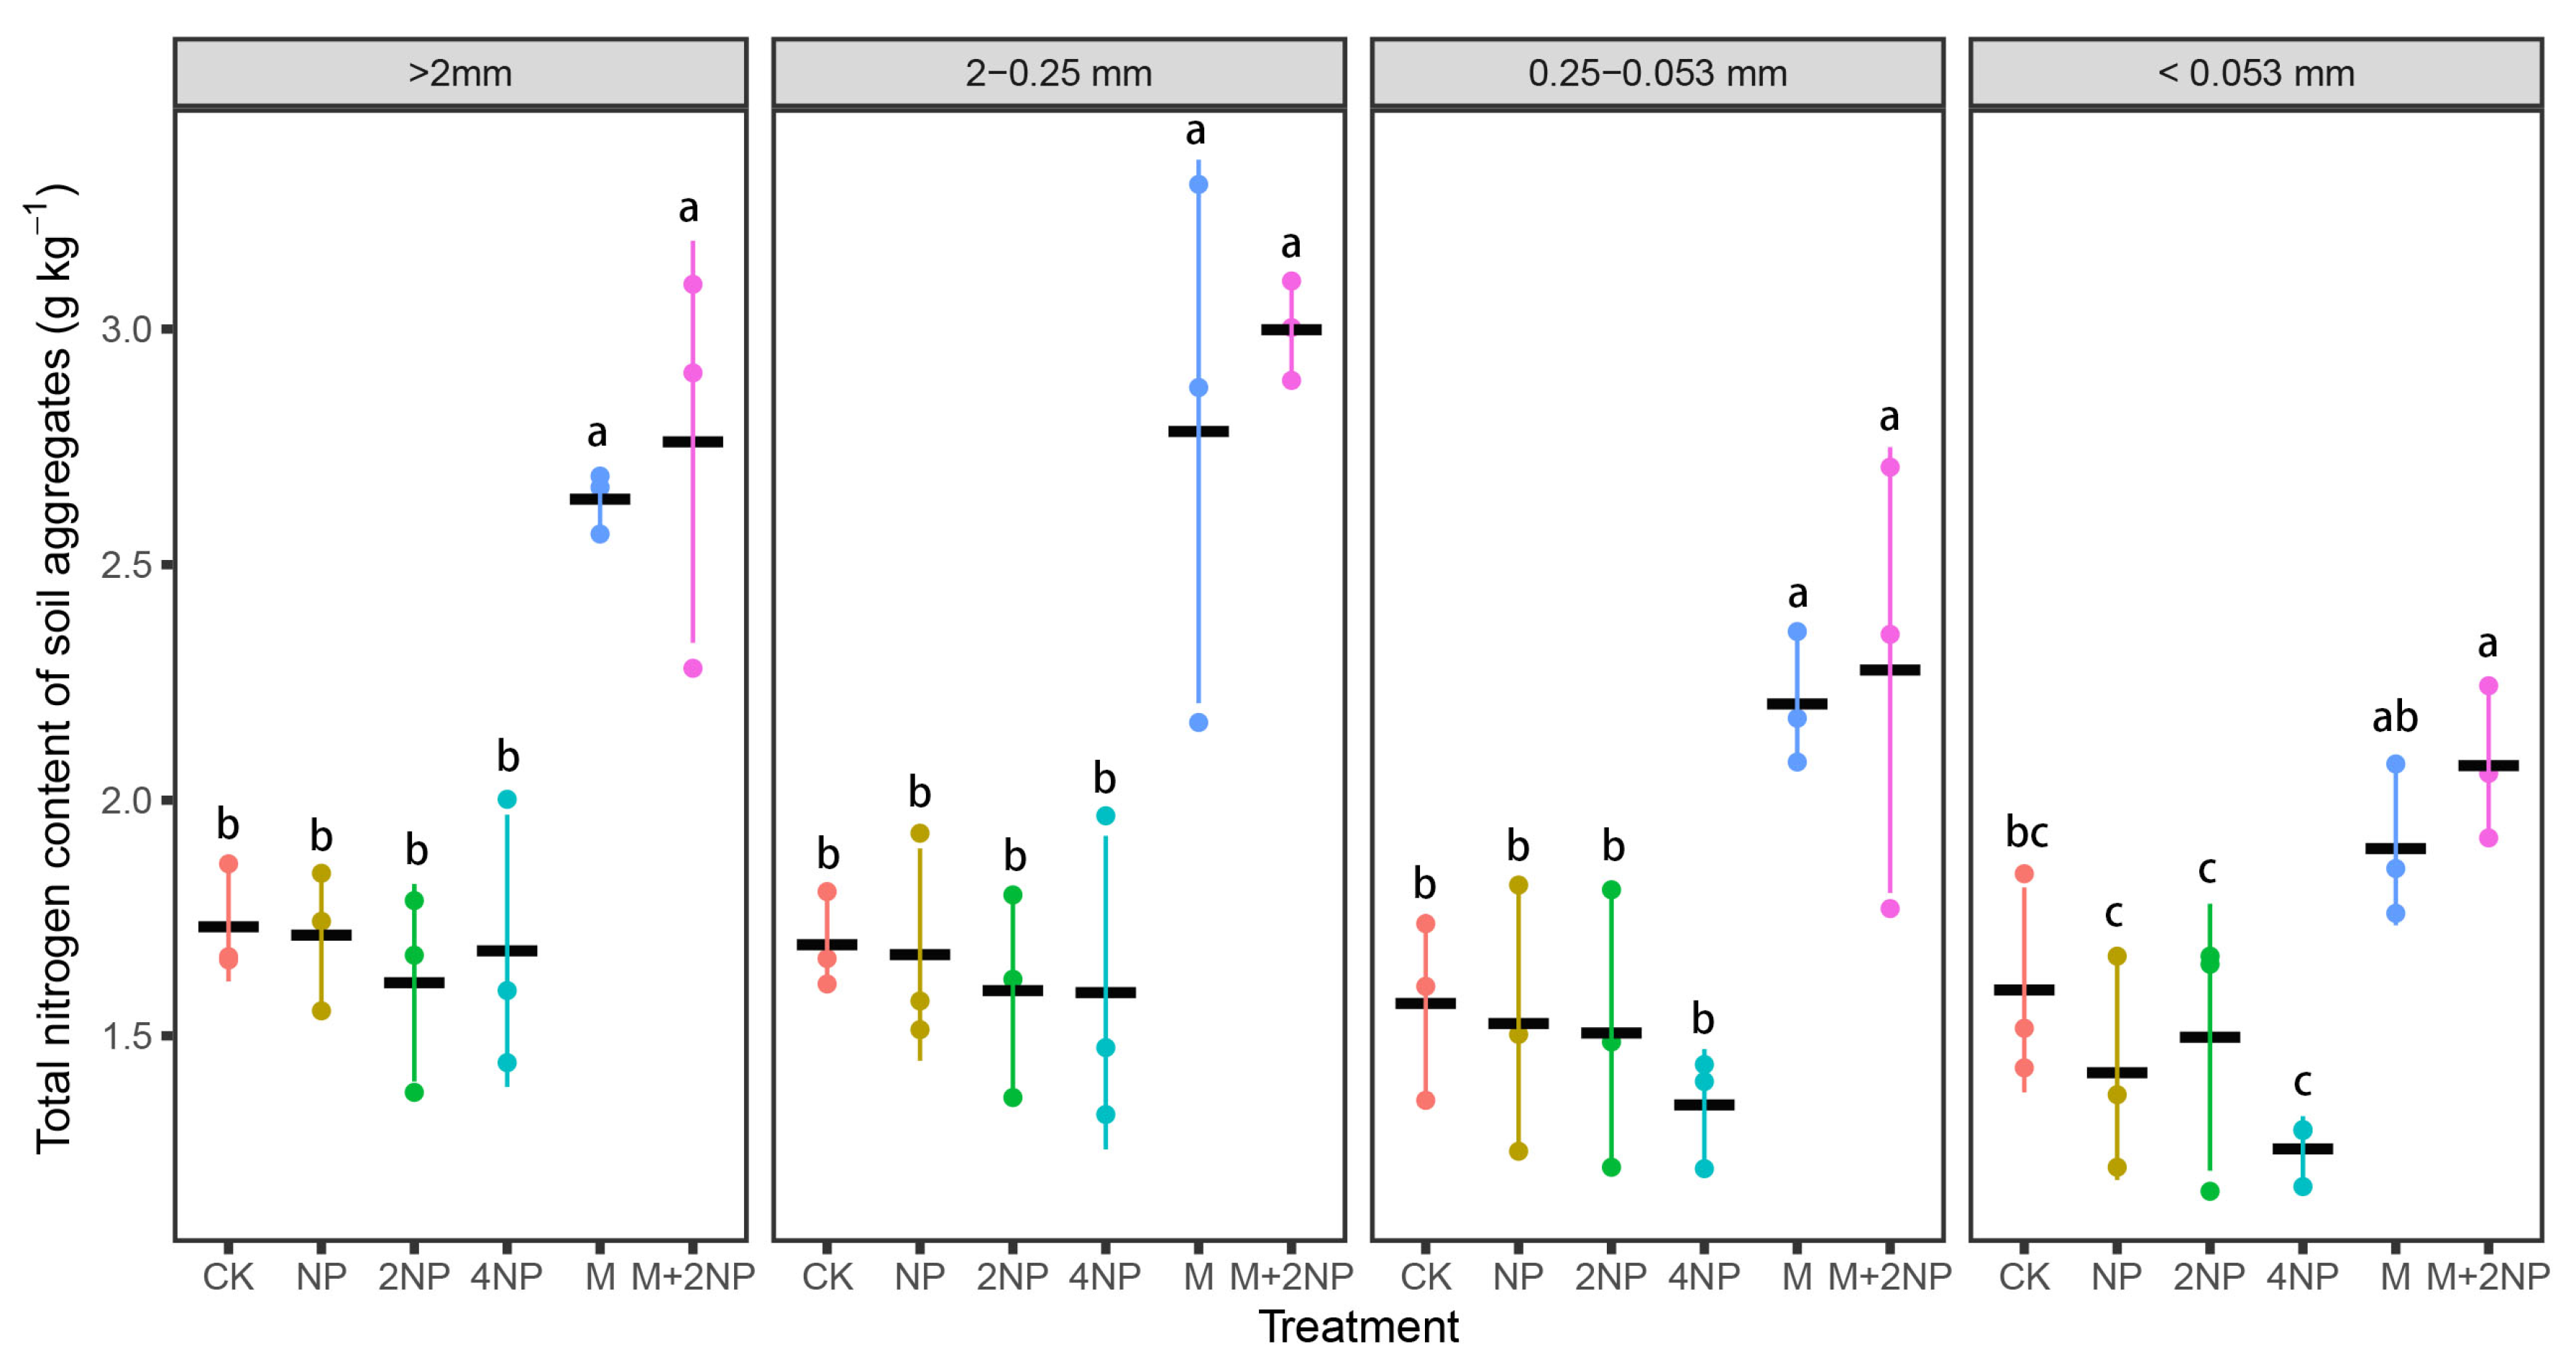
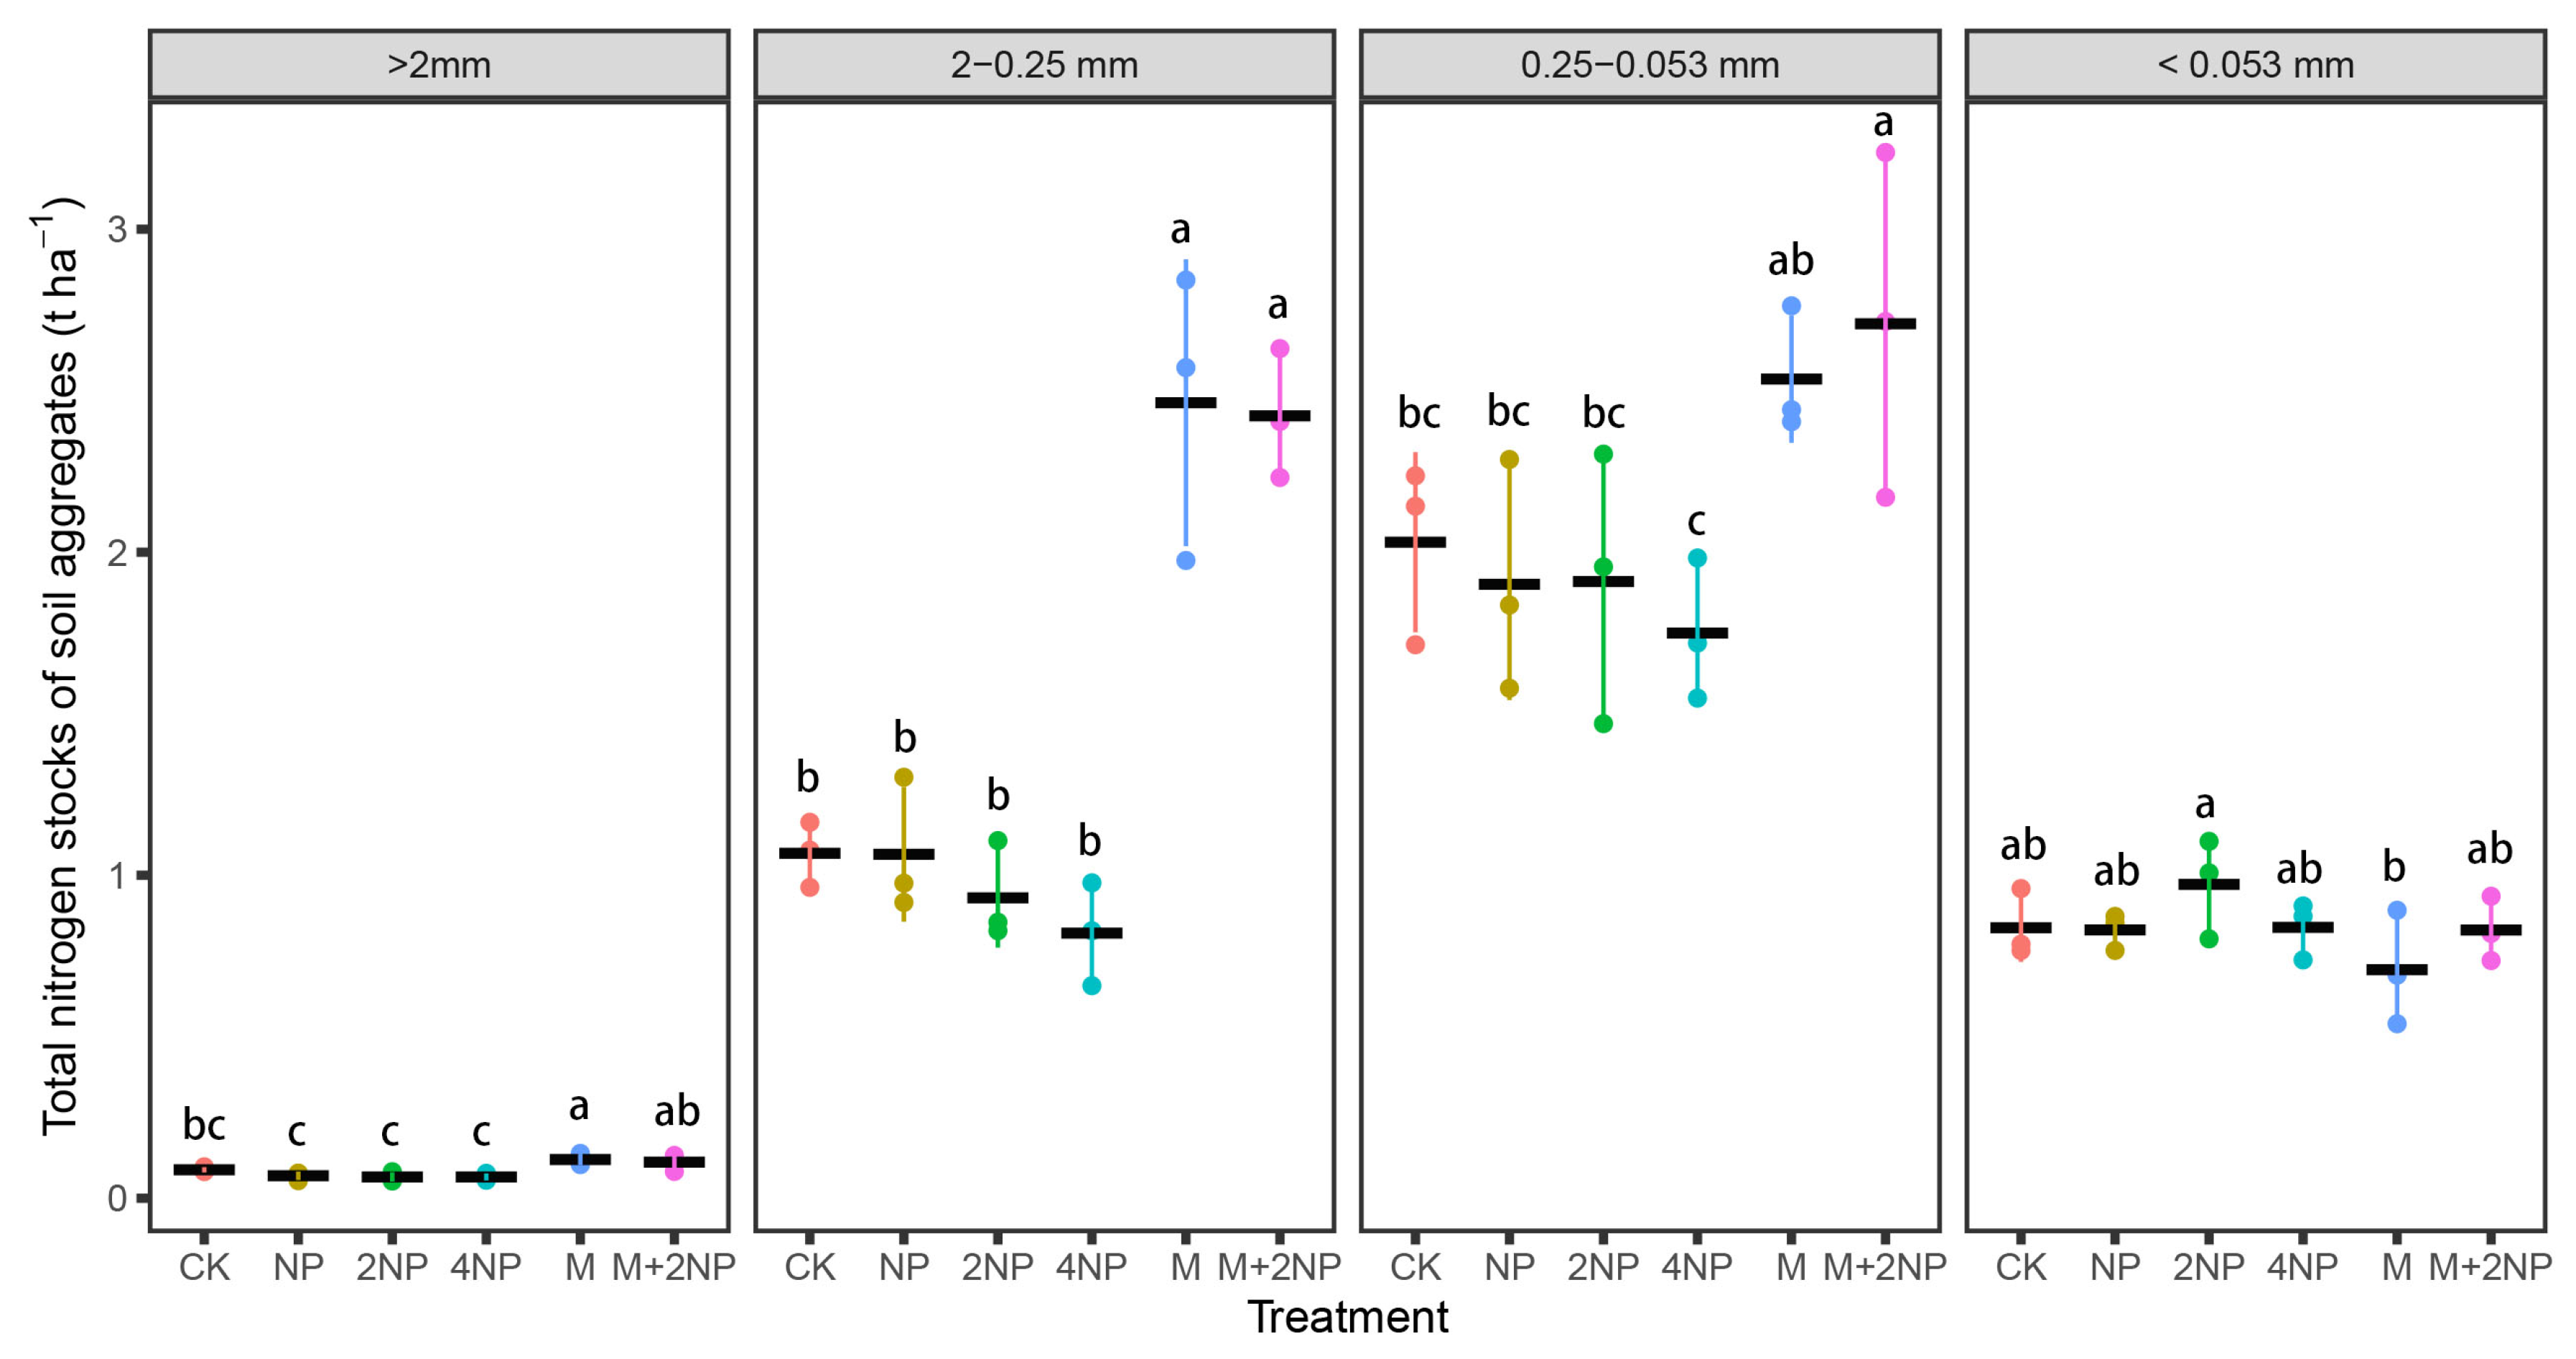
3.5.2. TN Content and Stock in Water-Stable Soil Aggregates

The distribution of TN content in soil aggregates across different fertilization treatments is shown in Figure 5. Compared to CK, NP, 2NP, and 4NP had no significant effect on the TN content of aggregates in all size classes. M and M+2NP had increased macroaggregate TN contents of 58.5% and 68.4%, respectively, and microaggregate TN content by 29.4% and 37.2%, respectively.
The distribution of TN stock in soil aggregates across different fertilization treatments is shown in Figure 6. Overall, the macroaggregate and microaggregate TN stock of the three treatments with chemical fertilizers alone did not differ significantly from those of CK. Compared to CK, M and M+2NP had significantly increased the macroaggregate TN stock by 122.7% and 118.5%, respectively, whereas their microaggregate TN stock did not differ significantly from that of CK. The macroaggregate TN stock of M+2NP had increased significantly by 154.4% and 185.8% than in 2NP and 4NP, respectively, whereas its microaggregate TN stock had increased more significantly, by 36.7%, than in 4NP.

3.6. Contributions of SOC in Soil Aggregates to Bulk Soil SOC under Different Fertilization Treatments

Different fertilization treatments exhibited significant differences in contribution rates to SOC (Table 5). Aggregates of the 2–0.25 mm and 0.25–0.053 mm size classes contributed most significantly to SOC. Compared to CK, there were no significant differences in the SOC contribution rates of macro and microaggregates under the three treatments with chemical fertilizers alone. In contrast, the macroaggregate SOC contribution rate of M and M+2NP had increased significantly by 47.9% and 45.1%, respectively. Compared to 2NP and 4NP, the macroaggregate SOC contribution rate of M+2NP had increased significantly, by 80.6% and 93.9%, respectively.
The trends of change in soil TN contribution rates under different fertilization treatments were similar to those of SOC contribution rates (Table 6). Compared to the macroaggregate TN contribution rate of CK, no significant differences were observed for NP, 2NP, and 4NP. In contrast, that of M and M+2NP had increased significantly by 47.9% and 40.3%, respectively. The microaggregate TN contribution rate of the M treatment had decreased significantly, by 25%, compared to CK, and increased significantly, by 25.5%, compared to 2NP. Compared to 2NP and 4NP, the macroaggregate contribution rate of M+2NP had increased significantly by 30.5% and 56%. Similarly, the M and M+2NP treatments mainly increased the TN contribution rate of macroaggregates.

4. Discussion

4.1. Effects of Long-Term Fertilization Practices on the Size Distribution and Stability of Aggregates in Dark Brown Soil

Farmland management practices (e.g., crop type, fertilization, and drainage) are crucial factors that can affect soil structure and properties [37]. The results of our study show that different long-term fertilization treatments led to significant differences in their effects on the water-stable aggregates of dark brown soil. Compared to CK and chemical fertilizers alone, M and M+2NP increased the proportion of water-stable macroaggregates. This was because the application and decomposition of organic fertilizers mainly stimulated microbial activity to form fungi and cementing substances, such as sugars, which facilitated the formation of macroaggregates by soil particles. Several studies have confirmed this point, demonstrating that adding manure and straw could increase the content of macroaggregates [38,39,40], as the input of organic matter led to an increase in soil binders, promoting the formation of soil macroaggregates [25,41,42]. In our experiment, the three treatments with chemical fertilizers alone (especially 4NP) resulted in the significant destruction of water-stable aggregates, leading to a decrease in aggregate stability. Chemical fertilizers provide rapid soil nutrients for crop growth, and excessive application of chemical fertilizers can lead to significant nutrient losses [43]. NPK fertilizers with high nutrient concentrations (particularly N) accelerate litter and SOM decomposition [44]. A net loss of SOC was observed over different rotation systems when synthetic fertilizer N was used due to accelerated residue degradation and decomposition of the initial SOC [44]. In contrast, organic fertilizers can also improve soil structure and increase SOM and biodiversity by providing a balanced, slower supply of nutrients [45]. In general, the SOC provides energy and nutrients for microorganisms to secrete polysaccharides that can combine fine fractions (<0.05 mm) and mineral particles to form coarse fractions (0.25–0.05 mm) [46]. This will result in an increase in intercohesion within microaggregates, thereby improving the stability of microaggregates. Polysaccharides are mainly derived from soil microbial activities and play an important role in aggregate stability [47]. Furthermore, M+2NP increased the proportion of macroaggregates compared to 2NP and 4NP. Therefore, the reduced application of chemical fertilizers and the combined application with organic fertilizers can enhance aggregate formation.
The MWD, GMD, D, and R > 0.25 mm of soil aggregates are key indicators for characterizing soil aggregate stability [48]. Our findings revealed significant correlations among GMD, MWD, R > 0.25 mm, and D. Therefore, MWD, GMD, D, and R > 0.25 mm could characterize the stability of water-stable soil aggregates. The soil aggregate stability indexes of M and M+2NP were significantly different from all other treatments. This is mainly attributed to the fact that the SOC we mentioned earlier provides energy and nutrients for microorganisms to secrete polysaccharides, which promotes the formation of soil aggregates.

4.2. Effects of Soil pH on Aggregate Stability in Dark Brown Soil

Soil acidification is a serious agricultural problem prevalent across the world [49]. In China, soil acidification is more common in the south. However, the soil environmental issues caused by excessive chemical fertilization, including soil acidification, can also be found in the north. The present study demonstrated that different long-term fertilization treatments led to significant variations in the pH changes of dark brown soil. More specifically, 2NP and 4NP caused more significant decreases in soil pH (by 0.1 and 0.2 units, respectively) than CK, whereas M+2NP more significantly increased soil pH (by 0.4 and 0.5 units, respectively) when compared to 2NP and 4NP. Therefore, the long-term application of chemical fertilizers alone caused a decrease in soil pH. In contrast, the application of organic fertilizers was more effective at mitigating soil acidification than chemical fertilizers alone. This was because organic fertilizers could supply the crops and soil with Ca+, Mg2+, and other trace elements, thus increasing soil pH and improving the soil environment [18,50]. Some studies have shown that soil pH value was associated with soil cohesion and dispersion [15,51]. We found that soil pH value was significantly correlated with soil macroaggregate content and aggregate stability indexes (MWD, GMD, and D). In other words, a higher soil pH was more conducive to increasing the content of soil macroaggregates, promoting the formation of soil aggregate, and improving aggregate stability. Xu et al. [31] found that acid rain reduced the stability of red soil aggregates, and that the content of macroaggregates declined with the decreasing pH and longer duration of acid rain. Thus, the reduction of chemical fertilizers and partial substitution of N fertilizers with organic fertilizers is a crucial means by which to reduce N fertilizer use [18], and is also immensely beneficial to increasing soil pH and improving soil aggregate structure.

4.3. Effects of Long-Term Fertilization Treatments on SOC and TN Content and Stock in Bulk Soil and Water-Stable Aggregates in Dark Brown Soil

The application of organic fertilizers has long been regarded as an effective means of improving soil C and N content [52,53,54]. The results of this study indicate that M and M+2NP produced higher C and N contents than all other treatments. It can mainly be attributed to the increased input of C and N sources due to the application of organic fertilizers [55,56], coupled with the important role of aggregates in the protection of SOC, nutrient supply, and storage capacity [5]. The trends of change in SOC and TN tend to be mutually consistent [57]. The distribution patterns of bulk soil and aggregate TN were similar to those of SOC. Several field experiments have demonstrated that the application of organic fertilizers increased bulk soil SOC and TN, and the SOC and TN in aggregates of all size classes [58,59]. Similarly, our findings revealed that M+2NP increased the SOC and TN of aggregates in all size classes. The increase in aggregate SOC and TN was because the SOC and TN sequestration rates of aggregates were higher than their rates of mineralization loss. Significant differences were also observed in the C sequestration capacity of aggregates in different size classes. Our experimental results demonstrated that the application of organic fertilizers mainly increased SOC and TN in water-stable macroaggregates. The M and M+2NP treatments increased the bulk soil SOC and TN and stock mainly by increasing the C and N contents in macroaggregates. This may be related to the fact that macroaggregates exhibit greater sequestration and protection effects for C and N than microaggregates [60], highlighting the importance of water-stable macroaggregates in the storage of SOC and TN. Some studies suggest the soil aggregates’ SOC and TN content varied according to different aggregate sizes [61]. We also found that the input of organic fertilizers provided a continuous source of C and N, which further promoted the formation and stabilization of macroaggregates while also enhancing C and N protection by aggregates. Our findings also revealed that the SOC and TN stock of microaggregates was higher than that of macroaggregates, accounting for approximately 70% of the total C and N stock in aggregates. This was because the water-stable aggregates in dark brown soil were predominantly <0.25 mm in size. Therefore, changes in SOC and TN stock in soil aggregates of different size classes result from the combined effects of changes in soil aggregate composition and nutrient content [62].

4.4. Contributions of SOC and TN in Soil Aggregates to Bulk Soil SOC and TN under Different Fertilization Treatments

By comprehensively considering the aggregate contents of different size classes and their nutrients, we can provide a full picture of the actions and effects of different fertilization practices on soil. We found that different fertilization treatments resulted in different effects on the SOC and TN contribution rates in aggregates of different size classes. The highest SOC and TN contribution rates among dark brown soil aggregates were in the 0.25–0.053 mm and 2–0.25 mm classes, suggesting that the dominant size classes contained higher levels of SOC and TN. Li et al. [63] showed that the contribution rates of aggregates to C and N were mainly affected by their content levels. Xu et al. [28] found that applying organic fertilizer increased the contribution rate of red soil macroaggregates to SOC. The application of organic fertilizers enhances the ability of macroaggregates to contribute to soil nutrients. Organic fertilizer treatment increased SOC and TN contents, which enhanced the effect of SOM in the agglomeration process, thus promoting the formation of macroaggregates. Furthermore, encapsulation by soil aggregates provided the encapsulated SOC with improved physical protection, while improving the nutrient supply and storage capacity of soil aggregates.
In particular, the large amount of animal manure produced by farms, which, if handled improperly, may pollute nearby underground and aboveground water bodies [64,65], as well as release N2O into the atmosphere [66], has serious adverse effects on the environment. When handled properly, manure can be used as organic fertilizer on farmland, saving a lot of chemical fertilizers and reducing risks to the environment. In addition, manure pretreatment needs to be considered. Heavy metals and antibiotic-resistant genes contained in organic fertilizers will enter the soil during continuous mass application and cause certain environmental risks [67,68]. Therefore, in the process of promoting the application of organic fertilizers in farmland, the safety risks of heavy metals in organic fertilizers should be fully paid attention to. The combination of organic amendments and a small amount of inorganic fertilizer is both economical and environmentally friendly for the development of sustainable agriculture.

5. Conclusions

Based on a long-term (41 years) field fertilization experiment, the present study quantified the changes in SOC, TN, aggregates, and pH under the wheat–soybean rotation system, providing useful information regarding the impact of different fertilization management practices on soil structure, and C and N storage in dark brown soil of northeast China. The application of organic fertilizers or a combination of organic and chemical fertilizers effectively decreased soil acidification and the extent of soil damage caused by the long-term application of chemical fertilizers alone and increased the stability and C accumulation of soil aggregates. The input of organic fertilizer is a vital mean to improve soil quality. Long-term application of organic fertilizers combined with reduced application of chemical fertilizers could offer an effective fertilization management strategy for the dark brown soil region in northeast China.

Author Contributions

W.D.: conceptualization, investigation, resources, visualization, and writing—original draft. J.Z., Y.J., H.H., F.Z. and X.L.: writing—review and editing. X.W.: conceptualization, writing—review and editing. All authors have read and agreed to the published version of the manuscript.

Funding

This research was funded by the Agricultural Science and Technology Innovation Program (ASTIP No. CAAS-ZDRW202202).

Data Availability Statement

All data supporting the findings of this study are included in the article.

Conflicts of Interest

The authors declare no conflict of interest.

References

  1. Lal, R. Soil health and carbon management. Food Energy Secur. 2016, 5, 212–222. [Google Scholar] [CrossRef]
  2. Ding, F.; Flury, M.; Schaeffer, S.M.; Xu, Y.; Wang, J. Does long-term use of biodegradable plastic mulch affect soil carbon stock? Resour. Conserv. Recycl. 2021, 175, 105895. [Google Scholar] [CrossRef]
  3. Wang, F.; Liu, Y.; Liang, B.; Liu, J.; Zong, H.; Guo, X.; Wang, X.; Song, N. Variations in soil aggregate distribution and associated organic carbon and nitrogen fractions in long-term continuous vegetable rotation soil by nitrogen fertilization and plastic film mulching. Sci. Total Environ. 2022, 835, 155420. [Google Scholar] [CrossRef]
  4. Zhu, G.Y.; Shangguan, Z.P.; Deng, L. Soil aggregate stability and aggregate-associated carbon and nitrogen in natural restoration grassland and Chinese red pine plantation on the Loess Plateau. Catena 2017, 149, 253–260. [Google Scholar] [CrossRef]
  5. Shrestha, B.M.; Singh, B.R.; Sitaula, B.K.; Lal, R.; Bajracharya, R.M. Soil aggregate- and particle-associated organic carbon under different land uses in Nepal. Soil Sci. Soc. Am. J. 2007, 71, 1194–1203. [Google Scholar] [CrossRef]
  6. Liu, X.; Wu, X.; Liang, G.; Zheng, F.; Zhang, M.; Li, S. A global meta-analysis of the impacts of no-tillage on soil aggregation and aggregate-associated organic carbon. Land Degrad. Dev. 2021, 32, 5292–5305. [Google Scholar] [CrossRef]
  7. Kamran, M.; Huang, L.; Nie, J.; Geng, M.; Lu, Y.; Liao, Y.; Zhou, F.; Xu, Y. Effect of reduced mineral fertilization (NPK) combined with green manure on aggregate stability and soil organic carbon fractions in a fluvo-aquic paddy soil. Soil Tillage Res. 2021, 211, 105005. [Google Scholar] [CrossRef]
  8. Huang, R.; Tian, D.; Liu, J.; Lv, S.; He, X.; Gao, M. Responses of soil carbon pool and soil aggregates associated organic carbon to straw and straw-derived biochar addition in a dryland cropping mesocosm system. Agric. Ecosyst. Environ. 2018, 265, 576–586. [Google Scholar] [CrossRef]
  9. Babur, E.; Kara, O.; Fathi, R.A.; Susam, Y.E.; Riaz, M.; Arif, M.; Akhtar, K. Wattle fencing improved soil aggregate stability, organic carbon stocks and biochemical quality by restoring highly eroded mountain region soil. J. Environ. Manag. 2021, 288, 112489. [Google Scholar] [CrossRef]
  10. Sui, Y.Y.; Jiao, X.G.; Liu, X.B.; Zhang, X.Y.; Ding, G.W. Water-stable aggregates and their organic carbon distribution after five years of chemical fertilizer and manure treatments on eroded farmland of Chinese Mollisols. Can. J. Soil Sci. 2012, 92, 551–557. [Google Scholar] [CrossRef] [Green Version]
  11. Rivera, J.I.; Bonilla, C.A. Predicting soil aggregate stability using readily available soil properties and machine learning techniques. Catena 2020, 187, 104408. [Google Scholar] [CrossRef]
  12. Six, J.; Bossuyt, H.; Degryze, S.; Denef, K. A history of research on the link between (micro)aggregates, soil biota, and soil organic matter dynamics. Soil Tillage Res. 2004, 79, 7–31. [Google Scholar] [CrossRef]
  13. Dimoyiannis, D. Wet aggregate stability as affected by excess carbonate and other soil properties. Land Degrad. Dev. 2012, 23, 450–455. [Google Scholar] [CrossRef]
  14. Regelink, I.C.; Stoof, C.R.; Rousseva, S.; Weng, L.; Lair, G.J.; Kram, P.; Nikolaidis, N.P.; Kercheva, M.; Banwart, S.; Comans, R.N.J. Linkages between aggregate formation, porosity and soil chemical properties. Geoderma 2015, 247–248, 24–37. [Google Scholar] [CrossRef]
  15. Pernes-Debuyser, A.; Tessier, D. Soil physical properties affected by long-term fertilization. Eur. J. Soil Sci. 2004, 55, 505–512. [Google Scholar] [CrossRef]
  16. Gong, H.; Meng, D.; Li, X.; Zhu, F. Soil degradation and food security coupled with global climate change in northeastern China. Chin. Geogr. Sci. 2013, 23, 562–573. [Google Scholar] [CrossRef]
  17. Xu, X.Z.; Xu, Y.; Chen, S.C.; Xu, S.G.; Zhang, H.W. Soil loss and conservation in the black soil region of Northeast China: A retrospective study. Environ. Sci. Policy 2010, 13, 793–800. [Google Scholar] [CrossRef]
  18. Li, Y.; Wu, X.; He, G.; Wang, Z. Benefits of Yield, Environment and economy from substituting fertilizer by manure for wheat production of China. Sci. Agric. Sin. 2020, 53, 4879–4890. [Google Scholar]
  19. Zhang, X.; Li, Q.; Gao, H.; Peng, C.; Zhu, P.; Gao, Q. Effects of long-term fertilization on the stability of black soil water stable aggregates and the distribution of organic carbon. Sci. Agric. Sin. 2020, 53, 1214–1223. [Google Scholar]
  20. Su, H.Q.; Han, X.R.; Yang, J.F.; Luo, P.Y.; Dai, J.; Yang, M.C.; He, R. Effect of long-term fertilization on distribution of aggregates and organic carbon and total nitrogen contents in a brown soil. J. Plant Nutr. Fertil. 2017, 23, 924–932. [Google Scholar]
  21. Geng, R.L.; Yu, H.Y.; Ding, W.X.; Cai, Z.C. Effects of long-term application of organic manure and chemical fertilizers on organic carbon in aggregates of a sandy loam. Soils 2010, 42, 908–914. [Google Scholar]
  22. He, R.Q.; Wang, B.Q.; Zhang, Y.; Wang, R. Distribution of organic carbon and nutrients in water stable aggregates of Lou soil under long-term application of chemical fertilizer. Bull. Soil Water Conserv. 2016, 36, 347–351. [Google Scholar]
  23. Miao, S.; Zhou, L.; Qiao, Y.; Qu, J.; Xu, W. Organic carbon mineralization and carbon contribution in aggregates as affected by long-term fertilization. Acta Pedol. Sin. 2009, 46, 1068–1075. [Google Scholar]
  24. Zhang, J.M.; Chi, F.Q.; Han, J.Z.; Zhou, B.K.; Kuang, E.J. SOC distribution characteristics of mollisols aggregates in different long-term fertilization systems. Soils Crops 2017, 6, 49–54. [Google Scholar]
  25. Liang, Y.; Yuan, Y.; Han, X.Z.; Li, L.; Zou, W.X.; Ren, J. Distribution of organic carbon and humic acids in aggregates of mollisol as affected by amendments with different rates of organic manure plus mineral fertilizer. J. Plant Nutr. Fertil. 2016, 22, 1586–1594. [Google Scholar]
  26. Shi, Z.X.; Wu, J.G. Composition and stability of the aggregates in black soil applied with different cattle manures. Soil Fertil. Sci. China 2013, 4, 10–15. [Google Scholar]
  27. Liu, X.Y.; Wang, Z.Q.; Zhang, X.Y.; Xu, L.L.; Shi, Y.; Sun, X.M.; Yang, F.T. Effects of long-term fertilization on aggregate dynamics and organic carbon and total nitrogen contents in a reddish paddy soil. Acta Ecol. Sin. 2013, 33, 4949–4955. [Google Scholar]
  28. Xu, J.; Li, C.; He, Y.; Wang, Y.; Liu, X. Effect of fertilization on organic carbon content and fractionation of aggregates in upland red soil. Acta Pedol. Sin. 2007, 44, 675–682. [Google Scholar]
  29. Adesodun, J.K.; Mbagwu, J.S.C.; Oti, N. Distribution of carbon, nitrogen and phosphorus in water-stable aggregates of an organic waste amended Ultisol in southern Nigeria. Bioresour. Technol. 2005, 96, 509–516. [Google Scholar] [CrossRef]
  30. Yi, L.; Shiqing, L.; Shengxiu, L. Distribution of nitrogen pools in different sizes of Loess Plateau soil aggregates. Sci. Agric. Sin. 2007, 40, 304–313. [Google Scholar]
  31. Xu, Z.J.; Liu, G.S.; Yu, J.D.; Liu, W.P. Effects of acid rain on aggregate and lts cemedins of red soil by simulated experiments. J. Soil Water Conserv. 2002, 16, 9–11. [Google Scholar]
  32. Hu, G.C.; Zhang, M.K. Mineralogical evidence for strong cementation of soil particles by lron oxides. Chin. J. Soil Sci. 2002, 33, 25–27. [Google Scholar]
  33. Cui, X.; Qiu, J.; Dou, S. Effects of long-time fertilization on crop yield and soil nutrients of dark brown earth. J. Jilin Agric. Univ. 2011, 33, 545–550. [Google Scholar]
  34. Cambardella, C.A.; Elliott, E.T. Carbon and Nitrogen Distribution in Aggregates from Cultivated and Native Grassland Soils. Soil Sci. Soc. Am. J. 1993, 57, 1071–1076. [Google Scholar] [CrossRef]
  35. Bi, Y.; Zou, H.; Zhu, C. Dynamic monitoring of soil bulk density and infiltration rate during coal mining in sandy land with different vegetation. Int. J. Coal Sci. Technol. 2014, 1, 198–206. [Google Scholar] [CrossRef] [Green Version]
  36. Xie, L.J.; Wang, B.R.; Xu, M.G.; Peng, C.; Liu, H. Changes of soil organic carbon storage under long-term fertilization in black and grey-desert soils. J. Plant Nutr. Fertil. 2012, 18, 98–105. [Google Scholar]
  37. Pinheiro, E.F.M.; Pereira, M.G.; Anjos, L.H.C. Aggregate distribution and soil organic matter under different tillage systems for vegetable crops in a Red Latosol from Brazil. Soil Till Res. 2004, 77, 79–84. [Google Scholar] [CrossRef]
  38. Rasool, R.; Kukal, S.S.; Hira, G.S. Soil organic carbon and physical properties as affected by long-term application of FYM and inorganic fertilizers in maize-wheat system. Soil Till Res. 2008, 101, 31–36. [Google Scholar] [CrossRef]
  39. Aoyama, M.; Angers, D.A.; N’Dayegamiye, A. Particulate and mineral-associated organic matter in water-stable aggregates as affected by mineral fertilizer and manure applications. Can. J. Soil Sci. 1999, 79, 295–302. [Google Scholar] [CrossRef]
  40. Yang, C.M.; Yang, L.Z.; Zhu, O.Y. Organic carbon and its fractions in paddy soil as affected by different nutrient and water regimes. Geoderma 2005, 124, 133–142. [Google Scholar] [CrossRef]
  41. Six, J.; Elliott, E.T.; Paustian, K. Soil macroaggregate turnover and microaggregate formation: A mechanism for C sequestration under no-tillage agriculture. Soil Biol. Biochem. 2000, 32, 2099–2103. [Google Scholar] [CrossRef]
  42. Majumder, B.; Ruehlmann, J.; Kuzyakov, Y. Effects of aggregation processes on distribution of aggregate size fractions and organic C content of a long-term fertilized soil. Eur. J. Soil Biol. 2010, 46, 365–370. [Google Scholar] [CrossRef]
  43. Liu, L.; Zheng, X.; Wei, X.; Kai, Z.; Xu, Y. Excessive application of chemical fertilizer and organophosphorus pesticides induced total phosphorus loss from planting causing surface water eutrophication. Sci. Rep. 2021, 11, 23015. [Google Scholar] [CrossRef] [PubMed]
  44. Khan, S.A.; Timney, B. Alcohol slows interhemispheric transmission, increases the flash-lag effect, and prolongs masking: Evidence for a slowing of neural processing and transmission. Vision Res. 2007, 47, 1821–1832. [Google Scholar] [CrossRef]
  45. Sradnick, A.; Murugan, R.; Oltmanns, M.; Raupp, J.; Joergensen, R.G. Changes in functional diversity of the soil microbial community in a heterogeneous sandy soil after long-term fertilization with cattle manure and mineral fertilizer. Appl. Soil Ecol. 2013, 63, 23–28. [Google Scholar] [CrossRef]
  46. Sleutel, S.; De Neve, S.; Németh, T.; Tóth, T.; Hofman, G. Effect of manure and fertilizer application on the distribution of organic carbon in different soil fractions in long-term field experiments. Eur. J. Agron. 2006, 25, 280–288. [Google Scholar] [CrossRef]
  47. Sekiguchi, R.; Saito, H.; Tanaka, H.; Kohgo, Y. Temperature dependence of volcanic ash soil aggregate stability: Effects of fertilizer application. Soil Tillage Res. 2021, 207, 104870. [Google Scholar] [CrossRef]
  48. Tang, Y.Q.; Li, J.; Zhang, X.H.; Yang, P.; Wang, J.X.; Zhou, N.Q. Fractal characteristics and stability of soil aggregates in karst rocky desertification areas. Nat. Hazards 2013, 65, 563–579. [Google Scholar] [CrossRef]
  49. Guo, J.H.; Liu, X.J.; Zhang, Y.; Shen, J.L.; Han, W.X.; Zhang, W.F.; Christie, P.; Goulding, K.W.T.; Vitousek, P.M.; Zhang, F.S. Significant Acidification in Major Chinese Croplands. Science 2010, 327, 1008–1010. [Google Scholar] [CrossRef]
  50. Whalen, J.K.; Chang, C.; Clayton, G.W.; Carefoot, J.P. Cattle manure amendments can increase the pH of acid soils. Soil Sci. Soc. Am. J. 2000, 64, 962–966. [Google Scholar] [CrossRef]
  51. Zhang, J.; Wang, Q.; Wang, W.; Zhang, X. The dispersion mechanism of dispersive seasonally frozen soil in western Jilin Province. Bull. Eng. Geol. Environ. 2021, 80, 5493–5503. [Google Scholar] [CrossRef]
  52. Bhattacharyya, R.; Prakash, V.; Kundu, S.; Srivastva, A.K.; Gupta, H.S.; Mitra, S. Long term effects of fertilization on carbon and nitrogen sequestration and aggregate associated carbon and nitrogen in the Indian sub-Himalayas. Nutr. Cycl. Agroecosystems 2010, 86, 1–16. [Google Scholar] [CrossRef]
  53. Chen, Y.; Zhang, X.D.; He, H.B.; Xie, H.T.; Yan, Y.; Zhu, P.; Ren, J.; Wang, L.C. Carbon and nitrogen pools in different aggregates of a Chinese Mollisol as influenced by long-term fertilization. J. Soil Sediment 2010, 10, 1018–1026. [Google Scholar] [CrossRef]
  54. Tripathi, R.; Nayak, A.K.; Bhattacharyya, P.; Shukla, A.K.; Shahid, M.; Raja, R.; Panda, B.B.; Mohanty, S.; Kumar, A.; Thilagam, V.K. Soil aggregation and distribution of carbon and nitrogen in different fractions after 41 years long-term fertilizer experiment in tropical rice-rice system. Geoderma 2014, 213, 280–286. [Google Scholar] [CrossRef]
  55. Song, Z.W.; Zhu, P.; Gao, H.J.; Peng, C.; Deng, A.X.; Zheng, C.Y.; Mannaf, M.A.; Islam, M.N.; Zhang, W.J. Effects of long-term fertilization on soil organic carbon content and aggregate composition under continuous maize cropping in Northeast China. J. Agr. Sci. Camb. 2015, 153, 236–244. [Google Scholar] [CrossRef]
  56. Xie, H.T.; Li, J.W.; Zhu, P.; Peng, C.; Wang, J.K.; He, H.B.; Zhang, X.D. Long-term manure amendments enhance neutral sugar accumulation in bulk soil and particulate organic matter in a Mollisol. Soil Biol. Biochem. 2014, 78, 45–53. [Google Scholar] [CrossRef]
  57. Wright, A.L.; Hons, F.M. Soil aggregation and Carbon and Nitrogen storage under soybean cropping sequences. Soil Sci. Soc. Am. J. 2004, 68, 507–513. [Google Scholar] [CrossRef]
  58. Green, V.S.; Cavigelli, M.A.; Dao, T.H.; Flanagan, D.C. Soil physical properties and aggregate-associated C, N, and P distributions in organic and conventional cropping systems. Soil Sci. 2005, 170, 822–831. [Google Scholar] [CrossRef]
  59. Bronick, C.J.; Lal, R. Manuring and rotation effects on soil organic carbon concentration for different aggregate size fractions on two soils in northeastern Ohio, USA. Soil Till Res. 2005, 81, 239–252. [Google Scholar] [CrossRef]
  60. Wang, X.; Qi, J.Y.; Jing, Z.H.; Li, C.; Zhang, H.L. Effects of long-term conservation tillage on soil aggregate stability and carbon and nitrogen in paddy field. Trans. Chin. Soc. Agric. Eng. 2019, 35, 121–128. [Google Scholar]
  61. Huang, X.L.; Jiang, H.; Li, Y.; Ma, Y.C.; Tang, H.Y.; Ran, W.; Shen, Q.R. The role of poorly crystalline iron oxides in the stability of soil aggregate-associated organic carbon in a rice-wheat cropping system. Geoderma 2016, 279, 1–10. [Google Scholar] [CrossRef]
  62. Han, Z.Q.; Ha, Z.C.; Zhang, D.X.; Wang, Q.B.; Chen, H.B.; Chang, L.S.; Yu, Y.Q.; Liu, D.Q. Distributions of organic carbon and nitrogen in cinnamon soil micro-aggregates and effect on soil fertility under the different fertilization regimes. Acta Agric. Boreali-Sin. 2008, 23, 190–195. [Google Scholar]
  63. Li, W.J.; Yang, J.F.; Peng, B.F.; Cui, J.Z. Effects of fertilization on aggregate characteristics and organic carbon distribution in a Paddy soil in Dongting lake Plain of China. Sci. Agric. Sin. 2014, 47, 4007–4015. [Google Scholar]
  64. Kamilaris, A.; Prenafeta-Boldú, F.X. Examining the perspectives of using manure from livestock farms as fertilizer to crop fields based on a realistic simulation. Comput. Electron. Agric. 2021, 191, 106486. [Google Scholar] [CrossRef]
  65. Vu, T.K.V.; Tran, M.T.; Dang, T.T.S. A survey of manure management on pig farms in Northern Vietnam. Livest. Sci. 2007, 112, 288–297. [Google Scholar] [CrossRef]
  66. Davidson, E.A. The contribution of manure and fertilizer nitrogen to atmospheric nitrous oxide since 1860. Nat. Geosci. 2009, 2, 659–662. [Google Scholar] [CrossRef]
  67. Li, H.; Wang, X.; Tan, L.; Li, Q.; Zhang, C.; Wei, X.; Wang, Q.; Zheng, X.; Xu, Y. Coconut shell and its biochar as fertilizer amendment applied with organic fertilizer: Efficacy and course of actions on eliminating antibiotic resistance genes in agricultural soil. J. Hazard Mater. 2022, 437, 129322. [Google Scholar] [CrossRef] [PubMed]
  68. Ning, C.-C.; Gao, P.-D.; Wang, B.-Q.; Lin, W.-P.; Jiang, N.-H.; Cai, K.-Z. Impacts of chemical fertilizer reduction and organic amendments supplementation on soil nutrient, enzyme activity and heavy metal content. J. Integr. Agric. 2017, 16, 1819–1831. [Google Scholar] [CrossRef] [Green Version]
Figure 1. The size distribution of soil aggregates. Different lowercase letters show significant differences among fertilization treatments in the same aggregate fractions (p < 0.05). Values are given as means ± SD (n = 3). Abbreviations: CK = no fertilizer; NP = low−dose chemical fertilizer; 2NP = moderate−dose chemical fertilizer; 4NP = high−dose chemical fertilizer; M = normal−dose organic fertilizer; M+2NP = normal−dose organic fertilizer + moderate−dose chemical fertilizer.
Agronomy 12 02101 g001
Figure 2. Changes of soil pH in different fertilization treatments. Different lowercase letters indicate significant differences among treatments (p < 0.05). Abbreviations: CK = no fertilizer; NP = low − dose chemical fertilizer; 2NP = moderate − dose chemical fertilizer; 4NP = high − dose chemical fertilizer; M = normal − dose organic fertilizer; M+2NP = normal − dose organic fertilizer + moderate − dose chemical fertilizer.
Agronomy 12 02101 g002
Figure 3. Organic carbon content of soil aggregates. The black horizontal and colorful vertical lines represent the mean and SD, respectively, and the dots next to them represent the respective measured values. Different lowercase letters show significant differences among fertilization treatments in the same aggregate fractions (p < 0.05). Values are given as means ± SD (n = 3). Abbreviations: CK = no fertilizer; NP = low − dose chemical fertilizer; 2NP = moderate − dose chemical fertilizer; 4NP = high − dose chemical fertilizer; M = normal − dose organic fertilizer; M+2NP = normal − dose organic fertilizer + moderate − dose chemical fertilizer.
Agronomy 12 02101 g003
Figure 4. Organic carbon storage of soil aggregates. The black horizontal and colorful vertical lines represent the mean and SD, respectively, and the dots next to them represent the respective measured values. Different lowercase letters show significant differences among fertilization treatments in the same aggregate fractions (p < 0.05). Values are given as means ± SD (n = 3). Abbreviations: CK = no fertilizer; NP = low − dose chemical fertilizer; 2NP = moderate − dose chemical fertilizer; 4NP = high − dose chemical fertilizer; M = normal − dose organic fertilizer; M+2NP = normal − dose organic fertilizer + moderate − dose chemical fertilizer.
Agronomy 12 02101 g004
Figure 5. Total nitrogen content of soil aggregates. The black horizontal and colorful vertical lines represent the mean and SD, respectively, and the dots next to them represent the respective measured values. Different lowercase letters show significant differences among fertilization treatments in the same aggregate fractions (p < 0.05). Values are given as means ± SD (n = 3). Abbreviations: CK = no fertilizer; NP = low − dose chemical fertilizer; 2NP = moderate − dose chemical fertilizer; 4NP = high − dose chemical fertilizer; M = normal − dose organic fertilizer; M+2NP = normal − dose organic fertilizer + moderate − dose chemical fertilizer.
Agronomy 12 02101 g005
Figure 6. Total nitrogen stocks of soil aggregates. The black horizontal and colorful vertical lines represent the mean and SD, respectively, and the dots next to them represent the respective measured values. Different lowercase letters show significant differences among fertilization treatments in the same aggregate fractions (p < 0.05). Values are given as means ± SD (n = 3). Abbreviations: CK = no fertilizer; NP = low − dose chemical fertilizer; 2NP = moderate − dose chemical fertilizer; 4NP = high − dose chemical fertilizer; M = normal − dose organic fertilizer; M+2NP = normal − dose organic fertilizer + moderate − dose chemical fertilizer.
Agronomy 12 02101 g006
Table 1. The investigating treatment and fertilization amount (kg ha−1).
TreatmentChemical FertilizerOrganic FertilizerThe Total dose Per Year
NP2O5K2ONP2O5K2ONP2O5K2OTotal
CK0000000000
NP37.537.5000037.537.5075
2NP7575000075750150
4NP15015000001501500300
M00029151229151256
M+2NP757502915121049012206
Note: Abbreviations: CK = no fertilizer; NP = low-dose chemical fertilizer; 2NP = moderate-dose chemical fertilizer; 4NP = high-dose chemical fertilizer; M = normal-dose organic fertilizer; M+2NP = normal-dose organic fertilizer + moderate-dose chemical fertilizer.
Table 2. Soil aggregate stability indexes.
TreatmentMWD (mm)GMD (mm)DR > 0.25 mm (%)
CK0.49 ± 0.01 b0.19 ± 0.00 b2.62 ± 0.01 b0.27 ± 0.01 c
NP0.46 ± 0.03 bc0.18 ± 0.01 bc2.65 ± 0.02 ab0.27 ± 0.02 c
2NP0.44 ± 0.04 cd0.16 ± 0.01 c2.67 ± 0.01 a0.25 ± 0.02 cd
4NP0.41 ± 0.02 d0.15 ± 0.01 c2.68 ± 0.01 a0.22 ± 0.02 d
M0.59 ± 0.03 a0.26 ± 0.02 a2.53 ± 0.04 c0.38 ± 0.01 a
M+2NP0.55 ± 0.03 a0.24 ± 0.02 a2.55 ± 0.02 c0.35 ± 0.03 b
Note: MWD, GMD, D, and R > 0.25 mm indicate mean weight diameter, geometric mean diameter, fractal dimension, and percentage of aggregates >0.25 mm, respectively. The data are given as means ± SD (n = 3). Different lowercase letters in the same column show significant differences among fertilization treatments (p < 0.05). Abbreviations: CK = no fertilizer; NP = low−dose chemical fertilizer; 2NP = moderate−dose chemical fertilizer; 4NP = high−dose chemical fertilizer; M = normal−dose organic fertilizer; M+2NP = normal−dose organic fertilizer + moderate−dose chemical fertilizer.
Table 3. Correlation analysis of soil pH with soil macroaggregate content and aggregate stability indexes.
R > 0.25 mmMWDGMDDpH
R > 0.25 mm1
MWD0.986 **1
GMD0.988 **0.984 **1
D−0.955 **−0.963 **−0.988 **1
pH0.974 **0.965 **0.972 **−0.947 **1
Note: R > 0.25 mm, MWD, GMD, D, and pH indicate percentage of aggregates >0.25 mm, mean weight diameter, geometric mean diameter, fractal dimension, and soil pH, respectively. ** p < 0.01; ns, not significant.
Table 4. Total SOC, TN content, and stock.
SOC Content g kg−1TN Content g kg−1C/NSOC Stock
t C ha−1
TN Stock
t N ha−1
CK20.25 ± 0.68 b1.54 ± 0.04 b13.18 ± 0.21 a50.60 ± 1.52 b3.84 ± 0.08 b
NP19.34 ± 0.97 bc1.44 ± 0.07 bc13.46 ± 0.39 a48.54 ± 2.19 bc3.61 ± 0.16 bc
2NP16.85 ± 0.32 c1.21 ± 0.05 d13.96 ± 0.89 a42.80 ± 0.75 c3.07 ± 0.14 d
4NP19.16 ± 1.85 bc1.30 ± 0.08 cd14.77 ± 1.78 a48.10 ± 4.23 bc3.27 ± 0.21 cd
M24.08 ± 2.56 a2.36 ± 0.12 a10.19 ± 0.60 b59.03 ± 5.56 a5.79 ± 0.22 a
M+2NP25.18 ± 1.54 a2.46 ± 0.19 a10.25 ± 0.22 b61.44 ± 3.33 a6.00 ± 0.43 a
Note: The data are given as means ± SD (n = 3). Different lowercase letters in the same column show significant differences among fertilization treatments (p < 0.05). Abbreviations: CK = no fertilizer; NP = low − dose chemical fertilizer; 2NP = moderate − dose chemical fertilizer; 4NP = high − dose chemical fertilizer; M = normal − dose organic fertilizer; M+2NP = normal − dose organic fertilizer + moderate − dose chemical fertilizer.
Table 5. Contribution of organic carbon in aggregate to total SOC under different treatments.
TreatmentContribution of OC in Aggregate to SOC (%)
>2 mm2–0.25 mmSum0.25–0.053 mm<0.053 mmSum
CK2.03 ± 0.32 a26.89 ± 2.91 b28.92 ± 3.17 b49.60 ± 6.59 a18.73 ± 0.38 b68.34 ± 6.72 ab
NP1.68 ± 0.27 a26.43 ± 2.50 b28.10 ± 2.74 b46.47 ± 3.58 a19.41 ± 1.31 b65.88 ± 2.28 ab
2NP1.73 ± 0.39 a23.25 ± 3.71 b24.99 ± 3.97 b49.24 ± 9.64 a22.96 ± 2.89 a72.20 ± 11.99 a
4NP1.63 ± 0.26 a21.64 ± 3.55 b23.27 ± 3.80 b46.04 ± 8.51 a20.48 ± 0.38 ab66.52 ± 8.18 ab
M2.14 ± 0.15 a45.74 ± 4.15 a47.87 ± 4.01 a43.43 ± 2.01 a11.13 ± 2.81 c54.57 ± 3.69 b
M+2NP1.92 ± 0.33 a43.20 ± 1.39 a45.12 ± 1.72 a44.86 ± 6.36 a12.38 ± 1.62 c57.25 ± 6.88 b
Note: Different lowercase letters show significant differences among fertilization treatments in the same aggregate fractions (p < 0.05). Values are given as means ±SD (n = 3). Abbreviations: CK = no fertilizer; NP = low − dose chemical fertilizer; 2NP = moderate − dose chemical fertilizer; 4NP = high − dose chemical fertilizer; M = normal − dose organic fertilizer; M+2NP = normal − dose organic fertilizer + moderate − dose chemical fertilizer.
Table 6. Contribution rate of total nitrogen in soil aggregates of different treatments.
TreatmentContribution of TN in Aggregate to TN (%)
>2 mm2–0.25 mmSum0.25–0.053 mm<0.053 mmSum
CK2.29 ± 0.17 a27.79 ± 2.04 b30.09 ± 2.15 b52.90 ± 7.12 ab21.86 ± 3.21 b74.76 ± 8.82 bc
NP1.92 ± 0.29 a29.44 ± 4.77 b31.36 ± 4.90 b52.52 ± 7.89 ab23.07 ± 1.97 b75.59 ± 7.90 bc
2NP2.14 ± 0.38 a30.20 ± 3.85 b32.34 ± 4.17 b62.09 ± 12.58 a31.74 ± 5.80 a93.83 ± 17.19 a
4NP2.02 ± 0.27 a25.03 ± 3.97 b27.05 ± 4.24 b53.52 ± 5.40 ab25.78 ± 3.82 ab79.30 ± 3.65 ab
M2.07 ± 0.29 a42.41 ± 6.33 a44.49 ± 6.19 a43.81 ± 2.56 b12.24 ± 3.03 c56.05 ± 0.48 d
M+2NP1.85 ± 0.31 a40.35 ± 1.28 a42.21 ± 1.37 a44.93 ± 6.84 b13.89 ± 1.96 c58.82 ± 7.71 cd
Note: Different lowercase letters show significant differences among fertilization treatments in the same aggregate fractions (p < 0.05). Values are given as means ± SD (n = 3). Abbreviations: CK = no fertilizer; NP = low − dose chemical fertilizer; 2NP = moderate − dose chemical fertilizer; 4NP = high − dose chemical fertilizer; M = normal − dose organic fertilizer; M+2NP = normal − dose organic fertilizer + moderate − dose chemical fertilizer.
Publisher’s Note: MDPI stays neutral with regard to jurisdictional claims in published maps and institutional affiliations.

