Article

Hyperspectral Vegetation Indices to Assess Water and Nitrogen Status of Sweet Maize Crop

1
Department of Soil, Plant and Food Sciences, University of Bari Aldo Moro, 70126 Bari, Italy
2
CIHEAM–Mediterranean Agronomic Institute of Bari, 70010 Valenzano, Italy
3
Department Life Science Engineering, School of Life Sciences, Technical University of Munich, 85354 Freising, Germany
4
Institute of Sciences of Food Production (ISPA), National Research Council (CNR), Via Amendola, 122/O, 70125 Bari, Italy
5
French National Institute for Agriculture, Food, and Environment (INRAE), UMR TETIS, University of Montpellier, AgroParisTech, 500 Rue François Breton, CEDEX 5, 34093 Montpellier, France
6
Institute for Agricultural and Forestry Systems in the Mediterranean (ISAFOM), National Research Council (CNR), Piazzale Enrico Fermi 1, 80055 Portici, Italy
*
Author to whom correspondence should be addressed.
Agronomy 2022, 12(9), 2181; https://doi.org/10.3390/agronomy12092181
Submission received: 5 July 2022 / Revised: 8 September 2022 / Accepted: 9 September 2022 / Published: 14 September 2022

Abstract

:
The deployment of novel technologies in the field of precision farming has risen to the top of global agendas in response to the impact of climate change and the possible shortage of resources such as water and fertilizers. The present research addresses the performance of water and nitrogen-sensitive narrow-band vegetation indices to evaluate the response of sweet maize (Zea mays var. saccharata L.) to different irrigation and nitrogen regimes. The experiment was carried out in Valenzano, Bari (Southern Italy), during the 2020 growing season. Three irrigation regimes (full irrigation, deficit irrigation, and rainfed) and two nitrogen levels (300 and 50 kg ha−1) were tested. During the growing season, a Field Spec Handheld 2 spectroradiometer operating in the range of 325–1075 nm was utilized to capture spectral data regularly. In addition, soil water content, biometric parameters, and physiological parameters were measured. The DATT index, based on near-infrared and red-edge wavelengths, performed better than other indices in explaining the variation in chlorophyll content, whereas the double difference index (DD) showed the greatest correlation with the leaf–gas exchange. The modified normalized difference vegetation index (NNDVI) and the ratio of water band index to normalized difference vegetation index (WBI/NDVI) showed the highest capacity to distinguish the interaction of irrigation x nitrogen, while the best discriminating capability of these indices was under a low nitrogen level. Moreover, red-edge-based indices had higher sensitivity to nitrogen levels compared to the structural and water band indices. Our study highlighted that it is critical to choose proper narrow-band vegetation indices to monitor the plant eco-physiological response to water and nitrogen stresses.

1. Introduction

Water and nitrogen (N) have long been known as two primary restricting inputs for crop production. Water stress directly affects crop growth and productivity [1,2,3,4]. According to several studies, crops in many regions, especially in the Mediterranean and other arid and semi-arid areas, experience severe effects of drought [5], which causes yield loss. Therefore, various studies have aimed to identify and assess the performance of water stress indicators and strategies for water use optimization [6,7]. Additionally, the application of essential nutrients in the optimal quantity is necessary to improve the crop growth and development; nitrogen is considered the most vital nutrient by having a fundamental role in the biochemical and physiological functions of plants [8,9,10]. Normally, N deficit causes a decrease in biomass and leaf chlorophyll concentration, and an increment in leaf reflectance in the chlorophyll absorption bands of the visible part of the electromagnetic spectrum [11].
The interaction of water and nitrogen affects the biochemical and biophysical processes from the environmental to the molecular level. Some findings have shown that water–nitrogen interactions mainly affect the crop yield, grain size, protein content, root depth, and root-to-shoot translocation [12,13]. Hence, matching N supply to water availability, both spatially and temporally, is essential to accomplish an optimal crop response, maximizing the efficiency of N application [14]. Consequently, the development of sustainable and efficient strategies is a priority for producers facing water shortages and nutrient deficiency [15]. As proximal and remote sensing methods enable rapid, non-destructive water and nutrient deficiency determination, they have been widely used in precision agriculture [16].
Hyperspectral remote sensing, which records the radiation in hundreds of narrow contiguous spectral channels reflected from any feature, is an accurate technique to regain valuable information for applications in precision agriculture [17]. Such information provides significant progress in understanding the subtle changes in the biochemical and biophysical attributes of the crop and their different physiological processes, which otherwise are indistinct in multispectral remote sensing [18]. Many studies have shown the high effectivity of narrow-band vegetation indices (VIs) to evaluate the crop biophysical parameters [19,20], especially if the spectral and canopy structure information are integrated [21]. However, little is known about which VI can distinguish between the stress of different origins such as water and N, when combined.
Narrow-band vegetation indices have been favorably included in studies aiming to estimate the crop nitrogen concentration [22,23,24,25], leaf chlorophyll content [26,27,28], light-use efficiency [29,30] as well as detect water stress [31,32,33] and diseases [34,35,36]. The narrow-band VIs use reflectance in red and infrared bands to collect the red-edge section of the spectrum. These indices provide information on numerous vegetation and environmental variations such as the leaf area index, leaf chlorophyll content, and background soil reflectance [37]. For instance, the normalized difference red-edge index (NDRE) is considered susceptible to chlorophyll content changes in the leaves, variability in leaf area, and soil background effects [38,39,40]; the red-edge normalized difference vegetation index (RENDVI) has been shown to be superior to the normalized difference vegetation index (NDVI) for the late-season nitrogen determination [41]; and the modified chlorophyll absorption ratio index (MCARI) has been recommended as a valuable index that may afford upgraded sensitivity to nitrogen availability and soil moisture over NDVI [42,43]. Additionally, concerning the water absorption properties, many reports have highlighted the great potential of water indices to estimate the crop water content and detect crop water stress [44,45,46,47].
Previous studies have shown that near-infrared and red-edge reflectance might lower the background influence and have excellent possibilities to predict the chlorophyll content, which helps to precisely determine the nitrogen quantity [48,49]. Numerous studies have been conducted to relate the vegetation indices to the crop physiological and biometric parameters and a large number of relationships between them have been found [50,51,52,53,54,55,56,57]. Some findings have confirmed that spectral reflectance could be suitable for monitoring the photosynthetic parameters of crops [58,59]. Additionally, Weber et al. (2012) [60] proved the high relevance of hyperspectral indices in predicting the maize grain yield. As maize has high water and nitrogen requirements, this crop needs proper water and nutrient management during all growth stages [3]. Nevertheless, the problem of saturation in predicting the crop biophysical parameters has been found for many spectral indices [61]. It is not clear whether the current water and nitrogen indices can indicate the high water and nitrogen requirements in maize.
In this study, the canopy spectral reflectance data from the field spectrometry and bio-physiological measurements were simultaneously collected. The overall objective was to assess the performance of various narrow-band vegetation indices and sensitivity to different irrigation and nitrogen levels and their interaction. The specific objective was to find the best correlation in determining which vegetation index is the most efficient predictor of the crop eco-physiological parameters. The findings of this study will provide essential information for the non-destructive, real-time monitoring and assessment of sweet maize water stress and nitrogen deficiency using hyperspectral VIs.

2. Materials and Methods

2.1. Study Area and Experimental Design

The study was carried out in the 2020 growing season in Valenzano, Bari (41°03′ N, 16°53′ E, 77 m above sea level), Southern Italy, at the Mediterranean Agronomic Institute (IAMB) experimental field.
The climate of the location is typical of the Mediterranean, with moderate winters and dry summers. The average yearly precipitation is around 550 mm (30 years average), with most precipitation falling during the autumn and winter months. The average monthly air temperature varies from 8 °C in January to 24 °C in July and August. The research area’s soil is silty-clay-loam [62].
The average values of the main physical and chemical soil properties are: sand 170 g kg−1, clay 234 g kg−1, silt 596 g kg−1, USDA Textural Class: silty-loam; pH (H2O 1:2.5) 8.1, electrical conductivity (1:2) 0.24 dS m−1, total carbonate 55 g kg−1, organic C 11.6 g kg−1, total N 0.9 g kg−1, C/N ratio 12.9, available P 17 mg kg−1, K exchangeable 465 mg kg−1 [4].
Sweet maize (Zea mays var. saccharata L.) was grown on 18 plots (sized 10 × 10 m) from June to September 2020, in rows-oriented north–south, 0.5 m apart and with a spacing between plants in the row of 0.2 m, with a plant density of 10 plants m−2.
Three irrigation regimes (WR) were used in combination with two N levels. The irrigation regimes included: (i) full irrigation (I100); (ii) deficit irrigation (I50), which applied half of the crops’ water needs; and (iii) rainfed treatment (I0). The amounts of nitrogen were: (i) 50 kg ha−1, which is a low level (LN) and (ii) 300 kg ha−1, which is a high level (HN). The rainfed treatment received only one watering after sowing. Treatments were allocated in a split-plot experimental design with three replicates, considering the irrigation regime (WR) as the main-plot factor and the N level (N) as the sub-plot factor.
Before sowing, the fertilizers were applied to the whole experimental area as follows: nitrogen (N) 50 kg ha−1 as urea (46% of N), phosphorus (P2O5)—100 kg ha−1 as superphosphate (20% P2O5), and potassium (K2O)—200 kg ha−1 as potassium sulfate (51% K2O). On 22 June, 250 kg ha−1 of additional nitrogen as urea was supplied to HN treatment. The weeding control was conducted by milling before sowing and manually during the first growth stage.
During the experiment, a standard set of daily meteorological data (air temperature, relative humidity, solar radiation, wind speed and precipitation) was obtained from the weather station located next to the experimental field (Figure 1). The average daily temperature (T_avg) ranged between 19 and 29 °C, while the reference evapotranspiration (ETo) was between 1- and 5.6-mm d−1. The total amount of precipitation was 56 mm, with the highest value of 23.6 mm recorded on 17 days after sowing (DAS). The crop evapotranspiration increased with the biomass growth until the flowering and initial maturity stages, and then it reduced approaching the harvesting (data not shown). Hence, the overall water deficit between crop evapotranspiration and precipitation increased during the growing season, which provoked strong water stress under rainfed cultivation.
Irrigation was performed by the surface drip method system using a drip line for each row and drippers (2.2 L h−1) 0.50 m spaced apart. Crop water balance and irrigation scheduling were managed using an Excel-based model [63] that estimates day-by-day crop evapotranspiration and irrigation water requirements through the standard procedure proposed by Allen et al. (1998) [64]. Irrigation amounts of 291.2 mm were supplied in 12 waterings in the I100 treatment, while half of these amounts were applied in the I50 treatment.

2.2. Measurements

All of the physiological measurements listed below were simultaneously taken five times from mid-July to the end of August.

2.2.1. Leaf Gas Exchange

A portable open system photosynthesis system (Li-6400XT, LiCor, Lincoln, NE, USA) was used to measure the net photosynthetic CO2 assimilation, (An, μmol m−2 s−1) and stomatal conductance to water vapor (gs, mol m−2 s−1) over a clipped leaf surface of 6.0 cm2 on the intact, healthy green, and well-exposed up-leaves at solar noon (between 10:30 and 12:30 solar time). A saturating photosynthetic photon flux density (PPFD) of 2000 μmol m−2 s−1 was used as the light source. To keep the CO2 content in the leaf chamber at 400 μmol mol−1, an external bottled CO2 source was employed. The von Caemmerer and Farquhar (1981) [65] model was used to determine the different gas-exchange parameters (e.g., leaf transpiration (Tr, mmol m−2 s−1)) in the instrument software. The measurement was repeated three times per plot.

2.2.2. Leaf Chlorophyll Content

An optical meter (SPAD-502, Konica Minolta, Osaka, Japan) was used to measure the leaf chlorophyll content index (CC, r.u.) on 15 leaves per plot.

2.2.3. Relative Water Content

The relative water content (RWC) was measured in up-leaves blades similar to those used for the gas exchange measurements. At midday, nine leaf segments were gathered from three plants in each plot. Leaf-blade segments were weighed to obtain the fresh weight (FW, g), kept in distilled water overnight at 4 °C to obtain the saturated weight (SW, g), and then weighed again. Afterward, they were dried at 80 °C for 48 h and the dry weight (DW, g) was measured. Finally, the RWC was calculated as follows:
RWC = FW DW SW DW × 100

2.2.4. Crop Reflectance

The crop reflectance was measured using a FieldSpec Handheld 2 spectroradiometer (Analytical Spectral Devices, Inc., Boulder, CO, USA). This spectroradiometer is designed to collect spectra with a resolution of <3 nm at 700 nm, accuracy of 1 nm, and a wavelength range of 325–1075 nm.
The field of view (FOV) of the bare fiber-optic probe was 25°. The spectrum of a white (BaSO4) reference panel with known reflectance properties was acquired to derive the reflectance of the target. Ten spectra readings were averaged to obtain a single reflectance measurement. The measurements were acquired on three plants for each plot, at midday, under clear sky conditions. The crop spectrum was taken from a distance of 10 cm of height, with a spot size of about 14 cm2, and as the canopy cover grew and expanded, the distance from the vegetation increased to 60 cm.
The VIs were computed for each plot to analyze the relationships with the physiological crop parameters and evaluate their performance in distinguishing the water and nitrogen levels. These VIs were chosen on the basis of their sensitivity to (i) canopy structure; (ii) chlorophyll and other photosynthetic pigments; (iii) crop nitrogen status; and (iv) water status. However, in our study, the criteria for index selection were conducted on the previously successful use of them in numerous studies, as presented in Table 1.

2.2.5. Canopy Temperature

The canopy temperature (Tc) was measured by a thermal imaging camera (FLIR B335, Wilsonville, OR, USA) with a 640 by 480-pixel resolution and 2% accuracy reading, the emissivity of 0.95, and the distance to the focal plane of 0.4 m. Thermal images were collected on three plants for each plot, between 11:00 and 13:00 (solar time) at 0.10 m from the crop, focusing as much as possible on the plant without soil disturbance in the background. Images were elaborated using FLIR Tools software for leaf temperature extraction. Canopy temperature was determined as the average temperature for each image.

2.2.6. Leaf Area Index and Dry-Above Ground Biomass

The leaf area index (LAI) was measured by using an optical leaf area meter (Li-COR, 3100, Lincoln NE, USA) on three plants for each plot. Dry-above ground biomass (DAGB) was measured on the same plants used for the LAI measurements. Samples were weighed after placing them in an oven at 70 °C for 48 h.

2.2.7. Fresh Grain Yield and Irrigation Yield Water Use Efficiency

The harvesting was conducted on 3 September 2020, when the grain reached about 30% in dry matter, sampling 2 m2 in the middle of each plot.
The irrigation yield water use efficiency (IWUEY) was calculated as the ratio of marketable yield and seasonal irrigation volume.

2.3. Statistical Analysis

The variables under study (vegetation indices VIs) were evaluated for normal distribution according to the Shapiro–Wilk W test and for homogeneity of variance using Bartlett’s test. Multiple data taken over time on different plots were analyzed using a repeated-measures ANOVA approach to identify the effect of between-subject and within-subject factors on the measured variables. The general linear model (GLM) procedure was used. The vegetation indices (Table 1) were considered as dependent variables and the fixed factors (water treatment, nitrogen treatment and time) as categorical independent variables. The sphericity within all possible pairs was evaluated using Mauchly’s test. The Greenhouse–Geisser adjustment was used to test the within-subject effects if Mauchly’s test revealed that the assumption of sphericity was untenable since it was the case for a few variables.
The Student–Newman–Keuls (SNK) post hoc (α = 0.05) test was used to make pairwise comparisons among the sample means group when significant differences were observed with ANOVA.
Moreover, simple linear regression analysis was applied to assess the relationship between the crop physiological and biometric data and vegetation indices, while the coefficient of determination (R2) evaluated the strength of the relationships. All statistical analyses were performed using the R programming language [72].

3. Results

3.1. Crop Water Status, Yield, and Irrigation Yield Water Use Efficiency

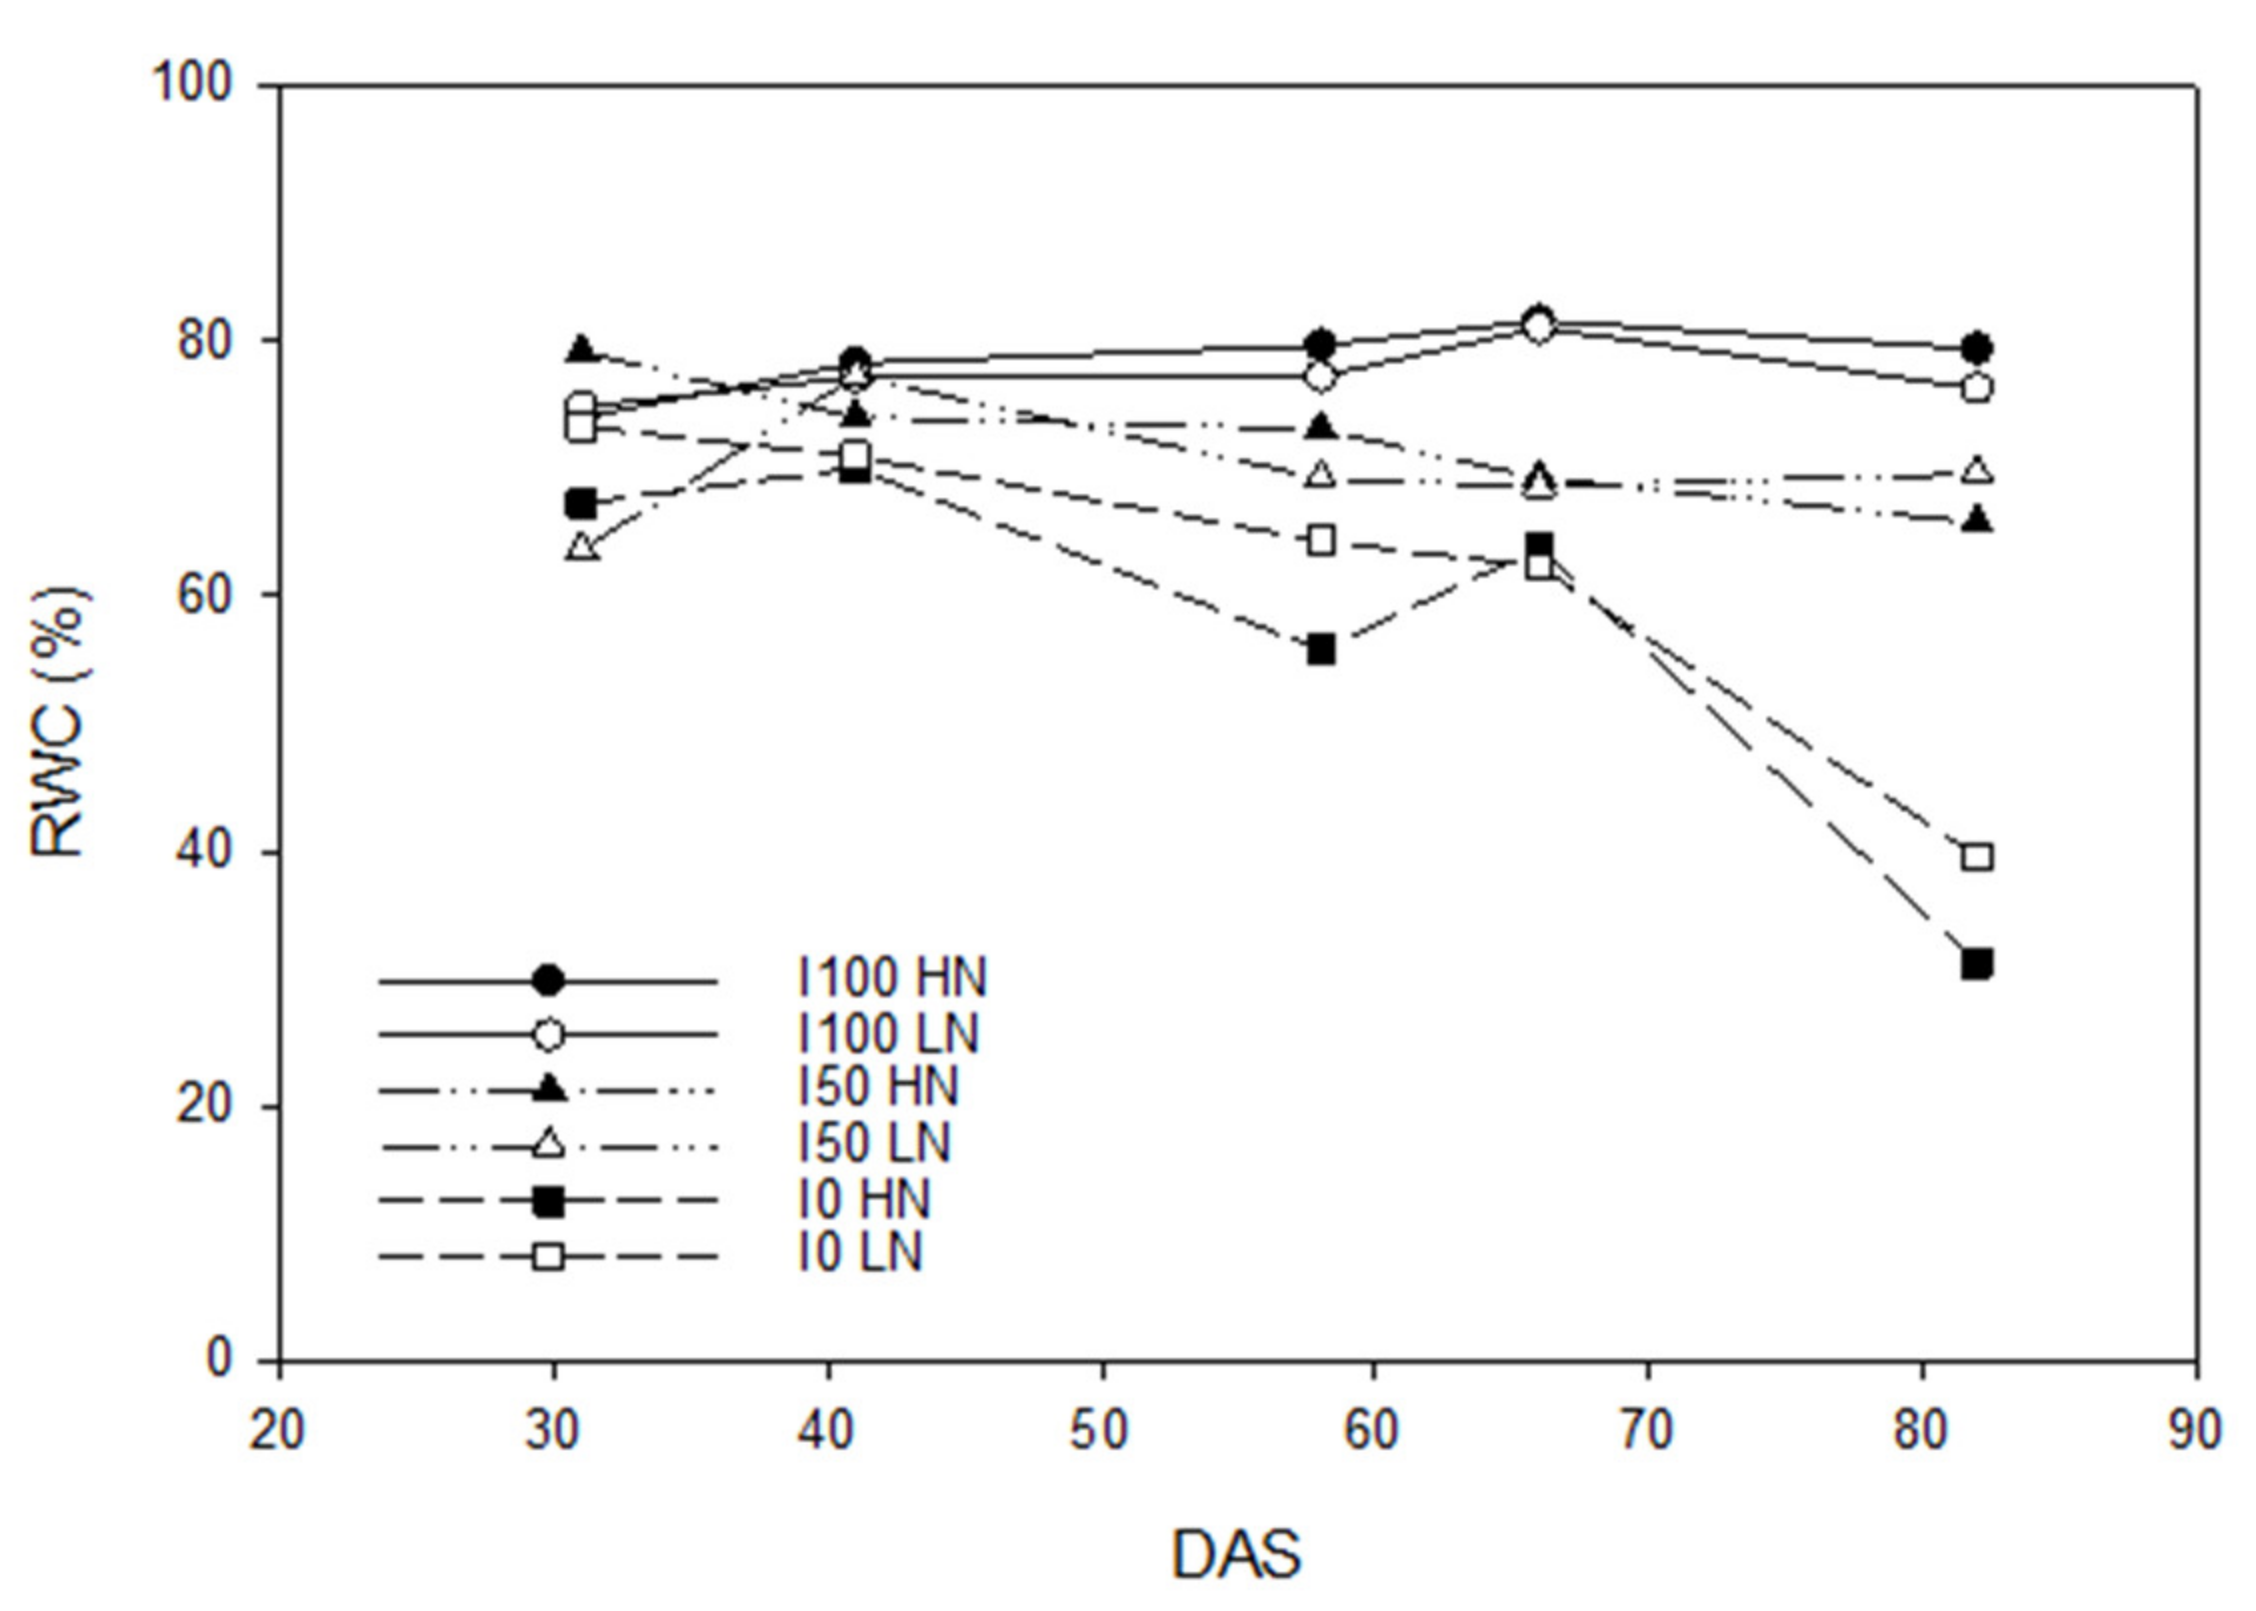
In the beginning, all treatments had similar values, ranging from 64 to 73% (Figure 2). However, after flowering, sweet maize under rainfed conditions experienced severe drought stress, which caused a remarkable reduction in the RWC. The peak RWC value of 82% was reached on 66 DAS in I100 HN.
Plots under full irrigation treatment and high level of nitrogen (I100 HN) showed the greatest fresh yield (18.09 t ha−1), while the yield of the same irrigation treatment (I100) with a low nitrogen level (LN) was reduced by 26%. The water deficit treatments provided a yield of 9.74 and 7.56 t ha−1 under high and low nitrogen supply, respectively; these values were lower compared to the corresponding fully irrigated treatments. The yield reduction under deficit irrigation conditions was due to the decrement in the mean grain weight, the lessening in the number of ears, the weight of the ears, and grains per row (data not shown). Moreover, crops under rainfed conditions were strongly affected by the absence of water (irrigation or precipitation), particularly at the flowering stage; such severe water stress did not allow for the formation of grains. Irrigation yield water use efficiency (IWUEY) summarized these results: the greatest values were recorded for I50 HN (6.7 kg m−3) and for I100 HN (6.2 kg m−3), while under the corresponding treatments without N, reductions of 22 and 26% were observed. The lowest value of IWUEY was detected in I100 LN.

3.2. Crop Reflectance and Vegetation Indices

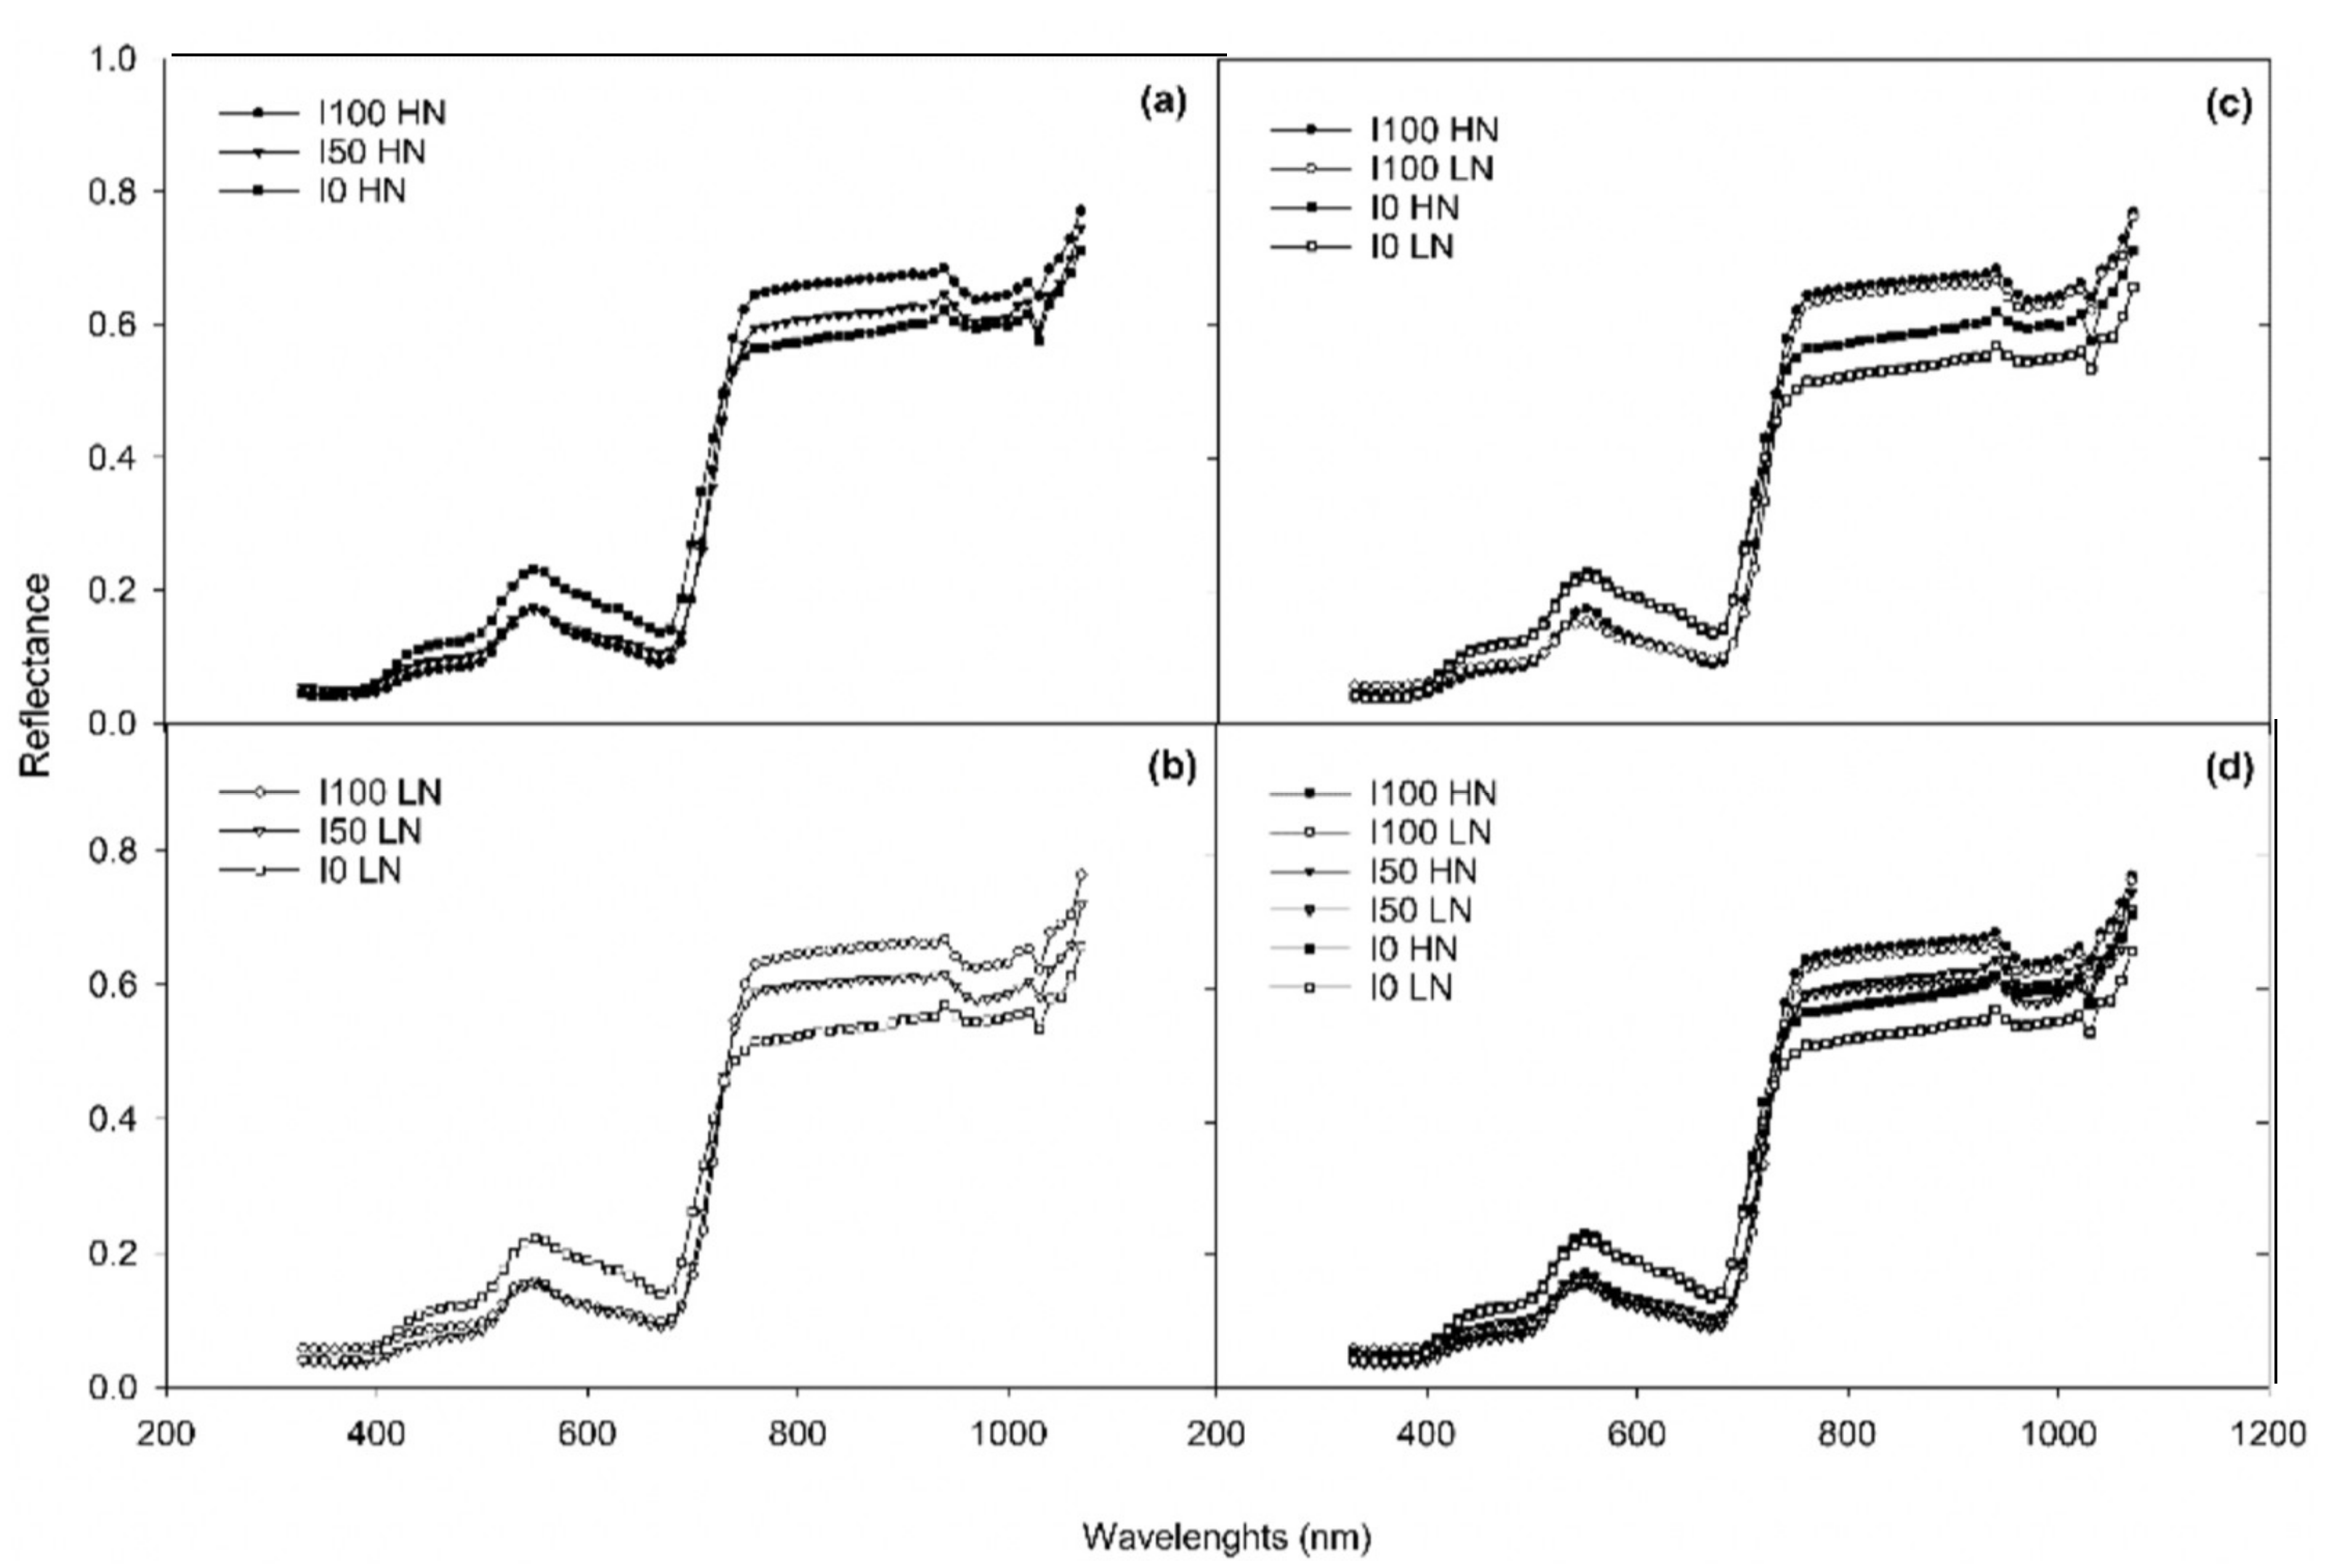
A noteworthy difference in reflectance was observed between treatments experiencing stress and those well-watered. The crop spectral reflectance increased more rapidly in the infrared region and the slope of the red-edge became steeper, especially in the treatments under full irrigation and high nitrogen level, where a shift to longer wavelengths and an increase in the amplitude of the red-edge peak (Figure 3) were observed. The values of spectral reflectance for non-stressed plants were higher in the range from 710 nm to 950 nm compared to the plants under stress.
ANOVA allowed us to compare the sensitivity of the vegetation indices to different treatments and their interactions (Table 2).
All indices, except for MCARI and CIgreen, were significantly affected by irrigation and the effect varied over time (interaction irrigation × DAS).
The nitrogen levels significantly affected the red-edge based indices (REIP, NDRE, MCARI, CIred-edge, DD, DATT, MTCI, together with CI), whereas the structural (NNDVI, CIgreen) and water band indices (WBI, WBI/NDVI) did not vary significantly. The highest discriminating capability was shown by NDRE, CIred-edge, DATT, and MTCI.
Among all of the indices tested (Table 3), the NNDVI and WBI/NDVI indices had the best ability to differentiate the interaction of irrigation x nitrogen, showing a greater discriminating capability under low nitrogen. CIred-edge was the only index affected by the interaction between irrigation, nitrogen, and DAS.
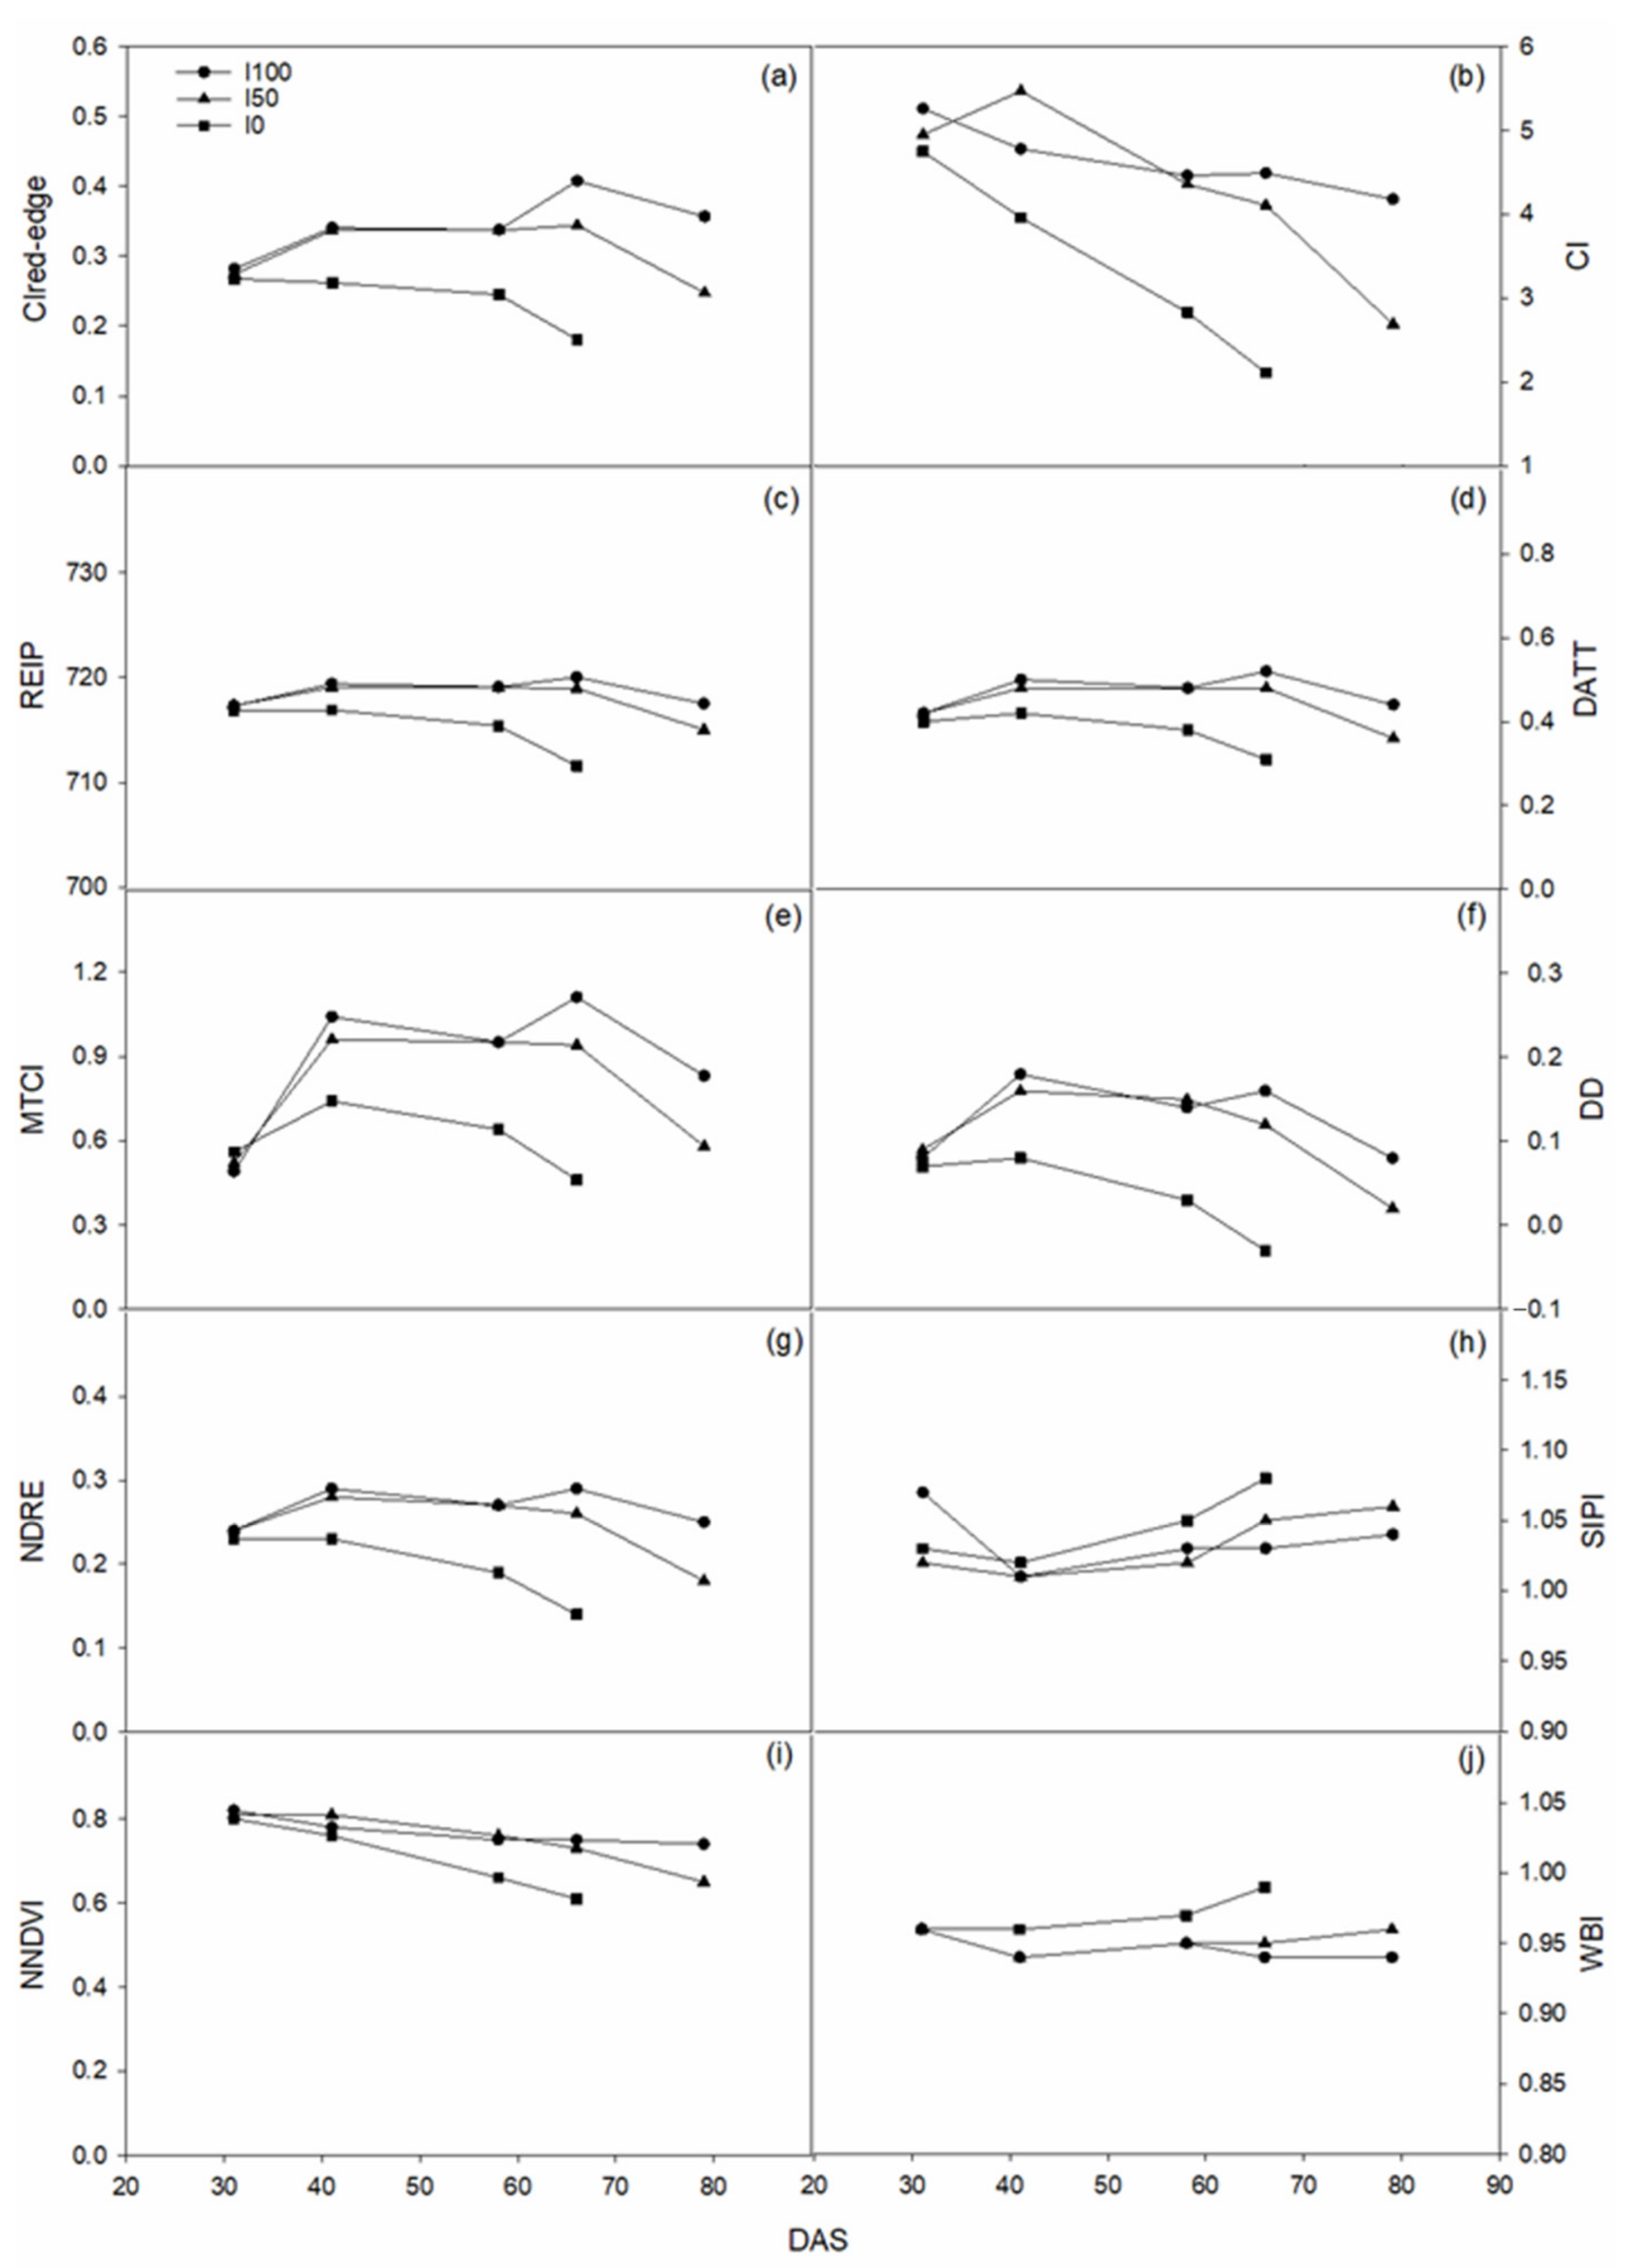
Figure 4 shows the trend in the vegetation indices during the growing season as a function of the irrigation regime (interaction irrigation × DAS). Red-edge indices (Figure 4a,c–g) showed a similar behavior: since V12–V14, the values of I0 treatment started to gradually decrease, while those of the two irrigated treatments started to differentiate after the tasseling stage with a more evident decrease for I50 compared to I100. This behavior was more marked at 66 DAS for both CIred-edge (Figure 4a) and MTCI (Figure 4e). The CI index (Figure 4b) decreased for I0 during the crop cycle with significant differences at 58 DAS, while lower values were observed only at 79 DAS for I50; I100 treatment maintained almost constant values along the growing cycle. The trend of the NDVI index (Figure 4i) was smoothed for both irrigated treatments, while the values of the rainfed treatments significantly decreased from 0.80 to 0.61. The SIPI index (Figure 4h) displayed similar values for all irrigation treatments throughout the growing season. The WBI index (Figure 4j) showed a similar, but specular trend to the red-edge indices, in particular, to REIP and DATT (Figure 4c,d), with values slightly increasing under water stress progressing and during the growing season.

3.3. Correlation between Variables

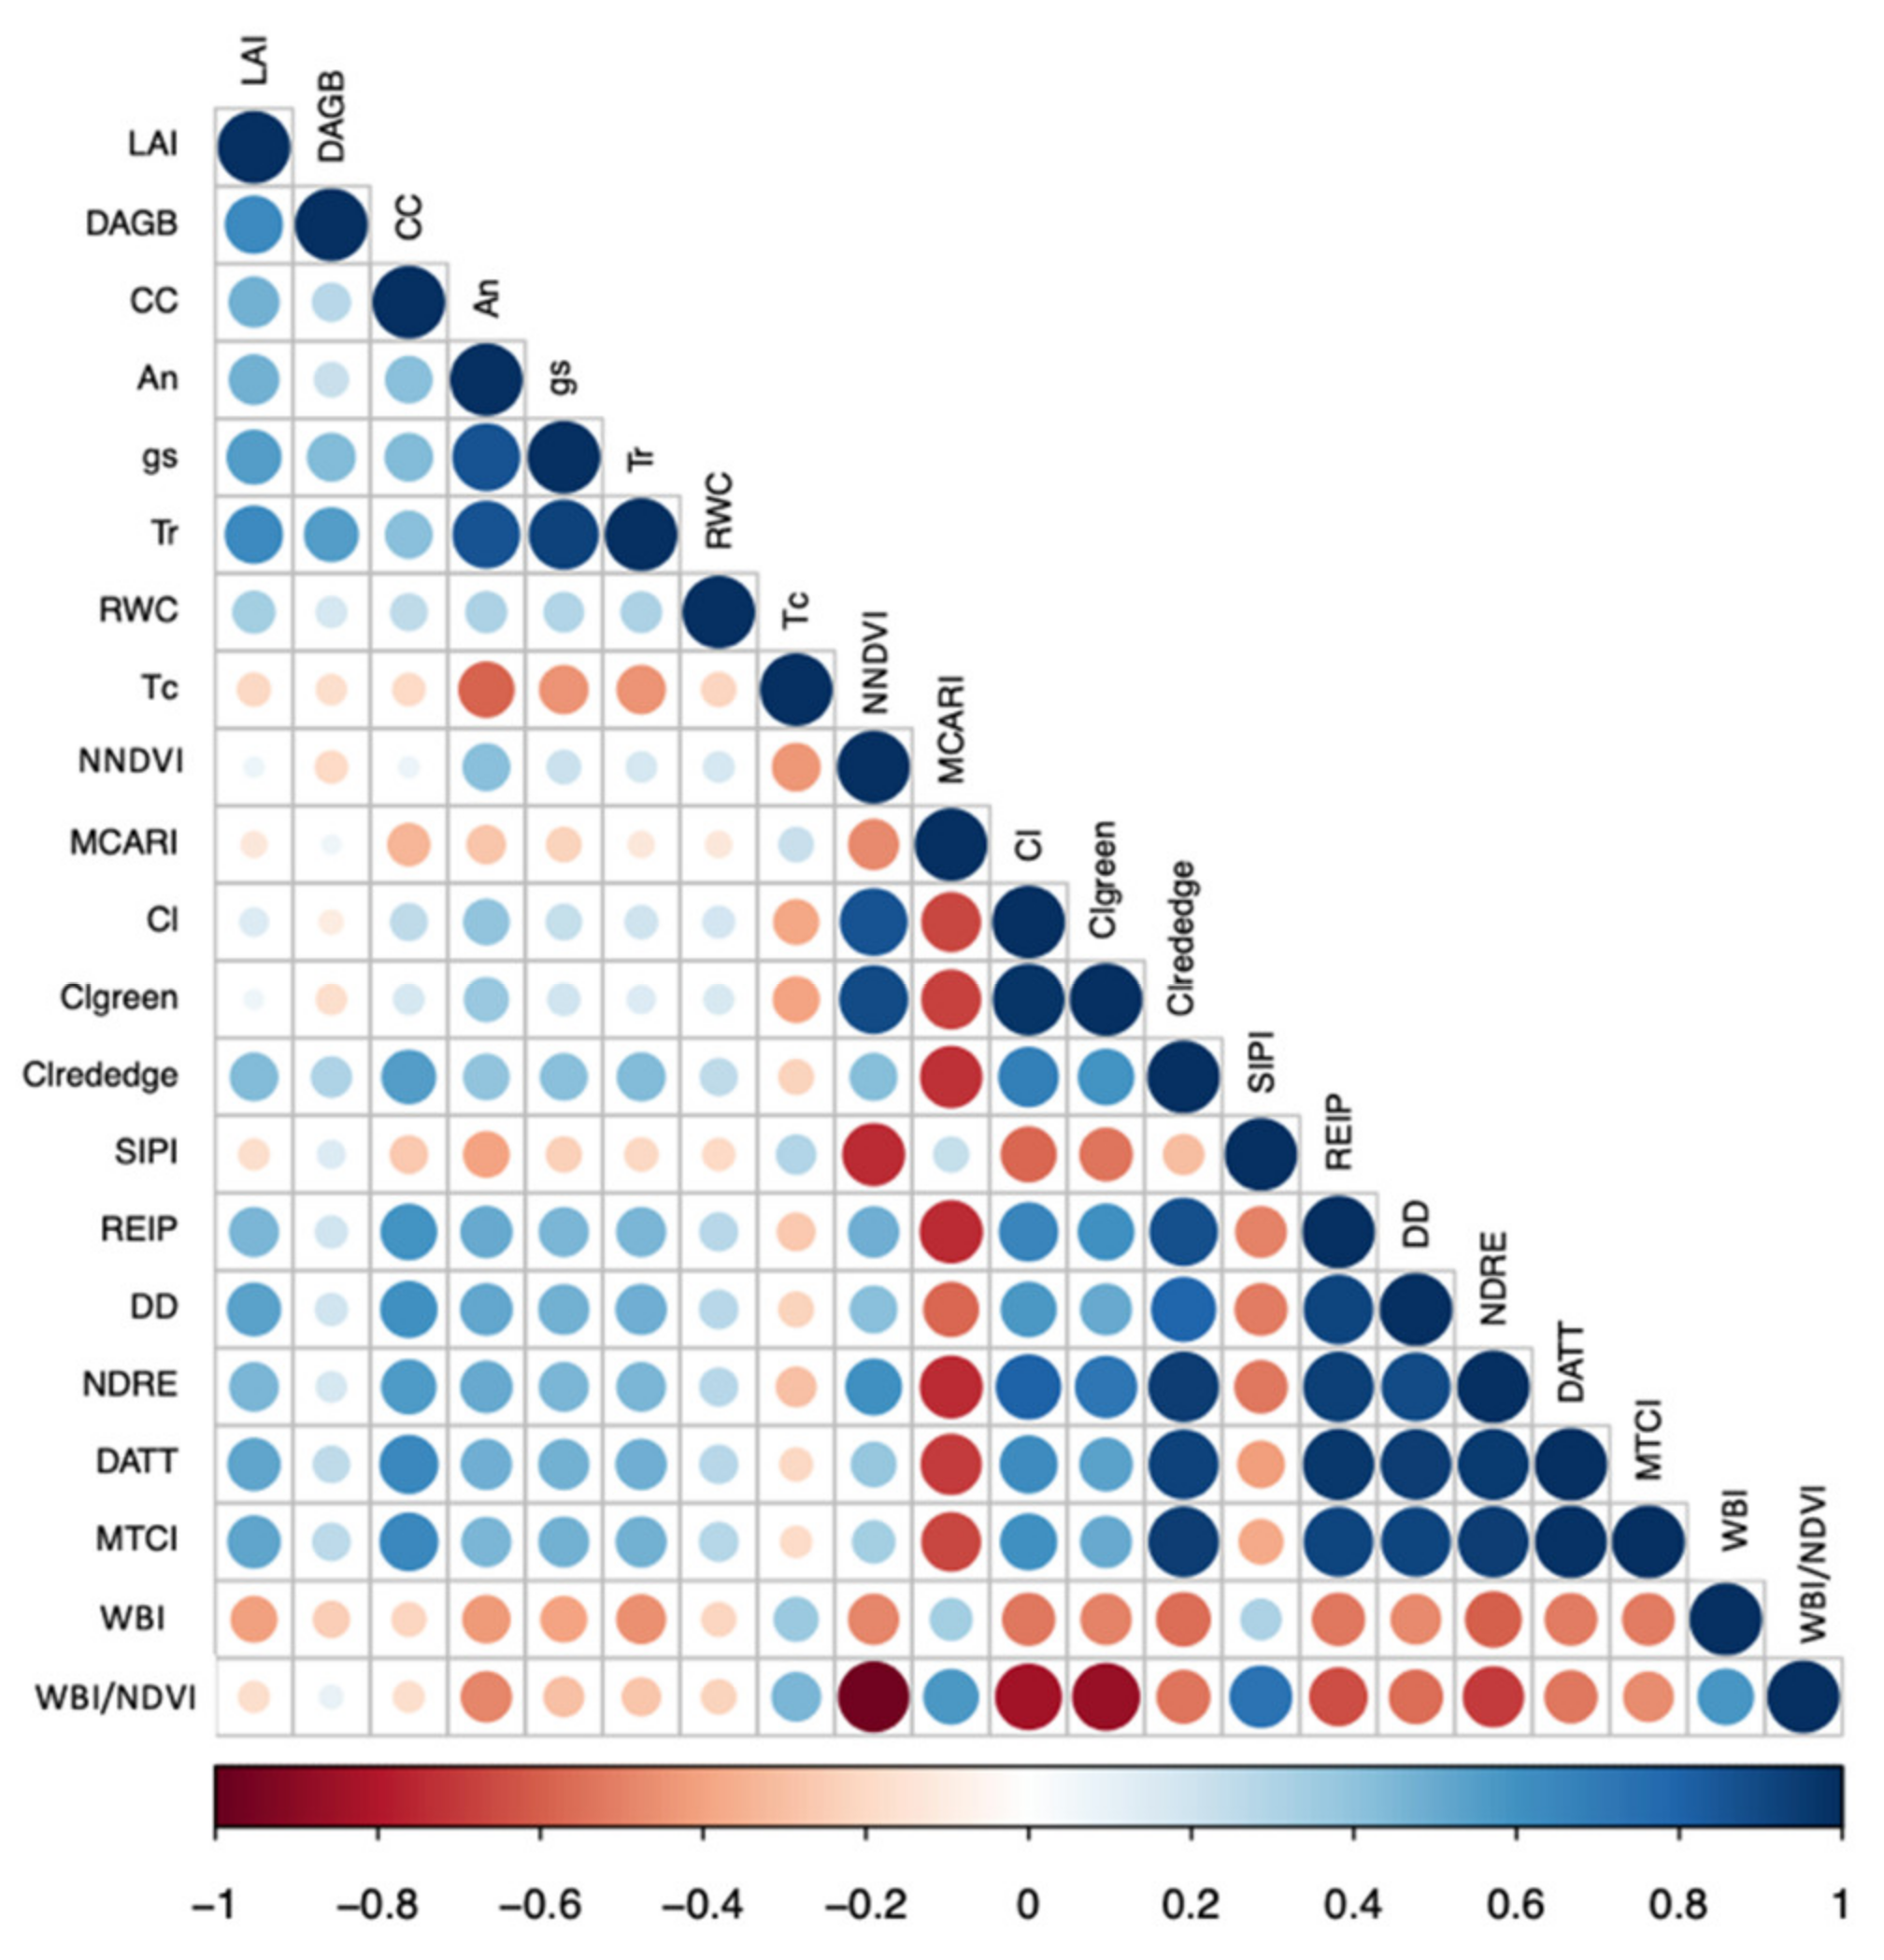
Correlations among VIs (Table 1) and both biometric and physiological parameters were checked using a Pearson correlation matrix (Figure 5). Among all of the analyzed indices, MTCI, DATT, and DD showed the strongest positive correlation with the chlorophyll content (CC). Similarly, LAI, as well as the gas-exchange parameters, showed the highest correlation with indices such as REIP, DD, NDRE, DATT, and MTCI. The WBI and WBI/NDVI displayed a negative correlation with all of the analyzed parameters, except for canopy temperature (Tc). However, canopy temperature had a moderately negative correlation with CIgreen.
The simple linear regression model was applied to link the measured eco-physiological variables and VIs. Among the parameters, the greatest coefficient of determination was found between the DATT index and chlorophyll content (R2 = 0.51) as well as between the DD index and net assimilation rate (R2 = 0.4) (Figure 6a,b).

4. Discussion

4.1. Differentiation between Drought and Nitrogen Deficiency

The experiment was carried out to evaluate the performance of the narrow-band vegetation indices to different water and nitrogen regimes and their interactions. The NNDVI and WBI/NDVI indices were highly affected by the interaction of water and nitrogen, showing the highest capability to distinguish low nitrogen treatment. On the other hand, in the interaction of irrigation and DAS, all indices were significantly affected, except for MCARI and CIgreen. The red-edge-based indices (REIP, NDRE, MCARI, CIred-edge, DD, DATT, MTCI, combined with CI) were significantly impacted by the nitrogen levels, while the structural (NNDVI, CIgreen) and water band indices (WBI, WBI/NDVI) were not. Even though in our study the NNDVI separated the low nitrogen treatments, Shiratsuchi et al. (2011) [69] showed a larger variation of this index due to the water supply and low ability to distinguish nitrogen treatments. It was previously confirmed that NNDVI performed better over many structural and narrow-band indices in detecting crop water stress [73] and monitoring crop health [74]. However, due to the relatively lower sensitivity to biomass and greater sensitivity to the crop chlorophyll content, Raper and Varco (2015) [75] suggested that the red-edge-based indices be used as a more appropriate tool to determine the crop deficiency or demand for nitrogen fertilizer. Nitrogen deficiency causes red-edge reflectance and the peak of the first derivative of reflectance in the red-edge to shift toward shorter wavelengths.
Furthermore, spectral reflectance is less impacted by chlorophyll absorption characteristics beyond 730 nm in the NIR, and would only vary if the leaf morphology or water content changed in response to the stress [76]. The effect of water absorption is better detected near 970 nm if the stress is well-developed and in short-wave-infrared (1400–2500 nm) wavelengths [77]. Water indices (WBI and WBI/NDVI) were found to be the most sensitive for distinguishing the water stress levels in crops [78]. In comparison with WBI, the WBI/NDVI ratio has a stronger relationship with the crop water status because the NDVI is affected by structural and color changes (loss of pigments) in the irrigated plants, and is therefore indirectly related to the crop water content [79].
Many studies have reported the trends of VIs under different water levels. For example, Ma et al. (2022) found a correlation between the crop water status parameters and the CIred-edge and REIP indices, highlighting that the red-edge position has a high potential value for studying the canopy indices of drip irrigated cotton [80]. Likewise, Zhang and Zhou (2019) demonstrated that the NNDVI, CIgreen, and CIred-edge, out of the 10 tested VIs, were the most sensitive to changes in water conditions between water treatments in a study on summer maize [2]. Moreover, similar to our study, in the early stages, these VIs started to distinguish between the water and rainfed treatments, while the impacts of various water treatments on VIs were strongest during the peak of the growing season. In the case of our study, as observed in Figure 4, the difference between the irrigated treatments (I100 and I0) was chiefly noticed for the MTCI and CIred-edge indices. Nevertheless, according to Shiratsuchi et al. (2011), the DATT and MTCI indices were the least affected by the irrigation levels, while the CI and CIred-edge indices were highly influenced, particularly at the V11 and R4 stages [69]. In the present study, different water levels did not affect the SIPI (Figure 4), however, some studies showed a strong effect of water stress on the reduction in this index [81,82].

4.2. Leaf Chlorophyll and Reflectance

Many structural indices use only two spectral bands in their formulation, the red and near-infrared regions, where light is scattered by leaf mesophyll, whereas chlorophyll indices use wavelengths in the red-edge region due to the linkage with chlorophyll content, allowing for the vegetation status to be monitored throughout the growing season. The red-edge identifies the steep transition between the reflectance absorption characteristic in red wavelengths and high NIR reflectance, with the red-edge position being defined as the point of maximum slope (inflection point). During the growth season, when there is a relatively large concentration of chlorophyll in the leaves, the red-edge spectrum is particularly sensitive to medium and high chlorophyll levels and it is considered as an excellent indicator of crop health [83]. Similarly, it was recently verified that the electromagnetic spectrum’s red-edge area appeared to be the most responsive to the chlorophyll concentration [84]. This explains the positive correlation seen in our study between VIs, which were calculated using red-edge wavelengths (particularly CIred-edge, REIP, DD, NDRE, DATT, MTCI), and the leaf–gas exchange parameters. The peak at 705 nm is generally evident in leaves with low chlorophyll content, whereas the peak at 725 nm dominated in leaves with greater chlorophyll levels, as reported in Lamb et al. (2002) [85]; a similar trend was observed in our study for the REIP index.
These indicators aid researchers in a better understanding of the biophysical and biochemical processes of crop leaves as well as in the crop yield prediction [86]. Nitrogen deficit affects the leaf chlorophyll concentration, as is widely recognized [87,88]. In our study, before flowering, all treatments had close values of leaf chlorophyll content, but after the full developing stage, a separation occurred. As expected, the spectral reflectance values, starting from the NIR wavelengths, were greater in treatments of higher N levels.
In terms of VIs, DATT has already demonstrated the capacity to estimate the chlorophyll concentration with reasonable accuracy, as also observed in our work (Figure 6a). Similarly, the DD was shown to be indicative of the gas exchange parameters (Figure 6b) and by assessing the leaf chlorophyll concentration [70,89].
However, the MCARI index, which has been considered as one of the most sensitive indices for chlorophyll variability, showed a slightly negative correlation with the physiological variables. A similar outcome was reported in the study of Zhang et al. (2019) [90], where a negative correlation between the MCARI index and leaf chlorophyll content was found. Furthermore, the SIPI and CI indices were unable to accurately reflect the crop status, with minimal correlation with other variables. A lack of sensitivity of these indices to nutrient variation has been already described by [91,92].

4.3. Leaf Water and Reflectance

As expected, the water regime had a significant impact on RWC, which decreased gradually at the beginning and then rapidly as the drought progressed. The RWC increased following irrigation events in both the full and deficit irrigation treatments, with full irrigation showing greater values (Figure 3).
All of the calculated VIs showed a slightly negative or positive correlation with plant water content (expressed as RWC). Even though water loss from plant tissue is a result of drought altering vegetation reflectance, in our study, a slightly negative correlation between water indices and RWC was found. However, it is currently being debated whether changes in plant reflectance can capture a minor decline in canopy water content during the early occurrence of water stress [93]. Fernandes et al. (2020) [94] found a negative relationship between the RWC and water indices. Furthermore, some studies have demonstrated that variations in leaf reflectance during dryness are difficult to predict, as an increase in [95], a decrease in [96], and non-significant [97] changes were observed.
The hypothesis behind water indices (WIs) is that NIR wavelengths (970 nm) penetrate deeper into the canopy and may thus accurately evaluate the water content [74]. Consequently, water indices have the potential to detect early water stress in the absence of other types of stress. Water absorption bands occur in the NIR range, beyond the photosynthetically active radiation (PAR); it reduces the overlap with other abiotic stresses [98]. In contrast to 900 nm, the degree of absorption at 970 nm increased as the water content of the plant canopies increased [99]. Therefore, when plants are water-stressed, the 970 nm trough of the reflectance spectrum tends to disappear and shift toward lower wavelengths. The reflectance at 900 nm is utilized as a reference because it is affected by changes in the canopy structure as the measurement at 970 nm [100], although water has no absorption at this wavelength. Nevertheless, some studies [101,102] have shown that some water-sensitive vegetation indices only give information about the water conditions, but not on the plant growth status. In the study of Zhang and Zhou (2019) [2] on summer maize, the chlorophyll indices had a higher sensitivity to crop growth indicators (such as the canopy water content and leaf equivalent water thickness) than any of the water-sensitive indices tested.
In addition, in our study, the water indices were positively correlated to the vegetation temperature (Tc), which specifies the importance of the vegetation temperature for water stress detection. Since canopy temperature is an indicator of crop energy balance, a canopy under water stress appears to have a greater temperature than a well-watered one under the same environmental conditions. Moreover, previous research [88,103] has demonstrated the positive correlation between canopy temperature and water indices (particularly WBI and WBI/NDVI).

5. Conclusions

The sweet maize response was affected by both the nitrogen and water supply. The effects of water stress were particularly evident at the flowering stage, not allowing for grain formation in the rainfed treatments. Both the water and nitrogen deficiencies reflected on the irrigation water use efficiency, which demonstrated the highest performance under deficit irrigation and nitrogen fertilization.
The analysis of the whole spectrum and the calculation of the vegetation indices demonstrated the importance of the red-edge vegetation indices in assessing the status of sweet maize. Thus, it is shown that remotely sensed reflectance indices are promising predictive tools for the impact of drought and nutritional deficiency on the photosynthetic activity and water status. The findings of this study confirmed that, among all of the studied indices, NNDVI and WBI/NDVI were the only two indices affected by the interaction of water and nitrogen. Moreover, the red-edge indices had a high sensitivity to nitrogen levels, in particular, NDRE, CIred-edge, DATT, and MTCI showed a great discrimination capability. Therefore, the detection of crop stress may become simpler by the appropriate selection of VIs. Since several indices did not show high sensitivity to the studied crop parameters, it is important to bear in mind that the link between the canopy-level spectral signal and the target property might be influenced by canopy structure factors including the plant size, age, and leaf angle. Moreover, it must be considered that under field conditions, water or/and nutrient deficits may be accompanied by changes in any other leaf and canopy properties that would affect the reflectance characteristics. Thus, in future steps, more complex experiments and comparative studies should be conducted to fully understand and differentiate the effects of stresses on the crop parameters. Multivariate techniques, such as partial least squares regression, and machine learning methods (random forest, multiple adaptive regression splines) may overcome certain limitations in assessing the vegetation parameters under different stresses, which should be investigated in future works.

Author Contributions

Conceptualization, M.C., K.Y., M.T., R.A. and A.M.S.; Methodology, M.C., K.Y., R.A. and A.M.S.; Formal analysis and data curation, M.C., K.Y., R.A. and A.M.S.; Investigation, M.C., V.C. and M.H.; Writing—original draft preparation, M.C., K.Y., R.A. and A.M.S.; Writing—review and editing, M.C., K.Y., M.T., V.C., R.A. and A.M.S.; Funding acquisition, M.T. All authors have read and agreed to the published version of the manuscript.

Funding

The research was supported by the Master of Science Program in Water and Land Resources Management of CIHEAM Bari (Italy). This work has been supported in part by the TUM-HEF Seed Fund 2021.

Data Availability Statement

Not applicable.

Acknowledgments

The authors thank Carlo Ranieri (CIHEAM Bari) for technical support during the data collection and Mimmo Tribuzio (CIHEAM Bari) for agronomic assistance in the field.

Conflicts of Interest

The authors declare no conflict of interest.

References

  1. Osakabe, Y.; Osakabe, K.; Shinozaki, K.; Tran, L.-S. Response of plants to water stress. Front. Plant Sci. 2014, 5, 86. [Google Scholar] [CrossRef] [PubMed]
  2. Zhang, F.; Zhou, G. Estimation of vegetation water content using hyperspectral vegetation indices: A comparison of crop water indicators in response to water stress treatments for summer maize. BMC Ecol. 2019, 19, 18. [Google Scholar] [CrossRef]
  3. Yuan, L.; Cui, S.; Zhang, Z.; Zhuang, K.; Wang, Z.; Zhang, Q. Determining effects of water and nitrogen input on maize (Zea mays) yield, water- and nitrogen-use efficiency: A global synthesis. Sci. Rep. 2020, 10, 9699. [Google Scholar]
  4. Piscitelli, L.; Colovic, M.; Aly, A.; Hamze, M.; Todorovic, M.; Cantore, V.; Albrizio, R. Adaptive Agricultural Strategies for Facing Water Deficit in Sweet Maize Production: A Case Study of a Semi-Arid Mediterranean Region. Water 2021, 13, 3285. [Google Scholar] [CrossRef]
  5. Moriondo, M.; Giannakopoulos, C.; Bindi, M. Climate change impact assessment: The role of climate extremes in crop yield simulation. Clim. Chang. 2011, 104, 679–701. [Google Scholar] [CrossRef]
  6. Holzman, M.E.; Carmona, F.; Rivas, R.; Niclòs, R. Early assessment of crop yield from remotely sensed water stress and solar radiation data. ISPRS J. Photogramm. Remote Sens. 2018, 145, 297–308. [Google Scholar] [CrossRef]
  7. Mladenova, I.E.; Bolten, J.D.; Crow, W.T.; Anderson, M.C.; Hain, C.R.; Johnson, D.M.; Mueller, R. Intercomparison of soil moisture, evaporative stress, and vegetation indices for estimating corn and soybean yields over the US. IEEE J. Sel. Top. Appl. Earth Obs. Remote Sens. 2017, 10, 1328–1343. [Google Scholar] [CrossRef]
  8. Massignam, A.; Chapman, S.; Hammer, G.; Fukai, S. Physiological determinants of maize and sunflower grain yield as affected by nitrogen supply. Field Crop Res. 2009, 113, 256–267. [Google Scholar] [CrossRef]
  9. Leghari, S.J.; Wahocho, N.; Laghari, G.; Laghari, A.; Bhabhan, G.; HussainTalpur, K.; Ahmed, T.; Wahocho, S.; Lashari, A. Role of Nitrogen for Plant Growth and Development: A review. Adv. Environ. Biol. 2016, 10, 209–218. [Google Scholar]
  10. Maheswari, M.; Murthy, A.N.G.; Shanker, A.K. 12-Nitrogen Nutrition in Crops and Its Importance in Crop Quality. In The Indian Nitrogen Assessment; Abrol, Y.P., Adhya, T.K., Aneja, V.P., Raghuram, N., Pathak, H., Kulshrestha, U., Sharma, C., Singh, B., Eds.; Elsevier: Amsterdam, The Netherlands, 2017; pp. 175–186. ISBN 978-0-12-811836-8. [Google Scholar]
  11. Ranjan, R.; Chopra, U.K.; Sahoo, R.N.; Singh, A.K.; Pradhan, S. Assessment of plant nitrogen stress in wheat (Triticum aestivum L.) through hyperspectral indices. Int. J. Remote Sens. 2012, 33, 6342–6360. [Google Scholar] [CrossRef]
  12. Cossani, C.M.; Sadras, V.O. Water–nitrogen colimitation in grain crops. Adv. Agron. 2018, 150, 231–274. [Google Scholar]
  13. Sadras, V.O.; Hayman, P.T.; Rodriguez, D.; Monjardino, M.; Bielich, M.; Unkovich, M.; Mudge, B.; Wang, E. Interactions between water and nitrogen in Australian cropping systems: Physiological, agronomic, economic, breeding and modelling perspectives. Crop Pasture Sci. 2016, 67, 1019–1053. [Google Scholar] [CrossRef]
  14. Tilling, A.K.; O’Leary, G.J.; Ferwerda, J.G.; Jones, S.D.; Fitzgerald, G.J.; Rodriguez, D.; Belford, R. Remote sensing of nitrogen and water stress in wheat. Field Crop Res. 2007, 104, 77–85. [Google Scholar] [CrossRef]
  15. Bell, J.; Schwartz, R.; Mcinnes, K.; Howell, T.; Morgan, C. Deficit irrigation effects on yield and yield components of grain sorghum. Agric. Water Manag. 2018, 203, 289–296. [Google Scholar] [CrossRef]
  16. Pinter, P.J., Jr.; Hatfield, J.L.; Schepers, J.S.; Barnes, E.M.; Moran, M.S.; Daughtry, C.S.T.; Upchurch, D.R. Remote sensing for crop management. Photogramm. Eng. Remote Sens. 2003, 69, 647–664. [Google Scholar] [CrossRef]
  17. Singh, P.; Pandey, P.; Petropoulos, G.; Pavlides, A.; Srivastava, P.; Koutsias, N.; Deng, K.; Bao, Y. Hyperspectral remote sensing in precision agriculture: Present status, challenges, and future trends. In Hyperspectral Remote Sensing: Theory and Applications; Pandey, P.C., Srivastava, P.K., Balzter, H., Bhattacharya, B., Petropoulos, G., Eds.; Elsevier: Amsterdam, The Netherlands, 2020. [Google Scholar]
  18. Sahoo, R.; Ray, S.; Manjunath, R. Hyperspectral remote sensing of agriculture. Curr. Sci. 2015, 108, 848–859. [Google Scholar]
  19. Monteiro, P.F.C.; Angulo Filho, R.; Xavier, A.C.; Monteiro, R.O.C. Assessing biophysical variable parameters of bean crop with hyperspectral measurements. Sci. Agric. 2012, 69, 87–94. [Google Scholar] [CrossRef]
  20. Zhu, W.; Sun, Z.; Gong, H.; Li, J.; Liao, X.; Peng, J.; Li, S.; Zhu, K. Estimating leaf chlorophyll content of crops via optimal unmanned aerial vehicle hyperspectral data at multi-scales. Comput. Electron. Agric. 2020, 178, 105786. [Google Scholar] [CrossRef]
  21. Li, H.; Li, D.; Xu, K.; Cao, W.; Jiang, X.; Ni, J. Monitoring of Nitrogen Indices in Wheat Leaves Based on the Integration of Spectral and Canopy Structure Information. Agronomy 2022, 12, 833. [Google Scholar] [CrossRef]
  22. Hansen, P.M.; Schjoerring, J.K. Reflectance measurement of canopy biomass and nitrogen status in wheat crops using normalized difference vegetation indices and partial least squares regression. Remote Sens. Environ. 2003, 86, 542–553. [Google Scholar] [CrossRef]
  23. Stroppiana, D.; Boschetti, M.; Brivio, P.A.; Bocchi, S. Plant nitrogen concentration in paddy rice from field canopy hyperspectral radiometry. Field Crop Res. 2009, 111, 119–129. [Google Scholar] [CrossRef]
  24. Chen, P.; Haboudane, D.; Tremblay, N.; Wang, J.; Vigneault, P.; Li, B. New spectral indicator assessing the efficiency of crop nitrogen treatment in corn and wheat. Remote Sens. Environ. 2010, 114, 1987–1997. [Google Scholar] [CrossRef]
  25. Yao, X.; Zhu, Y.; Tian, Y.; Feng, W.; Cao, W. Exploring hyperspectral bands and estimation indices for leaf nitrogen accumulation in wheat. Int. J. Appl. Earth Obs. Geoinf. 2010, 12, 89–100. [Google Scholar] [CrossRef]
  26. Gitelson, A.A.; Viña, A.; Ciganda, V.; Rundquist, D.C.; Arkebauer, T.J. Remote estimation of canopy chlorophyll content in crops. Geophys. Res. Lett. 2005, 32, L08403. [Google Scholar] [CrossRef] [Green Version]
  27. Delegido, J.; Fernandez, G.; Gandia, S.; Moreno, J. Retrieval of chlorophyll content and LAI of crops using hyperspectral techniques: Application to PROBA/CHRIS data. Int. J. Remote Sens. 2008, 29, 7107–7127. [Google Scholar] [CrossRef]
  28. Vincini, M.; Frazzi, E. Comparing narrow and broad-band vegetation indices to estimate leaf chlorophyll content in planophile crop canopies. Precis. Agric. 2011, 12, 334–344. [Google Scholar] [CrossRef]
  29. Inoue, Y.; Peñuelas, J.; Miyata, A.; Mano, M. Normalized difference spectral indices for estimating photosynthetic efficiency and capacity at a canopy scale derived from hyperspectral and CO2 flux measurements in rice. Remote Sens. Environ. 2008, 112, 156–172. [Google Scholar] [CrossRef]
  30. Garbulsky, M.F.; Peñuelas, J.; Papale, D.; Ardö, J.; Goulden, M.L.; Kiely, G.; Richardson, A.D.; Rotenberg, E.; Veenendaal, E.M.; Filella, I. Patterns and controls of the variability of radiation use efficiency and primary productivity across terrestrial ecosystems. Glob. Ecol. Biogeogr. 2010, 19, 253–267. [Google Scholar] [CrossRef]
  31. Ceccato, P.; Gobron, N.; Flasse, S.; Pinty, B.; Tarantola, S. Designing a spectral index to estimate vegetation water content from remote sensing data: Part 1: Theoretical approach. Remote Sens. Environ. 2002, 82, 188–197. [Google Scholar] [CrossRef]
  32. Zarco-Tejada, P.J.; González-Dugo, V.; Williams, L.E.; Suarez, L.; Berni, J.A.J.; Goldhamer, D.; Fereres, E. A PRI-based water stress index combining structural and chlorophyll effects: Assessment using diurnal narrow-band airborne imagery and the CWSI thermal index. Remote Sens. Environ. 2013, 138, 38–50. [Google Scholar] [CrossRef]
  33. Ihuoma, S.O. The Use of Spectral Reflectance Data to Assess Plant Stress and Improve Irrigation Water Management. Ph.D. Thesis, McGill University, Montreal, QC, Canada, 2020. [Google Scholar]
  34. Apan, A.; Held, A.; Phinn, S.; Markley, J. Detecting sugarcane ‘orange rust’disease using EO-1 Hyperion hyperspectral imagery. Int. J. Remote Sens. 2004, 25, 489–498. [Google Scholar] [CrossRef]
  35. Ray, S.S.; Jain, N.; Arora, R.K.; Chavan, S.; Panigrahy, S. Utility of hyperspectral data for potato late blight disease detection. J. Indian Soc. Remote Sens. 2011, 39, 161–169. [Google Scholar] [CrossRef]
  36. Calderón, R.; Navas-Cortés, J.A.; Lucena, C.; Zarco-Tejada, P.J. High-resolution airborne hyperspectral and thermal imagery for early detection of Verticillium wilt of olive using fluorescence, temperature and narrow-band spectral indices. Remote Sens. Environ. 2013, 139, 231–245. [Google Scholar] [CrossRef]
  37. Zou, X.; Haikarainen, I.; Haikarainen, I.P.; Mäkelä, P.; Mõttus, M.; Pellikka, P. Effects of crop leaf angle on LAI-sensitive narrow-band vegetation indices derived from imaging spectroscopy. Appl. Sci. 2018, 8, 1435. [Google Scholar] [CrossRef] [Green Version]
  38. Fitzgerald, G.J.; Rodriguez, D.; Christensen, L.K.; Belford, R.; Sadras, V.O.; Clarke, T.R. Spectral and thermal sensing for nitrogen and water status in rainfed and irrigated wheat environments. Precis. Agric. 2006, 7, 233–248. [Google Scholar] [CrossRef]
  39. Boiarskii, B.; Hasegawa, H. Comparison of NDVI and NDRE indices to detect differences in vegetation and chlorophyll content. J. Mech. Contin. Math. Sci. 2019, 4, 20–29. [Google Scholar] [CrossRef]
  40. Thompson, C.N.; Guo, W.; Sharma, B.; Ritchie, G.L. Using normalized difference red edge index to assess maturity in cotton. Crop Sci. 2019, 59, 2167–2177. [Google Scholar] [CrossRef]
  41. Shaver, T.M.; Kruger, G.R.; Rudnick, D.R. Crop canopy sensor orientation for late season nitrogen determination in corn. J. Plant Nutr. 2017, 40, 2217–2223. [Google Scholar] [CrossRef]
  42. Perry, E.M.; Davenport, J.R. Spectral and spatial differences in response of vegetation indices to nitrogen treatments on apple. Comput. Electron. Agric. 2007, 59, 56–65. [Google Scholar] [CrossRef]
  43. Roberts, D.A.; Roth, K.L.; Perroy, R.L. 14 hyperspectral vegetation indices. Hyperspectral Remote Sens. Veg. 2016, 2016, 306–327. [Google Scholar]
  44. Penuelas, J.; Baret, F.; Filella, I. Semi-empirical indices to assess carotenoids/chlorophyll a ratio from leaf spectral reflectance. Photosynthetica 1995, 31, 221–230. [Google Scholar]
  45. Zhao, T.J.; Zhang, L.X.; Shi, J.C.; Jiang, L.M. A physically based statistical methodology for surface soil moisture retrieval in the Tibet Plateau using microwave vegetation indices. J. Geophys. Res. Atmos. 2011, 116, D08116. [Google Scholar] [CrossRef]
  46. Wang, S.; Baig, M.H.A.; Zhang, L.; Jiang, H.; Ji, Y.; Zhao, H.; Tian, J. A simple enhanced water index (EWI) for percent surface water estimation using Landsat data. IEEE J. Sel. Top. Appl. Earth Obs. Remote Sens. 2015, 8, 90–97. [Google Scholar] [CrossRef]
  47. McCall, D.S.; Zhang, X.; Sullivan, D.G.; Askew, S.D.; Ervin, E.H. Enhanced soil moisture assessment using narrowband reflectance vegetation indices in creeping bentgrass. Crop Sci. 2017, 57, S-161–S-168. [Google Scholar] [CrossRef]
  48. Daughtry, C.S.T.; Walthall, C.L.; Kim, M.S.; De Colstoun, E.B.; McMurtrey Iii, J.E. Estimating corn leaf chlorophyll concentration from leaf and canopy reflectance. Remote Sens. Environ. 2000, 74, 229–239. [Google Scholar] [CrossRef]
  49. Yang, W.-H.; Peng, S.; Huang, J.; Sanico, A.L.; Buresh, R.J.; Witt, C. Using leaf color charts to estimate leaf nitrogen status of rice. Agron. J. 2003, 95, 212–217. [Google Scholar] [CrossRef]
  50. Casanova, D.; Epema, G.F.; Goudriaan, J. Monitoring rice reflectance at field level for estimating biomass and LAI. F. Crop. Res. 1998, 55, 83–92. [Google Scholar] [CrossRef]
  51. Aparicio, N.; Villegas, D.; Casadesus, J.; Araus, J.L.; Royo, C. Spectral vegetation indices as nondestructive tools for determining durum wheat yield. Agron. J. 2000, 92, 83–91. [Google Scholar] [CrossRef]
  52. Wang, Z.; Wang, J.; Liu, L.; Huang, W.; Zhao, C.; Lu, Y. Estimation of Nitrogen Status in Middle and Bottom Layers of Winter Wheat Canopy by Using Ground-Measured Canopy Reflectance. Commun. Soil Sci. Plant Anal. 2005, 36, 2289–2302. [Google Scholar] [CrossRef]
  53. Riedel, S.M.; Epstein, H.E.; Walker, D.A. Biotic controls over spectral reflectance of arctic tundra vegetation. Int. J. Remote Sens. 2005, 26, 2391–2405. [Google Scholar] [CrossRef]
  54. Tsonev, T.; Wahbi, S.; Sun, P.; Sorrentino, G.; Centritto, M. Gas exchange, water relations and their relationships with photochemical reflectance index in Quercus ilex plants during water stress and recovery. Int. J. Agric. Biol. 2014, 16, 335–341. [Google Scholar]
  55. Silva-Perez, V.; Molero, G.; Serbin, S.P.; Condon, A.G.; Reynolds, M.P.; Furbank, R.T.; Evans, J.R. Hyperspectral reflectance as a tool to measure biochemical and physiological traits in wheat. J. Exp. Bot. 2018, 69, 483–496. [Google Scholar] [CrossRef] [PubMed]
  56. Chen, T.; Wang, L.; Qi, H.; Wang, X.; Zeng, R.; Zhu, B.; Lan, Y.; Zhang, L. Monitoring of water stress in peanut using multispectral indices derived from canopy hyperspectral. Int. J. Precis. Agric. Aviat. 2020, 3, 50–58. [Google Scholar] [CrossRef]
  57. Sellami, M.H.; Albrizio, R.; Čolović, M.; Hamze, M.; Cantore, V.; Todorovic, M.; Piscitelli, L.; Stellacci, A.M. Selection of Hyperspectral Vegetation Indices for Monitoring Yield and Physiological Response in Sweet Maize under Different Water and Nitrogen Availability. Agronomy 2022, 12, 489. [Google Scholar] [CrossRef]
  58. Heckmann, D.; Schlüter, U.; Weber, A.P.M. Machine learning techniques for predicting crop photosynthetic capacity from leaf reflectance spectra. Mol. Plant 2017, 10, 878–890. [Google Scholar] [CrossRef]
  59. Yendrek, C.R.; Tomaz, T.; Montes, C.M.; Cao, Y.; Morse, A.M.; Brown, P.J.; McIntyre, L.M.; Leakey, A.D.B.; Ainsworth, E.A. High-throughput phenotyping of maize leaf physiological and biochemical traits using hyperspectral reflectance. Plant Physiol. 2017, 173, 614–626. [Google Scholar] [CrossRef]
  60. Weber, V.S.; Araus, J.L.; Cairns, J.E.; Sanchez, C.; Melchinger, A.E.; Orsini, E. Prediction of grain yield using reflectance spectra of canopy and leaves in maize plants grown under different water regimes. Field Crop Res. 2012, 128, 82–90. [Google Scholar] [CrossRef]
  61. Haboudane, D.; Miller, J.R.; Pattey, E.; Zarco-Tejada, P.J.; Strachan, I.B. Hyperspectral vegetation indices and novel algorithms for predicting green LAI of crop canopies: Modeling and validation in the context of precision agriculture. Remote Sens. Environ. 2004, 90, 337–352. [Google Scholar] [CrossRef]
  62. Staff, S.S. Keys to Soil Taxonomy; United States Department of Agriculture: Washington, DC, USA, 2014. [Google Scholar]
  63. Todorovic, M. An Excel-based tool for real time irrigation management at field scale. In Proceedings of the International Symposium on Water and Land Management for Sustainable Irrigated Agriculture, Adana, Turkey, 4–8 April 2006; pp. 4–8. [Google Scholar]
  64. Allen, R.G.; Pereira, L.S.; Raes, D.; Smith, M. Crop Evapotranspiration. In Guidelines for Computing Crop Water Requirements—FAO Irrigation and Drainage Paper 56; Food and Agriculture Organization: Rome, Italy, 1998. [Google Scholar]
  65. Von Caemmerer, S.; Farquhar, G. Some relationships between the biochemistry of photosynthesis and the gas exchange of leaves. Planta 1981, 153, 376–387. [Google Scholar] [CrossRef]
  66. Guyot, G.; Baret, F. Utilisation de la haute resolution spectrale pour suivre l’etat des couverts vegetaux. Spectr. Signat. Objects Remote Sens. 1988, 287, 279. [Google Scholar]
  67. Barnes, E.M.; Clarke, T.R.; Richards, S.E.; Colaizzi, P.D.; Haberland, J.; Kostrzewski, M.; Waller, P.; Choi, C.; Riley, E.; Thompson, T. Coincident detection of crop water stress, nitrogen status and canopy density using ground based multispectral data. In Proceedings of the Fifth International Conference on Precision Agriculture, Bloomington, MN, USA, 16–19 July 2000; Volume 1619. [Google Scholar]
  68. Perry, E.M.; Roberts, D.A. Sensitivity of Narrow-Band and Broad-Band Indices for Assessing Nitrogen Availability and Water Stress in an Annual Crop. Agron. J. 2008, 100, 1211–1219. [Google Scholar] [CrossRef]
  69. Shiratsuchi, L.; Ferguson, R.; Shanahan, J.; Adamchuk, V.; Rundquist, D.; Marx, D.; Slater, G. Water and nitrogen effects on active canopy sensor vegetation indices. Agron. J. 2011, 103, 1815–1826. [Google Scholar] [CrossRef]
  70. Le Maire, G.; Francois, C.; Dufrêne, E. Towards universal broad leaf chlorophyll indices using PROSPECT simulated database and hyperspectral reflectance measurements. Remote Sens. Environ. 2004, 89, 1–28. [Google Scholar] [CrossRef]
  71. Peñuelas, J.; Pinol, J.; Ogaya, R.; Filella, I. Estimation of plant water concentration by the reflectance water index WI (R900/R970). Int. J. Remote Sens. 1997, 18, 2869–2875. [Google Scholar] [CrossRef]
  72. R Core Team. R: A Language and Environment for Statistical Computing; R Foundation for Statistical Computing: Vienna, Austria, 2018. [Google Scholar]
  73. Kim, Y.; Glenn, D.M.; Park, J.; Ngugi, H.K.; Lehman, B.L. Hyperspectral image analysis for water stress detection of apple trees. Comput. Electron. Agric. 2011, 77, 155–160. [Google Scholar] [CrossRef]
  74. Sims, D.; Gamon, J. Estimation of vegetation water content and photosynthetic tissue area from spectral reflectance: A comparison of indices based on liquid water and chlorophyll absorption features. Remote Sens. Environ. 2003, 84, 526–537. [Google Scholar] [CrossRef]
  75. Raper, T.B.; Varco, J.J. Canopy-scale wavelength and vegetative index sensitivities to cotton growth parameters and nitrogen status. Precis. Agric. 2015, 16, 62–76. [Google Scholar] [CrossRef]
  76. Carter, G.A.; Knapp, A.K. Leaf optical properties in higher plants: Linking spectral characteristics to stress and chlorophyll concentration. Am. J. Bot. 2001, 88, 677–684. [Google Scholar] [CrossRef] [Green Version]
  77. Garriga, M.; Retamales, J.B.; Romero-Bravo, S.; Caligari, P.D.S.; Lobos, G.A. Chlorophyll, anthocyanin, and gas exchange changes assessed by spectroradiometry in Fragaria chiloensis under salt stress. J. Integr. Plant Biol. 2014, 56, 505–515. [Google Scholar] [CrossRef]
  78. Ihuoma, S.O.; Madramootoo, C.A. Sensitivity of spectral vegetation indices for monitoring water stress in tomato plants. Comput. Electron. Agric. 2019, 163, 104860. [Google Scholar] [CrossRef]
  79. Trunda, P.; Holub, P.; Klem, K. The effect of drought and nitrogen fertilization on the production, morphometry, and spectral characteristics of winter wheat. Glob. Chang. Complex Chall. 2015, 2015, 110. [Google Scholar]
  80. Ma, L.; Chen, X.; Zhang, Q.; Lin, J.; Yin, C.; Ma, Y.; Yao, Q.; Feng, L.; Zhang, Z.; Lv, X. Estimation of Nitrogen Content Based on the Hyperspectral Vegetation Indexes of Interannual and Multi-Temporal in Cotton. Agronomy 2022, 12, 1319. [Google Scholar] [CrossRef]
  81. Vicente, R.; Vergara-Díaz, O.; Medina, S.; Chairi, F.; Kefauver, S.C.; Bort, J.; Serret, M.D.; Aparicio, N.; Araus, J.L. Durum wheat ears perform better than the flag leaves under water stress: Gene expression and physiological evidence. Environ. Exp. Bot. 2018, 153, 271–285. [Google Scholar] [CrossRef]
  82. Zhang, Y.J.; Hou, M.Y.; Xue, H.Y.; Liu, L.T.; Sun, H.C.; Li, C.D.; Dong, X.J. Photochemical reflectance index and solar-induced fluorescence for assessing cotton photosynthesis under water-deficit stress. Biol. Plant. 2018, 62, 817–825. [Google Scholar] [CrossRef]
  83. Kurbanov, R.K.; Zakharova, N.I. Application of vegetation indexes to assess the condition of crops. Agric. Mach. Technol. 2020, 14, 4. [Google Scholar] [CrossRef]
  84. El-Metwalli, A.; Tyler, A. Estimation of maize properties and differentiating moisture and nitrogen deficiency stress via ground—Based remotely sensed data. Agric. Water Manag. 2020, 242, 106413. [Google Scholar] [CrossRef]
  85. Lamb, D.; Steyn-Ross, M.; Schaare, P.; Hanna, M.; Silvester, W.; Steyn-Ross, A. Estimating leaf nitrogen concentration in ryegrass (Lolium spp.) pasture using the chlorophyll red-edge: Theoretical modelling and experimental observations. Int. J. Remote Sens. 2002, 23, 3619–3648. [Google Scholar] [CrossRef]
  86. Alordzinu, K.; Li, J.; Lan, Y.; Appiah, S.; Al Aasmi, A.; Wang, H.; Liao, J.; Sam-Amoah, L.; Qiao, S. Ground-Based Hyperspectral Remote Sensing for Estimating Water Stress in Tomato Growth in Sandy Loam and Silty Loam Soils. Sensors 2021, 21, 5705. [Google Scholar] [CrossRef]
  87. Elvanidi, A.; Katsoulas, N.; Ferentinos, K.; Bartzanas, T.; Kittas, C. Hyperspectral machine vision as a tool for water stress severity assessment in soilless tomato crop. Biosyst. Eng. 2018, 165, 25–35. [Google Scholar] [CrossRef]
  88. Ihuoma, S.O.; Madramootoo, C. Narrow-band reflectance indices for mapping the combined effects of water and nitrogen stress in field grown tomato crops. Biosyst. Eng. 2020, 192, 133–143. [Google Scholar] [CrossRef]
  89. Ju, C.H.; Tian, Y.C.; Yao, X.; Cao, W.X.; Zhu, Y.; Hannaway, D. Estimating Leaf Chlorophyll Content Using Red Edge Parameters. Pedosphere 2010, 20, 633–644. [Google Scholar] [CrossRef]
  90. Zhang, C.; Dai, X.; Qin, Q.; Li, J.; Zhang, T.; Sun, Y. Spectral characteristics of copper-stressed vegetation leaves and further understanding of the copper stress vegetation index. Int. J. Remote Sens. 2019, 40, 4473–4488. [Google Scholar] [CrossRef]
  91. Blackburn, G. Quantifying Chlorophylls and Caroteniods at Leaf and Canopy Scales: An Evaluation of Some Hyperspectral Approaches. Remote Sens. Environ. 1998, 66, 273–285. [Google Scholar] [CrossRef]
  92. Marino, G.; Pallozzi, E.; Cocozza, C.; Tognetti, R.; Giovannelli, A.; Cantini, C.; Centritto, M. Assessing gas exchange, sap flow and water relations using tree canopy spectral reflectance indices in irrigated and rainfed Olea europaea L. Environ. Exp. Bot. 2014, 99, 43–52. [Google Scholar] [CrossRef]
  93. Kovar, M.; Brestic, M.; Sytar, O.; Barek, V.; Hauptvogel, P.; Zivcak, M. Evaluation of Hyperspectral Reflectance Parameters to Assess the Leaf Water Content in Soybean. Water 2019, 443, 443. [Google Scholar] [CrossRef]
  94. Fernandes, A.; Fortini, E.; Areal de Carvalho Muller, L.; Batista, D.; Vieira, L.; Oliveira Silva, P.; Amaral, C.; Poethig, R.; Otoni, W. Leaf development stages and ontogenetic changes in passionfruit (Passiflora edulis Sims.) are detected by narrowband spectral signal. J. Photochem. Photobiol. B. 2020, 209, 111931. [Google Scholar] [CrossRef] [PubMed]
  95. Seelig, H.; Hoehn, A.; Stodieck, L.; Klaus, D.; Adams, W.W., III; Emery, W. The assessment of leaf water content using leaf reflectance ratios in the visible, near-, and short-wave-infrared. Int. J. Remote Sens. 2008, 29, 3701–3713. [Google Scholar] [CrossRef]
  96. Jackson, R.; Ezra, C. Spectral response of cotton to suddenly induced water stress. Int. J. Remote Sens. 1985, 6, 177–185. [Google Scholar] [CrossRef]
  97. Moore, J.; Vicré-Gibouin, M.; Farrant, J.; Driouich, A. Adaptations of higher plant cell walls to water loss: Drought vs. desiccation. Physiol. Plant. 2008, 134, 237–245. [Google Scholar] [CrossRef]
  98. Badzmierowski, M.J.; McCall, D.S.; Evanylo, G. Using Hyperspectral and Multispectral Indices to Detect Water Stress for an Urban Turfgrass System. Agronomy 2019, 9, 439. [Google Scholar] [CrossRef]
  99. Penuelas, J.; Filella, I.; Serrano, L.; Savé, R. Cell wall elasticity and Water Index (R970 nm/R900 nm) in wheat under different nitrogen availabilities. Int. J. Remote Sens. 1996, 17, 373–382. [Google Scholar] [CrossRef]
  100. Ihuoma, S.O.; Madramootoo, C. Recent advances in crop water stress detection. Comput. Electron. Agric. 2017, 141, 267–275. [Google Scholar] [CrossRef]
  101. Wang, L.; Hunt, E.R., Jr.; Qu, J.; Hao, X.; Daughtry, C. Remote sensing of fuel moisture content from ratios of narrow-band vegetation water and dry-matter indices. Remote Sens. Environ. 2013, 129, 103–110. [Google Scholar] [CrossRef]
  102. Katsoulas, N.; Elvanidi, A.; Ferentinos, K.; Kacira, M.; Bartzanas, T.; Kittas, C. Crop reflectance monitoring as a tool for water stress detection in greenhouses: A review. Biosyst. Eng. 2016, 151, 374. [Google Scholar] [CrossRef]
  103. Claudio, H.; Cheng, Y.; Fuentes, D.; Gamon, J.; Luo, H.; Oechel, W.; Qiu, H.-L.; Rahman, F.; Sims, D. Monitoring drought effects on vegetation water content and fluxes in chaparral with the 970 nm water band index. Remote Sens. Environ. 2006, 103, 304–311. [Google Scholar] [CrossRef]
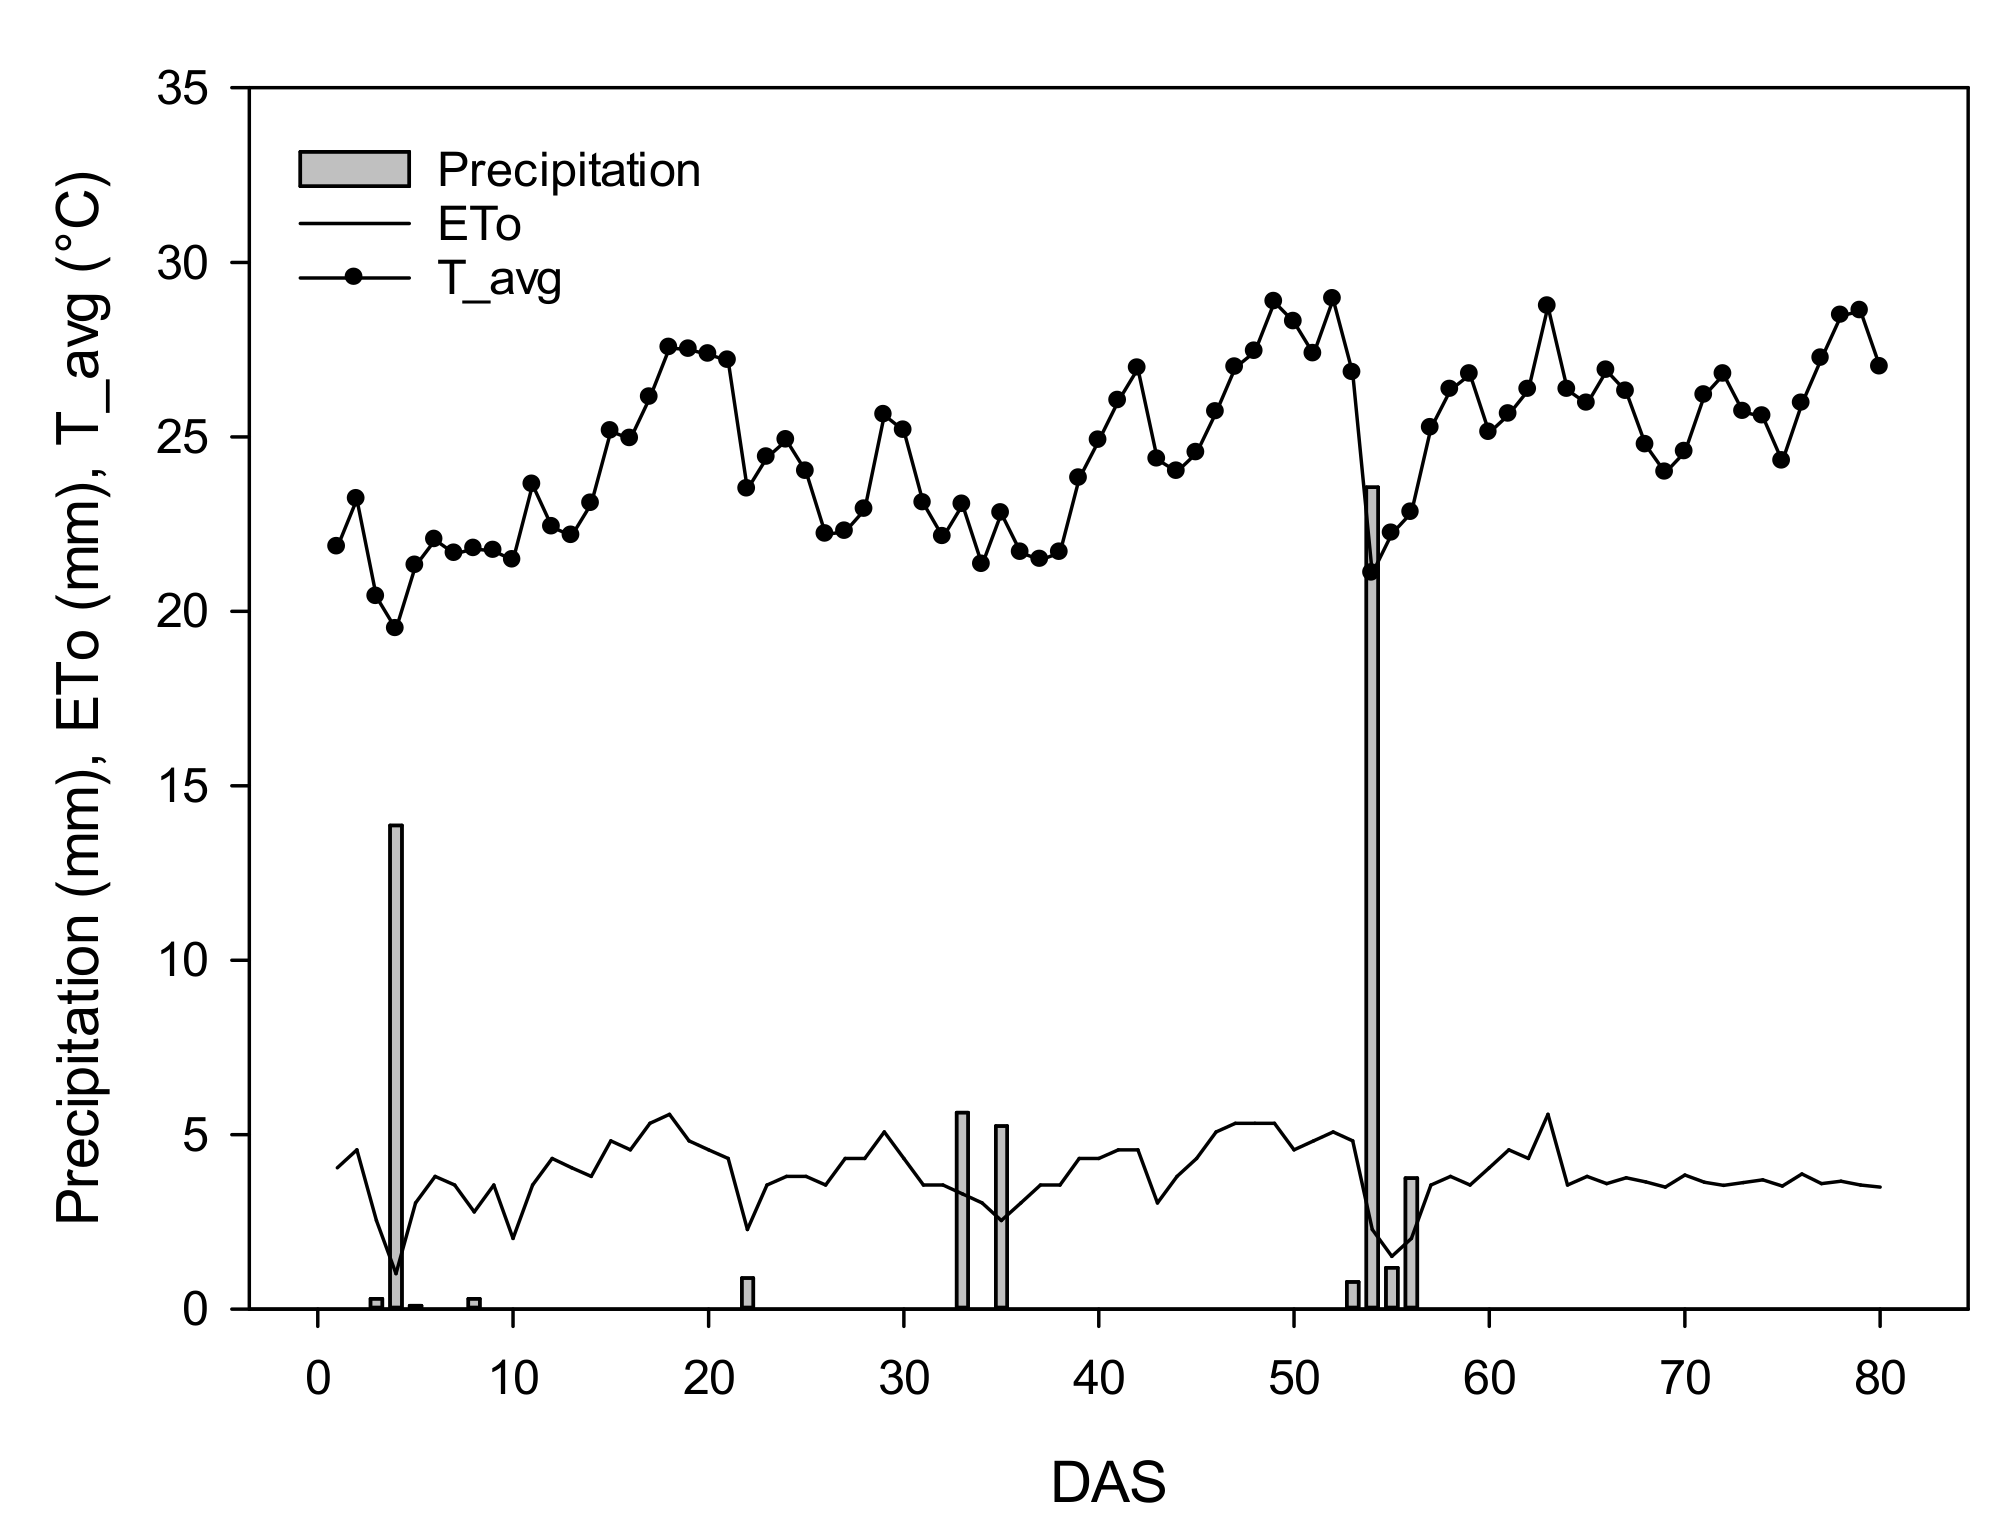
Figure 1. The daily precipitation, reference evapotranspiration (ETo), and average temperature (T_avg) during the crop growing cycle of sweet maize.
Agronomy 12 02181 g001
Figure 2. Variation in the relative water content (RWC) during the growing season of sweet maize for different water and nitrogen treatments.
Agronomy 12 02181 g002
Figure 3. The average values of the spectral reflectance of sweet maize for different treatments, during the tasseling stage (73 DAS): (a) and (b) are the irrigation regimes under high nitrogen (HN) and low nitrogen (LN), respectively; (c) is the interaction among both full irrigation and rainfed treatments with nitrogen levels; (d) is the interaction among all the six treatments.
Agronomy 12 02181 g003
Figure 4. Variation in the CIred-edge (a), CI (b), REIP (c), DATT (d), MTCI (e), and DD (f). NDRE (g), SIPI (h), NNDVI (i), and WBI (j) during the growing season of sweet maize for different water and nitrogen treatments.
Agronomy 12 02181 g004
Figure 5. The correlation matrix for the bio-physiological parameters and vegetation indices for sweet maize.
Agronomy 12 02181 g005
Figure 6. The linear regression parameters between the (a) DATT index and leaf chlorophyll content (Chl content); (b) DD index, and net assimilation rate (An).
Agronomy 12 02181 g006
Table 1. The indices derived from the hyperspectral visible and near-infrared bands.
DescriptionAbbreviationFormulationReference
Narrow-Band Water and Nitrogen Sensitive Indices
Red-edge inflection pointREIP700 + 40 × [(((R670 + R780)/2) − R700)/
(R740 − R700)]
[66]
Normalized difference red-edgeNDRE(R790 − R720)/(R790 + R720)[67]
Narrow-band Normalized Difference Vegetation IndexNNDVI(R775 − R670)/(R775 + R670)[68]
Modified chlorophyll absorption reflectance indexMCARI[(R700 − R670) − 0.2 × (R700 − R550)] × (R700/R670)[48]
DATT indexDATT *(R760 − R720)/(R760 − R670)[69]
MERIS terrestrial chlorophyll indexMTCI *(R760 − R720)/(R720 − R670)[69]
Chlorophyll indicesCI
CIgreen
CIred-edge
CI = (R880/R590) − 1
CIgreen = (R730/R530) − 1
CIred-edge = (R850/R730) − 1
[69]
Double difference indexDD(R749 − R720) − (R701 − R672)[70]
Structure intensive pigment indexSIPI(R800 − R445)/(R800 − R680)[44]
Water band indexWBIR900/R970[71]
Ratio water band index and normalized difference vegetation index(WBI/NDVI)(R900/R970)/
[(R800 − R680)/(R800 + R680)]
[71]
* DATT and MTCI indices were computed according to the equations reported in [69].
Table 2. The analysis of variance of 13 vegetation indices (VIs) for different irrigation regimes, nitrogen levels, and the day after sowing (DAS) of sweet maize.
Source of VariationIrrigationNitrogenDASIrrigation
× Nitrogen
Irrigation
×
DAS
Nitrogen
×
DAS
Irrigation
× Nitrogen
X DAS
Vegetation
Indices (VIs)
REIP<0.0001 ***0.0016 **0.0064 **0.5635 ns<0.0001 ***0.8752 ns0.2969 ns
NDRE<0.0001 ***<0.0001 ***0.0024 **0.6831 ns<0.0001 ***0.6765 ns0.1399 ns
NNDVI0.0123 *0.9880 ns<0.0001 ***0.0475 *<0.0001 ***0.0799 ns0.4282 ns
MCARI0.5690 ns0.0031 **0.0033 **0.5833 ns0.0509 ns0.3546 ns0.4752 ns
CI0.0020 **0.0094 **<0.0001 ***0.1668 ns0.0153 *0.6765 ns0.1394 ns
CIgreen0.0173 *0.0709 ns<0.0001 ***0.0503 ns0.06499 ns0.1100 ns0.1260 ns
CIrededge<0.0001 ***<0.0001 ***0.0670 ns0.8384 ns<0.0001 ***0.8025 ns0.0422 *
DD<0.0001 ***0.0025 **<0.0001 ***0.2713 ns<0.0001 ***0.7092 ns0.5311 ns
DATT<0.0001 ***<0.0001 ***<0.0001 ***0.65108 ns<0.0001 ***0.00524 **0.39118 ns
MTCI<0.0001 ***<0.0001 ***<0.0001 ***0.3292 ns<0.0001 ***0.8102 ns0.1174 ns
SIPI0.0219 *0.1610 ns<0.0001 ***0.4588 ns0.0050 **0.2390 ns0.5465 ns
WBI<0.0001 ***0.3500 ns0.0095 **0.2520 ns<0.0001 ***0.0934 ns0.2770 ns
WBI/NDVI<0.0001 ***0.8780 ns<0.0001 ***0.0381 *<0.0001 ***0.217 ns0.2158 ns
Not significant (ns); significant at p ≤ 0.05 (*), p ≤ 0.01 (**), and p ≤ 0.001 (***).
Table 3. The effect of the interaction of irrigation x nitrogen on the vegetation indices.
IndexNitrogenIrrigation
I0I50I100
NNDVILN0.71c0.76ab0.79a
HN0.75b0.75ab0.76ab
WBI/NDVILN1.47a1.3bc1.24c
HN1.36b1.31bc1.29bc
Means followed by different letters were significantly different at p = 0.05.
Publisher’s Note: MDPI stays neutral with regard to jurisdictional claims in published maps and institutional affiliations.