Article

Identification of Phytochemical Compounds, Functional Properties and Antioxidant Activity of Germinated Purple Corn Protein Concentrate and Its Gastrointestinal Hydrolysates

1
Departamento de Investigación, Universidad Estatal de Bolívar, Guaranda 020102, Bolívar, Ecuador
2
Departamento de Producción Animal, Campus Universitario de Rabanales, Universidad de Córdoba, 14071 Cordoba, Spain
3
Departamento de Ingeniería Rural y Agroalimentaria, Universidad Politécnica de Valencia, 46022 Valencia, Spain
*
Author to whom correspondence should be addressed.
Agronomy 2022, 12(9), 2217; https://doi.org/10.3390/agronomy12092217
Submission received: 25 July 2022 / Revised: 10 September 2022 / Accepted: 11 September 2022 / Published: 17 September 2022

Abstract

:
Purple corn seeds germinated at 25 °C and 35 °C for 5 days were used to obtain purple corn protein concentrate (PCPC25 and PCPC35). PCPC25 and PCPC35 were subject to gastrointestinal hydrolysis. PCPC and its hydrolysates were used to evaluate their functional and biological properties. Total flavonoid content (TFC), total flavonol content (TFLC), total anthocyanin content (TAC) and total proanthocyanin (TAP) were determined. The polyphenols and flavonoids were identified by UPLC-QDa. Protein solubility (PS), water and oil absorption capacity (WAC and OAC) were determined. The antioxidant activity was evaluated by the FRAP, ABTS and DPPH methods. PCPC35 showed the highest TFLC values (11,091.37 mg rutin equivalents (RE)/100 g dry weight DW), and TFL presented values of 7975.59 mg RE/100 g DW. The PCPCs presented better functional properties than the hydrolysates. PCPC25 presented a PS of 59.43%PS at pH 8.0, 27.77%WAC and 24.94%OAC. PCPC25 and PCPC35 showed high values of antioxidant activity. PCPC25 showed ABTS values (570.97 µmol trolox equivalents (TE)/g DW) and FRAP (772.85 µmol TE/g DW). PCPCs hydrolysates were less active with ABTS values (74.12 µmol TE/g DW) and FRAP (59.42 µmol TE/g DW).

1. Introduction

Cereals are among the most cultivated foods worldwide and play an important role in the human diet and animal feed. Within cereal crops, maize or corn (Zea maize L.) represents one of the most important crops for global food due to its nutritional value. Corn seeds have a high starch content (72%), protein content (7–13%), total fiber (2.5%) and oil content (4.8%) [1,2,3]. Purple corn seeds contain important vitamins and minerals for the diet. In the latest Food and Agriculture Organization Corporate Statistical Database (FAOSTAT) report, it is indicated that Ecuador had 686,896 hectares cultivated with cereals with a total cereal production of 2,689,665 tons in 2020. An area of 341,301 hectares was destined for corn, achieving a production of 1,304,884 tons and a yield of 38,233 hg/ha in 2020 [4]. These data reflect the importance of this crop for Ecuador and the feeding of the population.
Pigmented corn varieties, such as purple corn or purple maize, are highly valued for their high content of phenolic compounds, such as flavonoids and anthocyanins. These varieties are cultivated in the Andes region of South America in Peru, Ecuador, Bolivia and Argentina. Purple corn anthocyanin extracts have been used to color homemade desserts and drinks, such as chicha morada and mazamorra morada, two typical drinks from the Andean region [4,5,6].
Suriano et al. (2021) have described the content of phenolic compounds for purple corn with values of total proanthocyanin content (TPA) of 1381 µg/g, DW), total anthocyanin content (TAC) (780 µg/g DW), total flavonoid content (TFC) (1998 µg/g DW) and total polyphenol content (TPC) (4047 µg/g DW) [7]. It is widely described in the literature that phenolic compounds are responsible for different biological activities of foods. The antioxidant activity is one of the most studied biological activities of the types of compounds. The use of natural compounds is an alternative to artificial antioxidants due to low toxicity and no harmful effects on health [8,9,10].
Protein concentrate powders (PCP) are used as dietary supplements and in food processing and are available in a wide variety of flavors and forms, such as shakes, bars, snacks and gels. PCP are produced using a filtration method by pushing the proteins through a filter, which allows water, minerals and other organic materials to pass through. Proteins, which are of large molecular size, are retained by the filter, resulting in protein powder or PCP. PCP contain significant amounts of carbohydrates and fats. PCP can be used to obtain protein isolate powder (PIP) through successive filtrations [11,12,13,14,15]. The most widely used PCP and PIP of animal source in the food industry are whey protein concentrate (WPC) and whey protein isolate (WPI) obtained from whey milk proteins [16]. Soy protein concentrate (SPC) is the most widely used PCP of vegetal source. This PCP is produced from defatted soy flour without the water-soluble carbohydrates but with fiber. This PCP contains 70% protein [17,18,19]. PCP and PIP have good functional and biological properties. Due to their composition, purple corn seeds can be a good alternative to obtain PCP and PIP with good functional and biological properties. They can be an inexpensive plant source of protein and are easy to grow in different climatic zones. They usually have a high percentage of protein solubility, good absorption of water and oil. Different PCP and PIP with antioxidant, antibacterial and anti-inflammatory capacity have been reported. An important property to evaluate is protein digestibility. There are gastrointestinal simulation models that allow simulating the physiological conditions of hydrolysis of food proteins. During the hydrolysis process, peptide sequences are released by the action of enzymes that can improve the functional and biological properties of PCPs and PIPs.
PIP have very low levels of carbohydrates and fats, containing exclusively pure proteins. Alkaline extraction followed by isoelectric precipitation is a way to obtain PCP and PIP in a simple, fast and economical way. SPI are commonly produced using this technique [20,21,22]. Purple corn can be a suitable source of protein to obtain PCP with a high content of phenolic compounds, especially anthocyanins, resulting in a high antioxidant activity. In addition, PC and PI of vegetable origin usually have a high degree of digestibility, which facilitates the bioavailability of amino acids [23]. Plant-based sources are much more sustainable than animal-based sources because fewer natural resources are used in their production, and they are less harsh on the environment. It is predicted that by 2030, the world population will be around 8.6 billion people, and by 2050, it could be 10 billion people. This increase in the population produces an increase in the demand for protein of animal origin estimated at around 70%. For these reasons, new sources of dietary protein that are sustainable and fair to the environment must be sought. Crops have to face the difficulties of climate change; therefore, it is of great importance to have information on vegetable proteins and other vegetable compounds, as well as information on crops and their ability to adapt to environmental changes [24,25,26].
The main objective of the work was to evaluate the functional properties (%PS, %WAC and %AOC) and antioxidant activity of PCPC25, PCPC35 and of their gastrointestinal hydrolysates (GH25, DH25, GH35 and DH35).

2. Materials and Methods

2.1. Materials

2,2′-Azino-bis-(3-ethylbenzothiazoline-6-sulfonicacid) (ABTS), 2,2-diphenyl-1-picrylhydrazyl (DPPH), 2,4,6-Tris(2-pyridyl)-s-triazine (TPTZ), pepsin, pancreatin and 6-Hydroxy-2,5,7,8-tetramethylchroman-2-carboxylic acid (Trolox standard) were obtained from Sigma-Aldrich (St. Louis, MO, USA). Analytical-grade solvents and reagents were obtained from Sigma-Aldrich (St. Louis, MO, USA).

2.2. Plant Material

Purple corn seeds (Zea mays L., INIAP-199 bunch of grapes) were obtained from the Bolivar State University (Guaranda, Ecuador) and the National Institute of Agricultural Research (INIAP) (Quito, Ecuador). The crop was established in Guaranda, Ecuador, at 2800 m of altitude, south latitude 01°34′15′′ and west longitude 79°0′02′′. The city of Guaranda has a temperature of 13 °C and a humidity of 75%, based on the annual average. The harvest was carried out manually once the seeds reached physiological and commercial maturity. The seeds were manually shelled and dried in a drying rack in the open air until reaching a humidity of 14%.

2.3. Preparation of Germinated Purple Corn Protein Concentrate (PCPC)

Purple corn seeds were germinated according to Vilcacundo et al. [27]. The seeds were germinated at 25 °C and 35 °C for 5 days. PCPCs were obtained; they were ground until flour was obtained, which was sieved (<500 µm). Purple corn flour was defatted with the help of hexane in the proportion (1:10, w/v) for 24 h. The solvent was then removed in an extraction hood for 48 h. Then, 10 g of defatted purple corn flour was dissolved in deionized distilled water in the proportion (1:10, w/v). The pH was adjusted to pH 8.0 with 1 M NaOH. The solution was centrifuged at 10,000× g for 1 h at 4 °C. The precipitate obtained was discarded (fiber, fat, carbohydrates and minerals), and the supernatant was separated (protein and phenolic compounds). The pH of the supernatant was adjusted to 5.0 with the help of 1 N HCL. The solution was centrifuged at 10,000× g for 30 min at 4 °C. The precipitated proteins–phenols were collected in falcon tubes, and their pH was adjusted to pH 7.0 with 0.5 M NaOH. The samples were named PCPC25 and PCPC35. The precipitated proteins–phenols were lyophilized and frozen at −80 °C.

2.4. Gastrointestinal Hydrolysis of PCPC25 and PCPC35

They were subject to gastric and duodenal hydrolysis steps. PCPCs (10 mg, DW) were used to induce gastrointestinal hydrolysis. Step 1: The gastric hydrolysis (GH) step involved pepsin enzyme at pH 3.0 for 120 min dissolved in a simulated gastric fluid (SGF) (0.035 M NaCl) with continuous agitation. The mix was heated at 80 °C for 5 min to stop the reaction of the pepsin enzyme. Step 2: The duodenal hydrolysis (DH) step involved pancreatin at pH 7.0 for 120 min dissolved in a simulated duodenal fluid (SDF) (CaCl2 plus bile salts) with continuous agitation. Then, 1 mL of the PCPC gastric hydrolysate was taken and mixed with 1 mL of the pancreatin mix. The mix was heated at 90 °C for 10 min to stop the reaction of pancreatin. The gastrointestinal hydrolysates were frozen at −80 °C and lyophilized until use [28]. The gastric hydrolysates samples were named as follows: GH25 (gastric hydrolysates obtained from PCPC25) and GH35 (gastric hydrolysates obtained from PCPC35). The samples of the duodenal hydrolysates were named as follows: DH25 (duodenal hydrolysate obtained from PCPC25) and DH35 (duodenal hydrolysate obtained from PCPC35).
Undigested nitrogen (N) was finally determined by the Dumas method using an elemental analyzer (Vario Macro Cube, Elementar, Hanau, Germany). Digestibility was calculated as % digestibility = (%N in PCPC − undigested %N in hydrolysate)/%N in PCPC × 100 [29].

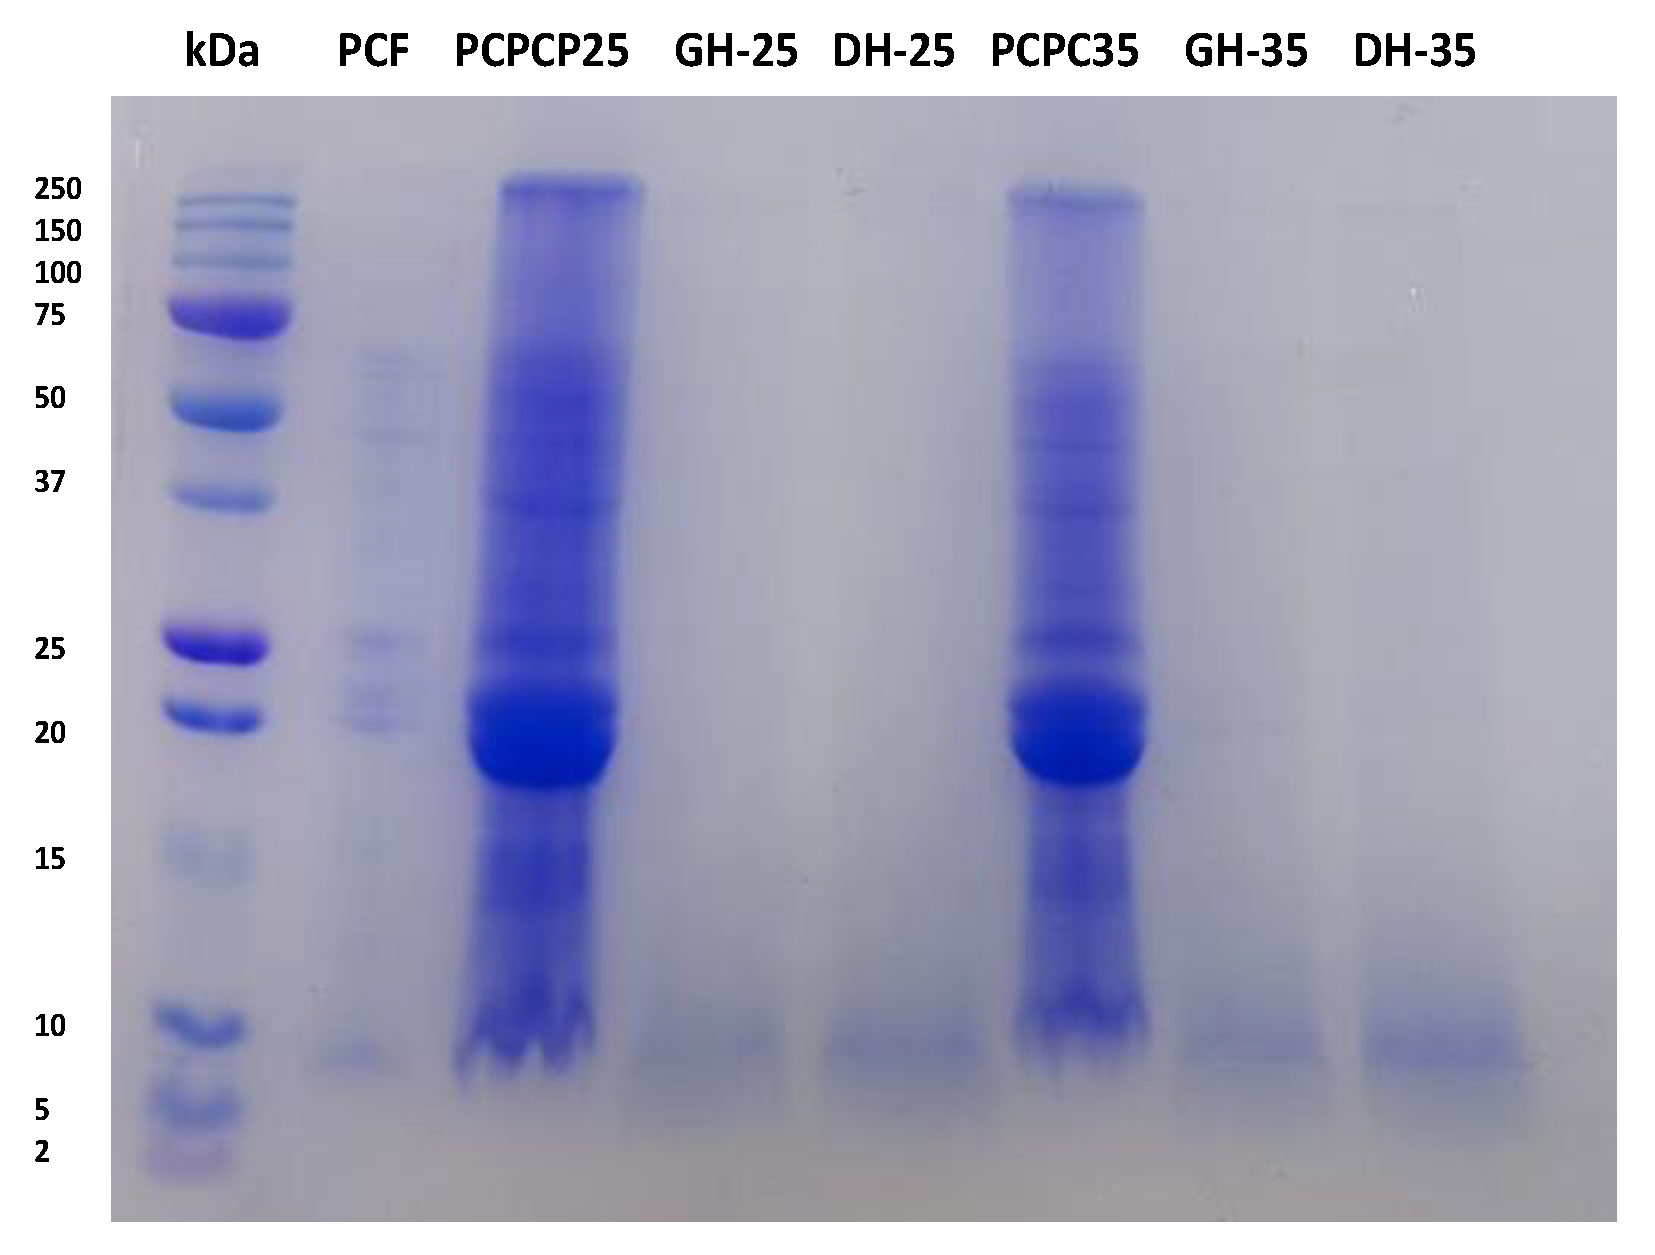
2.5. Analysis of the Protein Profile of PCPCs and Hydrolysates (GH25, DH25, GH35 and DH35) Using the Electrophoresis Technique

PCPCs protein profile and their gastrointestinal hydrolysates were characterized by sodium dodecyl sulphate polyacrylamide gel electrophoresis (SDS-PAGE). An amount of 5 mg/mL of the sample was dissolved in a sample buffer and heated at 100 °C for 5 min with 2-mercaptoetanol. The samples were analyzed with Miniprotean equipment (Bio-Rad, Hercules, CA, USA) at 200 V for 30 min. Separator gels at 12% polyacrylamide for PCPC and 16% polyacrylamide for hydrolysates were used. The molecular weights of the bands were calculated with the help of a molecular weight standard with a range of 2–250 kDa (Bio-Rad, CA, USA). Gels were stained with Coomassie blue G-250 solution for 24 h with continuous agitation. The gels were unstained for two days. Gels were photographed and processed on a gel analyzer instrument (Analytik Jena Geltower, Thermo Fischer Scientific, Dublin, Ireland) [30].

2.6. Elemental Composition of PCPC25, PCPC35 and Hydrolysates (GH25, DH25, GH35 and DH35) and Quantification of Protein Content

Carbon (C), hydrogen (H), sulphur (S) and nitrogen (N) content was determined by the Dumas combustion method using an elemental analyzer (Vario Macro Cube, Elementar, Hanau, Germany). The instrument was calibrated with a sample of a sulphonamide standard. An amount of 20 mg of lyophilized PCPCs and hydrolysates was placed in aluminum capsules. The capsules were inserted into the sample injection mechanism to be transformed from C, H, S and N into their gaseous form by calcination. The assays were performed in triplicate. The protein percentage of the samples was calculated using Equation (1):
% Protein = F × %N
where F is the conversion factor 6.25, and %N is the percentage of nitrogen calculated by the instrument.

2.7. Total Anthocyanin Content (TAC)

TAC was determined by UV-visible spectrophotometry, following the pH differential methodology described by Rapisarda et al. [31]. An amount of 0.3 g of lyophilized PCPC was mixed with 5 mL of pH 1.0 buffer (KCl 0.2 N and HCl 0.2 N) and stirred for 5 min. Then, the mixture was sonicated in a Cole-Parmer 8892 ultrasound bath (Cole-Parmer, Chicago, IL, USA) and finally centrifuged at 2700× g for 10 min. The supernatant was separated and transferred to a 25 mL amber volumetric balloon. This procedure was repeated three more times, and the solution was brought to volume with the pH 1.0 buffer solution. The extraction with pH 4.5 buffer (CH3COONa 1 M and HCl 1 N) was carried out using the same process. The TAC quantification was carried out by measuring the absorbance in the samples (pH 1.0 and 4.5) at two wavelengths (510 nm and 700 nm) on a Shimadzu model 2600 spectrophotometer (Shimadzu, Kyoto, Japan). The absorbance (A) was calculated by the absorbance differences between pH 1.0 and pH 4.5 using Equation (2). Then, the TAC content was determined using Equation (3).
A = [(A510 − A700) pH1.0 − (A510 − A700) pH4.5]
TAC = A × MW × DF × 100/ε × W
where A = absorbance difference pH 1.0–pH 4.5, MW = molecular weight of cyanidin-3-glucoside chloride (484.84 g/mol), DF = dilution factor, ε = molar extinction coefficient and W = weight of sample.
The TAC results are expressed as milligrams of cyanidin-3-glucoside chloride (cy-3-glu) per gram of dry weight (DW), (mg cy-3-glu/100 g DW).

2.8. Total Proanthocyanin Content (TPAC)

TPAC was quantified by a butanol acid assay. An amount of 250 µL of lyophilized sample (1 mg/mL) was mixed with 3.25 mL of n-butanol-HCl in proportion (50:50, v/v) in a tube test. Then, 0.2 mL (2% ammonium iron II sulphate dissolved in 2 M HCl) was added. Then, the tubes were heated at 95 °C for 50 min. The absorbance of the red solution was measured at a wavelength of 550 nm. The TFC quantification was performed using a calibration curve with (0–100 µg/mL catechin). The curve obtained was y = 0.0004x − 0.0059 (R2 = 0.9961). The results obtained were expressed as milligrams of catechin equivalents per gram of TPA on dry weight (DW) of sample (mg CE/g DW) [32].

2.9. Total Flavonoids Content (TFC)

TFC was determined by UV-visible spectrophotometry, using the method proposed by Zhishen et al. [33]. PCPCs and purple corn flour were dissolved in the mix of methanol and water (70:30 v/v). This step was repeated several times until the plant material was exhausted. An amount of 1 mL of the diluted extract was mixed with 4 mL of distilled water, and it was homogenized. Then, 0.3 mL of 5% sodium nitrite (w/v) and 0.3 mL of 10% aluminum chloride (w/v) were added, allowing the sample to stand for 5 min after the addition of each reagent. Afterward, 2 mL of 1 N NaOH was added, and the volume was increased to 10 mL with distilled deionized water. In this reaction, a pink chromophore was formed; its absorbance was measured at 490 nm with a Shimadzu model 2600 spectrophotometer (Shimadzu, Kyoto, Japan). The TFC quantification was performed using a calibration curve with (0–100 mg rutin R/L). The curve obtained was y = 0.0092x − 0.0042 (R2 = 0.9936). The results are expressed as milligrams of rutin equivalents (RE) per gram of dry weight (DW), (mg RE/100 g DW).

2.10. Total Flavonol Content (TFLC)

The TFLC content was determined using the methodology proposed by Ramos-Escudero et al. [34]. PCPCs and purple corn flour were dissolved in the mix of methanol and water (70:30 v/v). This step was repeated several times until the plant material was exhausted. An amount of 500 µL of the sample was mixed with 500 uL of 20% AlCl3 and 1500 µL of 50% CH3COONa. The samples were incubated in the dark for 2 h; the absorbance of the reaction was measured at a wavelength of 415 nm using a UV-Vis spectrophotometer (Thermo Scientific.). A rutin standard calibration curve in the range of (10 to 100 ppm) was used. The curve obtained was (y = 0.0029x − 0.0008, R2 = 0.9993). The results were expressed as milligrams of rutin equivalents (RE) contained in 100 g of dry weight (DW) (mg RE/100 g DW).

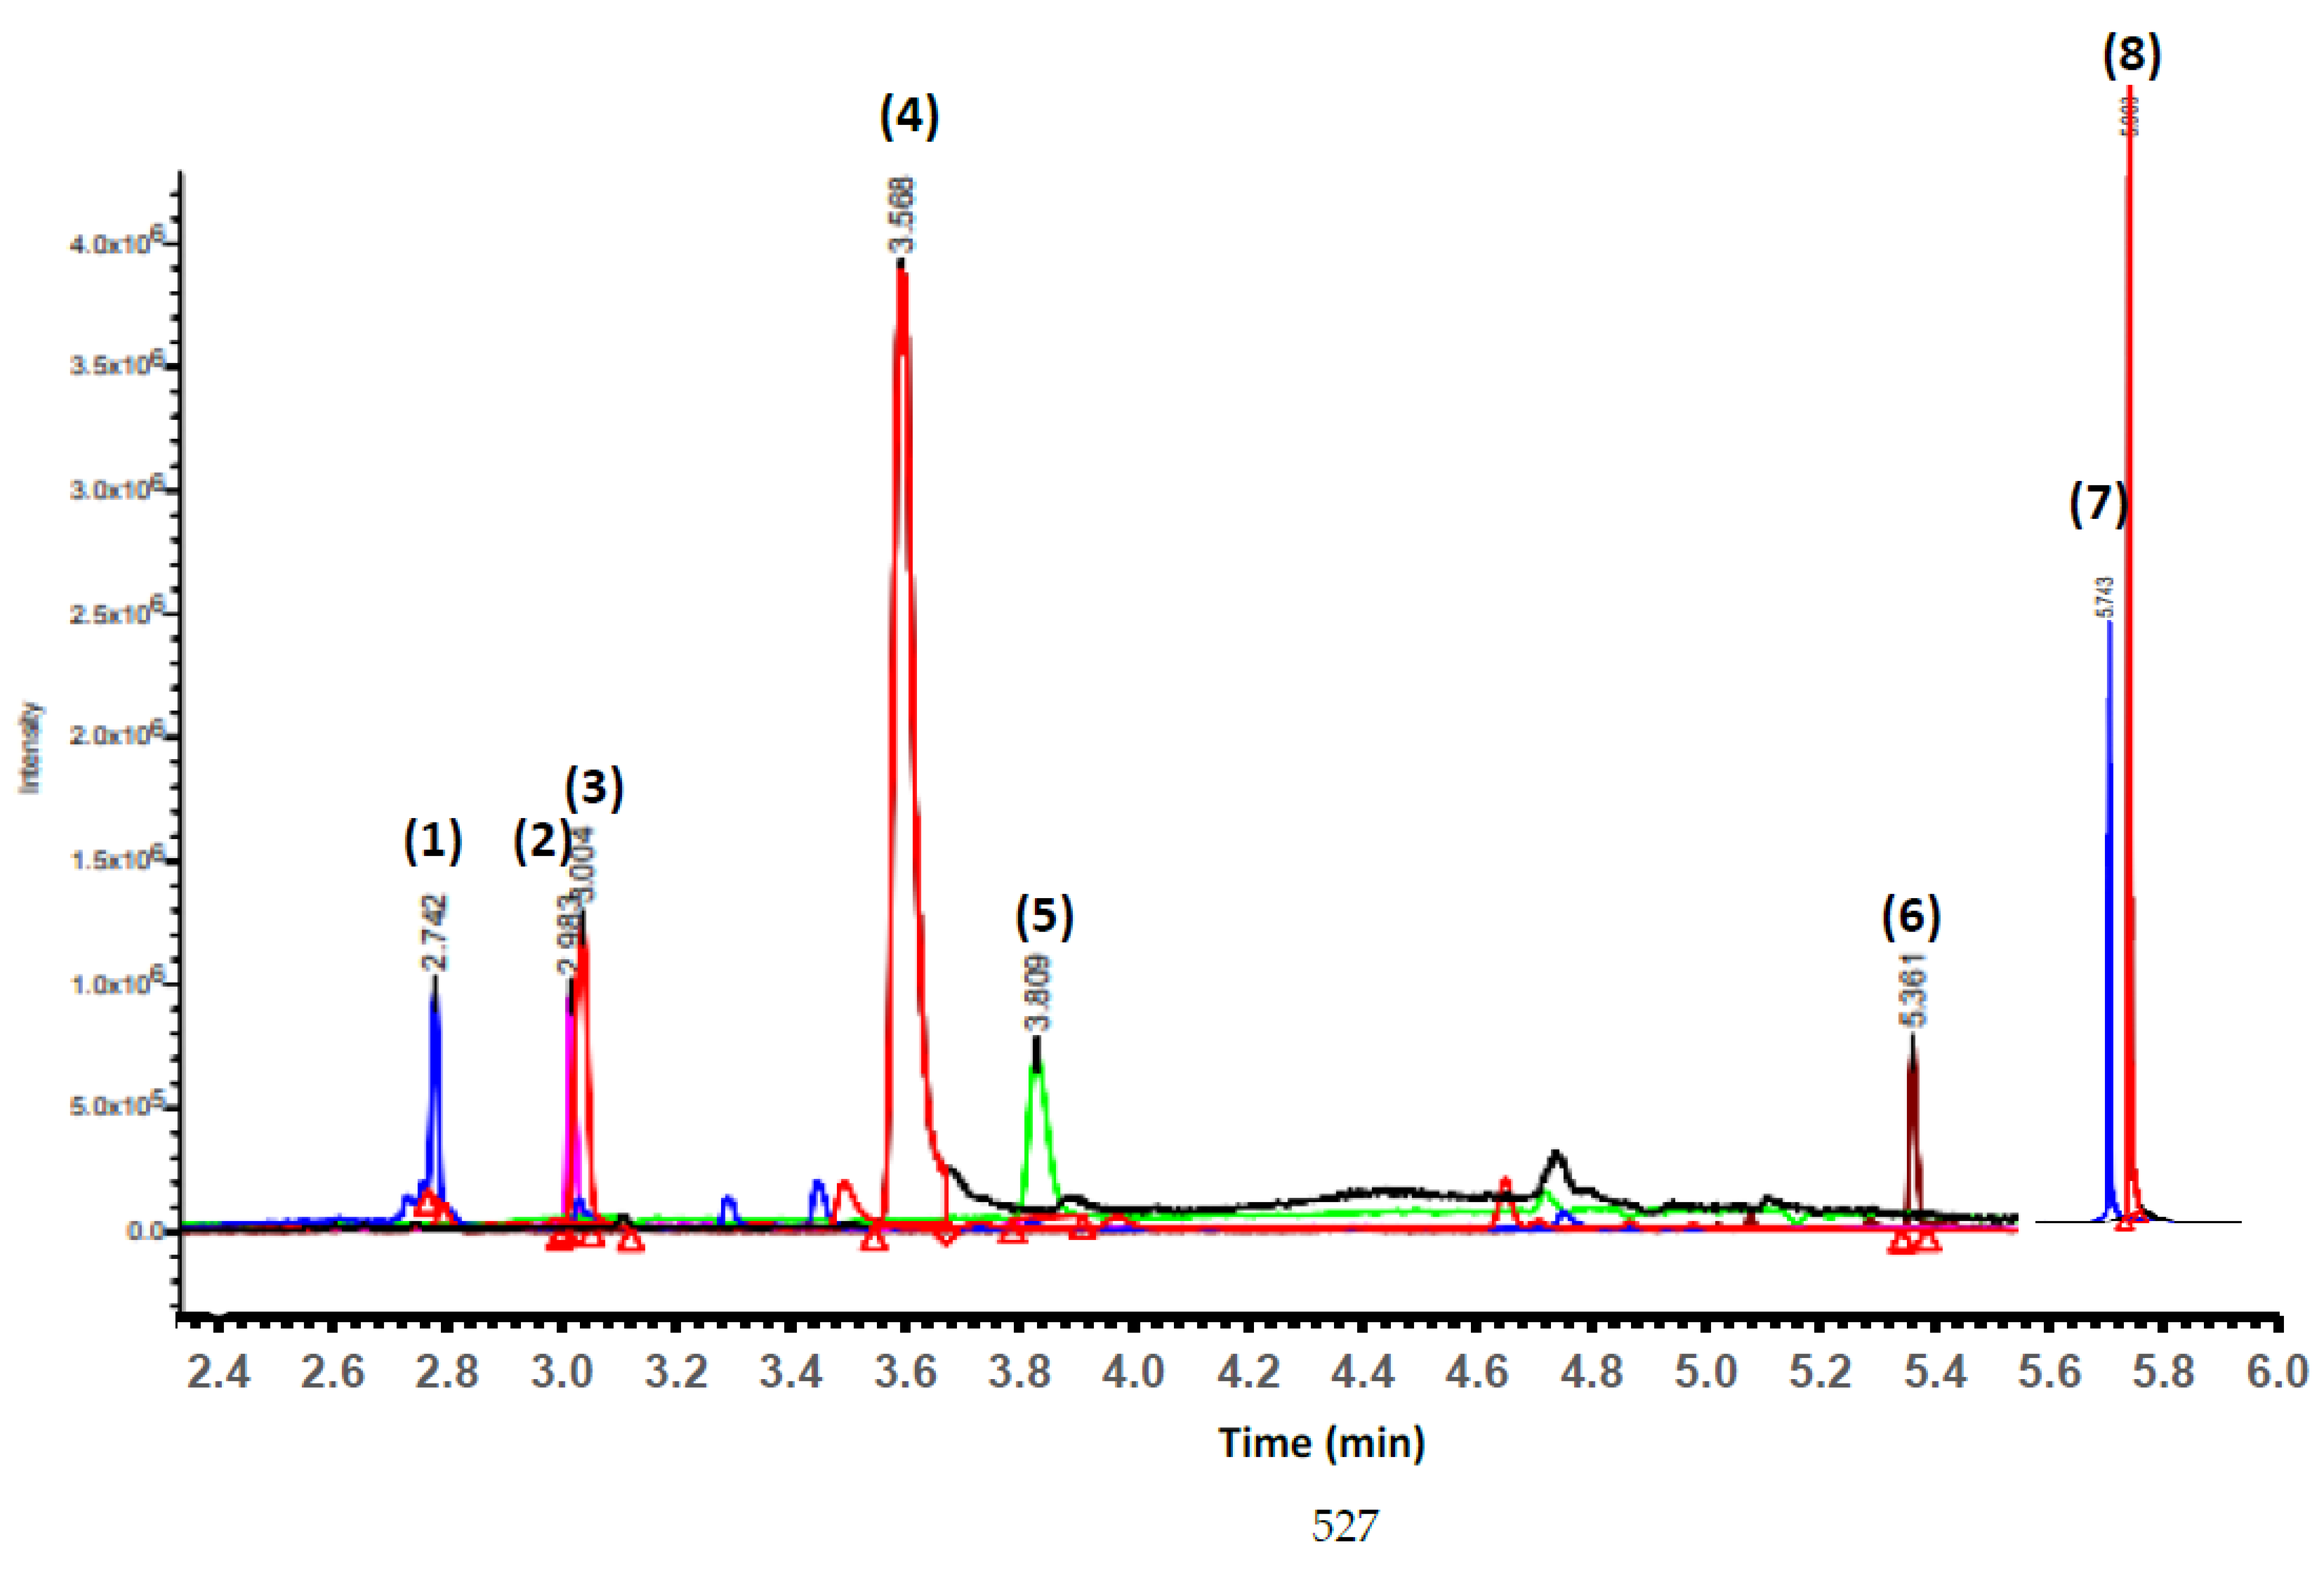
2.11. Analysis of Biocompounds of PCPC and Hydrolysates (GH25, DH25, GH35 and DH35) by Reversed-Phase Ultra-Performance Liquid Chromatography–Mass Spectrometry (RP-UPLC-MS) Technique

PCPC and hydrolysates samples were diluted 10-fold with distilled deionized water, vortexed and centrifuged at 5000× g for 5 min. Then, 1 mL of the supernatant was removed and filtered through a 0.45 µM polyvinylidene difluoride (PVDF) membrane filter into vials. Phenolic components of low molecular weight were measured by the RP-UPLC-MS technique. UPLC-MS on an Acquity H-Class UPLC-QDa Mass Detector (Waters Corporation, Milford, MA, USA) with electrospray ionization interface was used. The samples were analyzed using a column ACQUITY UPLC® BEH C18 (Waters 2.1 mm× 50 mm × 1.7 µm of particle size) at 45 °C. Prefilters of 0.2 μm installed in front of the column were used for this analysis. Extracts of 10 µL volume were injected and eluted at 0.8 mL/min with a linear gradient from 1 to 95% of solvent B (methanol) in solvent A (Milli-Q water) for 5.5 min, then under an isocratic mode (95% of solvent B) for 1 min and finally returned to the initial conditions. The mass spectrometer, operated in a positive mode, was set up to scan the daughter ion of 50 to 650 m/z. The optimized mass spectrometry parameters used were as follows: capillary voltage, 0.8 kV; cone voltage, 30 V; collision energy, 15 V; source temperature, 450 °C; and desolvation temperature, 140 °C. Nitrogen was used as the desolvation and cone gas with a flow rate of 760 L/h. Argon was used as the collision gas at a flow rate of 0.1 mL/min. ACQUITY QDa detector was used. Catechin, epicatechin, quercetin, acid gallic standards were used as settings for the selected ion response (SIR) monitoring of each component. Data acquisition and analysis were performed using the Empower 3.0 software (Waters Co. Milford, MA, USA) [35].

2.12. Functional Properties of PCPCs and Gastrointestinal Hydrolysates

The functional properties of PCPCs and gastrointestinal hydrolysates were evaluated according to the methods described by Quinteros et al. [30]. Protein solubility (%PS), water absorption capacity (%WAC) and oil absorption capacity (%OAC) were determined.

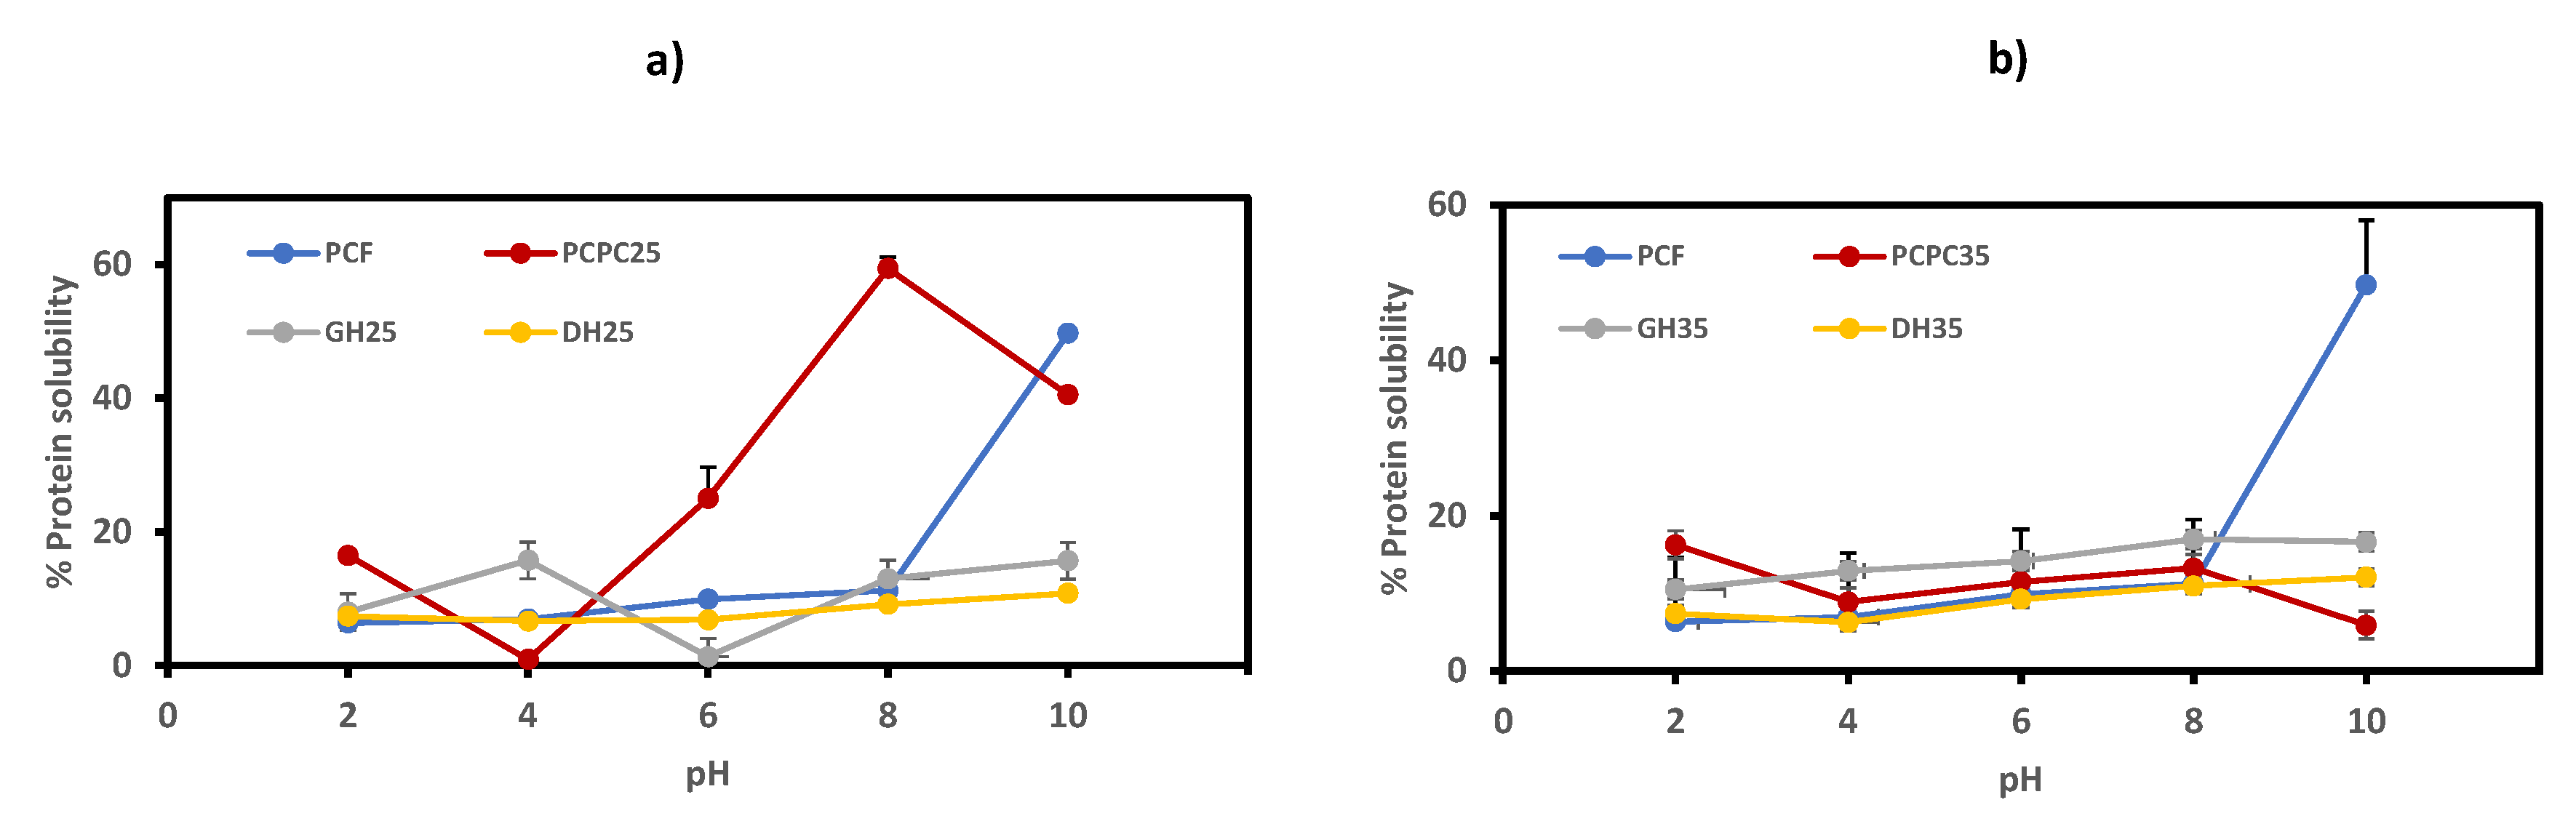
2.12.1. Protein Solubility (PS)

PCPCs and their gastrointestinal hydrolysates (0.2% w/v, based on weight protein content of each sample) were dissolved in distilled deionized water, and the pH of the suspension was adjusted to pH 2.0, 4.0, 6.0,8.0 and 10.0 using solutions 0.025 N HCl and NaOH. The suspensions were shaken for 1 h and centrifuged at 10,000× g for 15 min using a centrifuge (Eppendorf 5804 R, Hamburg, Germany). The content of protein in the supernatant was determined by the bicinchoninic acid (BCA) protein assay kit (Thermo Fisher Scientific, Waltham, MA, USA) using bovine serum albumin (BSA) standard protein at different concentrations (0.125 to 2.0 mg/mL). PS was calculated as follows:
% PS = (protein content of supernatant/total protein content in the sample) × 100

2.12.2. Oil Absorption Capacity (OAC)

PCPCs and their gastrointestinal hydrolysates were dissolved in sunflower oil (1:10 w/v, ratio) in a pre-weighed tube. The suspensions were homogenized for 1 min using a vortex and then every 5 min until 30 min. Then, the suspensions were centrifuged at 2000× g for 15 min using a centrifuge (Eppendorf 5804 R, Hamburg, Germany). Then, the oil was drained, and the tube was tilted for 10 min and weighed. The %OAC results were calculated using Equation (5):
(%) OAC = [(weight sample + oil/weight sample] × 100

2.12.3. Water Absorption Capacity (WAC)

PCPCs and their gastrointestinal hydrolysates were dissolved in distilled deionized water at (1:10, w/v) ratio in a pre-weighed tube. The mixture was homogenized for 30 s every 10 min 5 times. Then, the mixture was centrifuged at 4000× g for 20 min using a centrifuge (Eppendorf 5804 R, Hamburg, Germany). The tubes were drained at a 45° angle for 10 min and then weighed. The %WAC was calculated using Equation (6):
(%) WAC = [(W2 −W1)/W0] × 100
where W0 is the weight of the sample, W1 is the weight of the centrifuge tube with the sample, and W2 is the weight of the centrifuge tube with the sediments.

2.13. Evaluation of Antioxidant Activity of PCPC and Hydrolysates (GH25, DH25, GH35 and DH35)

2.13.1. Ferric-Reducing Antioxidant Power (FRAP) Method

The FRAP reagent was prepared by mixing 25 mL of 300 mM sodium acetate buffer at pH 3.60 plus 2.50 mL of 10 mM TPTZ diluted in 40 mM HCl plus 2.50 mL of 20 mM ferric chloride hexahydrate. An amount of 900 µL of the FRAP reagent was mixed with 90 µL of distilled deionized water and 30 µL of PCPC and hydrolysates. The mixture was incubated in the dark at 37 °C for 30 min. It was then centrifuged at 1000× g for 5 min. Finally, the absorbance of the samples was measured at 593 nm. The trolox standard was used to made a calibration curve (100–500 µmol), and the curve that was obtained was y = 0.0017x − 0.149, R2 = 0.9976. The antioxidant activity data measured by FRAP were expressed as µmol trolox equivalents (TE)/g, dry weight (DW) [36].

2.13.2. 2.2′-Azinobis (3-Ethyl-benzothiazoline-6-sulfonic acid) Cation Bleaching ABTS Method

PCPCs and hydrolysates (200 μL) were mixed with 3800 μL of the ABTS solution (7 mM ABTS solution plus 2.45 mM potassium persulfate solution in a 1:1 ratio). The mixture was incubated for 45 min in darkness. Then, the mix was diluted by adding a phosphate buffer (pH 7.0) until an absorbance of 1.10 ± 0.01 at 743 nm was obtained. The Trolox standard solution (0 μmol to 500 μmol) was used as a standard curve to determine the concentrations of the antioxidant. The standard curve obtained was y = 0.014x + 0.2169, R2 = 0.9931. The results of antioxidant activity by ABTS assays were expressed as μmol of TE/g DW [37].

2.13.3. 2,2-Diphenyl-1-Picrylhydrazyl (DPPH) Radical Scavenging Assay

The antioxidant activity of PCPCs and hydrolysates was measured by the DPPH method described by Boeri et al. (2019). Trolox standard was used as the reference standard curve (0–800 µmol Trolox/L), and the calibration curve was obtained (y = 0.0007x, R2 = 0.9997). All assays were performed three times (n = 3). The results obtained were represented as µmol TE/g DW [38].

2.14. Statistical Analysis

The results were expressed in the manuscript as mean ± standard deviation (SD). All trials had three replicates (n = 3). Statistical differences of the samples used in this study were evaluated with one-way ANOVA analysis (p < 0.05) followed by the Tukey test. The statistical differences were expressed with different superscript letters in the tables and figures. This statistical analysis was performed with the help of Stargraphics software.

3. Results and Discussion

3.1. Analysis of Profile Protein of PCPC and Hydrolysates (GH25, DH25, GH35 and DH35)

Figure 1 shows the protein profile of purple corn flour, PCPC25, PCPC335 and their gastrointestinal hydrolysates. The protein profile of purple corn flour shows bands with a range from 19.99 to 64.31 kDa, while PCPC25 and PCPC35 show a protein profile with bands between 18.56 kDa and 321.27 kDa. The gel documenter appreciates the absence of bands in the gastric and duodenal hydrolysates of the two PCPCs. The bands 19.99 kDa, 25.84 kDa and 47.55 kDa are found in purple corn flour, PCPC25 and PCPC35. The bands expressing the highest intensity in gels are the bands of 18.56 kDa and 19.99 kDa present in the PCPCs. In a previous work, Vilcacundo et al. [27] described the protein profile of PCPC. The PCPCs protein profile was characterized by the presence of six bands with molecular weights of 14.50 kDa, 20.12 kDa, 25.18 kDa, 41.85 kDa, 59.59 kDa and 65.87 kDa. These PCPCs were germinated for 72 h at 15, 20, 25, 30, 34 and 40 °C and were obtained at alkaline pH 8.0 and precipitation pH 4.0. In this study, the PCPCs were germinated for 5 days at 25° and 35 °C and obtained at alkaline pH 8.0 and precipitation pH 5.0. These differences in the process of obtaining PCPCs can generate different proteins. The protein content of corn kernels is largely composed of prolamin or zein proteins (40%), followed by glutelin proteins (30%), with low amounts of globulin and albumin proteins (5%) [39,40]. Zein proteins have four subfamilies, named α (19 kDa and 22 kDa), γ (50 kDa, 27 kDa and 16 kDa), β (15 kDa) and δ (18 kDa and 10 kDa) [41,42,43].
Gastrointestinal hydrolysates of PCPC25 and PCPC35 were also analyzed by SDS-PAGE. The gel photodocumenter did not record any bands in the gastric and duodenal hydrolysates of both samples. In general, the protein profile clearly changed due to the conditions of gastrointestinal digestion. Even so, a band of less than 10 k Da can be seen. Wu et al. [44] described the protein profile of SPI, SPIH1, SPIH2 and SPIH3 using the HPLC technique. They found that SPI presented peaks corresponding mainly to molecular weight above 10 kDa, and the hydrolysates presented peaks corresponding to molecular weight above 10 kDa with percentages of 45.26%, 26.26% and 12.11%, respectively. Peaks corresponded to 1–5 kDa for SPI (5.39%), SPIH1 (26.27%), SPIH2 (37.34%) and SPIH3 (36.23%). It can be seen that the hydrolysates mainly presented low molecular weight proteins. The protein profile of the hydrolysates is affected by the hydrolysis conditions (type of enzymes, pH, temperature and time). The percentage of hydrolysis is also a determining factor in the protein profile, and this depends on the set of hydrolysis conditions.

3.2. Elemental Composition of PCPCs and Hydrolysates and Quantification of % Hydrolysis of Hydrolysates (GH25, DH25, GH35 and DH35)

An elemental analysis of the samples was performed. The percentage of hydrolysis was determined and calculated in the gastrointestinal hydrolysates of PCPC (Table 1). The percentage of carbon presented very high values in PCF, PCPC25 and PCPC35; the same occurred for the percentage of hydrogen. Meanwhile, the percentage of sulphur was high for the PCPC25, DH25 and PCPC35 samples. The percentage of nitrogen presented the highest values for PCPC25 and PCPC35 (7.81%N and 7.31%N) without significant differences between them. Gastric and duodenal hydrolysates presented no significant differences between them when comparing their % hydrolysis. GH25 and DH25 presented values of 77.24% and 78.61%DH. GH35 and DH35 presented percentages of 76.23 %DH and 76.64%DH. Statistical analysis revealed no statistical differences when comparing the four hydrolysates among themselves. The hydrolysis percentage values for the four hydrolysates were high. Vivas et al. [45] described the percentage digestibility of the yellow maize meal. The gastric hydrolysate presented a value of 42.8%DH. The digestibility percentage was calculated using the nitrogen percentage of the samples and the hydrolysate. The values of our study were higher. Kiers et al. [46] have described differences in the percentage of defatted and non-defatted fermented white corn for seven varieties. The flour was subject to a gastrointestinal hydrolysis process with pepsin (pH 4.0 for 60 min) and pancreatin (pH 6.0 for 30 min). They found values for defatted samples ranging from 24.1 to 67.1%DH, and for non-defatted samples, values of 20.8–65.0% hydrolysis. Our hydrolysis percentage values were higher than those previously described, which may be due to differences in the samples and differences in the digestion process.
The percentage of hydrolysis can be important to determine the protein profile and to influence its biological activities because, depending on the degree of hydrolysis, peptides of different sizes and with different charges will be formed. Depending on the size and amount of the peptide available, interactions between peptides/polyphenols could occur; these interactions are not always as expected.

3.3. Content of Phenol Compounds of PCPCs and Gastrointestinal Hydrolysates (GH25, DH25, GH35 and DH35)

The PCPCs contents of the phytocomponents and their gastrointestinal hydrolysates were determined (Table 2). PCPC35 presented the highest values of TFLC (11091.37 mg RE/100 g DW) and TFL (7975.59 mg RE/100 g DW). The highest TAC values were presented by PCPC35 with a value of 1620.24 mg Cy3GE/g DW, followed by flour (1609.59 mg Cy3GE/g DM) and PCPC25 (1157.35 mg Cy3GE/g DW). The lowest values were obtained in the hydrolysates with a range of 66.52–181.45 mg Cy3GE/g DW. A very important decrease in the concentration of TAC was observed in all the hydrolysates when compared to the purple corn flour and the concentrates. Galvez-Ranilla et al. [47] have reported the TAC content in Peruvian purple corn (310.04 mg Cy3GE/g DW). Lopez-Martinez et al. [48] have reported the TAC content of four varieties of purple corn (purple, AREQ516540TL, Veracruz 42 and Oaxaca 337 IG04 PV) from Mexico with values of (93.2; 850; 389; and 131 mg Cy3-glu/100 g, DW), respectively. Mendoza-Mendoza et al. [49] have reported the TAC content of 52 varieties of purple corn from Mexico with ranges of 0.0398 to 0.2398 g of Cy3-glu/100 g DW. Zhang et al. [50] have reported the content of TAC in 20 varieties of purple maize extracts obtained from the pericarp of maize. They reported values ranging from 12.8 to 93.5 mg C3GE/g, DW. Cuevas-Montilla et al. [51] reported the TAC (0.02–0.7 mg C3GE/g DW) present in nine Bolivian purple maize varieties. Žilić et al. [52] have reported the content of TPC in six colored maize varieties with values of 4.5–10.5 mg GAE/g, DW, with low values of TAC (0.003–0.7 mg C3GE/g DW). Lao et al. [5] have reported the TAC content of 14 varieties of purple corn with values between 3.1 and 100.3 mg C3G/g DW purple corn powder.
The TAC values reported in this study were higher than those described by the previously cited studies. The hydrolysates presented lower TAC values than those described in the literature. When the values of the four phytocomponents present in PCPCs are compared to the values obtained by the hydrolysates, a strong decrease in the contents is observed. The TPA content was also calculated in the samples. It was found that TPA presented high and similar values for purple corn flour, PCPC25 and PCPC35. The hydrolysates presented the lowest values. The statistical analysis shows significant differences between purple corn flour and PCPC25. Significant statistical differences are also seen between the gastric and duodenal hydrolysate of PCPC35. The statistical analysis shows that there are statistical differences between the values of the four phytocompounds of PCPCs and the values of the hydrolysates.
Approdu et al. [53] have reported the thermal degradation of anthocyanins in purple corn extracts. They found that as the heating temperature of purple corn extracts increased, the TAC content decreased. The TAC content of the non-thermally treated samples was 520.42 mg C3G/g DW. Additionally, the TAC extracts from purple corn were subject to simulated gastrointestinal digestion with pepsin (pH 2.0 for 20, 40, 60, 80, 100 and 120 min) and pancreatin (pH 7.0 for 20, 40, 60, 80, 100 and 120 min), observing a decrease of 21% in the TAC content in non-thermally treated extracts after 120 min of gastric digestion. Extracts heat treated at 80 °C lost 60% of the TAC content after 120 min of duodenal digestion. Extracts heat treated at 120 °C lost 83% of the TAC content. In the present study, the content of the TAC decreased in the gastrointestinal hydrolysates of purple corn, as in the previous case. In this study, in the simulated gastrointestinal heating digestion, the enzymes were blocked by heat treatment at 90 °C for 10 min. This thermal treatment could affect the stability of the phenolic compounds in the samples. On the other hand, it is known that anthocyanins are stable at acidic pH and very unstable at basic pH [54]. Cevallos-Casals et al. [55] indicated that anthocyanins are unstable molecules and susceptible to degradation due to the effects of temperature, pH, enzymes, light and oxygen radicals. All these factors can affect its stability and color intensity [56]. The stability of these molecules depends on their chemical structure [57]. The phenolic compounds measured in this study decreased their content in the hydrolysates, which may suggest that the hydrolysis conditions (pH, enzymes, hydrolysis time, heating to block the enzymes) affect the stability of the said components, and their content is affected in the process samples of purple corn hydrolysates.

3.4. Identification of Phenolic Acid and Flavonol Compounds of PCPC and hydrolysates

Table 3 shows the phenol acids and flavonoids identified in purple corn flour and PCPCs using UPLC-Da. The compounds were identified with the help of their respective standards, retention times and by their mass/charge. Figure 2 shows the chromatogram of the identified compounds with their respective retention times. Eight phenolic compounds were identified (six flavonols and two phenol acids). The eight compounds were only identified in purple corn flour, PCPC25 and PCPC35. It was not possible to identify these molecules in any of the gastrointestinal hydrolysates. Catechin, quercetin, taxifolin are flavonols that were described in corn samples. Two acid phenols were identified: p-coumaric acid 4-O-glucoside and gallic acid 4-O-glucoside derived from p-coumaric acid and gallic acid, respectively. The p-coumaric acid and gallic acid are compounds that have been described in the literature as typical phenols from corn-derived samples. The hydrolysates presented very low contents of all the phytocomponents and could be present in very low concentrations. They could contain other derivatives of these molecules with molecular weights below or above the spectrum of mass spectrometer analysis.
Pedreschi et al. [58] indicated that quercetin derivatives are the most abundant phenolic compounds (non-anthocyanin) in purple corn, followed by ferulic and p-coumaric acid derivatives. Different authors have identified and quantified phenolic compounds and flavonoids from purple corn (kernel and pericarp) of various species. Among the identified compounds are mainly anthocyanins (cy-3-gluc, pg-3-gluc, pn-3-gluc, cy-3-malonylglu, pg-3-malonylglu, pn-3-malonylglu, condensed form), phenolic acids (ferulic acid, caffeic acid, gallic acid, p-coumaric acid, vanillic acid, sinapic acid and chlorogenic acid) and flavonoids (quercetin, catechin, naringenin glucoside, rutin, kaempferol, taxifolin, luteolin and morin) [1,59,60,61,62].
In corn plants, the presence of flavone O-glycosides, such as apigenin 7-O-glucoside and 6,4-dihydroxy-3-methoxyflavone-7-O-glucoside, has been described by different authors [63,64,65,66]. It is known that plants accumulate flavonoid compounds in their vacuoles as derivatives of O-glycosides, but some plants, such as gymnosperms and various angiosperms, also produce C-glycosides from flavonoids [67,68]. Specifically, cereals produce flavonoid C-glycosides, such as flavone C-glycosides. In corn, C-glycosyl flavones are involved in protection against UV-B radiation and in defense against pathogens [69]. Maysin, the predominant C-glycosyl flavone in the tissues of some maize varieties, is a natural insecticide against the armyworm Helicoverpa zea [70].

3.5. Evaluation of Functional Properties

3.5.1. Protein Solubility (PS) of Purple Protein Corn Concentrate (PCPC) and Hydrolysates (GH25, DH25, GH35 and DH35)

The solubility of proteins evaluated at different pH values represents an indicator of the performance of flours, concentrates and protein isolates when they are used in food products, and it provides information on the degree of denaturation of proteins during chemical and thermal treatments in industrial processes of food products.
Figure 3 shows the results of %PS of the samples tested in the study. PCPC25 presents higher values of PS at pH 2.0, 6.0 and 8.0. At pH 10, it presents a high and similar percentage to PCF with values of 40.54% and 49.74%, respectively. At pH 4.0, the difference between the %PS of PCPC and PCF is due to the denaturation of the proteins during the removal of fat in the alkaline extraction process, the chemical treatments applied in the protein purification and during the sample lyophilization process. PCPC35, hydrolysates and PCF have very similar %PS values at pH 2.0–8.0. PCPC25 was the sample with the best result for this functional property. In this way, its possibilities for use as a functional ingredient in other products are extended. Paraginski et al. [71] have described a 47.2% PS of yellow corn flour; the PS values of purple corn flour reported in this study are in agreement with those previously described for yellow corn flour. There are few studies on the PS of PCF and its derivatives, such as PI, PC and hydrolysates.

3.5.2. Quantification of %WAC and %OAC of PCPC25, PCPC35 and Hydrolysates (GH25, DH25, GH35 and DH35)

Table 4 shows the results of the functional properties of %WAC and %OAC. PCF, PCPC25 and PCPC35 presented similar percentages of WAC, and the statistical analysis revealed no significant differences. The hydrolysates presented lower values of %WAC when compared to the data obtained for the concentrates and the flour. This same situation is observed with the PCF oil absorption capacity; PCPC25 and PCPC35 presented the highest values of %AOC. When comparing the PCPC data and the hydrolysates, significant statistical differences are observed (p < 0.05). This functional property may also be important for the use of the concentrates as functional ingredients. Akaffou et al. [72] have described %WAC of yellow and purple corn flours, called yellow corn, dark purple corn, light purple red corn and, light purple corn from Pakistan with values of 70.59, 70.38, 69.24 and 69.35 %WAC and 131, 130, 128 and 128%AOC, respectively. Our %WAC and %OAC values are below those values. This difference could be due to the characteristics of the maize varieties studied. Gong et al. [73] have described % water absorption index (%WAI) and %OAC of germinated yellow corn flours. The %OAC values were in the range of 18.7–20.5%OAC. These values are consistent with those reported in our study. The non-germinated corn flour presented a %WAC value of 25.1. This value is consistent with those reported in this study for the samples tested.

3.6. Antioxidant Activity of PCPC and Gastrointestinal Hydrolysates

Table 5 shows the results of the antioxidant activity of PCF, PCPC25, PCPC35 and their gastrointestinal hydrolysates evaluated with the ABTS, FRAP and DPHH methods. The standards of three flavonoids (rutin, catechin and quercetin) and an acid phenol (gallic acid) were used as positive controls. It was observed that PCF presented the highest values of antioxidant activity with the three methods used. Its antioxidant activity was higher against the four positive controls. PCPC25 and PCPC35 presented high values of antioxidant activity with the three methods (ABTS, FRAP and DPPH) compared to the values of the hydrolysates. Approdu et al. [53] have evaluated the antioxidant activity using the in vitro DPPH method of purple corn samples subject to gastrointestinal digestion (pepsin, pH 2.0 and pancreatin, pH 7.0) previously treated with heat (80, 100 and 120). They found that the antioxidant activity of the control extracts (not heat treated) decreased their antioxidant activity by 14% for the gastric phase and 24% for the duodenal phase after 120 min of digestion. Gastric digestion showed a decrease in antioxidant activity with ranges between 7% and 14%. However, the thermally treated samples significantly decreased their antioxidant activity with a range between 24% and 78% DPPH, indicating that this loss of antioxidant activity was related to the loss of anthocyanins in the hydrolysates. In the present study, the antioxidant activity of all the hydrolysates decreases compared to the activity of the flour and PCPCs. Our hydrolysates have a low content of all the determined phenolic compounds. Therefore, the decrease in antioxidant activity may be related to the loss of these components.
Wu et al. [44] have described the interactions between soy protein isolate hydrolysate (SPIH) and cyanidin-3-O-glucoside (C3G) and their effect on the antioxidant activity evaluated by the ABTS and DPPH methods. They found differences between the antioxidant activity by ABTS of SPIH3 (41.34%ABTS) and SPIH3-C3G (66.07%ABTS) mix and SPIH3 plus C3G (69.07%ABTS) sum. In general, the protein/polyphenol (SPIH/C3G) interaction significantly (p < 0.05) decreased the antioxidant activity using the mixed-system ABTS and DPPH methods compared to the sum of their individual activities. They indicated that there are interactions between the proteins and polyphenols of the masking/antagonistic type that block the antioxidant capacity of the molecules. They suggested that a possible explanation could be that the composition and structure of the peptides of the hydrolysates interact with the aromatic rings and the hydroxyl groups of C3G, affecting the antioxidant activity. It is clear that the presence of anthocyanins in the hydrolysates affects their antioxidant response. In our study, the content of the TAC in the hydrolysates was low; its presence could produce protein/polyphenols interactions that affected its antioxidant activity.
Ren et al. [74] have described the antioxidant activities of corn protein hydrolysates (CPH) under simulated gastrointestinal digestion. Corn gluten meal was hydrolyzed with the alcalase enzyme, and then, it was subject to simulated gastrointestinal digestion, gastric phase (pepsin for 6 h) and duodenal phase (pancreatin for 10 h). Gastric digestion at 0 min presented 33.5% DPPH, and gastric digestion at 4 h presented 31.5% DPPH. Finally, duodenal digestion at 10 h presented 46.3% DPPH. The increase in the antioxidant activity in the duodenal phase is explained by a greater production of small peptides that are produced with pancreatin. In this study, the hydrolysates from the duodenal phase (DH35) presented a higher antioxidant activity by the FRAP and DPPH methods than the gastric hydrolysates (GH35).

4. Conclusions

Purple corn sprouts allowed obtaining protein concentrates with a high content of phenolic compounds compared to the data reported in the literature, highlighting the high content of TAC in PCPC25 and PCPC35. The gastrointestinal hydrolysates of PCPC presented low contents of all the determined phenolic compounds when compared with non-hydrolyzed PCPCs. The conditions of the in vitro gastrointestinal simulation favored the degradation of these molecules. PCF and PCPCs showed high functional properties (%PS, %WAC and %OAC) and antioxidant activity when using the ABTS, FRAP and DPPH methods. The hydrolysates presented little antioxidant capacity due to the degradation of the biocompounds and the interactions of proteins/polyphenols. Finally, six flavonols and two acid phenols were identified in corn flour, PCPC25 and PCPC35. The characterization of the functional and biological properties of PCPCs and their hydrolysates may be an important aspect for their use in the food industry as a functional ingredient.

Author Contributions

Conceptualization, R.M. and W.C.; methodology, E.V, V.M and H.S.; software, R.M.; validation, E.V., R.M. and V.M.; formal analysis, R.M. and E.V.; investigation, E.V.; data curation, E.V.; writing—original draft preparation, W.C. and A.G.; writing—review and editing, W.C. and A.G.; visualization, W.C.; supervision, A.G. and W.C.; project administration, W.C. and A.G.; funding acquisition, E.V. All authors have read and agreed to the published version of the manuscript.

Funding

This research received no external funding.

Data Availability Statement

Not applicable.

Acknowledgments

The authors thank the Debt Swap project (Spain–Ecuador) of the Bolívar State University.

Conflicts of Interest

The authors declare no conflict of interest.

References

  1. Salvador-Reyes, R.; Clerici, M.T.P.S. Peruvian Andean maize: General characteristics, nutritional properties, bioactive compounds, and culinary uses. Food Res. Int. 2020, 130, 108934. [Google Scholar] [CrossRef] [PubMed]
  2. Moreira, R.; Chenlo, F.; Arufe, S.; Rubinos, S.N. Physicochemical characterization of white, yellow and purple maize flours and rheological characterization of their doughs. J. Food Sci. Technol. 2015, 52, 7954–7963. [Google Scholar] [CrossRef]
  3. Rouf Shah, T.; Prasad, K.; Kumar, P. Maize-A potential source of human nutrition and health: A review. Cogent Food Agric. 2016, 2, 1166995. [Google Scholar] [CrossRef]
  4. FAOSTAT. Food and Agriculture Organization Corporate Statistical Database. 2022. Available online: http://faostat.fao.org (accessed on 20 May 2022).
  5. Lao, F.; Giusti, M.M. Quantification of purple corn (Zea mays L.) anthocyanins using spectrophotometric and HPLC approaches: Method comparison and correlation. Food Anal. Methods 2016, 9, 1367–1380. [Google Scholar] [CrossRef]
  6. FAO. Traditional High Andean Cuisine. 2013. Available online: http://www.fao.org/docrep/018/i1466e/i1466e.pdf (accessed on 21 May 2022).
  7. Suriano, S.; Balconi, C.; Valoti, P.; Redaelli, R. Comparison of total polyphenols, profile anthocyanins, color analysis, carotenoids and tools in pigmented maize. LWT Food Sci. Technol. 2021, 144, 111257. [Google Scholar] [CrossRef]
  8. Rahman, M.M.; Rahaman, M.S.; Islam, M.R.; Rahman, F.; Mithi, F.M.; Alqahtani, T.; Almikhlafi, M.A.; Alghamdi, S.Q.; Alruwaili, A.S.; Hossain, M.S.; et al. Role of phenolic compounds in human disease: Current knowledge and future prospects. Molecules 2021, 27, 233. [Google Scholar] [CrossRef] [PubMed]
  9. Ávila-Román, J.; Soliz-Rueda, J.R.; Bravo, F.I.; Aragonès, G.; Suárez, M.; Arola-Arnal, A.; Mulero, M.; Salvadó, M.-J.; Arola, L.; Torres-Fuentes, C.; et al. Phenolic compounds and biological rhythms: Who takes the lead? Trends Food Sci. Technol. 2021, 113, 77–85. [Google Scholar] [CrossRef]
  10. Mahfuz, S.; Shang, Q.; Piao, X. Phenolic compounds as natural feed additives in poultry and swine diets: A review. J. Anim. Sci. Biotechnol. 2021, 12, 1–18. [Google Scholar] [CrossRef] [PubMed]
  11. Kalman, D.S. Amino acid composition of an organic brown rice protein concentrate and isolate compared to soy and whey concentrates and isolates. Foods 2014, 3, 394–402. [Google Scholar] [CrossRef]
  12. Gharibzahedi, S.M.T.; Smith, B. Effects of high hydrostatic pressure on the quality and functionality of protein isolates, concentrates, and hydrolysates derived from pulse legumes: A review. Trends Food Sci. Technol. 2021, 107, 466–479. [Google Scholar] [CrossRef]
  13. Jia, W.; Rodriguez-Alonso, E.; Bianeis, M.; Keppler, J.K.; Van der Goot, A.J. Assessing functional properties of rapeseed protein concentrate versus isolate for food applications. Innov. Food Sci. Emerg. Technol. 2021, 68, 102636. [Google Scholar] [CrossRef]
  14. Morr, C.V.; Ha, E.Y.W. Whey protein concentrates and isolates: Processing and functional properties. Crit. Rev. Food Sci. Nut. 1993, 33, 431–476. [Google Scholar] [CrossRef] [PubMed]
  15. Wang, H.; Johnson, L.A.; Wang, T. Preparation of soy protein concentrate and isolate from extruded-expelled soybean meals. J. Ame. Oil Chem. Soc. 2004, 81, 713–717. [Google Scholar] [CrossRef]
  16. Kumar, R.; Chauhan, S.K.; Shinde, G.; Subramanian, V.; Nadanasabapathi, S. Whey Proteins: A potential ingredient for food industry—A review. Asian J. Dairy Food Res. 2018, 37, 283–290. [Google Scholar]
  17. Singh, P.; Kumar, R.; Sabapathy, S.N.; Bawa, A.S. Functional and edible uses of soy protein products. Compr. Rev. Food Sci. Food Saf. 2008, 7, 14–28. [Google Scholar] [CrossRef]
  18. Malav, O.P.; Talukder, S.; Gokulakrishnan, P.; Chand, S. Meat analog: A review. Crit. Rev. Food Sci. Nut. 2015, 55, 1241–1245. [Google Scholar] [CrossRef]
  19. O′ Flynn, T.D.; Hogan, S.A.; Daly, D.F.; O′ Mahony, J.A.; McCarthy, N.A. Rheological and solubility properties of soy protein isolate. Molecules 2021, 26, 3015. [Google Scholar] [CrossRef]
  20. Momen, S.; Alavi, F.; Aider, M. Alkali-mediated treatments for extraction and functional modification of proteins: Critical and application review. Trends Food Sci. Technol. 2021, 110, 778–797. [Google Scholar] [CrossRef]
  21. Yang, J.; Zamani, S.; Liang, L.; Chen, L. Extraction methods significantly impact pea protein composition, structure and gelling properties. Food Hydrocol. 2021, 117, 106678. [Google Scholar] [CrossRef]
  22. Wu, L.; Li, J.; Wu, W.; Wang, L.; Qin, F.; Xie, W. Effect of extraction pH on functional properties, structural properties, and in vitro gastrointestinal digestion of tartary buckwheat protein isolates. J. Cereal Sci. 2021, 101, 103314. [Google Scholar] [CrossRef]
  23. Khalesi, M.; FitzGerald, R.J. In vitro digestibility and antioxidant activity of plant protein isolate and milk protein concentrate Blends. Catalysts 2021, 11, 787. [Google Scholar] [CrossRef]
  24. Henchion, M.; Hayes, M.; Mullen, A.M.; Fenelon, M.; Tiwari, B. Future protein supply and demand: Strategies and factors influencing a sustainable equilibrium. Foods 2017, 6, 53. [Google Scholar] [CrossRef] [PubMed]
  25. Aschemann-Witzel, J.; Gantriis, R.F.; Fraga, P.; Perez-Cueto, F.J. Plant-based food and protein trend from a business perspective: Markets, consumers, and the challenges and opportunities in the future. Crit. Rev. Food Sci. Nutr. 2021, 61, 3119–3128. [Google Scholar] [CrossRef]
  26. Aimutis, W.R. Plant-based proteins: The good, bad, and ugly. Ann. Rev. Food Sci. Technol. 2022, 13, 1–17. [Google Scholar] [CrossRef] [PubMed]
  27. Vilcacundo, E.; García, A.; Vilcacundo, M.; Morán, R.; Samaniego, I.; Carrillo, W. Antioxidant purple corn protein concentrate from germinated Andean purple corn seeds. Agronomy 2020, 10, 1282. [Google Scholar] [CrossRef]
  28. Minekus, M.; Alminger, M.; Alvito, P.; Ballance, S.; Bohn, T.; Bourlieu, C.; Carrière, F.; Boutrou, R.; Corredig, M.; Dupont, D.; et al. A standardised static in vitro digestion method suitable for food–an international consensus. Food Funct. 2014, 5, 1113–1124. [Google Scholar] [CrossRef] [PubMed]
  29. Aboubacar, A.; Axtell, J.D.; Huang, C.P.; Hamaker, B.R. A rapid protein digestibility assay for identifying highly digestible sorghum lines. Cereal Chem. 2001, 78, 160–165. [Google Scholar] [CrossRef]
  30. Quinteros, M.F.; Martínez, J.; Barrionuevo, A.; Rojas, M.; Carrillo, W. Functional, antioxidant, and anti-Inflammatory properties of cricket protein concentrate (Gryllus assimilis). Biology 2022, 11, 776. [Google Scholar] [CrossRef]
  31. Rapisarda, P.; Fanella, F.; Maccarone, E. Reliability of analytical methods for determining anthocyanins in blood orange juices. J. Agric. Chem. 2000, 48, 2249–2252. [Google Scholar] [CrossRef]
  32. Amarowicz, R.; Pegg, R.B. Content of proanthocyanidins in selected plant extracts as determined via n-butanol/HCl hydrolysis and a colorimetric assay or by HPLC-a short report. Polish J. Food Nutr. Sci. 2006, 15, 319. [Google Scholar]
  33. Zhishen, J.; Mengcheng, T.; Jianming, W. The determination of flavonoid contents in mulberry and their scavenging effects on superoxide radicals. Food Chem. 1999, 64, 555–559. [Google Scholar] [CrossRef]
  34. Ramos-Escudero, F.; Muñoz, A.M.; Alvarado-Ortíz, C.; Alvarado, A.; Yáñez, J.A. Purple corn (Zea mays L.) phenolic compounds profile and its assessment as an agent against oxidative stress in isolated mouse organs. J. Med. Food 2012, 15, 206–215. [Google Scholar] [CrossRef] [Green Version]
  35. Racine, K.C.; Lee, A.H.; Wiersema, B.D.; Huang, H.; Lambert, J.D.; Stewart, A.C.; Neilson, A.P. Development and characterization of a pilot-scale model cocoa fermentation system suitable for studying the impact of fermentation on putative bioactive compounds and bioactivity of cocoa. Foods 2019, 8, 102. [Google Scholar] [CrossRef]
  36. Subbiah, V.; Zhong, B.; Nawaz, M.A.; Barrow, C.J.; Dunshea, F.R.; Suleria, H.A. Screening of phenolic compounds in Australian grown berries by LC-ESI-QTOF-MS/MS and determination of their antioxidant potential. Antioxidants 2020, 10, 26. [Google Scholar] [CrossRef]
  37. Boeri, P.; Piñuel, L.; Dalzotto, D.; Monasterio, R.; Fontana, A.; Sharry, S.; Bario, D.A.; Carrillo, W. Argentine Patagonia barberry chemical composition and evaluation of its antioxidant capacity. J. Food Biochem. 2020, 44, e13254. [Google Scholar] [CrossRef]
  38. Samaniego, I.; Brito, B.; Viera, W.; Cabrera, A.; Llerena, W.; Kannangara, T.; Vilcacundo, R.; Angós, I.; Carrillo, W. Influence of the maturity stage on the phytochemical composition and the antioxidant activity of four Andean blackberry cultivars (Rubus glaucus Benth) from Ecuador. Plants 2020, 9, 1027. [Google Scholar] [CrossRef]
  39. Díaz-Gómez, J.L.; Castorena-Torres, F.; Preciado-Ortiz, R.E.; García-Lara, S. Anti-Cancer Activity of Maize Bioactive Peptides. Front. Chem. 2017, 5, 44. [Google Scholar] [CrossRef] [PubMed]
  40. Wang, L.; Xu, C.; Qu, M.; Zhang, J. Kernel Amino acid composition and protein content of introgression lines from Zea mays Ssp. Mexicana into cultivated maize. J. Cereal Sci. 2008, 48, 387–393. [Google Scholar] [CrossRef]
  41. Wu, Y.; Messing, J. Proteome balancing of the maize seed for higher nutritional value. Front. Plant Sci. 2014, 5, 240. [Google Scholar] [CrossRef]
  42. Esen, A. A proposed nomenclature for the alcohol-soluble proteins (zeins) of maize (Zea mays L.). J. Cereal Sci. 1987, 5, 117–128. [Google Scholar] [CrossRef]
  43. Coleman, C.E.; Larkins, B.A. The prolamins of maize. In Seed Proteins; Shewry, P.R., Casey, R., Eds.; Kluwer Academic Publishers: Dordrecht, The Netherlands, 1998; pp. 109–139. [Google Scholar]
  44. Wu, Y.; Yin, Z.; Qie, X.; Chen, Y.; Zeng, M.; Wang, Z.; Qin, F.; Chen, J.; He, Z. Interaction of soy protein isolate hydrolysates with cyanidin-3-O-glucoside and its effect on the in vitro antioxidant capacity of the complexes under neutral condition. Molecules 2021, 26, 1721. [Google Scholar] [CrossRef] [PubMed]
  45. Vivas, N.E.; Waniska, R.D.; Rooney, L.W. Effect of tortilla production on proteins in sorghum and maize. Cereal Chem. 1987, 64, 384–389. [Google Scholar]
  46. Kiers, J.L.; Nout, R.M.J.; Rombouts, F.M. In vitro digestibility of processed and fermented soya bean, cowpea and maize. J. Sci. Food Agric. 2000, 80, 1325–1331. [Google Scholar] [CrossRef]
  47. Galvez Ranilla, L.; Christopher, A.; Sarkar, D.; Shetty, K.; Chirinos, R.; Campos, D. Phenolic composition and evaluation of the antimicrobial activity of free and bound phenolic fractions from a Peruvian purple corn (Zea mays L.) accession. J. Food Sci. 2017, 82, 2968–2976. [Google Scholar] [CrossRef]
  48. Lopez-Martinez, L.X.; Oliart-Ros, R.M.; Valerio-Alfaro, G.; Lee, C.H.; Parkin, K.L.; Garcia, H.S. Antioxidant activity, phenolic compounds and anthocyanins content of eighteen strains of Mexican maize. LWT Food Sci. Technol. 2009, 42, 1187–1192. [Google Scholar] [CrossRef]
  49. Mendoza-Mendoza, C.G.; Mendoza-Castillo, M.; Delgado-Alvarado, A.; Sánchez-Ramírez, F.J.; Kato-Yamakake, T. Anthocyanins content in the kernel and corncob of Mexican purple corn populations. Maydica 2020, 65, 1–10. [Google Scholar]
  50. Zhang, Q.; de Mejia, E.G.; Luna-Vital, D.; Tao, T.; Chandrasekaran, S.; Chatham, L.; Juvik, J.; Singh, V.; Kumar, D. Relationship of phenolic composition of selected purple maize (Zea mays L.) genotypes with their anti-inflammatory, anti-adipogenic and anti-diabetic potential. Food Chem. 2019, 289, 739–750. [Google Scholar]
  51. Cuevas Montilla, E.; Hillebrand, S.; Antezana, A.; Winterhalter, P. Soluble and bound phenolic compounds in different Bolivian purple corn (Zea mays L.) cultivars. J. Agric. Food Chem. 2011, 59, 7068–7074. [Google Scholar] [CrossRef]
  52. Žilić, S.; Serpen, A.; Akıllıoğlu, G.; Gökmen, V.; Vančetović, J. Phenolic compounds, carotenoids, anthocyanins, and antioxidant capacity of colored maize (Zea mays L.) kernels. J. Agric. Food Chem. 2012, 60, 1224–1231. [Google Scholar] [CrossRef]
  53. Aprodu, I.; Milea, Ș.A.; Enachi, E.; Râpeanu, G.; Bahrim, G.E.; Stănciuc, N. Thermal degradation kinetics of anthocyanins extracted from purple maize flour extract and the effect of heating on selected biological functionality. Foods 2020, 9, 1593. [Google Scholar]
  54. Hong, H.T.; Netzel, M.E.; O’Hare, T.J. Optimisation of extraction procedure and development of LC–DAD–MS methodology for anthocyanin analysis in anthocyanin-pigmented corn kernels. Food Chem. 2020, 319, 126515. [Google Scholar] [CrossRef]
  55. Cevallos-Casals, B.A.; Cisneros-Zevallos, L. Stability of anthocyanin-based aqueous extracts of Andean purple corn and red-fleshed sweet potato compared to synthetic and natural colorants. Food Chem. 2004, 86, 69–77. [Google Scholar] [CrossRef]
  56. Chen, B.H.; Stephen Inbaraj, B. Nanoemulsion and nanoliposome based strategies for improving anthocyanin stability and bioavailability. Nutrients 2019, 11, 1052. [Google Scholar] [CrossRef]
  57. Nayak, B.; Liu, R.H.; Tang, J. Effect of processing on phenolic antioxidants of fruits, vegetables, and grains—A review. Crit. Rev. Food Sci. Nutr. 2015, 55, 887–918. [Google Scholar] [CrossRef]
  58. Pedreschi, R.; Cisneros-Zevallos, L. Phenolic profiles of Andean purple corn (Zea mays L.). Food Chem. 2007, 100, 956–963. [Google Scholar] [CrossRef]
  59. Somavat, P.; Li, Q.; De Mejia, E.G.; Liu, W.; Singh, V. Coproduct yield comparisons of purple, blue and yellow dent corn for various milling processes. Ind. Crops Prod. 2016, 87, 266–272. [Google Scholar] [CrossRef]
  60. Monroy, Y.M.; Rodrigues, R.A.F.; Sartoratto, A.; Cabrala, F.A. Extraction of bioactive compounds from cob and pericarp of purple corn (Zea mays L.) by sequential extraction in fixed bed extractor using supercritical CO2, ethanol, and water as solvents. J. Superc. Fluids 2016, 107, 250–259. [Google Scholar] [CrossRef]
  61. Magaña-Cerino, J.M.; Peniche-Pavía, H.A.; Tiessen, A.; Gurrola-Díaz, C.M. Pigmented maize (Zea mays L.) contains anthocyanins with potential therapeutic action against oxidative stress—A Review. Polish J. Food Nutr. Sci. 2020, 70, 85–99. [Google Scholar] [CrossRef]
  62. Piyapanrungrueang, W.; Chantrapornchai, W.; Haruthaithanasan, V.; Sukatta, U.; Aekatasanawan, C. Comparison of anthocyanin extraction methods from high anthocyanin purple corn cob hybrid: KPSC 901, and quality of the extract powder. J. Food Process. Preserv. 2016, 40, 1125–1133. [Google Scholar] [CrossRef]
  63. Adebo, O.A.; Oyedeji, A.B.; Adebiyi, J.A.; Chinma, C.E.; Oyeyinka, S.A.; Olatunde, O.O.; Green, E.; Njobeh, P.B.; Kondiah, K. Kinetics of phenolic compounds modification during maize flour fermentation. Molecules 2021, 26, 6702. [Google Scholar] [CrossRef]
  64. Ren, S.C.; Liu, Z.L.; Ding, X.L. Isolation and identification of two novel flavone glycosides from corn silk (Stigma maydis). J. Med. Plant Res. 2009, 3, 1009–1015. [Google Scholar]
  65. Casas, M.I.; Duarte, S.; Doseff, A.I.; Grotewold, E. Flavone-rich maize: An opportunity to improve the nutritional value of an important commodity crop. Front. Plant Sci. 2014, 5, 440. [Google Scholar] [CrossRef] [PubMed]
  66. Wen, W.; Li, D.; Li, X.; Gao, Y.; Li, W.; Li, H.; Liu, J.; Liu, H.; Chen, W.; Luo, J.; et al. Metabolome-based genome-wide association study of maize kernel leads to novel biochemical insights. Nat. Commun. 2014, 5, 3438. [Google Scholar] [CrossRef] [PubMed]
  67. Rayyan, S.; Fossen, T.; Andersen, Ø.M.J. Flavone C-glycosides from seeds of fenugreek, Trigonella foenum-graecum L. J. Agric. Food Chem. 2010, 58, 7211–7217. [Google Scholar] [CrossRef]
  68. Rayyan, S.; Fossen, T.; Andersen, Ø.M.J. Flavone C-glycosides from leaves of oxalis triangularis. J. Agric. Food Chem. 2005, 53, 10057–10060. [Google Scholar] [CrossRef] [PubMed]
  69. Casati, P.; Walbot, V. Differential accumulation of Maysin and rhamnosylisoorientin in leaves of high-altitudes landraces of maize after UV-B exposure. Plant Cell Environ. 2005, 28, 788–799. [Google Scholar] [CrossRef]
  70. Rector, B.G.; Snook, M.E.; Widstrom, N.W. Effect of husk characters on resistance to corn earworm (Lepidoptera: Noctuidae) in high-Maysin maize populations. J. Econ. Entomol. 2002, 95, 1303–1307. [Google Scholar] [CrossRef]
  71. Paraginski, R.T.; Vanier, N.L.; Berrios, J.D.J.; de Oliveira, M.; Elias, M.C. Physicochemical and pasting properties of maize as affected by storage temperature. J. Stored Prod. Res. 2017, 59, 209–214. [Google Scholar] [CrossRef]
  72. Akaffou, F.A.; Koffi, D.M.; Cisse, M.; Niamké, S.L. Physicochemical and functional properties of flours from three purple maize varieties named “Violet de Katiola” in Côte d’Ivoire. Asian Food Sci. J. 2018, 4, 1–10. [Google Scholar] [CrossRef]
  73. Gong, K.; Chen, L.; Li, X.; Sun, L.; Liu, K. Effects of germination combined with extrusion on the nutritional composition, functional properties and polyphenol profile and related in vitro hypoglycemic effect of whole grain corn. J. Cereal Sci. 2018, 83, 1–8. [Google Scholar] [CrossRef]
  74. Ren, X.; Liang, Q.; Zhang, X.; Hou, T.; Li, S.; Ma, H. Stability and antioxidant activities of corn protein hydrolysates under simulated gastrointestinal digestion. Cereal Chem. 2018, 95, 760–769. [Google Scholar] [CrossRef]
Figure 1. Analysis of profile protein of PCF, PCPC25, PCPC35 and hydrolysates (GH25, DH25, GH35 and DH35) by electrophoresis SDS-PAGE. PCF (purple corn flour), PCPC25 (purple corn protein concentrate germinated for 5 days at 25 °C), PCPC35 (purple corn protein concentrate germinated for 5 days at 35 °C). GH25 (gastric hydrolysate of PCPC25), DH25 (duodenal hydrolysate of PCPC25), GH35 (gastric hydrolysate of PCPC35) and DH35 (duodenal hydrolysate of PCPC35).
Agronomy 12 02217 g001
Figure 2. Profile of phenolic components of PCPC35 by UPLC-QDa. (1) Apigenin; (2) 7,4’-Dihydroxy-3’-methoxyflavone; (3) (+) Catechin; (4) Quercetin; (5) Dihydroquercetin/Taxifolin; (6) Myricetin; (7) p-Coumaric acid 4-O-glucoside; and (8) Gallic acid 4-O-glucoside.
Agronomy 12 02217 g002
Figure 3. The %PS of PCF, PCPC25, PCPC35 and their hydrolysates at different pH (a) PCPC25 and gastric and duodenal hydrolysates; (b) PCPC35 and gastric and duodenal hydrolysates. PCF (purple corn flour), PS (protein solubility), PCPC25 (purple corn protein concentrate germinated for 5 days at 25 °C), PCPC35 (purple corn protein concentrate germinated for 5 days at 35 °C), PCF (purple corn flour), GH25 (gastric hydrolysate obtained from PCPC25), GH35 (gastric hydrolysate obtained from PCPC35), DH25 (duodenal hydrolysate obtained from PCPC25) and DH35 (duodenal hydrolysate obtained from PCPC35).
Agronomy 12 02217 g003
Table 1. Elemental composition, quantification of protein of PCPCs and hydrolysates and hydrolysis degree of hydrolysates (GH25, DH25, GH35 and DH35).
Sample% Carbon% Hydrogen% Sulfur% Nitrogen% Protein% Hydrolysis Degree
PCF 41.00 ± 0.28 c8.70 ± 0.06 c0.10 ± 0.01 a1.61 ± 0.03 a9.94 ± 0.28 aN. D
PCPC2559.05 ± 0.28 d9.97 ± 0.10 c0.40 ± 0.00 c7.81 ± 0.01 b48.79 ± 0.15 bN. D
GH2516.52 ± 1.00 b1.35 ± 0.23 a0.16 ± 0.02 a1.78 ± 0.08 a11.10 ± 0.29 a77.24 ± 0.25 a
DH2512.07 ± 0.13 a2.59 ± 0.09 b0.58 ± 0.03 d1.67 ± 0.03 a10.44 ± 0.08 a78.61 ± 0.29 a
PCPC3559.74 ± 0.18 d10.14 ± 0.090.33 ± 0.01 b7.31 ± 0.02 b45.67 ± 0.02 bN. D
GH3513.04 ± 0.58 a1.19 ± 0.09 a0.11 ± 0.00 a1.74 ± 0.05 a10.85 ± 0.04 a76.23 ± 0.32 a
DH3513.30 ± 0.27 a2.46 ± 0.05 b0.08 ± 0.00 a1.71 ± 0.02 a10.67 ± 0.04 a76.64 ± 0.19 a
Results were expressed as mean ± standard deviation (n = 3) and were analyzed by one-way ANOVA followed by the Tukey test. Statistical differences are indicated with lowercase letters PCF (purple corn flour), PCPC25 (purple corn protein concentrate germinated for 5 days at 25 °C), PCPC35 (purple corn protein concentrate germinated for 5 days at 35 °C). GH25 (gastric hydrolysate of PCPC25), DH25 (duodenal hydrolysate of PCPC25), GH35 (gastric hydrolysate of PCPC35) and DH35 (duodenal hydrolysate of PCPC35).
Table 2. Quantification of biocompounds of PCF, PCPC25, PCPC35 and their hydrolysates (GH25, DH25, GH35 and DH35).
SampleTotal Flavanol Content (TFLC)
mg RE/100 g DW
Total Flavonoids
Content (TFC)
mg RE/100 g DW
Total Anthocyanins Content (TAC)
mg Cy3-glu/g DW
Total Pro-Anthocyanins Content (TPA)
mg CE/g DW
PCF460.90 ± 0.49 a503.07 ± 0.27 a1609.59 ± 0.02 d56.98 ± 0.00 b
PCPC254228.54 ± 1.69 b2039.38 ± 0.27 d1157.35 ± 0.02 b67.00 ± 3.54 a
GH25630.57 ± 0.47 a1603.66 ± 0.26 c66.52 ± 0.01 a 35.08 ± 3.42 c
DH25690.03 ± 0.85 a1326.37 ± 0.27 b181.45 ± 0.01 a36.80 ± 3.59 c
PCPC3511091.37 ± 6.11 c7975.59 ± 0.59 e1620.24 ± 0.01 c57.73 ± 3.36 b
GH351097.28 ± 1.09 a1539.54 ± 0.23 c116.35 ± 0.01 a28.95 ± 0.00 d
DH35783.07 ± 0.78 a1796.30 ± 0.14 d88.88 ± 0.01 a37.25 ± 0.00 c
Results were expressed as mean ± standard deviation (n = 3) and were analyzed by one-way ANOVA followed by the Tukey test. Statistical differences were indicated with lowercase letters. PCPC25 (purple corn protein concentrate germinated for 5 days at 25 °C), GH25 (gastric hydrolysate from PCPC25) and DH25 (duodenal hydrolysate from PCPC25). PCPC35 (purple corn protein concentrate germinated for 5 days at 35 °C), GH35 (gastric hydrolysate from PCPC25), DH35 (duodenal hydrolysate from PCPC35) and PCF (purple corn flour). RE (rutin equivalents), Cy3-glu (cyanidin-3-glucoside chloride) and CE (catechin equivalents). DW (dry weight).
Table 3. Identification of phenolic components of PCF, PCPCs and their hydrolysates (GH25, DH25, GH35 and DH35).
NamePhenol TypeRetention
Time (min)
[M − H]
m/z
WM (Da)
1ApigeninFlavonoid/Flavonol3.004270.2270.237
27,4’-Dihydroxy-3’-methoxyflavoneFlavonoid/Flavonol3.570284.4284.263
3(+) CatechinFlavonoid/Flavonol5.362290.4290.268
4QuercetinFlavonoid/Flavonol2.984302.3302.236
5Dihydroquercetin/TaxifolinFlavonoid/Flavonol5.743304.3304.252
6MyricetinFlavonoid/Flavonol2.742318.3318.235
7p-Coumaric acid 4-O-glucosidePhenolic acid3.809326.4326.299
8Gallic acid 4-O-glucosidePhenolic acid5.903332.4332.260
Table 4. Functional properties of purple PCF, PCPC25, PCPC35 and hydrolysates (GH25, DH25, GH35 and DH35).
Sample% Water Absorption
Capacity (WAC)
% Oil Absorption
Capacity (OAC)
PCF26.90 ± 0.52 a22.08 ± 0.21 b
PCPC2527.77 ± 2.97 a24.94 ± 1.22 a
GH2519.04 ± 0.93 a,b 19.05 ± 1.40 b,c
DH2513.48 ± 0.00 a 11.32 ± 0.07 a
PCPC3529.89 ± 5.47 a23.80 ± 1.19 ab
GH3519.26 ± 2.20 a,b16.45 ± 2.04 b
DH3513.17 ± 0.50 a11.31 ± 0.60 a
Results are expressed as mean ± standard deviation (n = 3) and were analyzed by one-way ANOVA followed by the Tukey test. Statistical differences were indicated with lowercase letters. PCPC25 (purple corn protein concentrate germinated for 5 days at 25 °C), PCPC35 (purple corn protein concentrate germinated for 5 days at 35 °C), PCF (purple corn flour), GH25 (gastric hydrolysate obtained from PCPC25), GH35 (gastric hydrolysate obtained from PCPC23), DH25 (duodenal hydrolysate obtained from PCPC25) and DH35 (duodenal hydrolysate obtained from PCPC35).
Table 5. Antioxidant activity of PCPC25, PCPC35 and their gastrointestinal hydrolysates (GH25, DH25, GH35 and DH35) by ABTS, FRAP and DPPH methods.
SampleABTS
(μmol TE/g DW)
FRAP
(μmol TE/g DW)
DPPH
(μmol TE/g DW)
Purple corn flour63772 ± 1.00 e47292 ± 2.64 c93203 ± 1.18 c
PCPC25 570.97 ± 0.07 d772.85 ± 0.29 b90.60± 20.90 b
GH25142.00 ± 0.00 b64.73 ± 0.01 a74.72 ± 8.00 a
DH2574.12 ± 0.01 a59.42 ± 0.02 a85.30 ± 7.90 b
PCPC35402.75 ± 0.09 c747.02 ± 0.09 b83.98 ± 13.69 b
GH35107.52 ± 0.04 b53.89 ± 0.00 a57.34 ± 7.95 a
DH3577.10 ± 0.01 a59.16 ± 0.01 a67.12 ± 7.92 a
Results were expressed as mean ± standard deviation (n = 3) and were analyzed by one-way ANOVA followed by the Tukey test. Statistical differences were indicated with lowercase letters. PCPC-5D-25 °C (purple corn protein concentrate germinated for 5 days at 25 °C). PCPC-5D-35 °C (purple corn protein concentrate germinated for 5 days at 35 °C). TE (trolox equivalents). DW (dry weight).
Publisher’s Note: MDPI stays neutral with regard to jurisdictional claims in published maps and institutional affiliations.

