
Placing Ecosystem Services within the Water–Food–Energy–Climate Nexus: A Case Study in Mediterranean Mixed Orchards
 , and
, and
Abstract
:1. Introduction
- Estimate CF, WF, EI, and yield from Org and Conv mixed stone fruit and mixed nut orchards.
- Build a framework for linking WEFC and ES, based on the CICES framework.
- Assess the potential of mixed orchards to contribute to low environmental impact agriculture schemes and support ES provision in islands.
2. Materials and Methods
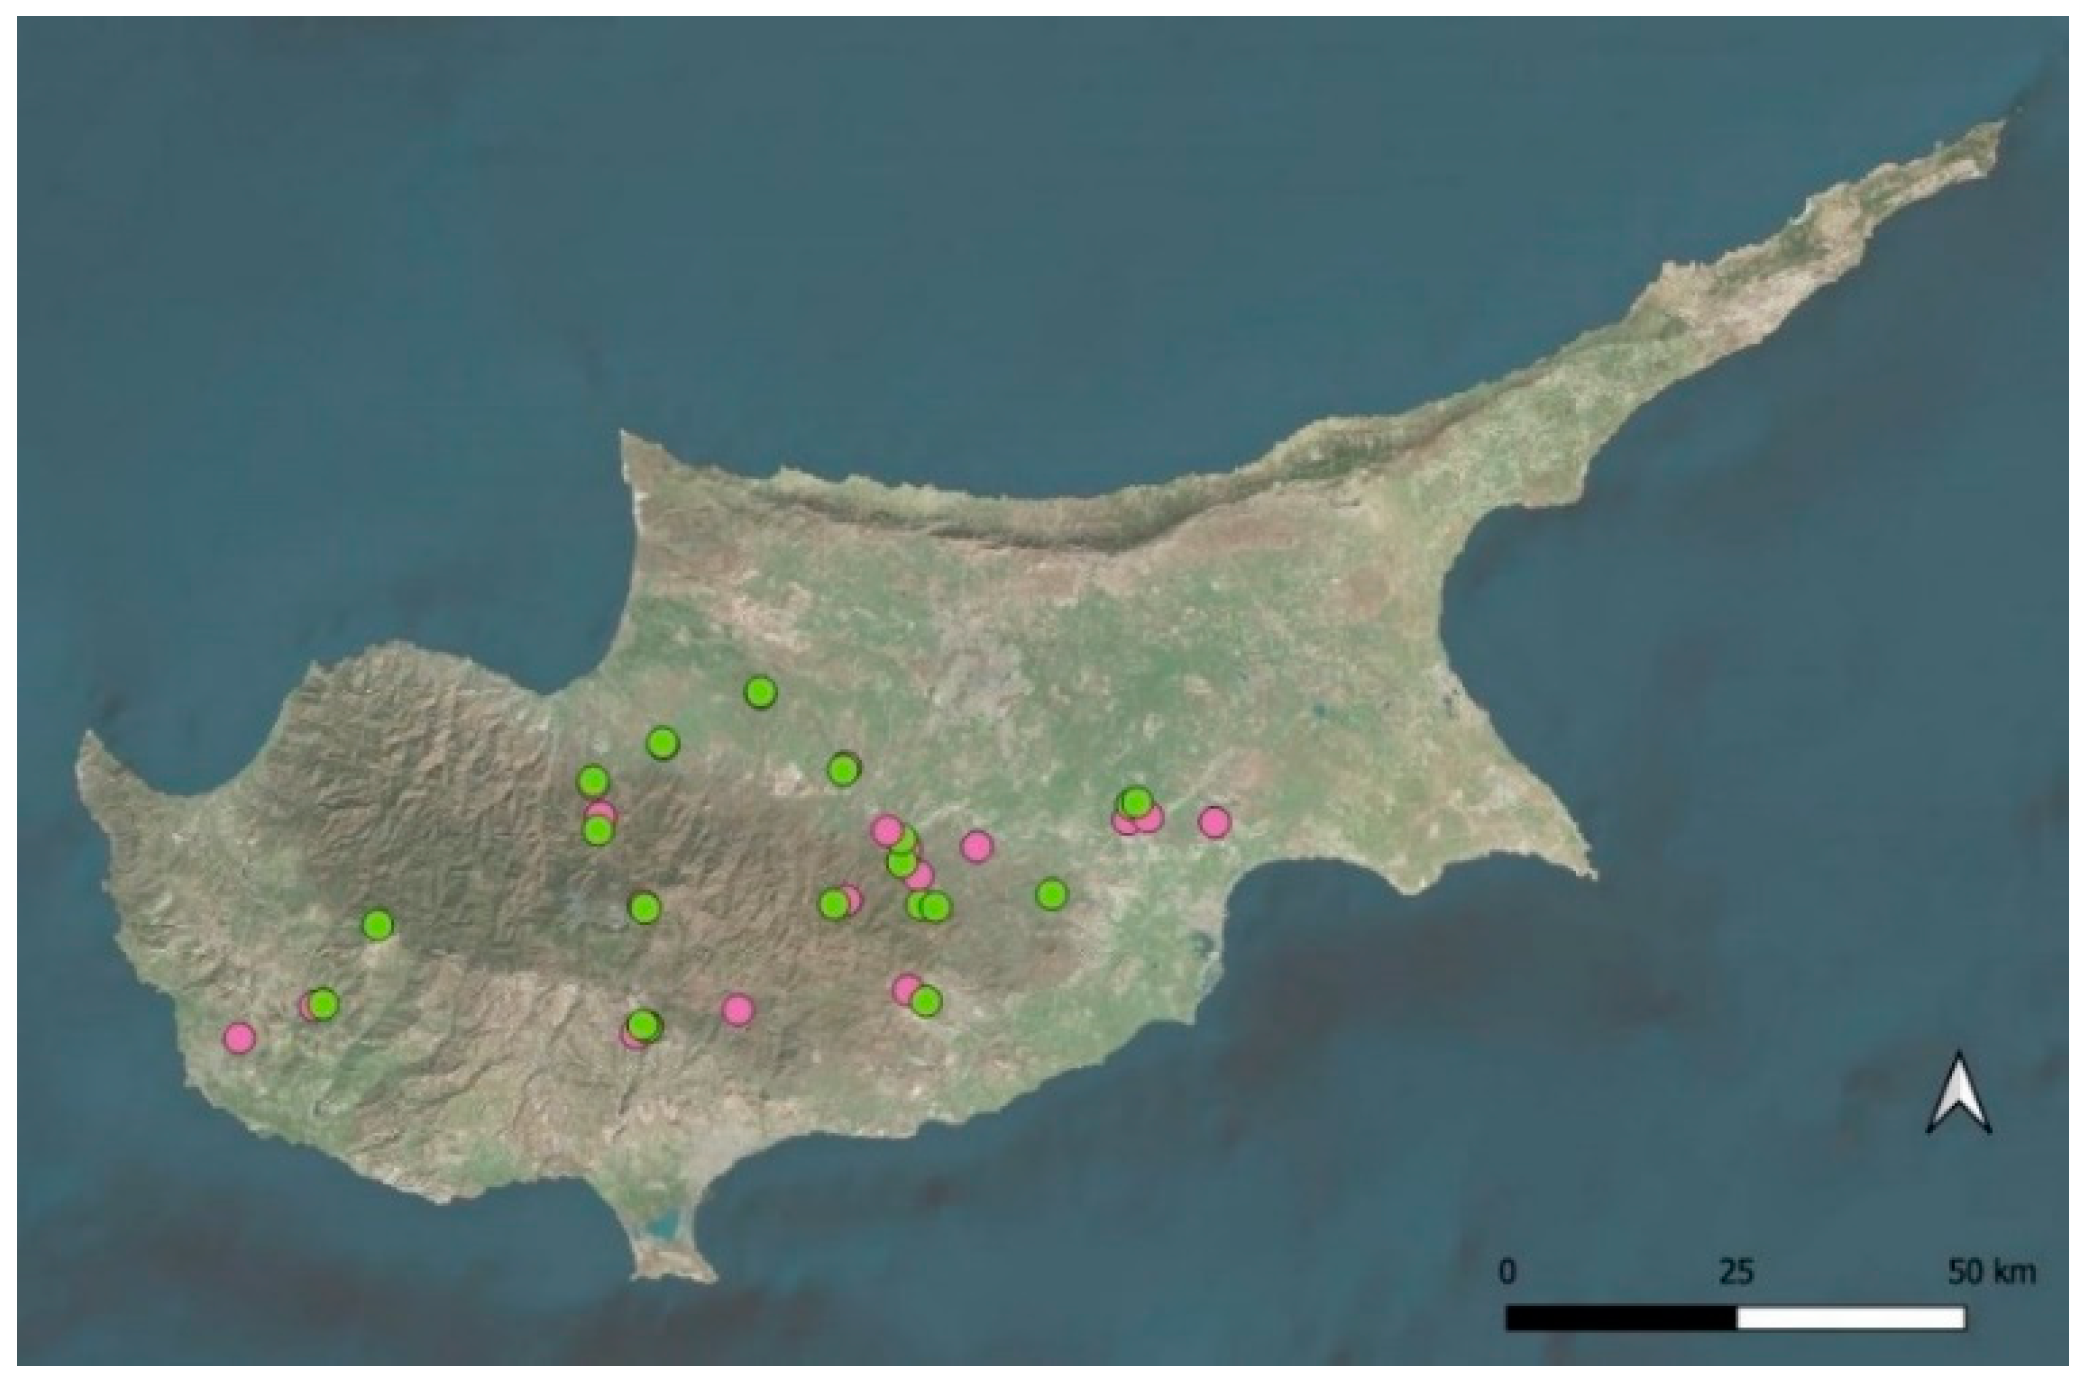
2.1. Study Area, Orchard Selection, and Related Data
2.2. Soil Parameters
2.3. WEFC Indicators
2.3.1. Yield
2.3.2. GHG Emissions
2.3.3. Water Footprint and Energy Intensity
2.4. Statistical Analysis
2.5. Linking WEFC Parameters and Ecosystem Services
3. Results
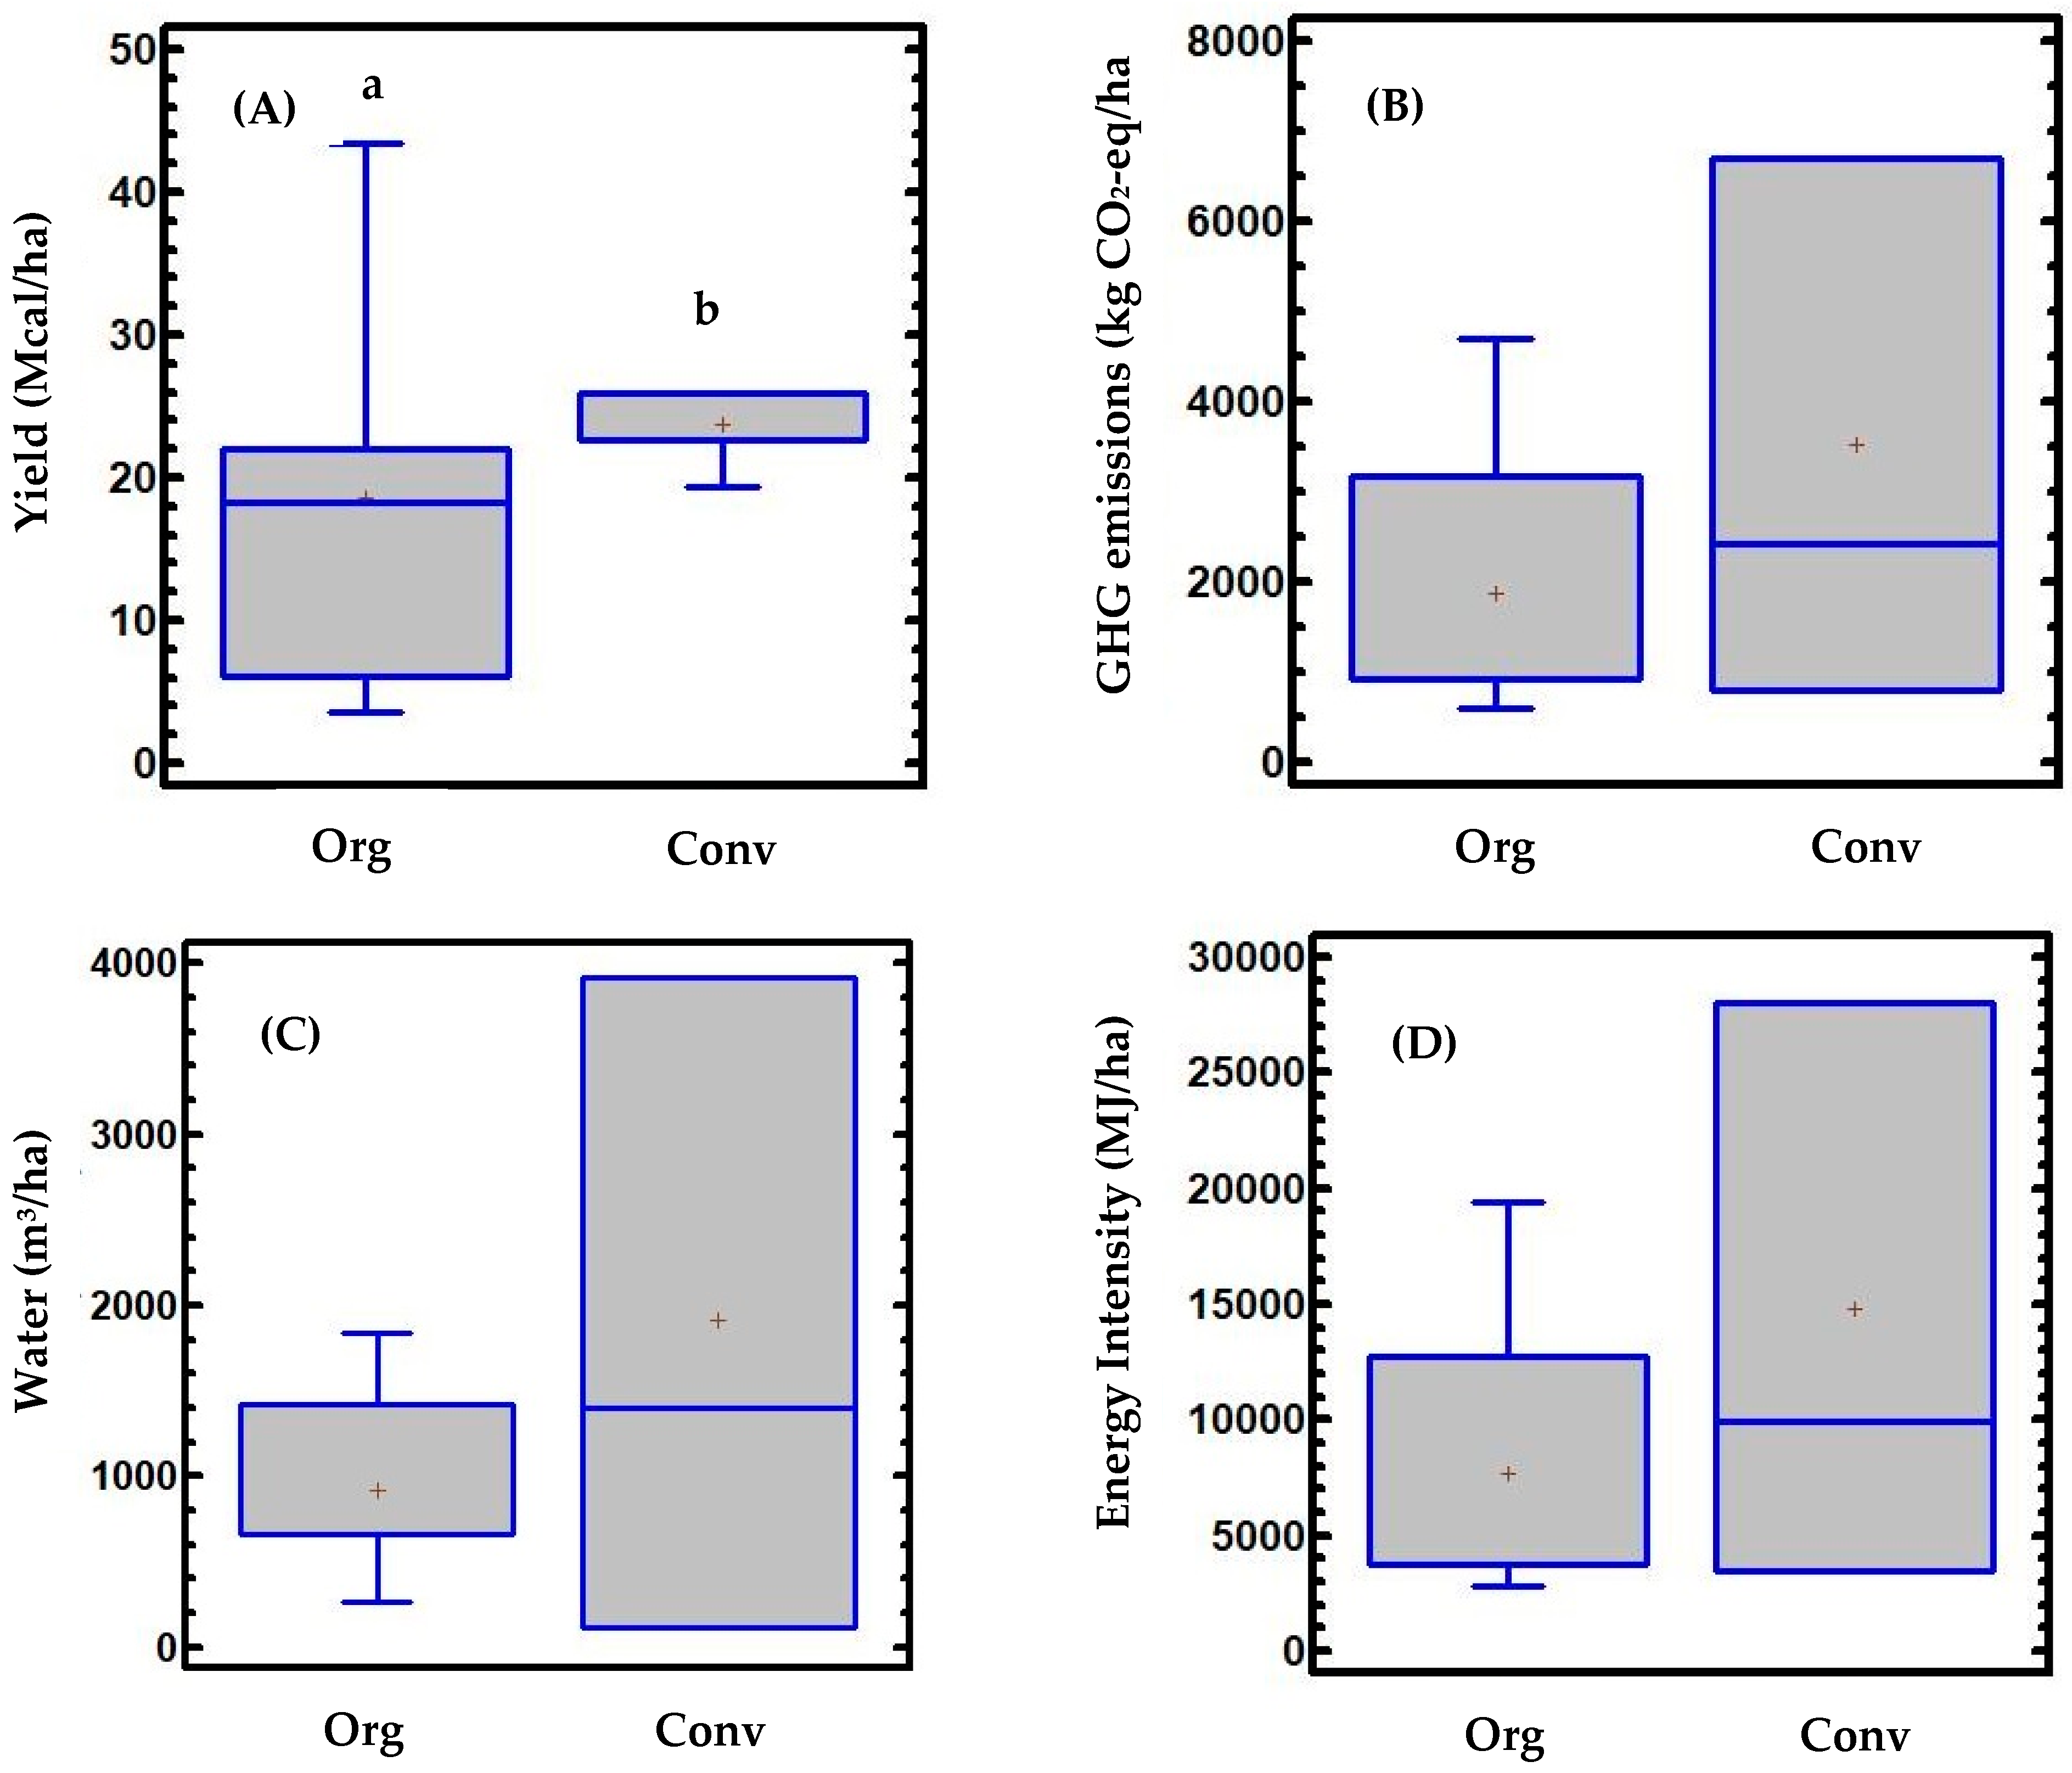
3.1. WEFC in Mixed Orchards
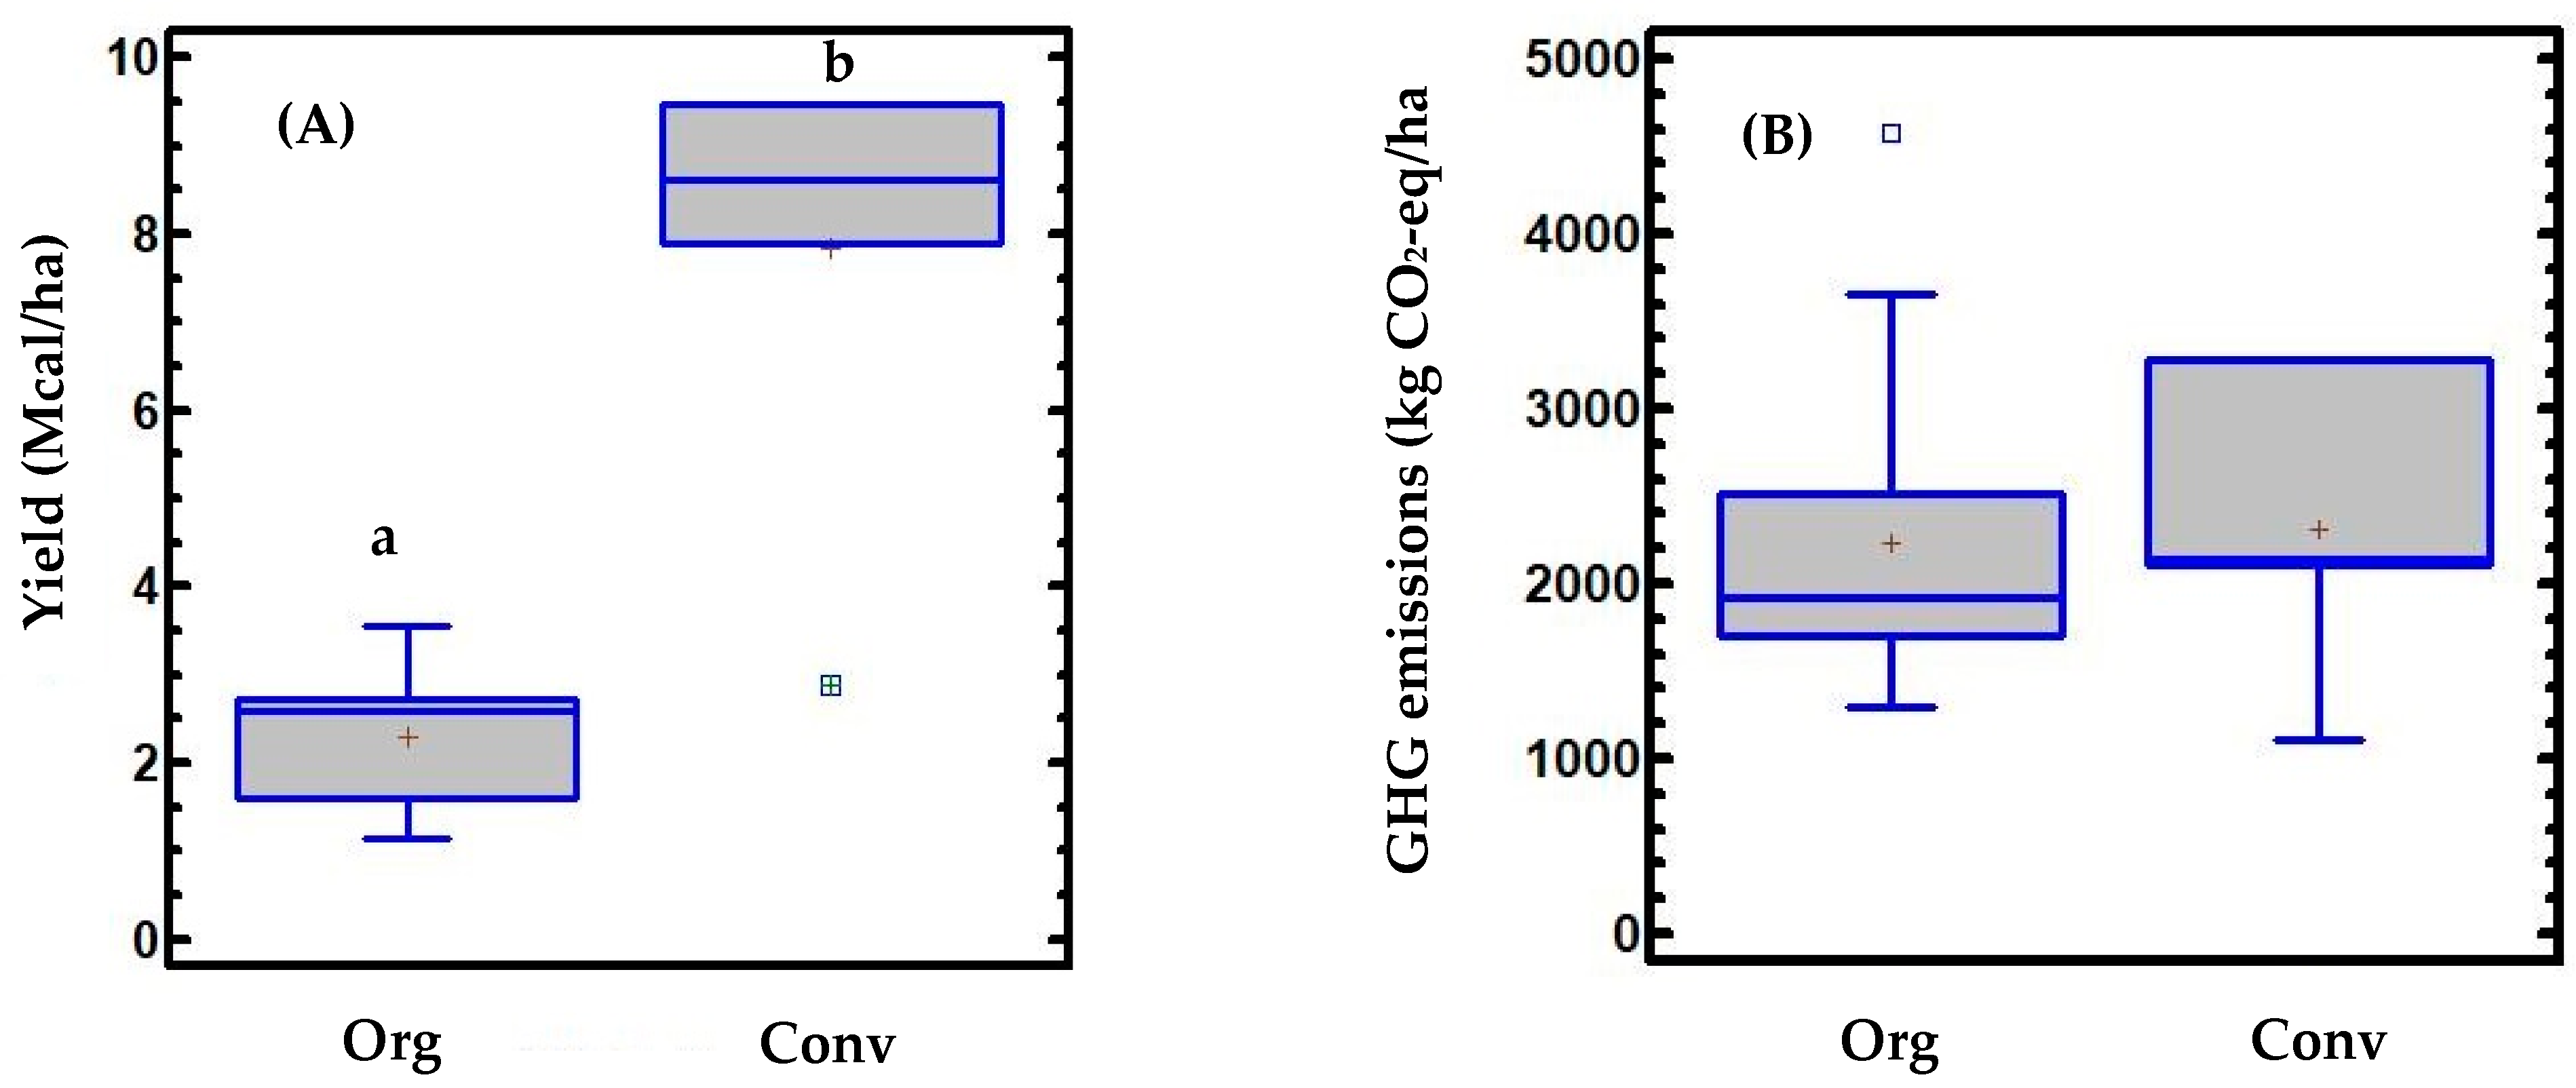
3.1.1. Nuts
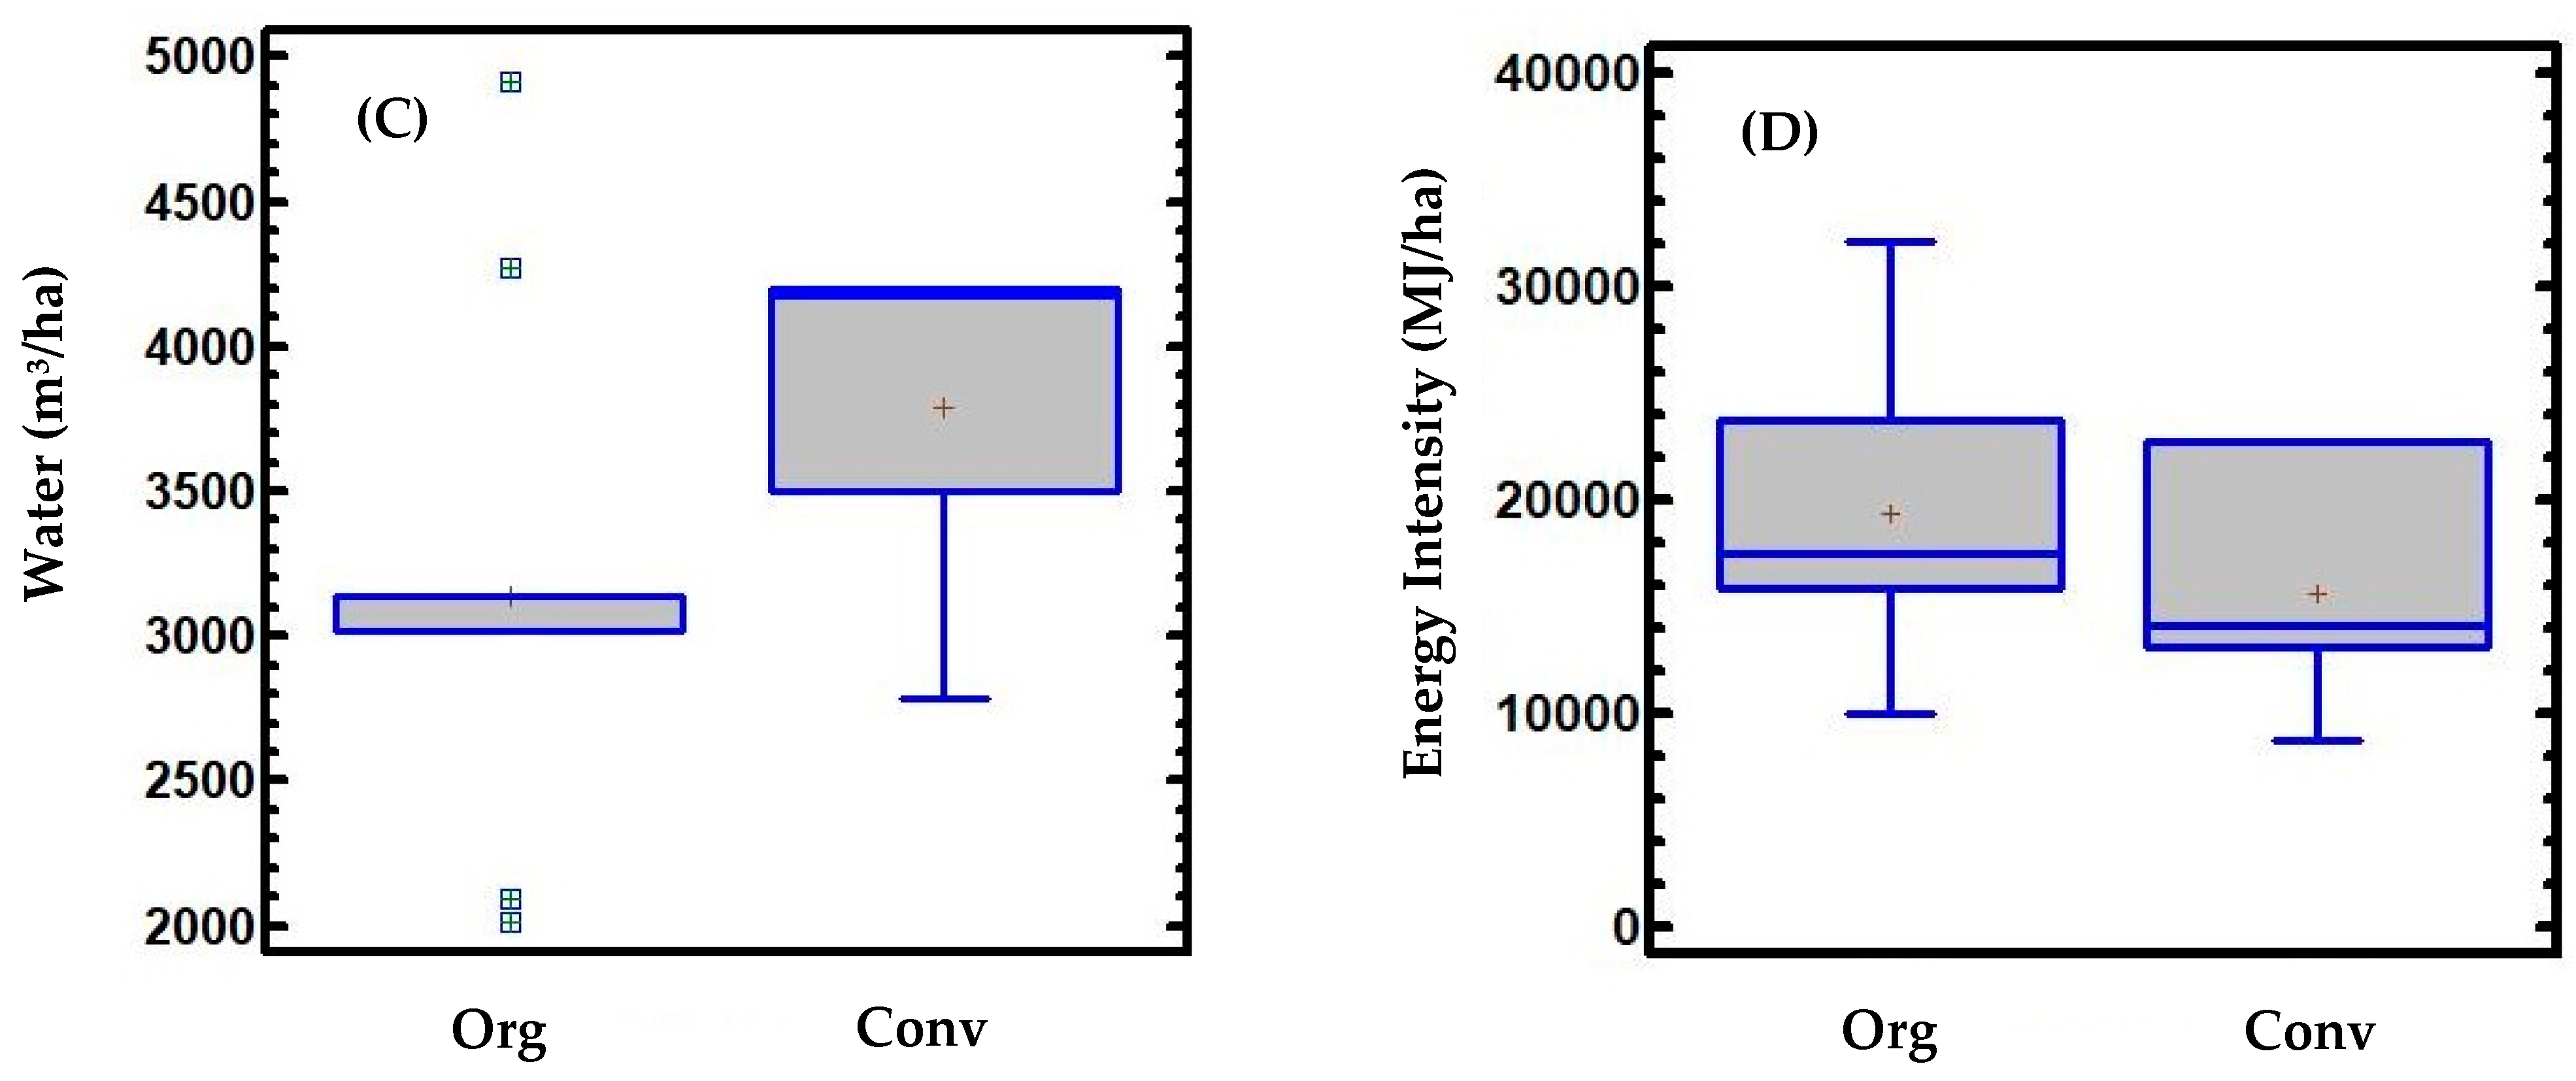
3.1.2. Stone Fruits
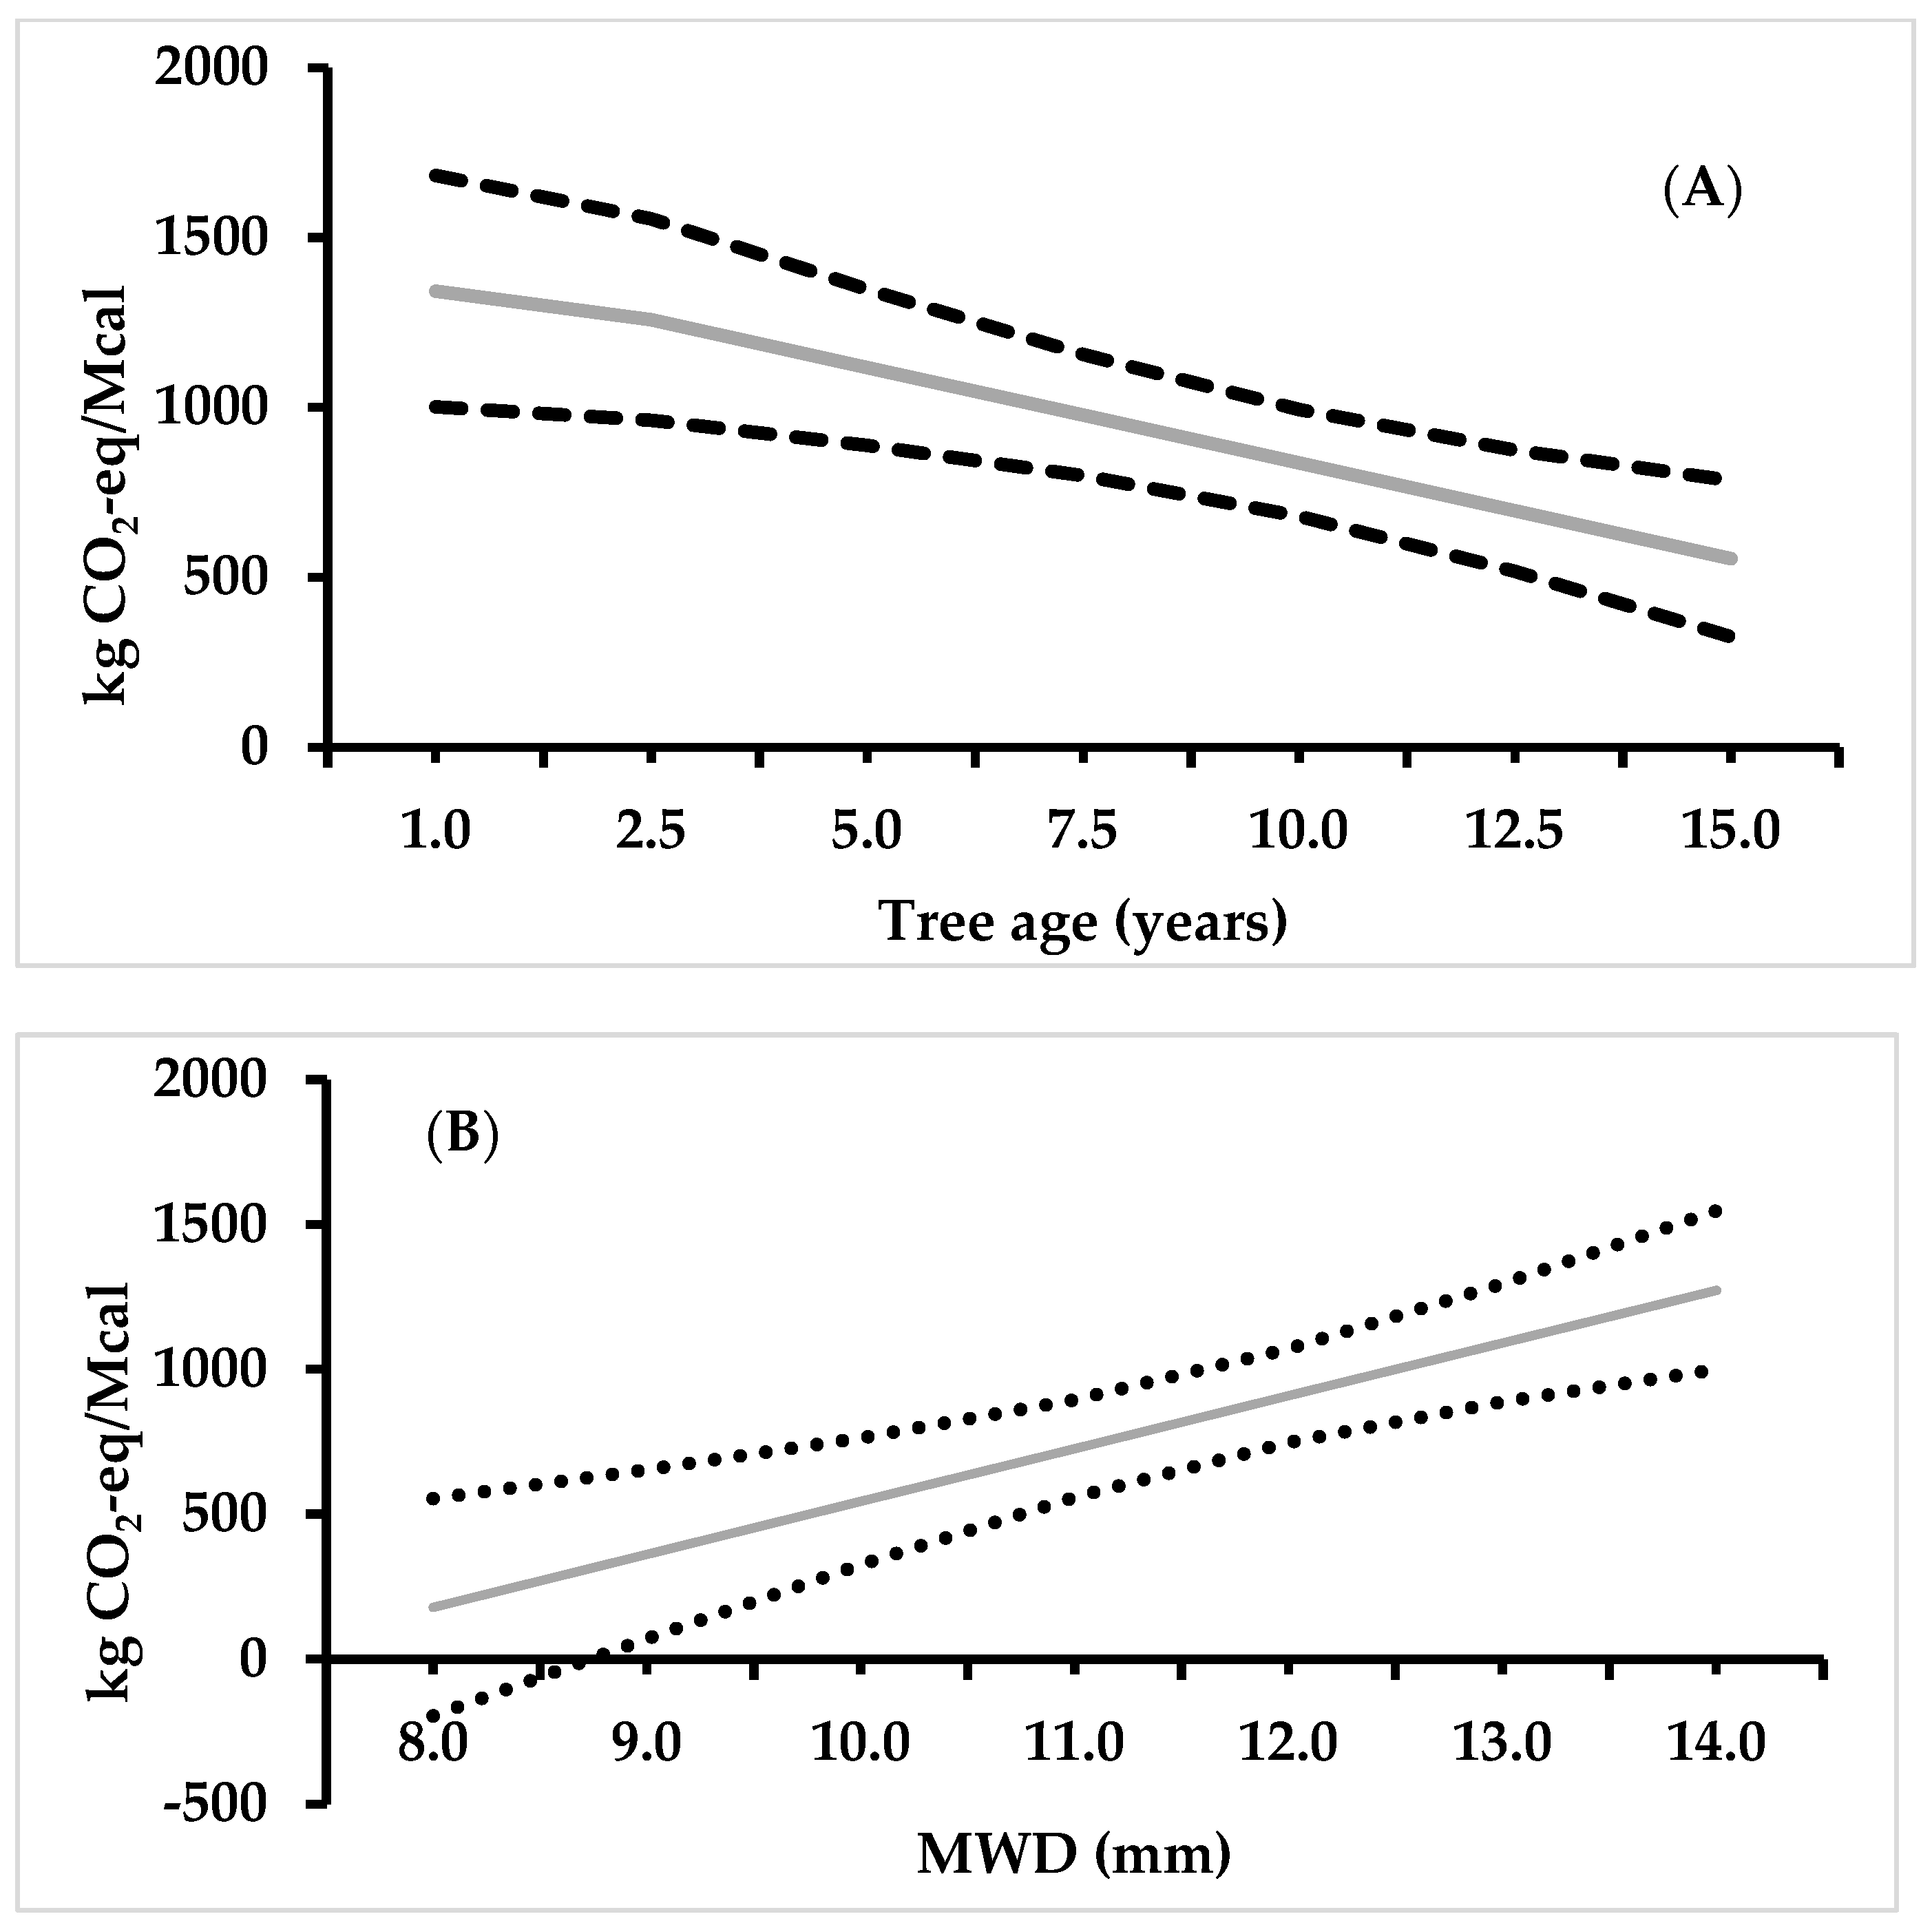
3.2. GHG Emissions Relationship to Orchards Parameters
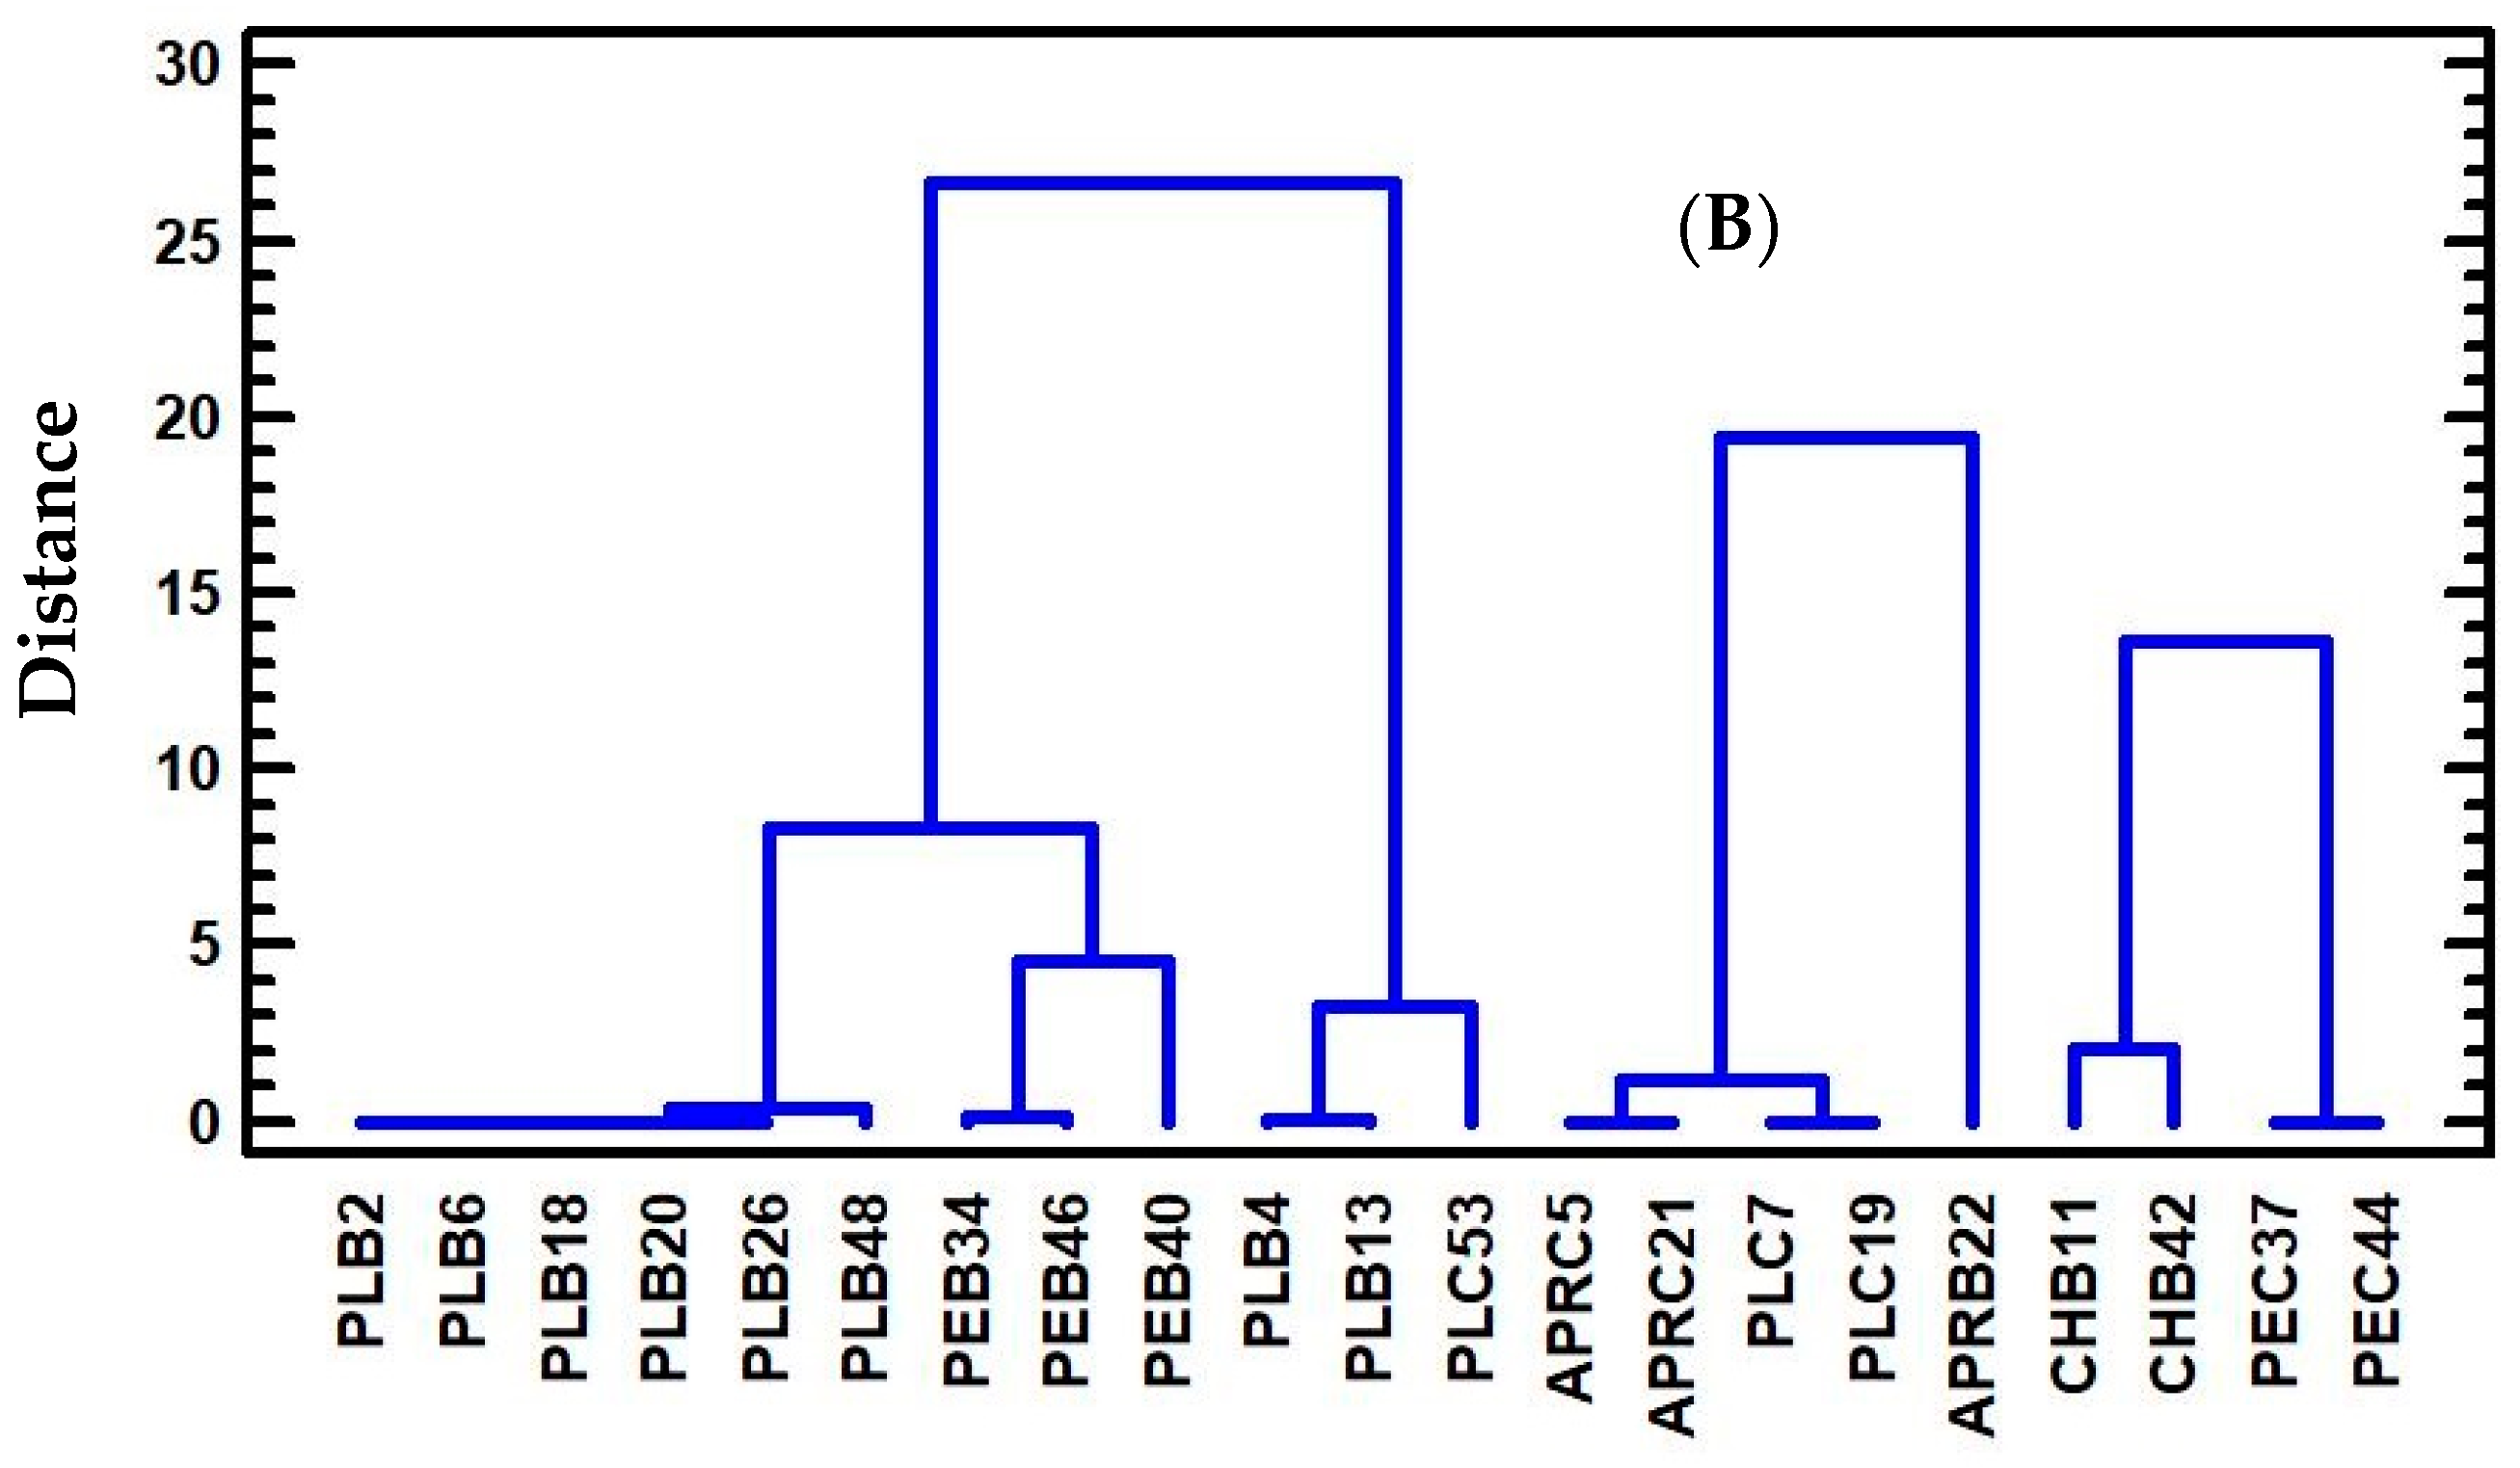
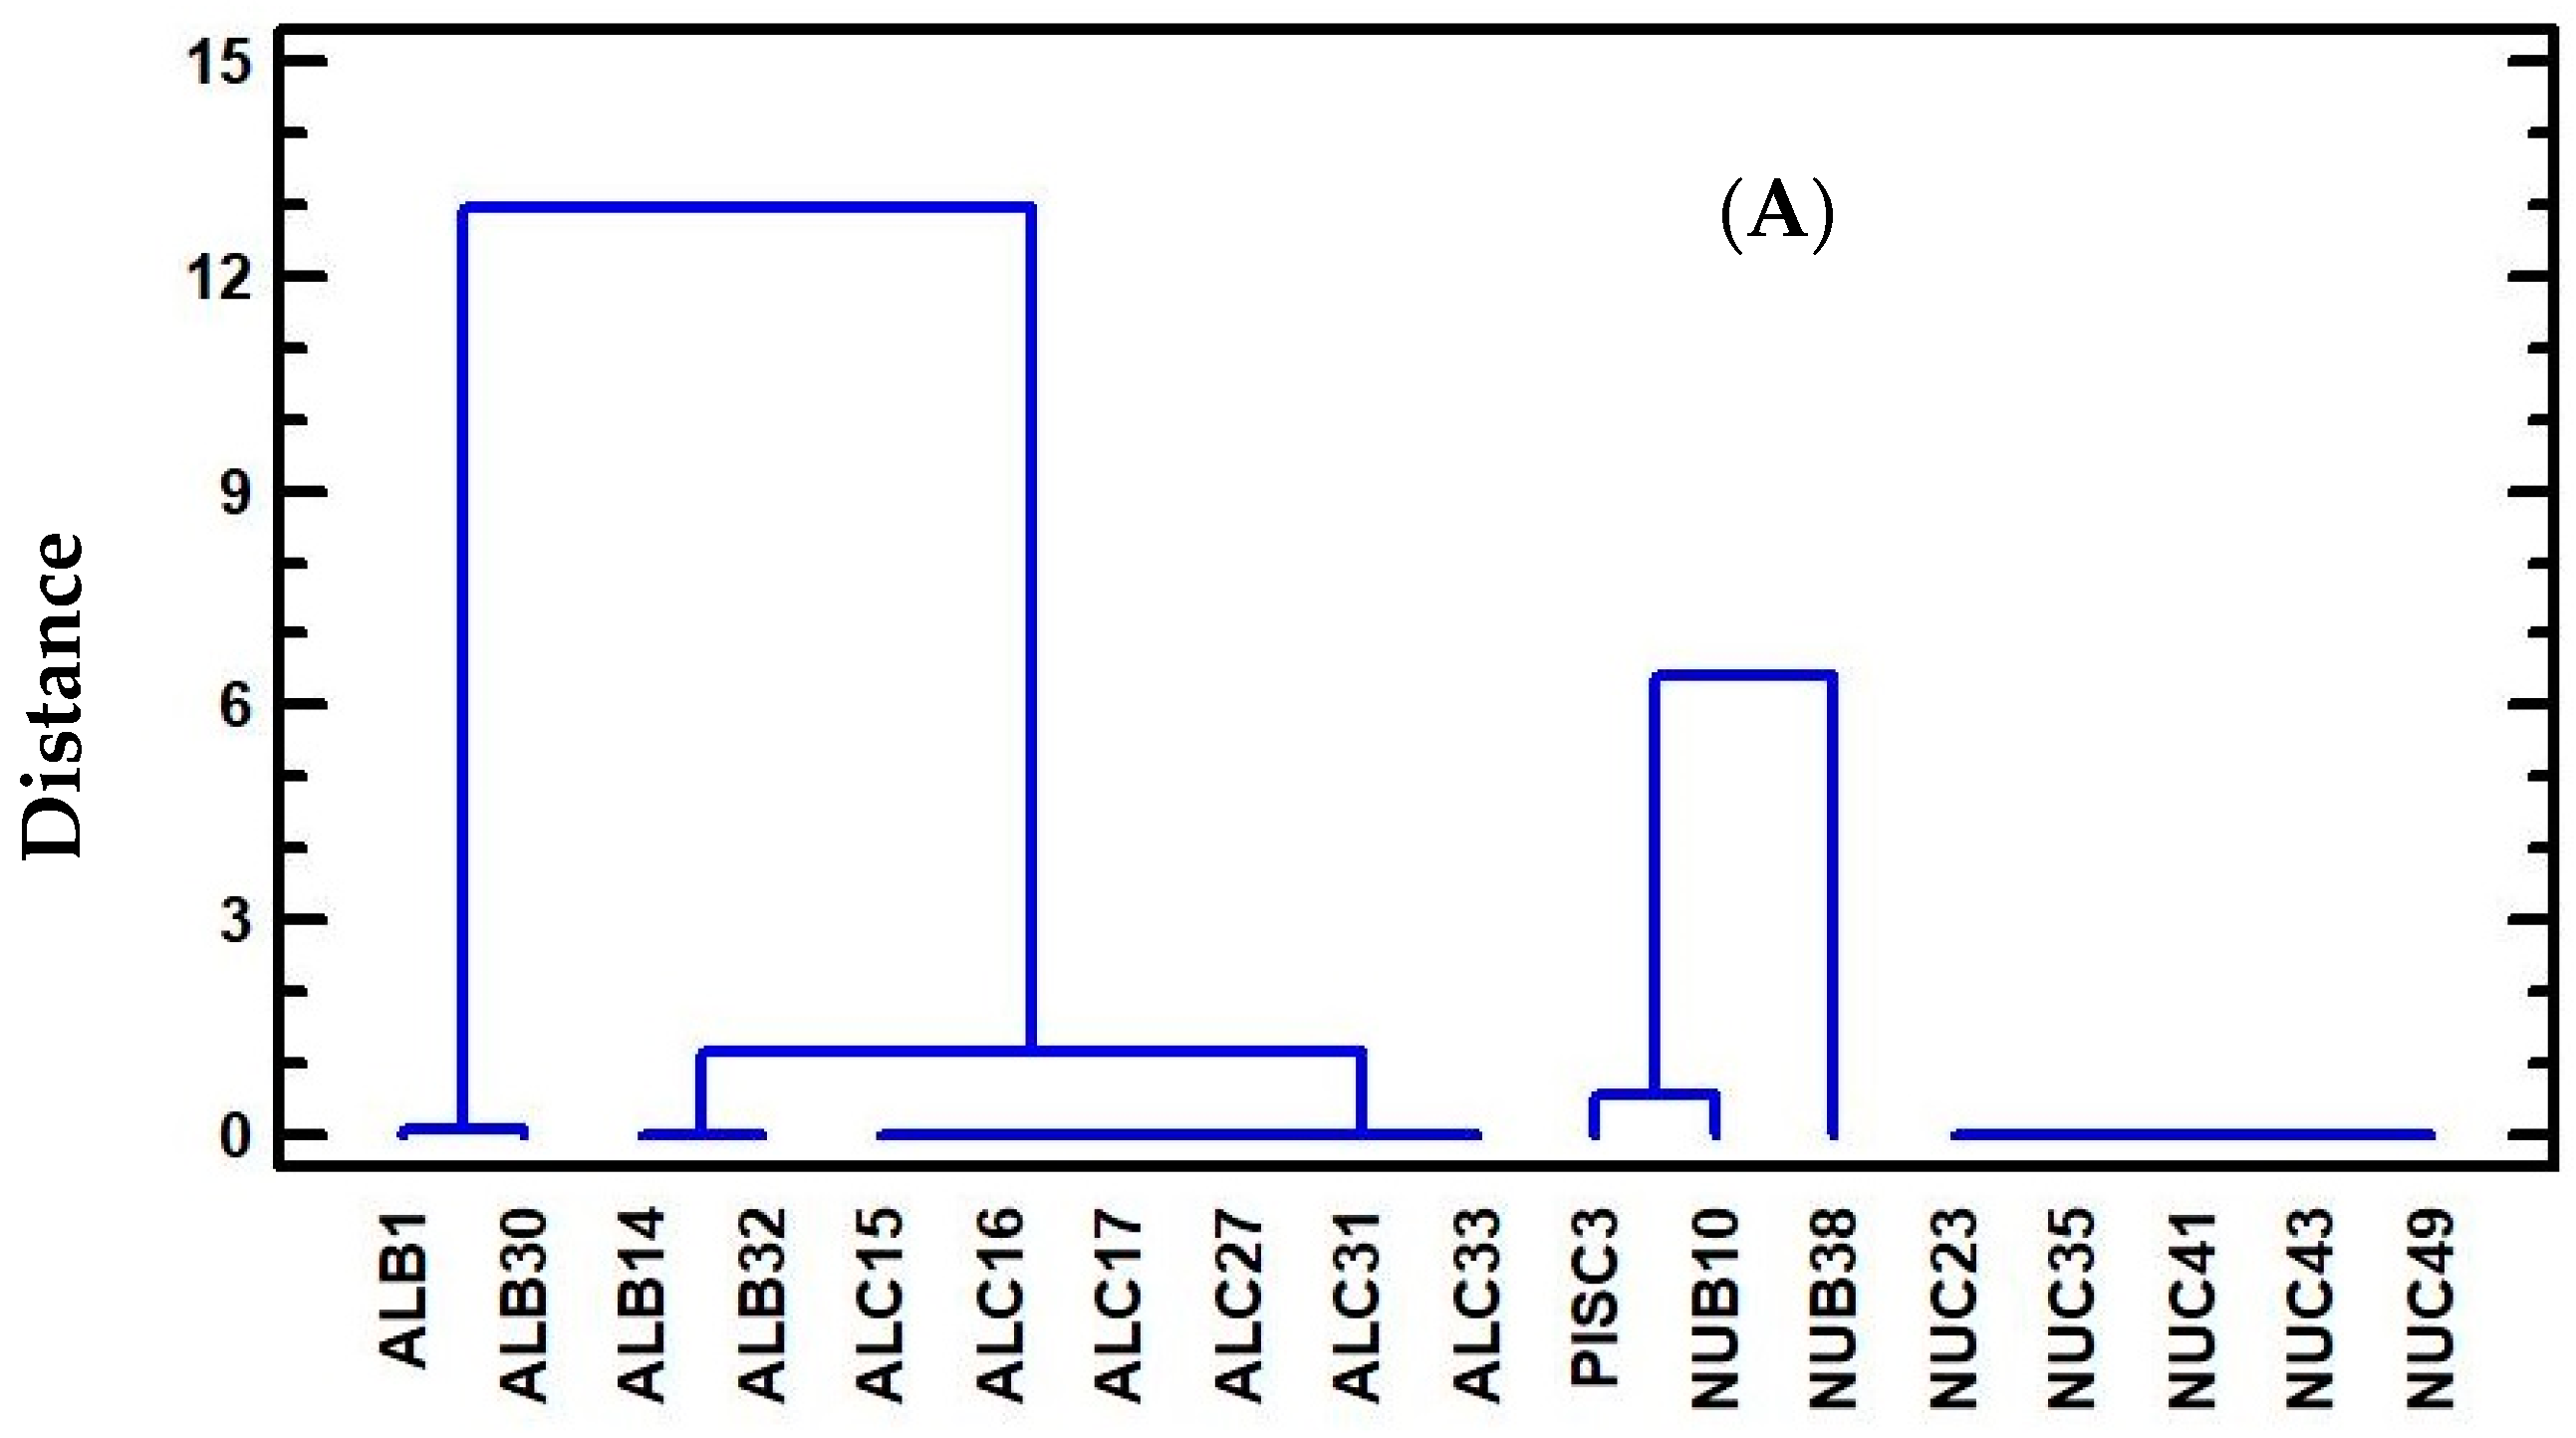
3.3. Cluster Analysis
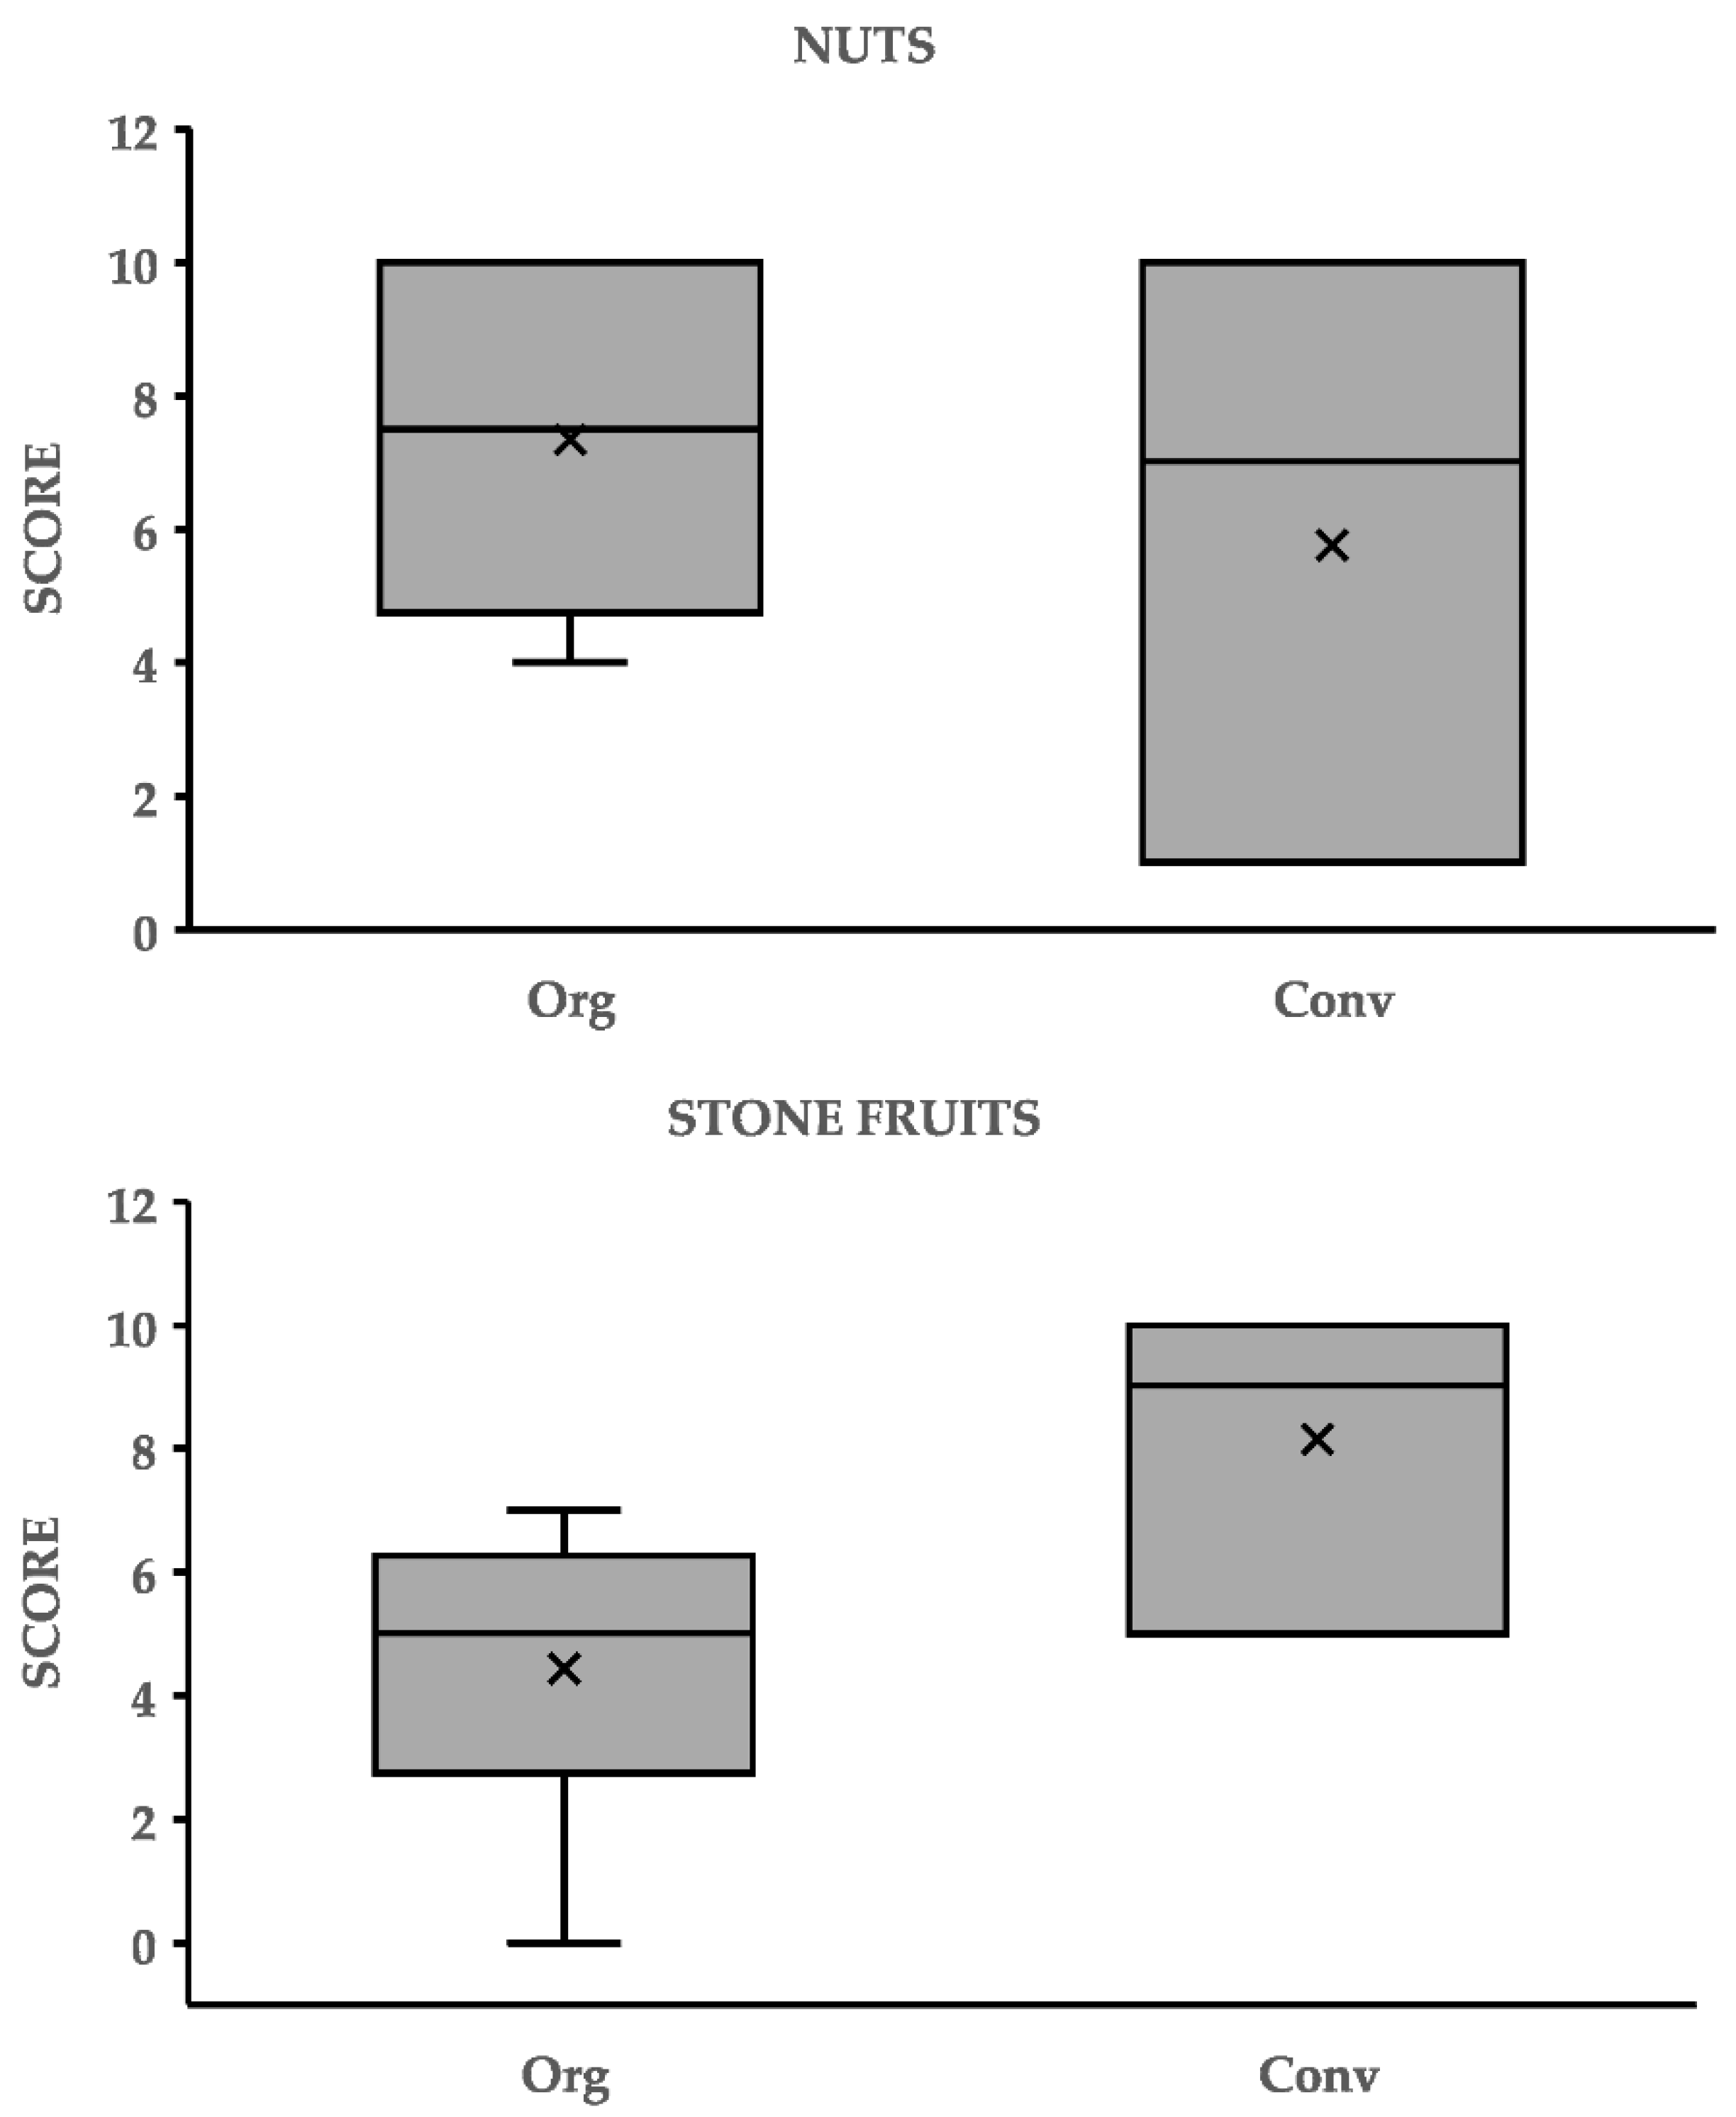
3.4. Linking WEFC and ES
4. Discussion
5. Conclusions
Supplementary Materials
Author Contributions
Funding
Institutional Review Board Statement
Informed Consent Statement
Data Availability Statement
Conflicts of Interest
References
- Braat, L.C.; de Groot, R. The Ecosystem Services Agenda:Bridging the Worlds of Natural Science and Economics, Conservation and Development, and Public and Private Policy. Ecosyst. Serv. 2012, 1, 4–15. [Google Scholar] [CrossRef]
- Carpenter, S.R.; DeFries, R.; Dietz, T.; Mooney, H.A.; Polasky, S.; Reid, W.V.; Scholes, R.J. Millennium Ecosystem Assessment: Research Needs. Science 2006, 314, 257–258. [Google Scholar] [CrossRef] [PubMed]
- Haines-Young, R.; Potschin, M. Common International Classification of Ecosystem Services (CICES) V5.1 and Guidance on the Application of the Revised Structure; Fabis Consulting; 2018; p. 53. Available online: https://cices.eu/content/uploads/sites/8/2018/01/Guidance-V51-01012018.pdf (accessed on 9 March 2022).
- Vallecillo, S.; La Notte, A.; Ferrini, S.; Maes, J. How Ecosystem Services Are Changing: An Accounting Application at the EU Level. Ecosyst. Serv. 2019, 40, 101044. [Google Scholar] [CrossRef] [PubMed]
- Hugé, J.; Rochette, A.J.; de Béthune, S.; Parra Paitan, C.C.; Vanderhaegen, K.; Vandervelden, T.; Van Passel, S.; Vanhove, M.P.M.; Verbist, B.; Verheyen, D.; et al. Ecosystem Services Assessment Tools for African Biosphere Reserves: A Review and User-Informed Classification. Ecosyst. Serv. 2020, 42, 101079. [Google Scholar] [CrossRef]
- Lourdes, K.T.; Gibbins, C.N.; Hamel, P.; Sanusi, R.; Azhar, B.; Lechner, A.M. A Review of Urban Ecosystem Services Research in Southeast Asia. Land 2021, 10, 40. [Google Scholar] [CrossRef]
- Castro-Díez, P.; Vaz, A.S.; Silva, J.S.; van Loo, M.; Alonso, Á.; Aponte, C.; Bayón, Á.; Bellingham, P.J.; Chiuffo, M.C.; DiManno, N.; et al. Global Effects of Non-Native Tree Species on Multiple Ecosystem Services. Biol. Rev. 2019, 94, 1477–1501. [Google Scholar] [CrossRef] [PubMed]
- Cui, F.; Tang, H.; Zhang, Q.; Wang, B.; Dai, L. Integrating Ecosystem Services Supply and Demand into Optimized Management at Different Scales: A Case Study in Hulunbuir, China. Ecosyst. Serv. 2019, 39, 100984. [Google Scholar] [CrossRef]
- Zapata-Caldas, E.; Calcagni, F.; Baró, F.; Langemeyer, J. Using Crowdsourced Imagery to Assess Cultural Ecosystem Services in Data-Scarce Urban Contexts: The Case of the Metropolitan Area of Cali, Colombia. Ecosyst. Serv. 2022, 56, 101445. [Google Scholar] [CrossRef]
- Lee, H.; Lautenbach, S.; Nieto, A.P.G.; Bondeau, A.; Cramer, W.; Geijzendorffer, I.R. The Impact of Conservation Farming Practices on Mediterranean Agro-Ecosystem Services Provisioning—A Meta-Analysis. Reg. Environ. Chang. 2019, 19, 2187–2202. [Google Scholar] [CrossRef]
- Montoya, D.; Haegeman, B.; Gaba, S.; de Mazancourt, C.; Bretagnolle, V.; Loreau, M. Trade-Offs in the Provisioning and Stability of Ecosystem Services in Agroecosystems. Ecol. Appl. 2019, 29, e01853. [Google Scholar] [CrossRef] [Green Version]
- Balzan, M.V.; Sadula, R.; Scalvenzi, L. Assessing Ecosystem Services Supplied by Agroecosystems in Mediterranean Europe: A Literature Review. Land 2020, 9, 245. [Google Scholar] [CrossRef]
- Ioannidou, S.C.; Litskas, V.D.; Stavrinides, M.C.; Vogiatzakis, I.N. Linking Management Practices and Soil Properties to Ecosystem Services in Mediterranean Mixed Orchards. Ecosyst. Serv. 2022, 53, 101378. [Google Scholar] [CrossRef]
- Balzan, M.V.; Caruana, J.; Zammit, A. Assessing the Capacity and Flow of Ecosystem Services in Multifunctional Landscapes: Evidence of a Rural-Urban Gradient in a Mediterranean Small Island State. Land Use Policy 2018, 75, 711–725. [Google Scholar] [CrossRef]
- Albrecht, T.R.; Crootof, A.; Scott, C.A. The Water-Energy-Food Nexus: A Systematic Review of Methods for Nexus Assessment. Environ. Res. Lett. 2018, 13, 043002. [Google Scholar] [CrossRef]
- Naidoo, D.; Nhamo, L.; Mpandeli, S.; Sobratee, N.; Senzanje, A.; Liphadzi, S.; Slotow, R.; Jacobson, M.; Modi, A.T.; Mabhaudhi, T. Operationalising the Water-Energy-Food Nexus through the Theory of Change. Renew. Sustain. Energy Rev. 2021, 149, 111416. [Google Scholar] [CrossRef]
- Pardoe, J.; Conway, D.; Namaganda, E.; Vincent, K.; Dougill, A.J.; Kashaigili, J.J. Climate Change and the Water–Energy–Food Nexus: Insights from Policy and Practice in Tanzania. Clim. Policy 2018, 18, 863–877. [Google Scholar] [CrossRef]
- van den Heuvel, L.; Blicharska, M.; Masia, S.; Sušnik, J.; Teutschbein, C. Ecosystem Services in the Swedish Water-Energy-Food-Land-Climate Nexus: Anthropogenic Pressures and Physical Interactions. Ecosyst. Serv. 2020, 44, 101141. [Google Scholar] [CrossRef]
- Pastor, A.V.; Palazzo, A.; Havlik, P.; Biemans, H.; Wada, Y.; Obersteiner, M.; Kabat, P.; Ludwig, F. The Global Nexus of Food–Trade–Water Sustaining Environmental Flows by 2050. Nat. Sustain. 2019, 2, 499–507. [Google Scholar] [CrossRef]
- Flörke, M.; Schneider, C.; McDonald, R.I. Water Competition between Cities and Agriculture Driven by Climate Change and Urban Growth. Nat. Sustain. 2018, 1, 51–58. [Google Scholar] [CrossRef]
- Flammini, A.; Pan, X.; Tubiello, F.N.; Qiu, S.Y.; Rocha Souza, L.; Quadrelli, R.; Bracco, S.; Benoit, P.; Sims, R. Emissions of Greenhouse Gases from Energy Use in Agriculture, Forestry and Fisheries: 1970–2019. Earth Syst. Sci. Data 2022, 14, 811–821. [Google Scholar] [CrossRef]
- Litskas, V.; Chrysargyris, A.; Stavrinides, M.; Tzortzakis, N. Water-Energy-Food Nexus: A Case Study on Medicinal and Aromatic Plants. J. Clean. Prod. 2019, 233, 1334–1343. [Google Scholar] [CrossRef]
- Hiremath, R.B.; Balachandra, P.; Kumar, B.; Bansode, S.S.; Murali, J. Indicator-Based Urban Sustainability—A Review. Energy Sustain. Dev. 2013, 17, 555–563. [Google Scholar] [CrossRef]
- Arthur, M.; Liu, G.; Hao, Y.; Zhang, L.; Liang, S.; Asamoah, E.F.; Lombardi, G.V. Urban Food-Energy-Water Nexus Indicators: A Review. Resour. Conserv. Recycl. 2019, 151, 104481. [Google Scholar] [CrossRef]
- Wu, X.; Hu, S.; Mo, S. Carbon Footprint Model for Evaluating the Global Warming Impact of Food Transport Refrigeration Systems. J. Clean. Prod. 2013, 54, 115–124. [Google Scholar] [CrossRef]
- Fang, X.; Zhao, L.; Zhou, G.; Huang, W.; Liu, J. Increased Litter Input Increases Litter Decomposition and Soil Respiration but Has Minor Effects on Soil Organic Carbon in Subtropical Forests. Plant Soil 2015, 392, 139–153. [Google Scholar] [CrossRef]
- Vanham, D. Does the Water Footprint Concept Provide Relevant Information to Address the Water–Food–Energy–Ecosystem Nexus? Ecosyst. Serv. 2016, 17, 298–307. [Google Scholar] [CrossRef]
- Mancini, M.S.; Galli, A.; Coscieme, L.; Niccolucci, V.; Lin, D.; Pulselli, F.M.; Bastianoni, S.; Marchettini, N. Exploring Ecosystem Services Assessment through Ecological Footprint Accounting. Ecosyst. Serv. 2018, 30, 228–235. [Google Scholar] [CrossRef]
- Kehagias, M.C.; Michos, M.C.; Menexes, G.C.; Mamolos, A.P.; Tsatsarelis, C.A.; Anagnostopoulos, C.D.; Kalburtji, K.L. Energy Equilibrium and Carbon Dioxide, Methane, and Nitrous Oxide-Emissions in Organic, Integrated and Conventional Apple Orchards Related to Natura 2000 Site. J. Clean. Prod. 2015, 91, 89–95. [Google Scholar] [CrossRef]
- Bell, A.; Matthews, N.; Zhang, W. Opportunities for Improved Promotion of Ecosystem Services in Agriculture under the Water-Energy-Food Nexus. J. Environ. Stud. Sci. 2016, 6, 183–191. [Google Scholar] [CrossRef]
- Rodríguez-de-Francisco, J.C.; Duarte-Abadía, B.; Boelens, R. Payment for Ecosystem Services and the Water-Energy-Food Nexus: Securing Resource Flows for the Affluent? Water 2019, 11, 1143. [Google Scholar] [CrossRef] [Green Version]
- Chen, Z.; Sarkar, A.; Hasan, A.K.; Li, X.; Xia, X. Evaluation of Farmers’ Ecological Cognition in Responses to Specialty Orchard Fruit Planting Behavior: Evidence in Shaanxi and Ningxia, China. Agriculture 2021, 11, 1056. [Google Scholar] [CrossRef]
- Lovell, S.T.; Hayman, J.; Hemmelgarn, H.; Hunter, A.A.; Taylor, J.R. Community Orchards for Food Sovereignty, Human Health, and Climate Resilience: Indigenous Roots and Contemporary Applications. Forests 2021, 12, 1533. [Google Scholar] [CrossRef]
- Demestihas, C.; Plénet, D.; Génard, M.; Raynal, C.; Lescourret, F. Ecosystem Services in Orchards. A Review. Agron. Sustain. Dev. 2017, 37, 12. [Google Scholar] [CrossRef]
- Demestihas, C.; Plénet, D.; Génard, M.; Raynal, C.; Lescourret, F. A Simulation Study of Synergies and Tradeoffs between Multiple Ecosystem Services in Apple Orchards. J. Environ. Manag. 2019, 236, 1–16. [Google Scholar] [CrossRef] [PubMed]
- Altieri, M. Biodiversity and Pest Management in Agroecosystems, 2nd ed.; CRC Press: Boca Raton, FL, USA, 2004; ISBN 978-1-315-27403-4. [Google Scholar]
- Weißhuhn, P.; Reckling, M.; Stachow, U.; Wiggering, H. Supporting Agricultural Ecosystem Services through the Integration of Perennial Polycultures into Crop Rotations. Sustainability 2017, 9, 2267. [Google Scholar] [CrossRef]
- Brunori, E.; Maesano, M.; Moresi, F.V.; Matteucci, G.; Biasi, R.; Scarascia Mugnozza, G. The Hidden Land Conservation Benefits of Olive-based ( Olea Europaea L.) Landscapes: An Agroforestry Investigation in the Southern Mediterranean (Calabria Region, Italy). Land Degrad. Dev. 2019, 31, 801–815. [Google Scholar] [CrossRef]
- Murray, I.; Jover-Avellà, G.; Fullana, O.; Tello, E. Biocultural Heritages in Mallorca: Explaining the Resilience of Peasant Landscapes within a Mediterranean Tourist Hotspot, 1870–2016. Sustainability 2019, 11, 1926. [Google Scholar] [CrossRef]
- Garcia, L.; Celette, F.; Gary, C.; Ripoche, A.; Valdés-Gómez, H.; Metay, A. Management of Service Crops for the Provision of Ecosystem Services in Vineyards: A Review. Agric. Ecosyst. Environ. 2018, 251, 158–170. [Google Scholar] [CrossRef]
- Holifield Collins, C.D.; Stone, J.J.; Cratic, L. Runoff and Sediment Yield Relationships with Soil Aggregate Stability for a State-and-Transition Model in Southeastern Arizona. J. Arid. Environ. 2015, 117, 96–103. [Google Scholar] [CrossRef]
- Montanaro, G.; Xiloyannis, C.; Nuzzo, V.; Dichio, B. Orchard Management, Soil Organic Carbon and Ecosystem Services in Mediterranean Fruit Tree Crops. Sci. Hortic. 2017, 217, 92–101. [Google Scholar] [CrossRef]
- De Leijster, V.; Santos, M.J.; Wassen, M.J.; Ramos-Font, M.E.; Robles, A.B.; Díaz, M.; Staal, M.; Verweij, P.A. Agroecological Management Improves Ecosystem Services in Almond Orchards within One Year. Ecosyst. Serv. 2019, 38, 100948. [Google Scholar] [CrossRef]
- Demestihas, C.; Plénet, D.; Génard, M.; Garcia de Cortazar-Atauri, I.; Launay, M.; Ripoche, D.; Beaudoin, N.; Simon, S.; Charreyron, M.; Raynal, C.; et al. Analyzing Ecosystem Services in Apple Orchards Using the STICS Model. Eur. J. Agron. 2018, 94, 108–119. [Google Scholar] [CrossRef]
- Chalhoub, M.; Gabrielle, B.; Tournebize, J.; Chaumont, C.; Maugis, P.; Girardin, C.; Montagne, D.; Baveye, P.C.; Garnier, P. Direct Measurement of Selected Soil Services in a Drained Agricultural Field: Methodology Development and Case Study in Saclay (France). Ecosyst. Serv. 2020, 42, 101088. [Google Scholar] [CrossRef]
- Statistical Service Statistical Service-Agriculture-Key Figures. Available online: https://www.mof.gov.cy/mof/cystat/statistics.nsf/agriculture_51main_en/agriculture_51main_en?OpenForm&sub=1&sel=2 (accessed on 28 January 2021).
- Eurostat Organic Crop Production by Crops (from 2012 Onwards)—Eurostat. Available online: https://ec.europa.eu/eurostat/web/products-datasets/-/org_croppro (accessed on 30 October 2020).
- Camera, C.; Zomeni, Z.; Noller, J.S.; Zissimos, A.M.; Christoforou, I.C.; Bruggeman, A. A High Resolution Map of Soil Types and Physical Properties for Cyprus: A Digital Soil Mapping Optimization. Geoderma 2017, 285, 35–49. [Google Scholar] [CrossRef]
- Dale, V.H.; Polasky, S. Measures of the Effects of Agricultural Practices on Ecosystem Services. Ecol. Econ. 2007, 64, 286–296. [Google Scholar] [CrossRef]
- Kragt, M.E.; Robertson, M.J. Quantifying Ecosystem Services Trade-Offs from Agricultural Practices. Ecol. Econ. 2014, 102, 147–157. [Google Scholar] [CrossRef]
- Adhikari, K.; Hartemink, A.E. Linking Soils to Ecosystem Services—A Global Review. Geoderma 2016, 262, 101–111. [Google Scholar] [CrossRef]
- Vos, B.D.; Lettens, S.; Muys, B.; Deckers, J.A. Walkley–Black Analysis of Forest Soil Organic Carbon: Recovery, Limitations and Uncertainty. Soil Use Manag. 2007, 23, 221–229. [Google Scholar] [CrossRef]
- Raveh, A.; Avnimelech, Y. Total Nitrogen Analysis in Water, Soil and Plant Material with Persulphate Oxidation. Water Res. 1979, 13, 911–912. [Google Scholar] [CrossRef]
- Phillips, J.M.; Hayman, D.S. Improved Procedures for Clearing Roots and Staining Parasitic and Vesicular-Arbuscular Mycorrhizal Fungi for Rapid Assessment of Infection. Trans. Br. Mycol. Soc. 1970, 55, 158-IN18. [Google Scholar] [CrossRef]
- Rowell, M.J. Colorimetric Method for CO2 Measurement in Soils. Soil Biol. Biochem. 1995, 27, 373–375. [Google Scholar] [CrossRef]
- Kang, S.; Doh, S.; Lee, D.; Lee, D.; Jin, V.L.; Kimball, J.S. Topographic and Climatic Controls on Soil Respiration in Six Temperate Mixed-Hardwood Forest Slopes, Korea. Glob. Chang. Biol. 2003, 9, 1427–1437. [Google Scholar] [CrossRef]
- Dane, J.H.; Topp, G.C.; Campbell, G.S. Methods of Soil Analysis. Part 4; Soil Science Society of America: Madison, WI, USA, 2002; ISBN 978-0-89118-893-3. [Google Scholar]
- Nimmo, J.R.; Perkins, K.S. 2.6 Aggregate Stability and Size Distribution. In Methods of Soil Analysis; John Wiley & Sons, Ltd.: London, UK, 2018; pp. 317–328. ISBN 978-0-89118-893-3. [Google Scholar]
- Bàrberi, P.; Cascio, B.L. Long-Term Tillage and Crop Rotation Effects on Weed Seedbank Size and Composition. Weed Res. 2001, 41, 325–340. [Google Scholar] [CrossRef]
- Marques, F.J.M.; Pedroso, V.; Trindade, H.; Pereira, J.L.S. Impact of Vineyard Cover Cropping on Carbon Dioxide and Nitrous Oxide Emissions in Portugal. Atmos. Pollut. Res. 2018, 9, 105–111. [Google Scholar] [CrossRef]
- Ward, J.H. Hierarchical Grouping to Optimize an Objective Function. Null 1963, 58, 236–244. [Google Scholar] [CrossRef]
- Sharma, S. Applied Multivariate Techniques. Technometrics 1997, 39, 101. [Google Scholar] [CrossRef]
- Lassaletta, L.; Billen, G.; Grizzetti, B.; Garnier, J.; Leach, A.M.; Galloway, J.N. Food and Feed Trade as a Driver in the Global Nitrogen Cycle: 50-Year Trends. Biogeochemistry 2014, 118, 225–241. [Google Scholar] [CrossRef]
- Duru, M.; Therond, O.; Martin, G.; Martin-Clouaire, R.; Magne, M.-A.; Justes, E.; Journet, E.-P.; Aubertot, J.-N.; Savary, S.; Bergez, J.-E.; et al. How to Implement Biodiversity-Based Agriculture to Enhance Ecosystem Services: A Review. Agron. Sustain. Dev. 2015, 35, 1259–1281. [Google Scholar] [CrossRef]
- Michos, M.C.; Menexes, G.C.; Mamolos, A.P.; Tsatsarelis, C.A.; Anagnostopoulos, C.D.; Tsaboula, A.D.; Kalburtji, K.L. Energy Flow, Carbon and Water Footprints in Vineyards and Orchards to Determine Environmentally Favourable Sites in Accordance with Natura 2000 Perspective. J. Clean. Prod. 2018, 187, 400–408. [Google Scholar] [CrossRef]
- Ilinova, A.; Dmitrieva, D.; Kraslawski, A. Influence of COVID-19 Pandemic on Fertilizer Companies: The Role of Competitive Advantages. Resour. Policy 2021, 71, 102019. [Google Scholar] [CrossRef]
- Clune, S.; Crossin, E.; Verghese, K. Systematic Review of Greenhouse Gas Emissions for Different Fresh Food Categories. J. Clean. Prod. 2017, 140, 766–783. [Google Scholar] [CrossRef]
- Litskas, V.D.; Irakleous, T.; Tzortzakis, N.; Stavrinides, M.C. Determining the Carbon Footprint of Indigenous and Introduced Grape Varieties through Life Cycle Assessment Using the Island of Cyprus as a Case Study. J. Clean. Prod. 2017, 156, 418–425. [Google Scholar] [CrossRef]
- Litskas, V.D.; Tzortzakis, N.; Stavrinides, M.C. Determining the Carbon Footprint and Emission Hotspots for the Wine Produced in Cyprus. Atmosphere 2020, 11, 463. [Google Scholar] [CrossRef]
- Litskas, V.; Mandoulaki, A.; Vogiatzakis, I.N.; Tzortzakis, N.; Stavrinides, M. Sustainable Viticulture: First Determination of the Environmental Footprint of Grapes. Sustainability 2020, 12, 8812. [Google Scholar] [CrossRef]
- Mekonnen, M.M.; Hoekstra, A.Y. The Green, Blue and Grey Water Footprint of Crops and Derived Crop Products. Hydrol. Earth Syst. Sci. 2011, 15, 1577–1600. [Google Scholar] [CrossRef]
- Mekonnen, M.M.; Hoekstra, A.Y. Water Footprint Benchmarks for Crop Production: A First Global Assessment. Ecol. Indic. 2014, 46, 214–223. [Google Scholar] [CrossRef]
- Genitsariotis, M.; Chlioumis, G.; Tsarouhas, B.; Tsatsarelis, K.; Sfakiotakis, E. Energy and Nutrient Inputs and Outputs of a Typical Olive Orchard in Northern Greece. Acta Hortic. 2000, 455–458. [Google Scholar] [CrossRef]
- Kaltsas, A.M.; Mamolos, A.P.; Tsatsarelis, C.A.; Nanos, G.D.; Kalburtji, K.L. Energy Budget in Organic and Conventional Olive Groves. Agric. Ecosyst. Environ. 2007, 122, 243–251. [Google Scholar] [CrossRef]
- Yang, C.; Liu, N.; Zhang, Y. Soil Aggregates Regulate the Impact of Soil Bacterial and Fungal Communities on Soil Respiration. Geoderma 2019, 337, 444–452. [Google Scholar] [CrossRef]
- Ledo, A.; Smith, P.; Zerihun, A.; Whitaker, J.; Vicente-Vicente, J.L.; Qin, Z.; McNamara, N.P.; Zinn, Y.L.; Llorente, M.; Liebig, M.; et al. Changes in Soil Organic Carbon under Perennial Crops. Glob. Chang. Biol. 2020, 26, 4158–4168. [Google Scholar] [CrossRef]
- Kefalas, G.; Kalogirou, S.; Poirazidis, K.; Lorilla, R.S. Landscape Transition in Mediterranean Islands: The Case of Ionian Islands, Greece 1985–2015. Landsc. Urban Plan. 2019, 191, 103641. [Google Scholar] [CrossRef]
- Martínez-Murillo, J.F.; Remond, R.; Ruiz-Sinoga, J.D. Validation of RUSLE K Factor Using Aggregate Stability in Contrasted Mediterranean Eco-Geomorphological Landscapes (Southern Spain). Environ. Res. 2020, 183, 109160. [Google Scholar] [CrossRef] [PubMed]
- Morugán-Coronado, A.; Linares, C.; Gómez-López, M.D.; Faz, Á.; Zornoza, R. The Impact of Intercropping, Tillage and Fertilizer Type on Soil and Crop Yield in Fruit Orchards under Mediterranean Conditions: A Meta-Analysis of Field Studies. Agric. Syst. 2020, 178, 102736. [Google Scholar] [CrossRef]
- Lassaletta, L.; Billen, G.; Garnier, J.; Bouwman, L.; Velazquez, E.; Mueller, N.D.; Gerber, J.S. Nitrogen Use in the Global Food System: Past Trends and Future Trajectories of Agronomic Performance, Pollution, Trade, and Dietary Demand. Environ. Res. Lett. 2016, 11, 095007. [Google Scholar] [CrossRef]
- Bell, M.J.; Hinton, N.; Cloy, J.M.; Topp, C.F.E.; Rees, R.M.; Cardenas, L.; Scott, T.; Webster, C.; Ashton, R.W.; Whitmore, A.P.; et al. Nitrous Oxide Emissions from Fertilised UK Arable Soils: Fluxes, Emission Factors and Mitigation. Agric. Ecosyst. Environ. 2015, 212, 134–147. [Google Scholar] [CrossRef]
- Thapa, R.; Chatterjee, A.; Awale, R.; McGranahan, D.A.; Daigh, A. Effect of Enhanced Efficiency Fertilizers on Nitrous Oxide Emissions and Crop Yields: A Meta-Analysis. Soil Sci. Soc. Am. J. 2016, 80, 1121–1134. [Google Scholar] [CrossRef]
- Markhi, A.; Laftouhi, N.; Grusson, Y.; Soulaimani, A. Assessment of Potential Soil Erosion and Sediment Yield in the Semi-Arid N′fis Basin (High Atlas, Morocco) Using the SWAT Model. Acta Geophys. 2019, 67, 263–272. [Google Scholar] [CrossRef]
- Alcon, F.; Marín-Miñano, C.; Zabala, J.A.; de-Miguel, M.-D.; Martínez-Paz, J.M. Valuing Diversification Benefits through Intercropping in Mediterranean Agroecosystems: A Choice Experiment Approach. Ecol. Econ. 2020, 171, 106593. [Google Scholar] [CrossRef]
- Barbera, G.; Cullotta, S. The Traditional Mediterranean Polycultural Landscape as Cultural Heritage: Its Origin and Historical Importance, Its Agro-Silvo-Pastoral Complexity and the Necessity for Its Identification and Inventory. In Biocultural Diversity in Europe; Agnoletti, M., Emanueli, F., Eds.; Springer International Publishing: Cham, Switzerland, 2016; Volume 5, pp. 21–48. ISBN 978-3-319-26313-7. [Google Scholar]
- Lasanta, T.; Errea, M.P.; Nadal-Romero, E. Traditional Agrarian Landscape in the Mediterranean Mountains. A Regional and Local Factor Analysis in the Central Spanish Pyrenees. Land Degrad. Dev. 2017, 28, 1626–1640. [Google Scholar] [CrossRef]
- Manolaki, P.; Zotos, S.; Vogiatzakis, I.N. An Integrated Ecological and Cultural Framework for Landscape Sensitivity Assessment in Cyprus. Land Use Policy 2020, 92, 104336. [Google Scholar] [CrossRef]


| Tree Species | Kcal kg−1 | Tree Species | Kcal kg−1 |
|---|---|---|---|
| Almonds | 5.79 | Cherries | 0.634 |
| Pistachios | 5.69 | Nectarines | 0.442 |
| Walnuts | 6.54 | Plums | 0.454 |
| Apricots | 0.486 | Peaches | 0.394 |
| WEFC Parameter | Ecosystem Service | CICES v5.1 | Comment | Scoring System |
|---|---|---|---|---|
| GHG emissions (Carbon Footprint) | Atmospheric composition regulation | 2.2.6.1 | GHG emissions due to fuel and energy use in the field as well as emissions from the production of fertilizers and relevant soil emissions lead to impacts in atmospheric composition and affect climate regulation. | Red (=0 points); higher values class Orange (=1 point); medium values class Green (=3 points); lower values class |
| Water footprint (Irrigation water) | Water (surface and groundwater) used for nutrition, materials; regulation of flows | 4.2.1.1 and 4.2.2.2; 2.2.1.3 | Water use for irrigation increases yield and food provision but affects water cycle and water availability for ground and surface water bodies and related ecosystems. | |
| Energy Intensity | Food provision | 1.1.1.1; 2.2.6.1 | Energy inputs is typical for the agricultural production and food safety, and it is linked to food provision. Energy production is related to GHG emissions and energy use for food production is related to climate change. | |
| Yield | Food provision | 1.1.1.1 | The yield of the orchards and the calories from the fruits and nuts is linked to food provision. | Red (=0 points); lower values class Orange (=1 point); medium values class Green (=3 points); higher values class |
| Combined score | Lower score = worst case for ES = 0 (all WEFC parameters are red; 4 × 0) Higher score = best for ES = 12 (all WEFC parameters are green; 4 × 3) Overall classification 0–4: Red; 5–8 Orange; 9–12 Green | |||
| Cluster | Members | Percent | EI MJ/ha | Yield (Mcal ha−1) | WF (m3 ha−1) | CF (kg CO2eq ha−1) |
|---|---|---|---|---|---|---|
| NUTS | ||||||
| 1 | 10 | 55.56 | 3477.3 | 18.245 | 291.3 | 819.76 |
| 2 | 3 | 16.67 | 16,198.2 | 28.3133 | 1980.67 | 3974.47 |
| 3 | 5 | 27.78 | 28,021.8 | 26.0 | 3923.0 | 6698.7 |
| STONE | ||||||
| 1 | 12 | 57.14 | 17,444.1 | 2.101 | 2771.25 | 1891.35 |
| 2 | 5 | 23.81 | 12,936.7 | 7.732 | 4053.8 | 2011.1 |
| 3 | 4 | 19.05 | 26,413.4 | 5.287 | 4234.0 | 3696.57 |
| Code | MP | CF | WF | FOOD | EI | SCORE |
|---|---|---|---|---|---|---|
| ALB1 | B | 3 | 0 | 0 | 3 | 6 |
| PISC3 | C | 1 | 1 | 1 | 1 | 4 |
| NUB10 | B | 1 | 1 | 1 | 1 | 4 |
| ALB14 | B | 3 | 3 | 1 | 3 | 10 |
| ALC15 | C | 3 | 3 | 1 | 3 | 10 |
| ALC16 | C | 3 | 3 | 1 | 3 | 10 |
| ALC17 | C | 3 | 3 | 1 | 3 | 10 |
| NUC23 | C | 0 | 0 | 1 | 0 | 1 |
| ALC27 | C | 3 | 3 | 1 | 3 | 10 |
| ALB30 | B | 3 | 3 | 0 | 3 | 9 |
| ALC31 | C | 3 | 3 | 1 | 3 | 10 |
| ALB32 | B | 3 | 3 | 1 | 3 | 10 |
| ALC33 | C | 3 | 3 | 1 | 3 | 10 |
| NUC35 | C | 0 | 0 | 1 | 0 | 1 |
| NUB38 | B | 0 | 1 | 3 | 1 | 5 |
| NUC41 | C | 0 | 0 | 1 | 0 | 1 |
| NUC43 | C | 0 | 0 | 1 | 0 | 1 |
| NUC49 | C | 0 | 0 | 1 | 0 | 1 |
| Code | MP | CF | WF | FOOD | EI | SCORE |
|---|---|---|---|---|---|---|
| PLB2 | B | 3 | 1 | 0 | 1 | 5 |
| PLB4 | B | 1 | 3 | 0 | 3 | 7 |
| APRC5 | C | 3 | 1 | 3 | 3 | 10 |
| PLB6 | B | 3 | 1 | 0 | 1 | 5 |
| PLC7 | C | 3 | 0 | 3 | 3 | 9 |
| CHB11 | B | 0 | 0 | 0 | 0 | 0 |
| PLB13 | B | 1 | 3 | 0 | 3 | 7 |
| PLB18 | B | 3 | 1 | 0 | 1 | 5 |
| PLC19 | C | 3 | 0 | 3 | 3 | 9 |
| PLB20 | B | 3 | 1 | 0 | 1 | 5 |
| APRC21 | C | 3 | 1 | 3 | 3 | 10 |
| APRB22 | B | 3 | 0 | 0 | 3 | 6 |
| PLB26 | B | 3 | 1 | 0 | 1 | 5 |
| PEB34 | B | 1 | 1 | 0 | 0 | 2 |
| PEC37 | C | 1 | 0 | 3 | 1 | 5 |
| PEB40 | B | 1 | 3 | 0 | 1 | 5 |
| CHB42 | B | 0 | 0 | 0 | 0 | 0 |
| PEC44 | C | 1 | 0 | 3 | 1 | 5 |
| PEB46 | B | 1 | 1 | 0 | 1 | 3 |
| PLB48 | B | 3 | 1 | 0 | 3 | 7 |
| PLC53 | C | 3 | 3 | 0 | 3 | 9 |
Publisher’s Note: MDPI stays neutral with regard to jurisdictional claims in published maps and institutional affiliations. |
© 2022 by the authors. Licensee MDPI, Basel, Switzerland. This article is an open access article distributed under the terms and conditions of the Creative Commons Attribution (CC BY) license (https://creativecommons.org/licenses/by/4.0/).
Share and Cite
Ioannidou, S.; Litskas, V.; Stavrinides, M.; Vogiatzakis, I.Ν. Placing Ecosystem Services within the Water–Food–Energy–Climate Nexus: A Case Study in Mediterranean Mixed Orchards. Agronomy 2022, 12, 2224. https://doi.org/10.3390/agronomy12092224
Ioannidou S, Litskas V, Stavrinides M, Vogiatzakis IΝ. Placing Ecosystem Services within the Water–Food–Energy–Climate Nexus: A Case Study in Mediterranean Mixed Orchards. Agronomy. 2022; 12(9):2224. https://doi.org/10.3390/agronomy12092224
Chicago/Turabian StyleIoannidou, Sotiroula, Vassilis Litskas, Menelaos Stavrinides, and Ioannis Ν. Vogiatzakis. 2022. "Placing Ecosystem Services within the Water–Food–Energy–Climate Nexus: A Case Study in Mediterranean Mixed Orchards" Agronomy 12, no. 9: 2224. https://doi.org/10.3390/agronomy12092224