Article

Effect of Cow Urine Nitrogen Rates and Moisture Conditions on Nitrogen Mineralization in Andisol from Southern Chile

by
Magdalena Ramírez-Sandoval
1,*,
Dante Pinochet
1,
M. Jordana Rivero
2,* and
Laura M. Cardenas
2
1
Instituto de Ingeniería Agraria y Suelos, Facultad de Ciencias Agrarias, Universidad Austral de Chile, Valdivia 5090000, Chile
2
Net Zero and Resilient Farming, Rothamsted Research, North Wyke, Okehampton, Devon EX20 2SB, UK
*
Authors to whom correspondence should be addressed.
Agronomy 2023, 13(1), 10; https://doi.org/10.3390/agronomy13010010
Submission received: 24 October 2022 / Revised: 11 December 2022 / Accepted: 16 December 2022 / Published: 21 December 2022
(This article belongs to the Special Issue Assessing Sustainability of Ruminant Livestock Forage-Based Systems)

Abstract

:
Urea present in cattle urine contributes large amounts of nitrogen (N) to grazed pastures, which can be the equivalent to approximately 1000 kg N ha−1. However, there are no studies in volcanic soils of southern Chile on the effect of different concentrations of urinary N deposited in the soil, nor of the effect different wetting and drying conditions mimicking the variation in weather conditions on the nitrification process from urea to NH4+ and total oxidized nitrogen (TON) over time. In addition, the inhibition of nitrification driven by the accumulation of NH3 at high rates of N applied to Andisol has not been evaluated. Fresh cattle urine was applied at three different rates of N equivalent to 247 kg N ha−1 (Low N), 461 kg N ha−1 (Medium N), and 921 kg N ha−1 (High N), as well as deionized water as a control. Further, three moisture conditions were imposed: constant moisture (CM), drying–rewetting (DRW) cycles at 7-day intervals, and soil drying (SD). Destructive soil core samples were evaluated for top and bottom halves individually every 7 days over a 36-day period to measure changes on inorganic N and pH. There were no interaction effects for N rates and soil moisture. The main effect of the different rates of N on mineralization was significant throughout the incubation period, while the effect of the different moisture conditions was variable over time. High N was associated with elevated NH3 concentrations and could explain why total N mineralization was partially inhibited. These results suggest that the presence of different nitrifying microorganisms in soil under different chemical and physical conditions determines nitrification, and thus, the oxidation of ammonia should be studied in more detail as the first step of nitrification, specifically in volcanic soils.

1. Introduction

Nitrogen (N) is a primary macronutrient that is usually required in fertilization to obtain the highest growth and productivity of biomass. The two main forms of nitrogen used to fertilize grasslands are ammonium (NH4+) and nitrate (NO3). A large proportion of N ingested by grazing livestock (55–90%) is returned to the soil in animal excreta, particularly through urine [1]. Both the frequency and volume of urine excretion result in a total production of up to 42 L of urine per day in dairy cows [2,3]. According to Hoogendoorn et al. [3], N concentration can vary between 6 and 15 g N L−1. Meanwhile, both the stocking rate and stocking method influence the amount of urine deposited on grazed pasture [4], while overlaps between urine patches can happen [5]. A urine patch can affect an area of 0.2 to 0.5 m2 [6,7,8], penetrating the soil profile at a depth of up to 60 cm [9], and due to the small area covered, the equivalent rate of N under a urine patch at high stocking density can reach up to 1000 kg N ha−1 [8,10,11].
Between 70 and 90% of the total N in cattle urine can be found in the form of urea [7,12]. When urine is deposited on wet soil, the urease enzyme hydrolyzes urea to produce NH4+ and a volatilization of ammonia (NH3) [13]. Then, under aerobic conditions, nitrification occurs, where NH4+ is subsequently converted into NO3 through nitrite (NO2). Cattle urine deposition produces large and rapid changes in soil pH that initially increase up to three units per day [14] due to the hydrolysis of urea to NH4+, and the subsequent nitrification of NH4+ to NO3 results in a decrease in pH over a period of approximately two weeks [15]. The decrease in pH is due to the production of H+ during the processes of the volatilization and nitrification of NH3 [16]. Venterea and Rolston [17] demonstrated that a decrease in soil pH during nitrification could result in a critical pH level, where nitrification was restricted. The oxidation of NH3 has been identified as a limiting step in nitrification [18], which occurs through two steps of mutualistic symbiosis between ammonia-oxidizing bacteria (AOB) and ammonia-oxidizing archaea (AOA) [19]. Several studies have shown that urinary N rates equivalent to 1000 kg N ha−1 inhibit nitrification, and this inhibition can be explained by the accumulation of NH3 [14,20,21,22]. However, the duration of this inhibition is variable [23].
Volcanic soils (Andosols or Andisols) are described as highly productive soils and comprise less than 1% of the world’s soil resources [24]. Andisols have very specific physicochemical properties, such as variable charges, high content of organic matter, and high phosphate retention [25,26]. In addition, Andisols have an apparent density of less than 0.9 g cm−3 and high water retention capacity at low matrix potential values [27]. Understanding and identifying the effects of urine deposition by cows on N mineralization in volcanic soils over a short period under different moisture conditions and rates is important for predicting the impact of changes in rain and drought patterns on the agricultural systems of southern Chile. Our hypothesis is that different rates of bovine urinary N and different moisture conditions applied to soil affect N mineralization in the relatively short-term period. The aims of this work are to describe the effects of different rates of urinary N and different moisture conditions on the dynamics of N mineralization and pH throughout an incubation period of 36 days and to identify the effects of high rates of urinary N on the inhibition of nitrification associated with the oxidation of accumulated NH3 in soil.

2. Materials and Methods

2.1. Soil Samples Used for the Study

The study was carried out with samples of soil from southern Chile from the Vista Alegre research farm (Universidad Austral de Chile) located in Región de los Ríos, Valdivia, Chile (39°47′ S, 73°12′ W; Figure 1), at 20 m.a.s.l. The soil was an Andisol from the Valdivia soil series classified as Duric Hapludand [28] and was collected from natural grassland to a depth of 10 cm using a shovel. For chemical characterization, three samples were obtained from the site and analyzed at the Soils Lab of the Universidad Austral de Chile (Table 1). For the experiment, the soil was collected from 10 randomly distributed sampling points from a plot of 1200 m2. After sampling, the soil samples were air-dried until they reached 35–45% moisture (dry soil basis). Roots and plant residues were removed, and they were sieved to <2 mm. The homogenized, pooled sample was stored at 4 °C before starting incubation.

2.2. Design of the Incubation Experiment

The design of the experiment was based on the work of Pezzolla et al. [29]. The experimental design consisted of a factorial design, where the factors studied were the cattle urine N rates applied (at four levels) and moisture conditions (at three levels) with seven destructive sampling times. At each sampling time for each combination of N rate applied and soil moisture condition, there were three replications. Urine was collected from at least seven lactating dairy cows grazing on a Lolium perenne L. and Bromus valdivianus Phil. sward at the Agricultural Austral Experimental Station, Universidad Austral de Chile, Valdivia, Chile. After collection, the urine was immediately stored in a 5 L air-tight plastic container at 4 °C to avoid the hydrolysis of urea. Three homogenized urine sub-samples were analyzed to determine the concentration of N. Cattle urine contained 6.11 g L−1 total N. Subsequently, the N concentration in the urine was adjusted by either adding urea or diluting urine (by adding deionized water) to produce three treatments with urine concentrations corresponding to urine low in N (low N), moderate in N (medium N), and high in N (nigh N), reaching concentrations equivalent to 247, 461, and 921 kg N ha−1, respectively. Deionized water was used as a control treatment (0 kg N ha−1).
For incubation, cores were packed to an apparent density of 0.65 g cm−3 at a height of 7.5 cm in plastic tubes of 4.5 cm diameter with initial moisture of 42%. In total, each core was equivalent to 108 g of moist soil. Cores were pre-incubated in the dark at 20 °C. The four N treatments (low N, medium N, high N, and control) were subjected to different moisture conditions. The first moisture condition consisted of maintaining constant moisture (CM) at 85% water-filled pore space (WFPS), adjusting moisture daily based on weight difference by adding deionized water. The second moisture condition consisted of successive drying–rewetting (DRW) cycles, with drying periods of 7 days for each core (Figure 1). Replacement water level was added to obtain 85% WFPS, and destructive samplings were carried out the next day. The third moisture condition consisted of progressive soil drying (DS) until the end of incubation. Incubation was carried out at 20 °C in dark conditions.
At the beginning of incubation, the soil moisture of each core was adjusted to 85% WFPS considering the amendment. In total, there were seven destructive samplings every 7 d after the first sampling on day 0, which corresponded to 1 h after the application of the amendments. The following sampling days were on days 1, 8, 15, 22, 29, and 36. For soil analyses, each core was divided into two halves to separate the top section from the bottom section. In total, there were 18 cores for each of the 12 combinations of N rate and moisture condition, i.e., 6 sampling points times 3 replicates for each treatment. Thus, adding the 12 cores of the initial sampling, a total of 228 cores were sampled.

2.3. NH4+, TON, NH3, and pH Determinations

Before the start of incubation, each soil sample was analyzed for NH4+ and total oxidized nitrogen (TON), which included NO3, NO2, and CaCl2 pH. The mineral N, corresponding to the sum of NH4+ and TON, was extracted by filtering 10 g of wet soil stirred for one hour with 50 mL of 2 M KCl. Then, 10 mL of the filtered solution was taken and added to a digestion tube, adding MgO to obtain NH4+, which was distilled by steam stripping and, later, Devarda alloy to obtain TON under the same procedure. Both were trapped with boric acid and titrated with 0.005 N H2SO4. pH was determined in CaCl2 0.01 M in a 1: 2.5 ratio [30]. Free NH3 concentrations were estimated according to the functions proposed by Watson et al. [31] and Smith et al. [32], using NH4+ and pH measurements for each core:
NH 3 = NH 4 + 1 + 10 10.068 0.033 T pH
where, [NH3] is the concentration of free NH3 (mg N kg−1), [NH4+] is the concentration of NH4+ (mg N kg−1), T is the temperature (20 °C), and pH is the measurement of pH in CaCl2.
The mineral N (mg) was measured in each sampled core (both top and bottom sections of the core). The percentage of total mineralized N with respect to the total N amount applied to each core for each sampling day was calculated:
%   of   total   mineralized   N = NH 4 + + TON T o t a l   N   a p p l i e d 100

2.4. Statistical Analysis

A two-way analysis of variance (ANOVA) was used to assess the effects of the levels of urine N concentration and the soil moisture conditions on the concentrations of NH4+, TON, and CaCl2 pH for each sampling day. NH4+ and TON concentrations were transformed into Ln for the top section of each core and 1/y for the bottom section. The proportion of mineralized N was transformed into Arcos to meet test assumptions. Tukey tests were used as a post hoc test for mean separation (p < 0.05). All statistical tests and figures were produced using GraphPad Prism v7. All data are expressed on a soil dry weight basis, and the results are reported as the means of three replicates ± standard error of the mean (SEM).

3. Results

3.1. NH4+, TON, and NH3 Mineralization

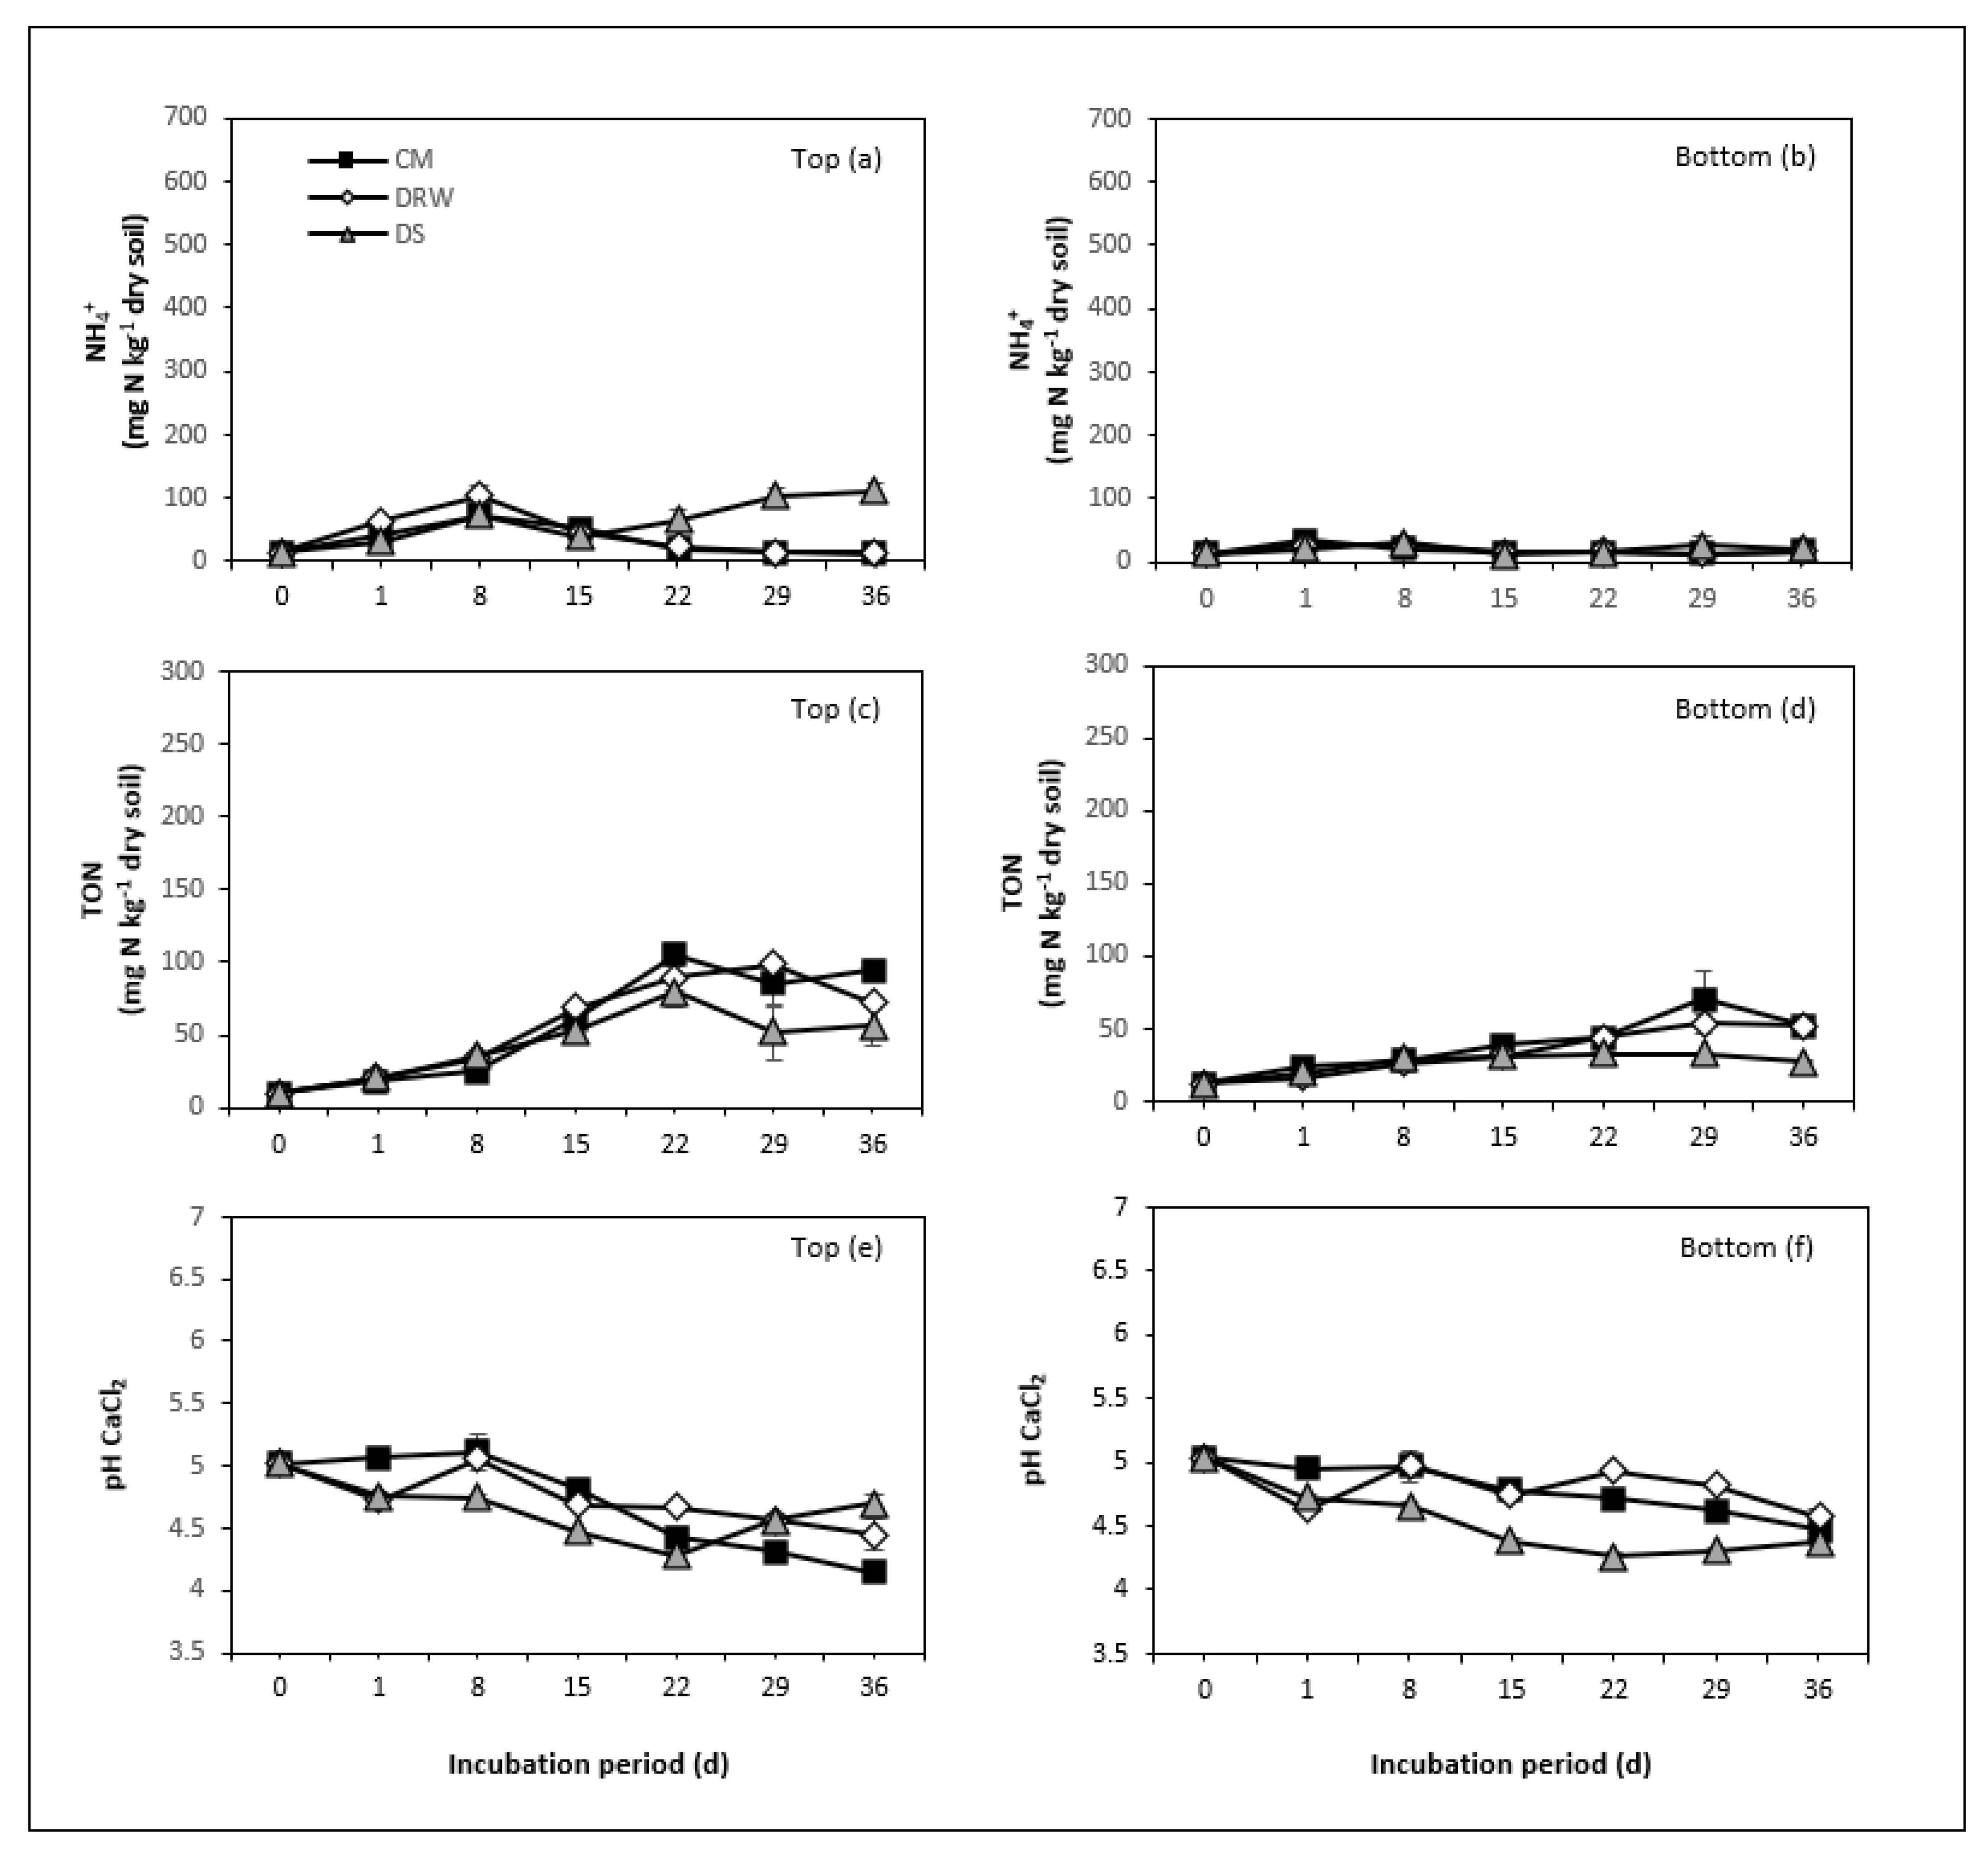
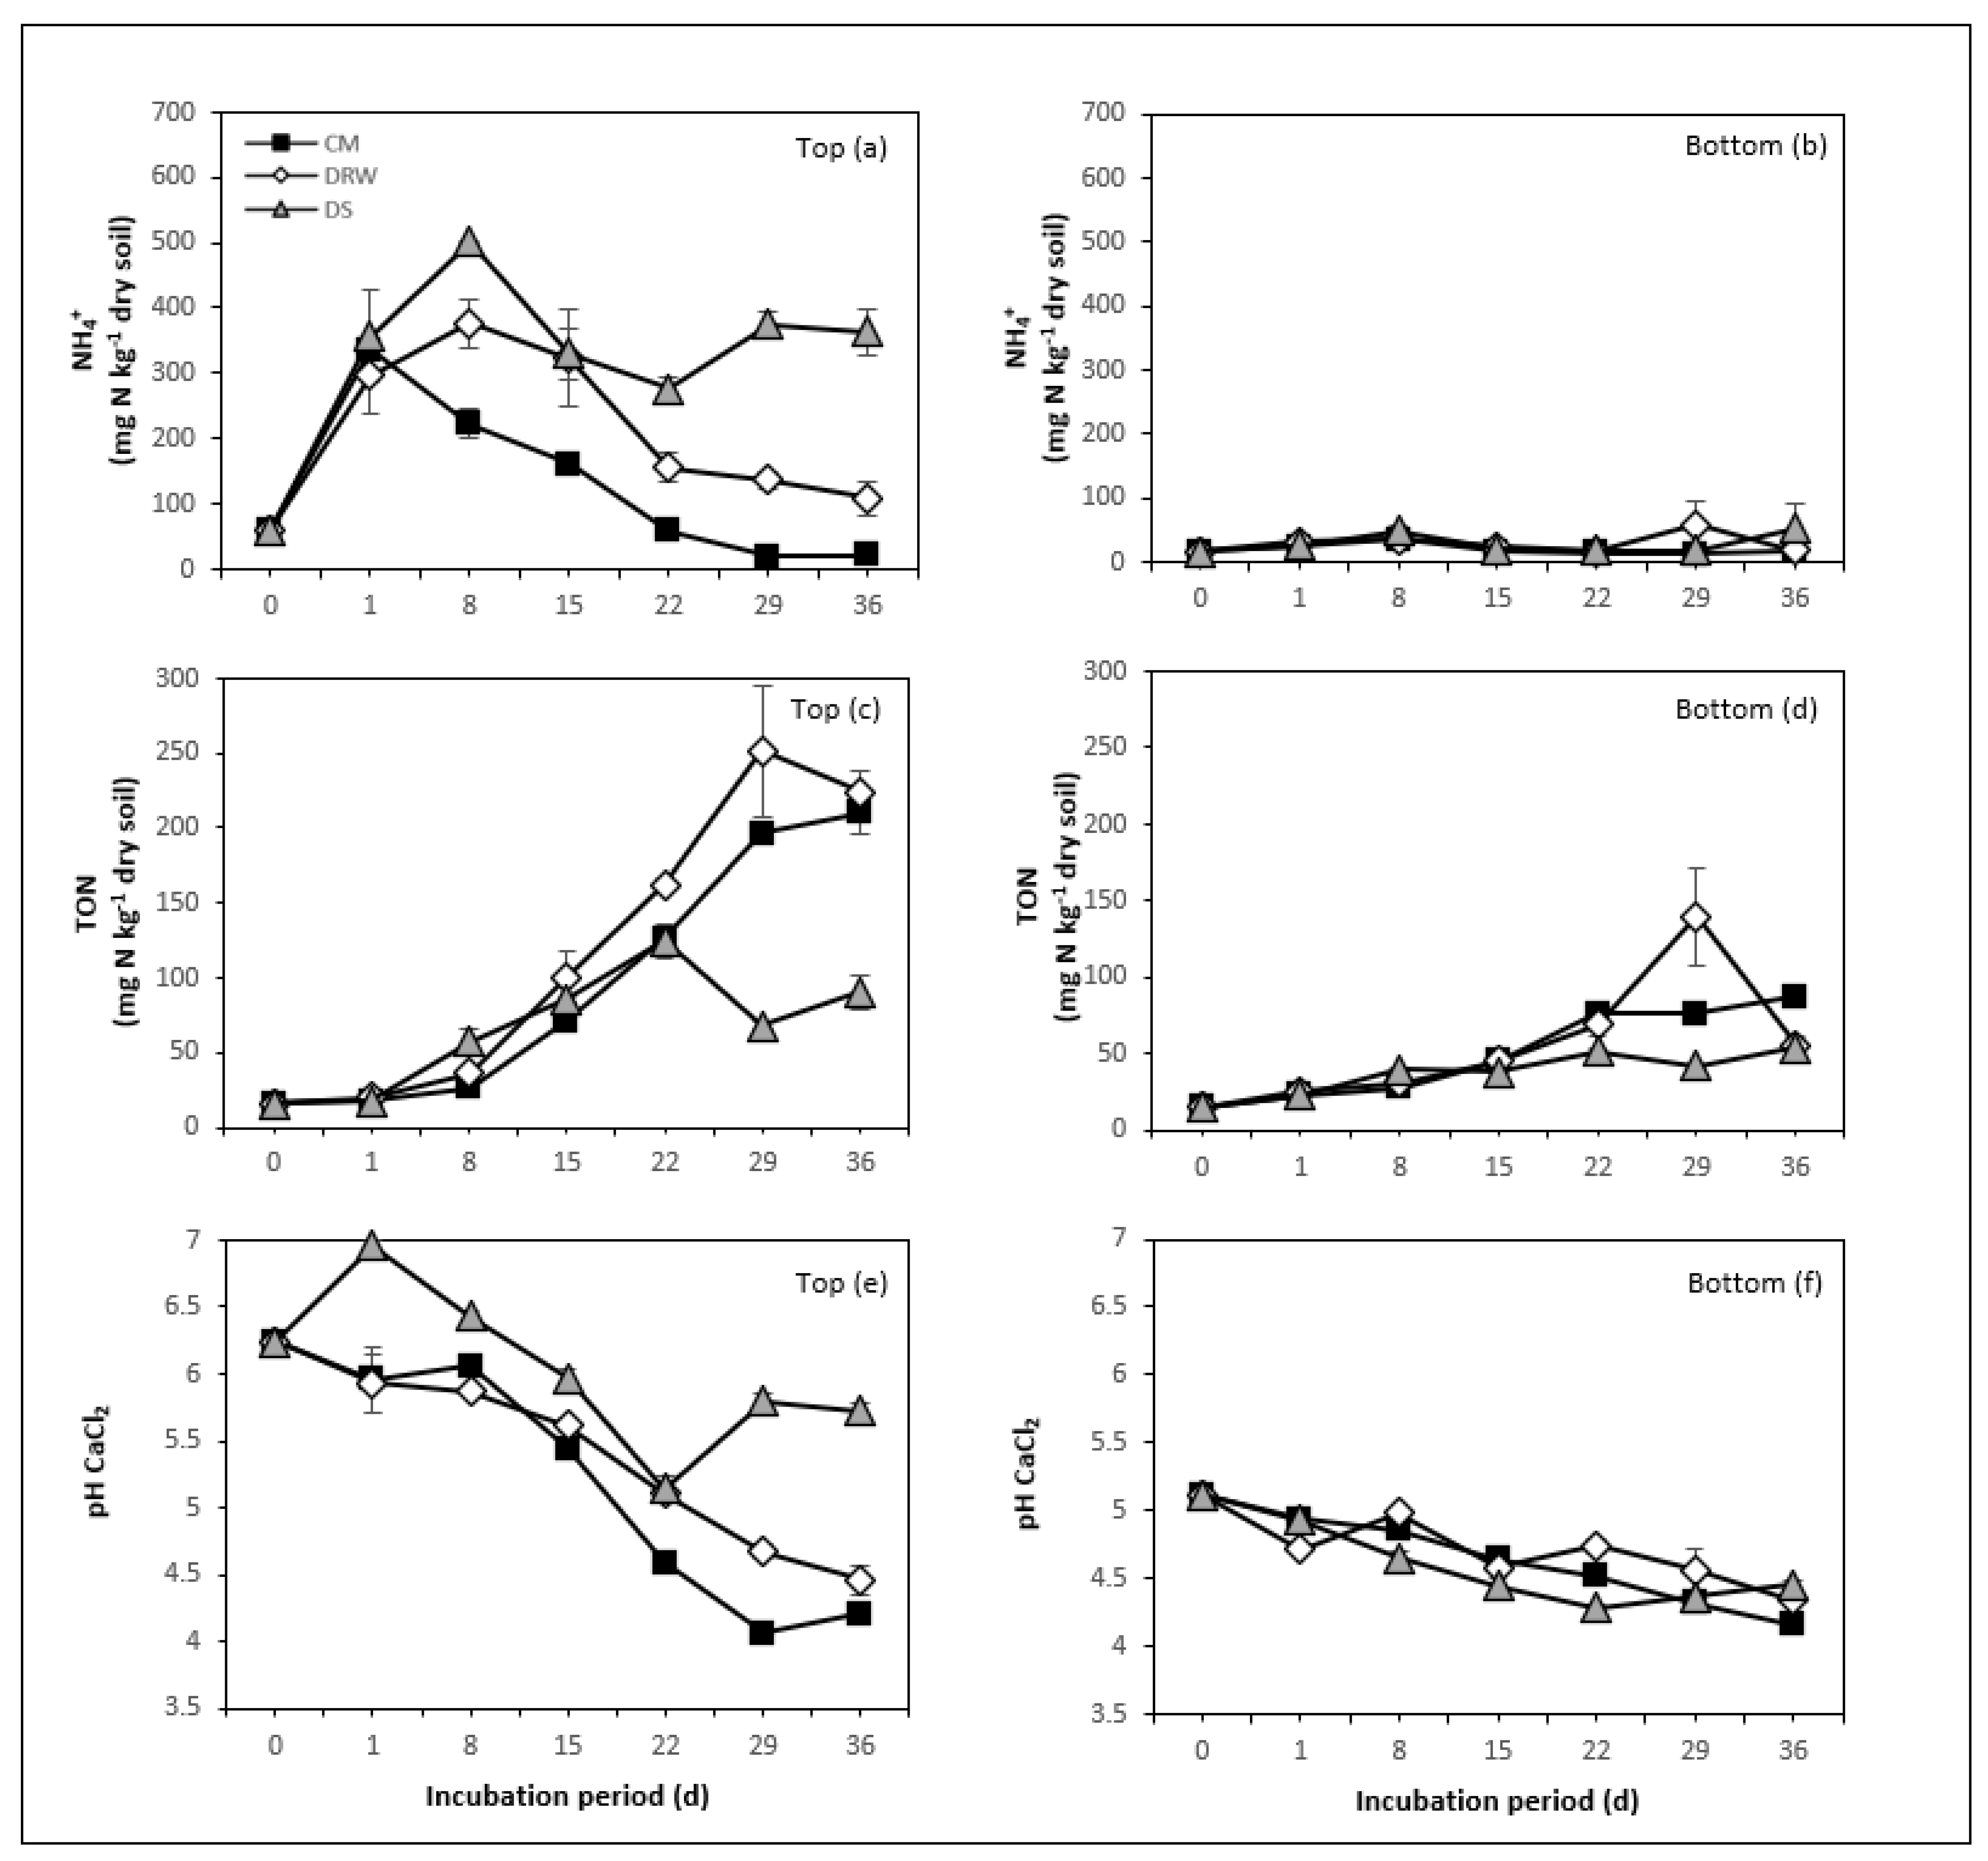
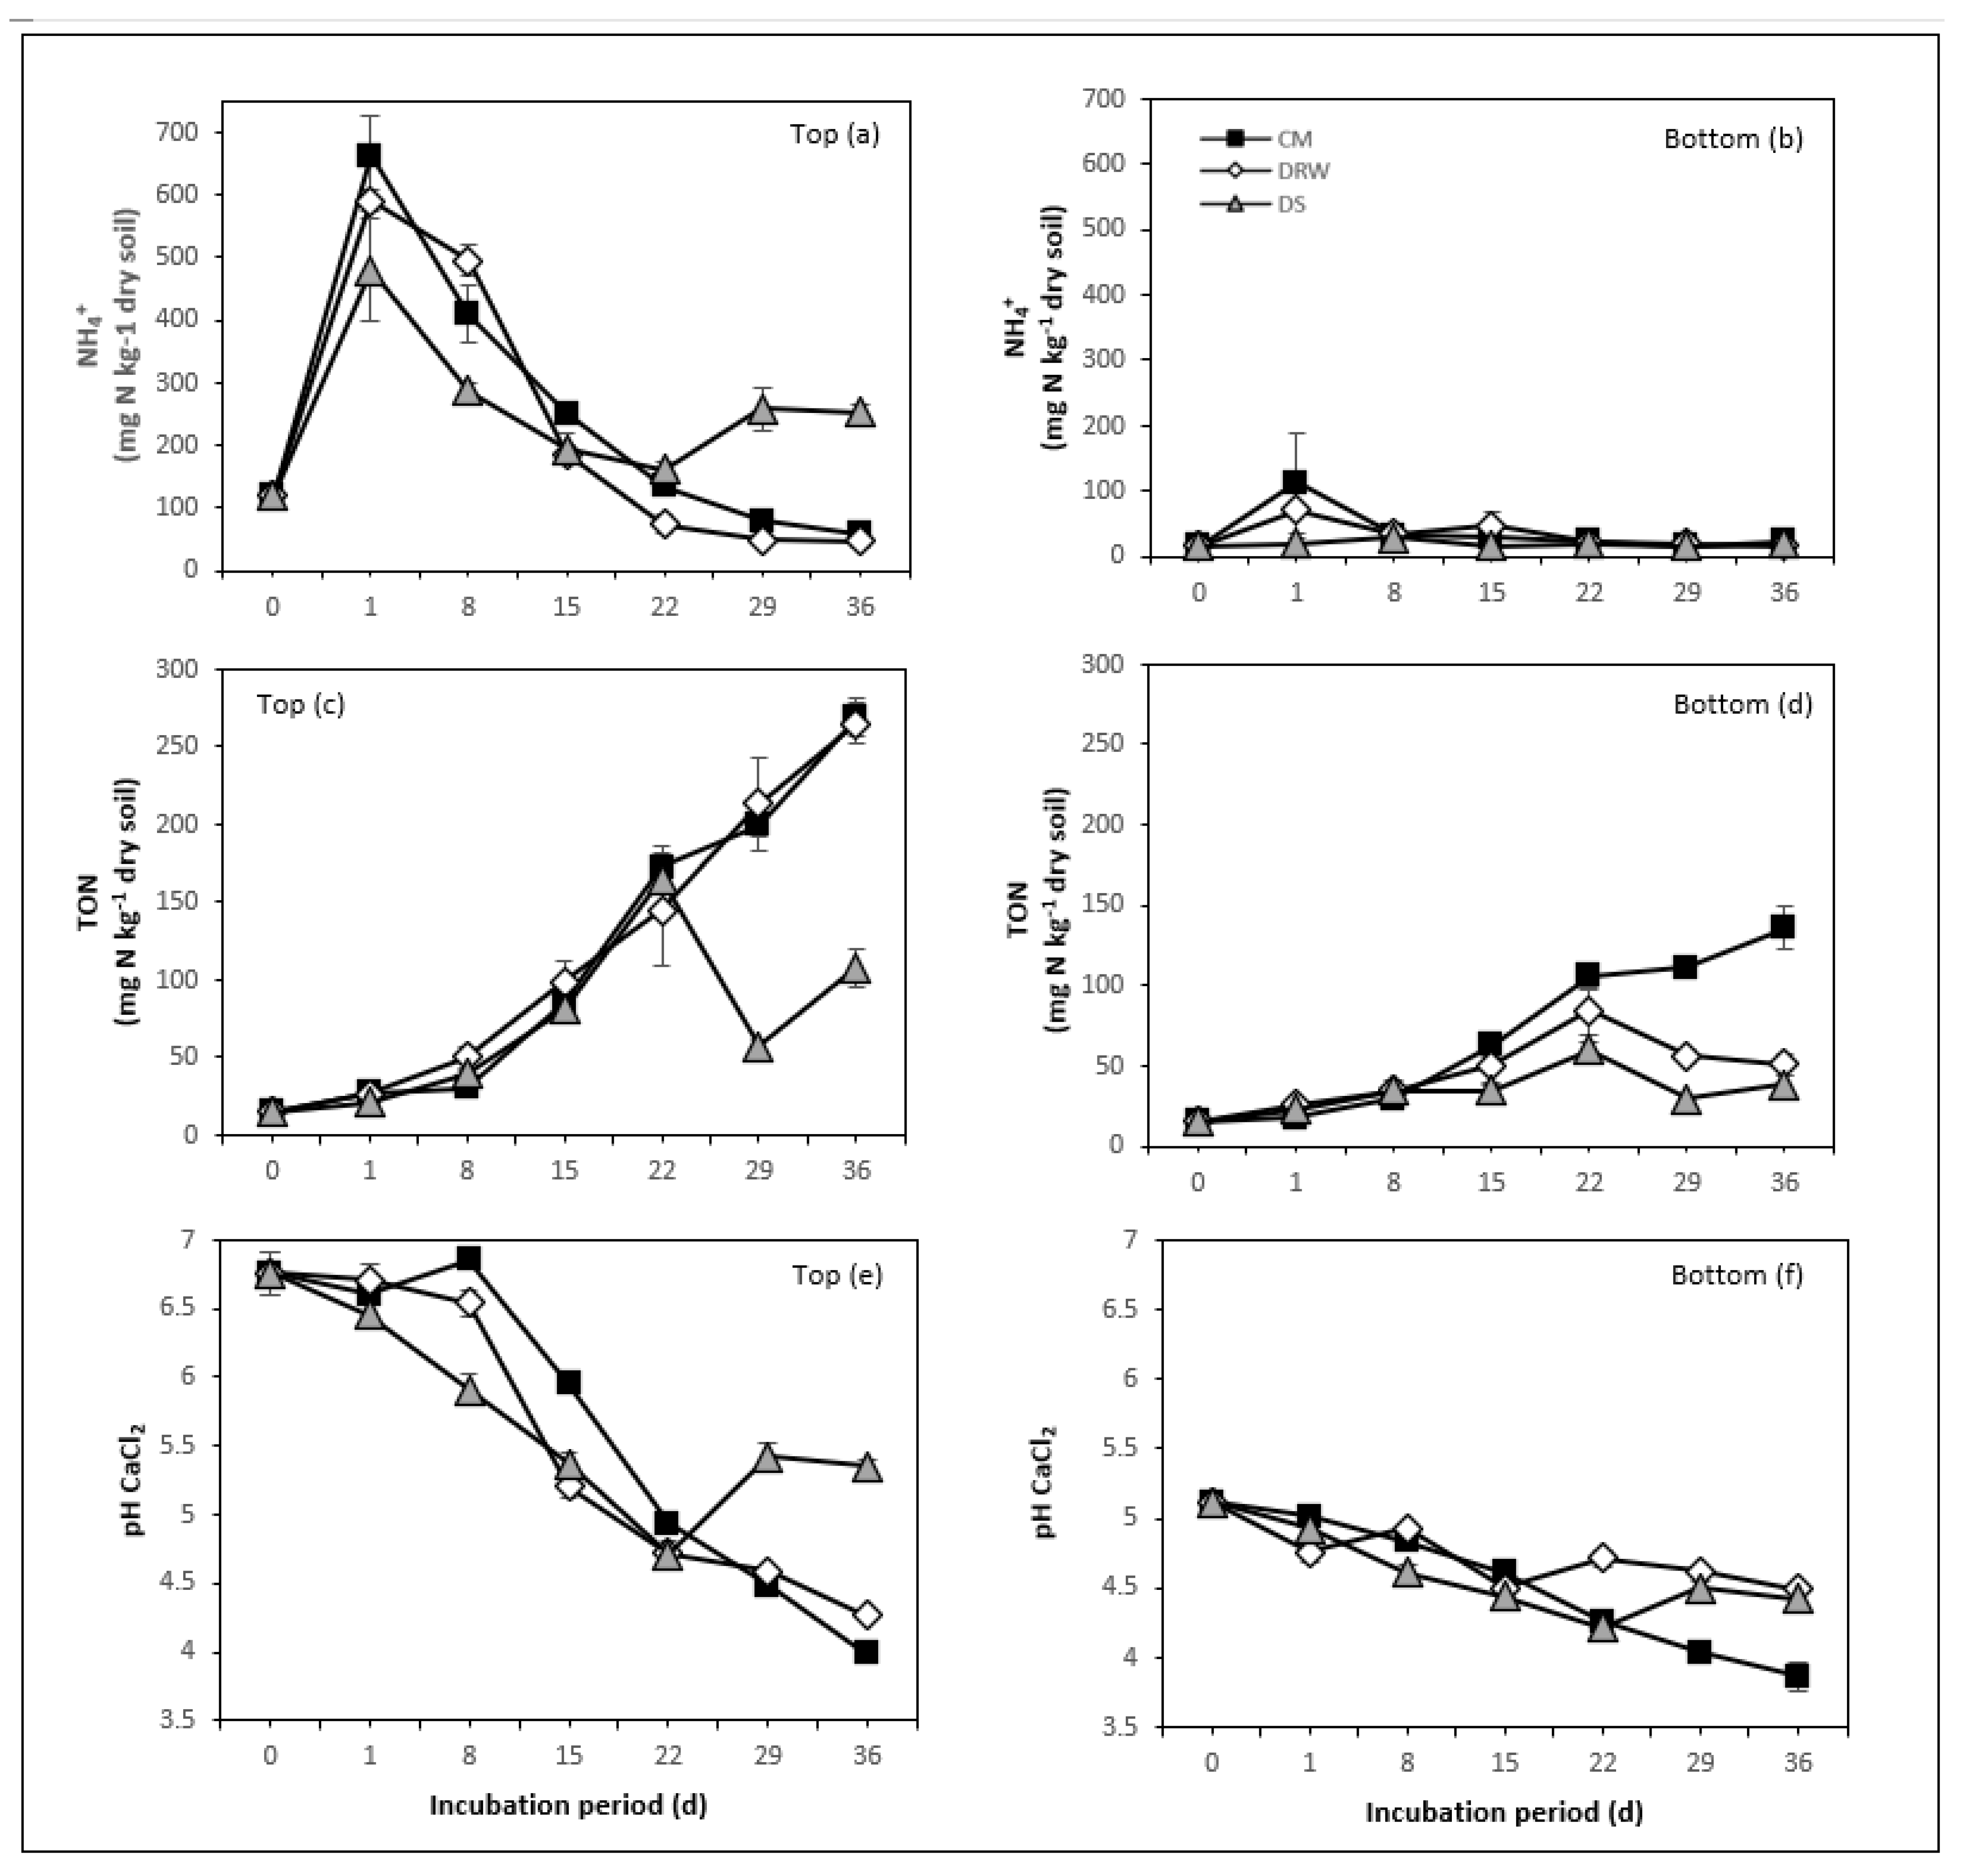
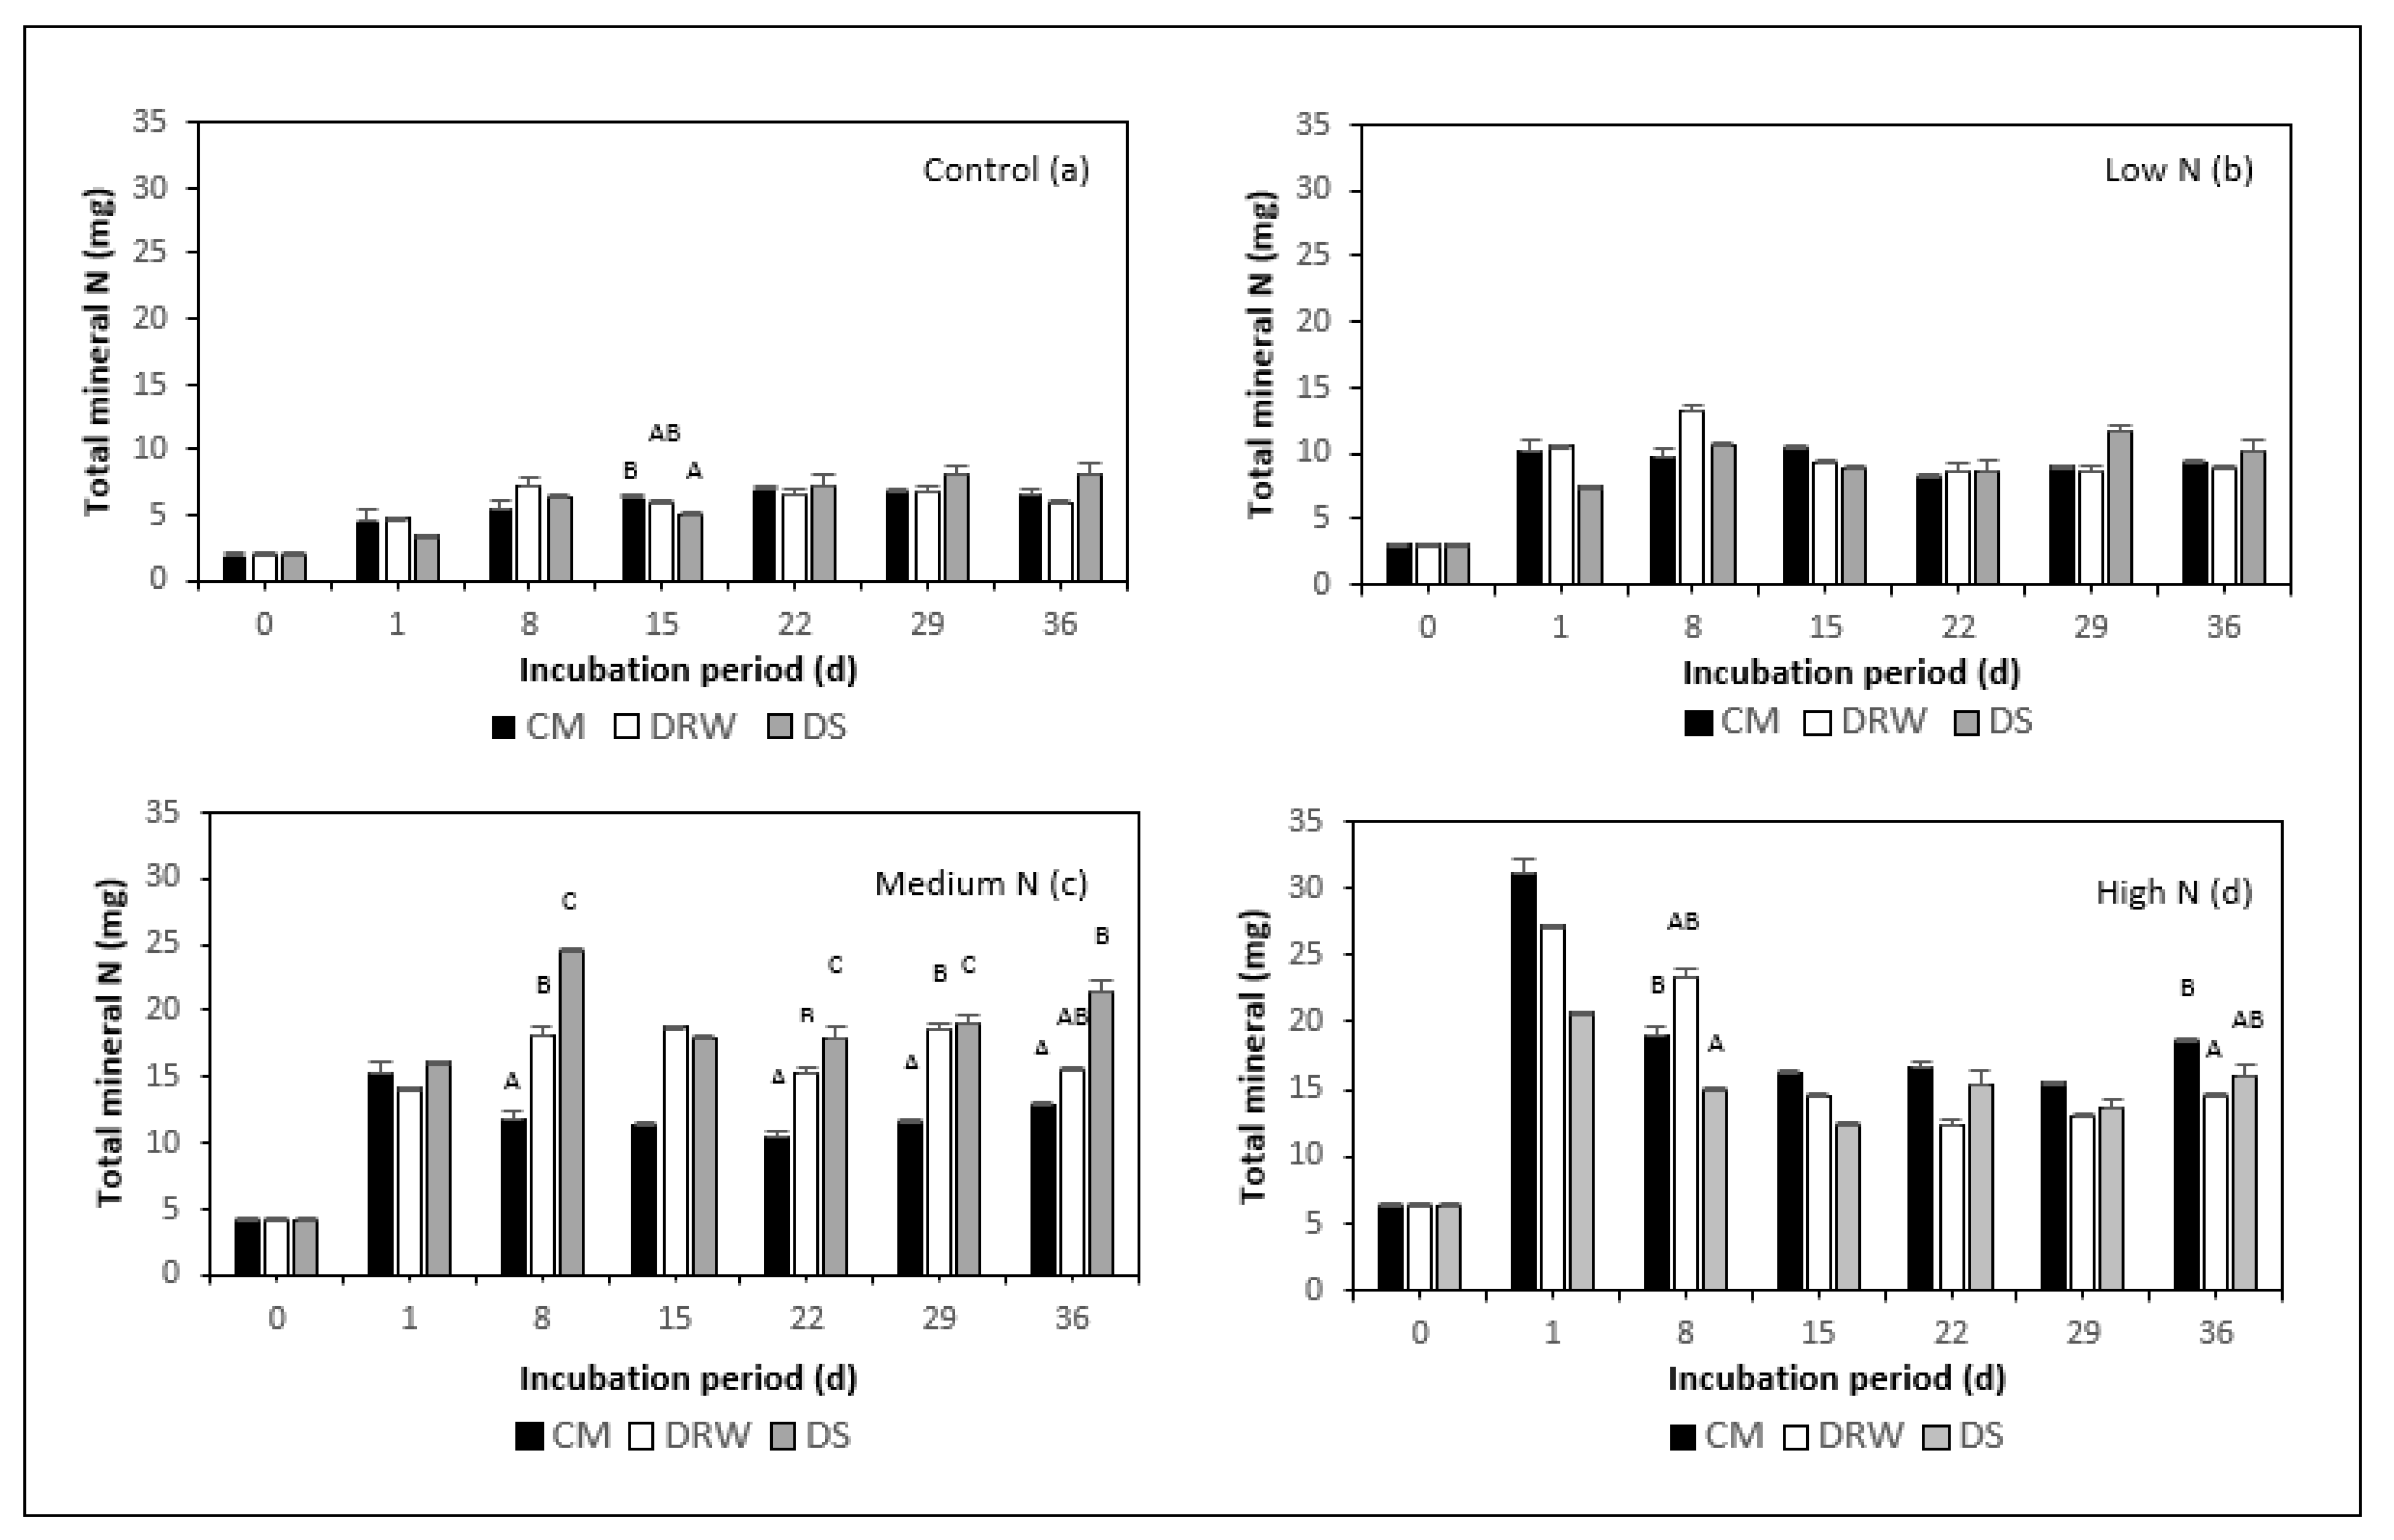
There were no significant differences in NH4+ concentrations between N rates, moisture conditions, or interaction effects (except on day 29) for the bottom sections of cores throughout the whole period (Table 2). On the other hand, NH4+ concentrations significantly varied throughout the incubation period in the top sections of the cores amongst the N rates and moisture conditions (Table 2, Figure 2, Figure 3, Figure 4 and Figure 5), and interaction effects were observed from day 8 of incubation. There were differences in NH4+ concentrations among all rates of N throughout the entire incubation (p < 0.0001), but there were no differences between the moisture conditions until day 15. There were no significant differences between all N rates and all moisture conditions for the bottom sections of cores throughout all of the incubation period. The maximum concentrations of NH4+ were observed between days 1 and 8 in all the N rates, being the highest for high N, with peaks of (mean ± SEM) 662 ± 65.3, 591 ± 16.8, and 495 ± 23.1 mg N kg−1 on day 1 for the moisture conditions CM, DRW, and DS, respectively (Figure 5a), and then decreasing to values up to ten times smaller than the peaks for the CM and DRW conditions. In the control samples for all the N application rates, the concentrations of NH4+ in the DS condition decreased until day 22, increasing again until the end of the incubation period and reaching similar values to those observed on day 15. The decrease in NH4+ concentrations from day 1 to 36 between medium N and high N for the CM condition was 8.9 ± 1.26 mg kg−1 d−1. For high N in the bottoms of the cores, a slight increase in NH4+ concentration for the CM and DRW conditions was observed the day after the application of the amendments.
During the incubation period, in the bottom halves of the cores for the low, medium, and high N rates, the TON concentrations increased, and small peaks were also observed in some N rates from day 22 until the end of incubation period. In the case of the top halves of the cores, there were peaks on occasions, e.g., for high N under the CM and DRW conditions at day 29, and particularly, in all N rates in DS conditions, the peak was on day 22 and began to decrease after. However, for medium N and high N rates, both increased again from day 29 (Figure 4c and Figure 5c). From day 15, there were differences (p < 0.001) in TON concentrations among all the N rates for the top and bottom halves, while for the different moisture conditions, there were differences on days 8, 29, and 36 for the bottom sections and from day 22 onward for the top sections (Table 2). Interactions between the factors occurred (p < 0.005) only in the top sections on days 29 and 36. Concentrations of TON began to increase from day 8 in all the N treatments, where the maximum concentration occurred on the last day of the experiment for high N with the CM and DRW moisture conditions at 264 ± 13.1 and 268 ± 12.7 mg N kg−1, respectively (Figure 5c). There was also a peak in medium N for the DRW condition on day 29. In the bottom halves of the cores, the increases in TON concentrations were small, reaching values close to 50 mg N kg−1 for the control treatment and low N and showing some differences between moisture conditions from day 22 (Figure 2d and Figure 3d). From day 22, for medium N and high N, the differences between moisture conditions were variable, reaching values between 100 and 150 mg kg−1 in the CM condition on the last day of incubation, while DRW and DS continued at values close to 50 mg kg−1.
Generally, considering the total mineral N (NH4+ and TON) in both sections (top and bottom), from the first day of incubation, the fluctuations in N across time within each moisture condition seemed minor (Figure 6). However, for medium and high N, significant interaction effects (Table 2) were expressed in the differences between each moisture condition within the same day. In the case of medium N, there was a clear trend, i.e., DS > DRW > CM, whilst for high N, the pattern was not that clear. Greater amounts were observed, on average, on days 1 and 8, with values between 25 and 30 mg in the CM and DRW conditions, practically trebling the amount of mineral N in the control treatment and doubling the amount for low N (Figure 6). Thus, the effect of the N rate on total mineral N was highly significant (p < 0.0001) throughout the experiment. There were no effects of moisture treatment on days 1 and 15, but there was an interaction effect between N rate and moisture from day 8 to day 36 (Table 2). The results of medium N, high N, and moisture conditions over time were distinct; in general, for medium N the highest values occurred in the DS condition, while in high N they occurred in the CM condition (Figure 5c,d).
The percentage of N that was mineralized over time in relation to the N rate applied showed the largest value for medium N, reaching a maximum of 35%, and minimum values from 5 to 10% were presented for low N and high N in the last 3 weeks of the incubation period (Figure 7). In addition, the pattern of the proportion of mineralized N from the total N applied over time was similar between low N and high N. Effects of the N rate on the proportion of total N mineralized were observed from day 8 (Table 2, p < 0.0001). Moisture conditions only affected the soil samples on days 22 and 29 (p < 0.001), while there were interaction effects from day 15 (Table 2).
Regarding NH3 concentration, interaction effects were significant throughout the whole period (Table 2). The maximum values were found for high N and were 517 ± 33.18 and 574 ± 78.7 mg N kg−1 in the CM condition and 618 ± 119.32 mg N kg−1 in the DRW condition on day 1. For the lower N rates, NH3 concentrations were between 0 and 300 mg N kg−1 in all moisture conditions.

3.2. Soil pH

The addition of N from cow urine increased soil pH, following the same trend as the N rate applied and decreasing until the end of the experiment (Figure 2e, Figure 3e, Figure 4e and Figure 5e). There were differences (p < 0.05) amongst all the N rates and moisture conditions in the top and bottom sections over time (Table 2). In the top sections, the interaction effect occurred throughout the incubation period, while in the bottom sections, it only occurred from day 15 to the end of the experiment (Table 2). In the control treatment, the pH declined to values close to 4.5 at the end of the experiment. For low N and medium N, the peak was reached on day 1 of incubation, with means of 5.9 and 6.9, respectively, in the DS condition (Figure 2e and Figure 3e). For high N, the maximum value was reached on day 8, with a pH of 6.8 in the CM condition. For all N rates in the DS condition, the pH decreased until day 22 and increased again to a pH like that of day 15 at the end of the incubation period, while for CM and DRW, it decreased to pH values between 4.0 and 4.5. In the bottom sections, in general, the initial pH in all the N rates was 5.0, decreasing to a pH close to 4.5 in all moisture conditions (Figure 2f, Figure 3f, Figure 4f and Figure 5f).

4. Discussion

4.1. N Rate and N Mineralization

Similar to other studies carried out with bovine urine [22,33,34], our study showed higher pH levels from the beginning of the incubation period that followed the same trend as the N rate applied, with a similar trend in NH4+ concentrations and both variables declining over time. Accumulated NH4+ was reported to nitrify to NO2 and NO3, generally within a few weeks after urine application to the soil [35], with longer periods also having been reported [36,37]. Under high N, all moisture conditions resulted in high NH4+ concentrations (662 mg kg−1) on day 1, gradually decreasing until day 36, while TON concentrations were only close to 300 mg kg−1. For NH4+ and TON, the maximum proportion of mineralized N with respect to the total N applied through urine was 35% for medium N (64 mg) in the DS condition. However, this proportion was only 20% that of high N (145.3 mg) on the first day of incubation in the CM condition. The proportion of N that was not mineralized was probably immobilized as soil microbial biomass [38], stored as urea, and emitted as NH3 [39]; in addition; smaller amounts of denitrification could have occurred in the form of N2O and N2 [9,40,41].
A few studies have indicated that between 9 and 20% of N can be immobilized in the first 24 h after urinary N application [42,43]. In addition, Thompson and Fillery [44] reported that there was 38% urinary N immobilization in a soil with low carbon content (<1%). In volcanic soils, average NH3 losses from the application of urea are approximately between 35 and 43% [45]. When observing the amount of total mineral N over time in the CM condition (85% of WFPS), this was, in general, lower than those of the other moisture conditions for low N and medium N. This situation could be due to a process that generally occurs in water-saturated soils, where oxygen is depleted and bacteria use NO3 as an electron acceptor, which occurs through denitrification, and NH4+ can benefit from reduction to N2O or N2 [46].

4.2. Nitrification and NH3 Oxidation

A high urine N rate produces greater increases in pH at the soil surface, and before NH4+ oxidizes, it must first be converted into NH3, so the balance between these two compounds depends on pH, which favors NH3 as pH increases [37]. In our study, one of the factors assessed was the effect of a high rate of N application (high N) on the amount of mineralized N over time, which resulted in a decrease in soil pH close to 4.0 at the end of the experiment. The TON concentrations (150 mg) until day 22 for medium N and high N were similar, with a low proportion of mineralized N from the total N applied for high N from the middle of the incubation period (~10%), which may have been caused by levels of NH3 toxic to nitrifying bacteria [21] or elevated levels of ammonium bicarbonate (NH4HCO3) driven by the hydrolysis and nitrification of urea [20]. It has been observed that concentrations close to 730 mg N kg−1 of NH3 for treatments of 1000 kg N ha−1 during the first days of urine application can inhibit nitrification [31,32,47]. However, in the present study, N mineralization occurred until day 36 under high N rates, in contrast to results reported by Somers et al. [22], where after an application of urine equivalent to 1000 kg ha−1, the NO3 concentration was near baseline in the first 35 days of the experiment. The results of our experiment could be explained firstly by the fact that the NH3 concentrations were sufficiently lower than 730 mg N kg−1; secondly, low pH is a potential reason for ammonia-nitrifying archaea (AOA) populations that explain the rates of net N nitrification [48,49,50]. However, the specific mechanism by which NH3 oxidants respond to changes in soil pH remains an enigma.
It was originally believed that the first oxidation step of NH4+ into NO2 was carried out exclusively by AOB. This was refuted by Könneke et al. [51] with the finding of AOA genes, which encode the enzyme responsible for oxidizing NH4+ into hydroxylamine (NH2OH) before converting it into NO2, in addition to being demonstrated by Offre et al. [52]. Among the factors that condition the nitrifying microorganisms present in soil are the availability of NH4+, toxicity by nitric (HNO3) and nitrous (HNO2) acid, and finally, soil pH [53]. Even so, there are studies that have shown that AOA are inhibited by high urine N rates (1000 kg ha−1), having significant growth of AOB, whilst the growth of AOA is substantial in treatments without the addition of N [52,54]. In addition, Offre et al. [52] showed that the abundance of AOB was much higher in upper layers of soil with high fertility (0–0.2 m), while in subsoils the abundance was higher in soils with low fertility (0.4–0.6 m), which was also reported by Leininger et al. [55] and Wessén et al. [56]. However, numerous studies have shown the positive relationship between the abundance of AOA and the nitrification potential of soil [52,57,58,59]. These contradictory results may reflect inherent differences between soils, for example, variations in organic carbon content, soil particle properties, fertilization regime, and pH [60].

4.3. Moisture Conditions and N Mineralization

The mechanisms that induce large differences in N mineralization by drying and wetting have been largely identified in numerous laboratory studies. A clear deficit, however, exists on the study of the effect of soil hydrophobicity on microbial activity in soils with high organic matter contents. These variations may be explained by differences in experimental conditions, such as the duration of incubation, room temperature, drying intensity, frequency of drying and wetting, treatments, and properties of soils [61]. Although some studies have shown that drying–rewetting cycles promote the mineralization [62,63] and nitrification [64] of N in soil, compared to soil with constant moisture, other studies have observed decreases in soil N mineralization [65,66] or no impact on soil N mineralization or nitrification [67,68]. It has been found that, after short periods of drying soil followed by rewetting (less than 10 days), the differences from constantly humid soil in the mineralization of N are minimal. According to our results, CM and DRW had a similar trend throughout the incubation period, finding only a few occasional differences between both moisture conditions for NH4+ and NO3 concentrations, which could be explained by the high drying–rewetting frequency, but with a notorious difference for medium N between the CM and DRW conditions. This finding could be explained by the fact that the pulse of rewetting dry soil can result in a flush of respiration by microbiota [64,67], often increasing within an hour, and at five times higher than soil kept constantly moist [69,70]. This flush usually persists for up to 10 days after rewetting [71,72,73].
The degree of physical disturbance (fineness of sieving) may also influence results if protected organic matter becomes accessible to soil microorganisms due to aggregate disruption [74]. Hassink and Whitmore [75] developed a model where the rate at which organic matter became physically protected depended on the degree to which the protective capacity was filled, incorporating the processes of desorption and adsorption in order to model silt and clay protection of SOM. Malamoud et al. [76] made the assumption that primary interactions occurred between clay particles and soil organic carbon (SOC) components to form organomineral associations, which were then bound together to form aggregates (STRUC-C model). The STRUC-C model considered each aggregate type as being a single carbon pool and did not account for particulate organic matter (POM) in the aggregation process, decomposable plant material, or resistant plant material carbon pools. The formation of macro-aggregates (>250 μm) was considered the aggregation product of micro-aggregates (>53–250 μm), although macro-aggregates are known to consist of both micro-aggregates and silt–clay-sized aggregates (<53 μm), as well as POM [77,78]. Some authors have suggested that macro-aggregates are formed around POM, followed by the release of micro-aggregates as occluded organic materials are decomposed [79,80]. Disturbance of the aggregate structure may also be caused by long drying periods [74], which could artificially increase the availability of nonmicrobial biomass substrates and microbial activity [81]. In our study, the visual rupture of the soil structure caused by low moisture content (around 20-25% water content between days 22 and 29) could have allowed organic matter that was not previously exposed to become accessible to soil microbiota in this period, explaining the new increase in NH4+ concentration for the DS condition in all the N urine rates. It has also been reported that rewetting dry soil leads to alteration in the soil structure, promoting the connectivity of the water into the soil, providing mobile soil microorganisms access to substrates [82,83,84,85], and desorbing organic and inorganic N from the mineral soil surfaces [86].
Regarding the behavior of AOA and AOB in different moisture conditions, AOA and AOB also have different cell structures and physiologies, including osmoadaptation strategies [87], which can lead to different physiological responses to stress from drying–rewetting cycles. Placella and Firestone [88] reported the maintenance of AOA and AOB activity during a drought in two soils in California within hours of rewetting, with a faster recovery of AOB activity. Thion and Prosser [89] showed that the abundance of AOA was significantly less resistant to drought than AOB. These results may be related to the fact that, in the present work, from day 22, in the DS condition for low N, medium N, and high N, the pH levels increased, and the nitrification of TON decreased, which could indicate that AOA are abundant in low pH environments with permanent moisture conditions in volcanic soils.
Part of the results of the present study are reflected in a similar experiment carried out under field conditions in the same type of soil with urine application [9]. In that work, the initial weather conditions caused the soil to have low moisture levels for almost four months, similar to the DS treatment in the present study. N nitrification was also considerably reduced from the third week, reaching similar levels to the control treatment in almost all layer depths of the soil (up to 60 cm), while NH4+ production increased at the same time [9]. These similarities were observed despite the fact that the experiment was carried out under field conditions with undisturbed soil structure, while in the present study, the environmental conditions were controlled and had a disturbed soil structure (sieved). For this reason, in future experiments on these N dynamics, the density and microbial diversity of soil should be evaluated, especially the activities of AOA and AOB, to better explain how different humidity conditions and N availability and at different levels of soil depth affect the N mineralization process in volcanic soil in southern Chile.

5. Conclusions

This is the first work to evaluate the effects of rates from zero to high levels of urine N at different moisture conditions on volcanic soils in southern Chile in a relatively short period of time. Our results suggested how the localized dynamics of N over a short-term period in patches of urine at different rates could affect the absorption dynamics of plants, depending on moisture variation, which alluded to the different climatic conditions existing in southern Chile. The N rate was the greatest determining factor in the transformation of urinary N to NH4+ and TON over all the incubation period. This effect was greater than the effects produced by different moisture conditions. The pH conditioned NH4+ and NH3 volatilization, while pH was permanently affected by both factors.
The partial inhibition of nitrification at the high N rate could be the result of a moderately toxic level of NH3 oxidation on nitrifying microorganisms present in the soil. It was suggested that the presence in the soil of different nitrifying microorganisms conditioned nitrification from urea in wet and dry soil conditions. Although the presence of specific soil-nitrifying microorganisms was not studied in this work, the results obtained suggested that the oxidation of NH3 was the first step of nitrification, and the roles of AOA and AOB in N condition should be studied in more detail under different moisture conditions and N levels, particularly in volcanic soils.

Author Contributions

Conceptualization, M.R.-S., L.M.C. and M.J.R.; methodology, M.R.-S. and D.P.; formal analysis, M.R.-S. and M.J.R.; investigation, M.R.-S.; resources, D.P.; data curation, M.R.-S.; writing—original draft preparation, M.R.-S. and M.J.R.; writing—review and editing, L.M.C. and D.P.; visualization, M.R.-S.; supervision, D.P.; project administration, D.P.; funding acquisition, D.P., M.J.R. and L.M.C. All authors have read and agreed to the published version of the manuscript.

Funding

The Agencia Nacional de Investigación y Desarrollo supported the doctoral studies of M.R.-S. (ANID; Scholarship N° 21160644). Support in the writing of the work was received from the Biotechnology and Biological Sciences Research Council (BBSRC) through the strategic program of Soil to Nutrition (S2N; BBS/E/C/000I0320) at Rothamsted Research. The contributions from M.J.R. were funded by the Natural Environment Research Council (NERC) under the research program of NE/W005050/1 AgZero+: Towards sustainable, climate-neutral farming. AgZero+ is an initiative jointly supported by the BBSRC and the Natural Environment Research Council (NERC).

Institutional Review Board Statement

Not applicable.

Informed Consent Statement

Not applicable.

Data Availability Statement

Data are available from the corresponding author upon request.

Acknowledgments

The authors thank Adriana Solis and Leslie Berrocal for their support in the laboratory analysis.

Conflicts of Interest

The authors declare no conflict of interest.

References

  1. Dijkstra, J.; Reynolds, C.K.; Kebreab, A.; Bannink, A.; Ellis, J.L.; France, J.; van Vuuren, A.M. Challenges in Ruminant Nutrition: Towards Minimal Nitrogen Losses in Cattle; Oltjen, W.J., Kebreab, E., Lapierre, H., Eds.; Energy and Protein Metabolism and Nutrition in Sustainable Animal Production; Wageningen Academic Publishers: Wageningen, The Netherlands, 2013; pp. 47–58. [Google Scholar]
  2. Lantinga, E.A.; Keuning, J.A.; Groenwold, J.; Deenen, P.A.G. Distribution of excreted nitrogen by grazing cattle and its effects on sward quality, herbage production and utilization. In Animal Manure on Grassland and Fodder Crops: Fertilizer or Waste; Van der Meer, H.G., Unwin, R.J., van Dijk, T.A., Ennik, G.C., Eds.; Martinus Nijhoff: Dordrecht, The Netherlands, 1987; pp. 103–117. [Google Scholar]
  3. Hoogendoorn, C.; Betteridge, K.; Costall, D.; Ledgard, S. Nitrogen concentration in the urine of cattle, sheep and deer grazing acommon ryegrass/cocksfoot/white clover pasture. New Zealand J. Agric. Res. 2010, 53, 235–243. [Google Scholar] [CrossRef]
  4. Holmes, W. Grass: Its Production and Utilization, 2nd ed.; Blackwell Scientific Publications: Oxford, UK, 1989. [Google Scholar]
  5. Dennis, S.; Moir, J.L.; Cameron, K.; Di, H.; Hennessy, D.; Richards, K.G. Urine patch distribution under dairy grazing at three stocking rates in Ireland. Irish J. Agric. Food Res. 2011, 50, 149–160. [Google Scholar]
  6. Ramírez-Sandoval, M.A.; Pinochet, D.E.; Rivero, M.J. Wetting Pattern of Cow Urine Patch in an Andisol Assessed through Bromide Concentration Distribution: A Pilot Study. Soil Syst. 2022, 6, 80. [Google Scholar] [CrossRef]
  7. Haynes, R.J.; Williams, P.H. Nutrient cycling y soil fertility in the grazed pasture ecosystem. Adv. Agron. 1993, 49, 119–199. [Google Scholar]
  8. Whitehead, D.C. Nutrient Elements in Grassland: Soil-Plant-Animal Relationships; CABI: Surrey, UK, 2000; p. 384. [Google Scholar]
  9. Ramírez-Sandoval, M.; Pinochet, D.; Rivero, M.J. Soil Dynamics and Nitrogen Absorption by a Natural Grassland under Cow Urine and Dung Patches in an Andisol in Southern Chile. Agronomy 2022, 12, 719. [Google Scholar] [CrossRef]
  10. Di, H.; Cameron, K. Nitrate leaching in temperate agroecosystems: Sources, factors and mitigating strategies. Nutr. Cycling Agroecosyst. 2002, 46, 237–256. [Google Scholar] [CrossRef]
  11. Saarijärvi, K.; Virkajärvi, P. Nitrogen dynamics of cattle dung y urine patches on intensively managed boreal pasture. J. Agr. Sci. 2009, 147, 479–491. [Google Scholar] [CrossRef]
  12. Cárdenas, L.M.; Misselbrook, T.M.; Hodgson, C.; Donovan, N.; Gilhespy, S.; Smith, K.A.; Dhanoa, M.S.; Chadwick, D. Effect of the application of cattle urine with or without the nitrification inhibitor DCD, and dung on greenhouse gas emissions from a UK grassland soil. Agric. Ecosyst. Environ. 2016, 235, 229–241. [Google Scholar] [CrossRef] [Green Version]
  13. Jarvis, S.; Pain, B. Ammonia volatilization from agricultural land. Proc. Fertil. Soc. 1990, 298, 1–35. [Google Scholar]
  14. van Groenigen, J.W.; Kuikman, P.J.; de Groot, W.J.; Velthof, G.L. Nitrous oxide emission from urinetreated soil as influenced by urine composition and soil physical conditions. Soil Biol. Biochem. 2005, 37, 463–473. [Google Scholar] [CrossRef]
  15. Doak, B.W. Some chemical changes in the nitrogenous constituents of urine when voided on pasture. J. Agric. Sci. 1952, 42, 162–171. [Google Scholar] [CrossRef]
  16. Sherlock, R.; Goh, K. Dynamics of ammonia volatilisation from simulated urine patches and aqueous urea applied to pasture. II. Theoretical derivation of a simplified model. Fertil. Res. 1985, 6, 3–22. [Google Scholar] [CrossRef]
  17. Venterea, R.T.; Rolston, D.E. Nitric and nitrous oxide emissions following fertilizer application to agricultural soil: Biotic and abiotic mechanisms and kinetics. J. Geophys. Res. 2000, 105, 15117–15129. [Google Scholar] [CrossRef]
  18. De Boer, W.; Gunnewiek, P.K.; Veenhuis, M.; Bock, E.; Laanbroek, H.J. Nitrification at low pH by aggregated chemolithotrophic bacteria. Appl. Environ. Microbiol. 1991, 57, 3600–3604. [Google Scholar] [CrossRef] [Green Version]
  19. Stein, L.Y.; Klotz, M.G. The nitrogen cycle. Curr. Biol. 2016, 26, 94–98. [Google Scholar] [CrossRef] [Green Version]
  20. Malhi, S.; McGill, W. Nitrification in three Alberta soils: Effect of temperature, moisture and substrate concentration. Soil Biol. Biochem. 1982, 14, 393–399. [Google Scholar] [CrossRef]
  21. Clough, T.; Sherlock, R.; Mautner, M.; Milligan, D.; Wilson, P.; Freeman, C.; McEwan, M. Emission of nitrogen oxides and ammonia from varying rates of applied synthetic urine and correlations with soil chemistry. Aust. J. Soil Res. 2003, 41, 421–438. [Google Scholar] [CrossRef]
  22. Somers, C.; Girkin, N.; Rippey, B.; Lanigan, G.; Richards, K. The effects of urine nitrogen application rate on nitrogen transformations in grassland soils. J. Agric. Sci. 2019, 157, 1–8. [Google Scholar] [CrossRef]
  23. Baral, K.R.; Thomsen, A.G.; Olesen, J.E.; Petersen, S.O. Controls of nitrous oxide emission after simulated cattle urine deposition. Agric. Ecosyst. Environ. 2014, 188, 103–110. [Google Scholar] [CrossRef]
  24. FAO. World Reference Base for Soil Resources, WRB, 2nd ed.; World Soil Resources Reports 103; FAO: Rome, Italy, 2006. [Google Scholar]
  25. Shoji, S.; Nanzyo, M.; Dahlgren, R. Volcanic Ash Soils: Genesis, Properties and Utilization; Developments in Soil Science; Elsevier Science: Amsterdam, The Netherlands, 1994; p. 288. [Google Scholar]
  26. Matus, F.; Garrido, E.; Sepúlveda, N.; Cárcamo, I.; Panichini, M.; Zagal, E. Relationship between extractable Al and organic C in volcanic soils of Chile. Geoderma 2008, 148, 180–188. [Google Scholar] [CrossRef]
  27. Dörner, J.; Dec, D.; Peng, X.; Horn, R. Effect of land use change on the dynamic behaviour of structural properties of an Andisol in southern Chile under saturated and unsaturated hydraulic conditions. Geoderma 2010, 159, 189–197. [Google Scholar] [CrossRef]
  28. Soil Survey Staff. Natural Resources Conservation Services; USDA: Washington, DC, USA, 2010.
  29. Pezzolla, D.; Cardenas, L.M.; Mian, I.A.; Carswell, A.; Donovan, N.; Dhanoa, M.S.; Blackwell, M.S. Responses of carbon, nitrogen and phosphorus to two consecutive drying–rewetting cycles in soils. J. Plant Nutr. Soil Sci. 2019, 182, 217–228. [Google Scholar] [CrossRef] [Green Version]
  30. Sadzawka, A.; Carrasco, M.; Grez, R.; Mora, M.; Flores, H.; Neaman, A. Métodos de Análisis Recomendados Para los Suelos de Chile. Serie Actas INIA; Instituto de Investigaciones Agropecuarias: Santiago, Chile, 2006; Volume 34, p. 164. [Google Scholar]
  31. Watson, C.; Kilpatrick, D.; Cooper, J. The effect of increasing application rate of granular calcium ammonium nitrate on net nitrification in a laboratory study of grassland soils. Fertiliser Res. 1994, 40, 155–161. [Google Scholar] [CrossRef]
  32. Smith, A.P.; Bond-Lamberty, B.; Benscoter, B.W.; Tfaily, M.M.; Hinkle, C.R.; Liu, C.; Bailey, V.L. Free ammonia inhibition of nitrification in river sediments leading to nitrite accumulation. J. Environ. Qual. 1997, 26, 1049–1055. [Google Scholar] [CrossRef]
  33. Clough, T.J.; Kelliher, F.M.; Sherlock, R.R.; Ford, C.D. Lime and soil moisture effects on nitrous oxide and dinitrogen emissions from a pasture soil. Soil Sci. Soc. Am. J. 2004, 68, 1600–1609. [Google Scholar] [CrossRef] [Green Version]
  34. Khan, S.; Clough, T.; Goh, K.; Sherlock, R. Influence of soil pH on NOx and N2O emissions from bovine urine applied to soil columns. N. Z. J. Agric. Res. 2011, 54, 285–301. [Google Scholar] [CrossRef]
  35. Whitehead, D.C.; Bristow, A.W. Transformations of nitrogen following the application of 15N-labelled cattle urine to an established grass sward. J. Appl. Ecol. 1990, 27, 667–678. [Google Scholar] [CrossRef]
  36. Ball, R.; Keeney, D.; Thoebald, P.; Nes, P. Nitrogen balance in urine-affected areas of a New Zealand pasture. Agron. J. 1979, 71, 309–314. [Google Scholar] [CrossRef]
  37. Sherlock, R.; Goh, K. Dynamics of ammonia volatilization from simulated urine patches and aqueous urea applied to pasture. Fertil. Res. 1984, 5, 181–195. [Google Scholar] [CrossRef]
  38. Silva, R.G.; Cameron, K.C.; Di, H.; Hendry, T. A lysimeter study of the impact of cow urine, dairy shed effluent, and nitrogen fertiliser on nitrate leaching. Aust. J. Soil Res. 1999, 37, 357–369. [Google Scholar] [CrossRef]
  39. Bussink, D.; Oenema, O. Ammonia volatilization from dairy farming systems in temperate areas: A review. Nutr. Cycling Agroecosyst. 1998, 51, 19–33. [Google Scholar] [CrossRef]
  40. Selbie, D.R.; Buckthought, L.E.; Shepherd, M. The Challenge of the Urine Patch for Managing Nitrogen in Grazed Pasture Systems. Adv. Agron. 2015, 129, 229–292. [Google Scholar]
  41. Cárdenas, L.M.; Bol, R.; Lewicka-Szczebak, D.; Gregory, A.S.; Matthews, G.P.; Whalley, W.R.; Misselbrook, T.H.; Scholefield, D.; Well, R. Effect of soil saturation on denitrification in a grassland soil. Biogeosciences 2017, 14, 4691–4710. [Google Scholar] [CrossRef] [Green Version]
  42. Keeney, D.; MacGregor, A. Short-term cycling of 15N-urea in a ryegrass-white clover pasture. N. Z. J. Agric. Res. 1978, 21, 443–448. [Google Scholar] [CrossRef]
  43. Williams, P.H.; Haynes, R.J. Comparison of initial wetting pattern, nutrient concentrations in soil solution and fate of 15N-labelled urine in sheep and cattle urine patch areas of pasture soil. Plant Soil 1994, 162, 49–59. [Google Scholar] [CrossRef]
  44. Thompson, R.; Fillery, I. Fate of urea nitrogen in sheep urine applied to soil at different times of the year in the pasture-wheat rotation in south Western Australia. Aust. J. Agric. Res. 1998, 49, 495–510. [Google Scholar] [CrossRef]
  45. Alfaro, M.; Salazar, F.; Hube, S.; Ramírez, L.; Mora, L. Ammonia and nitrous oxide emissions as affected by nitrification and urease inhibitors. J. Soil Sci. Plant Nutr. 2018, 18, 479–486. [Google Scholar]
  46. Bolan, N.S.; Saggar, S.; Luo, J.; Bhandral, R.; Singh, J. Gaseous emissions of nitrogen from grazed pastures: Processes, measurements and modelling, environmental implications, and mitigation. Adv. Agron. 2004, 84, 37–120. [Google Scholar]
  47. Taylor, A.E.; Myrold, D.D.; Bottomley, P.J. Temperature affects the kinetics of nitrite oxidation and nitrification coupling in four agricultural soils. Soil Biol. Biochem. 2019, 136, 107523. [Google Scholar] [CrossRef]
  48. He, J.Z.; Shen, J.P.; Zhang, L.M.; Zhu, Y.G.; Zheng, Y.M.; Xu, M.G.; Di, H. Quantitative analyses of the abundance andcomposition of ammonia-oxidizing bacteria and ammonia-oxidizing archaea of a Chinese upland red soil under long-term fertilization practices. Environm. Microbiol. 2007, 9, 2364–2374. [Google Scholar] [CrossRef]
  49. Nicol, G.W.; Leininger, S.; Schleper, C.; Prosser, J.I. The influence of soil pH on the diversity, abundance and transcriptional activity of ammonia oxidizing archaea and bacteria. Environ. Microbiol. 2008, 10, 2966–2978. [Google Scholar] [CrossRef]
  50. Lehtovirta, L.E.; Prosser, J.I.; Nicol, G.W. Soil pH regulates the abundance and diversity of Group1.1c Crenarchaeota. FEMS Microbiol. Ecol. 2009, 70, 367–376. [Google Scholar] [CrossRef] [Green Version]
  51. Könneke, M.; Bernhard, A.E.; José, R.; Walker, C.B.; Waterbury, J.B.; Stahl, D.A. Isolation of an autotrophic ammonia-oxidizing marine archaeon. Nature 2005, 437, 543–546. [Google Scholar] [CrossRef]
  52. Offre, P.; Prosser, J.I.; Nicol, G.W. Growth of ammonia-oxidizing archaea in soil microcosms is inhibited by acetylene. FEMS Microbiol. Ecol. 2009, 7, 99–108. [Google Scholar] [CrossRef] [Green Version]
  53. De Boer, W.; Kowalchuk, G.A. Nitrification in acid soils: Micro-organisms and mechanisms. Soil Biol. Biochem. 2001, 33, 853–866. [Google Scholar] [CrossRef]
  54. Di, H.J.; Cameron, K.C.; Shen, J.-P.; Winefield, C.S.; O’Callaghan, M.; Bowatte, S.; He, J.-Z. Ammonia-oxidizing bacteria and archaea grow under contrasting soil nitrogen conditions. FEMS Microbiol. Ecol. 2010, 72, 386–394. [Google Scholar] [CrossRef]
  55. Leininger, S.; Urich, T.; Schloter, M.; Schwark, L.; Qi, J.; Nicol, G.W.; Prosser, J.I.; Schuster, S.; Schleper, C. Archaea predominate among ammonia-oxidizing prokaryotes in soils. Nature. 2006, 442, 806–809. [Google Scholar] [CrossRef]
  56. Wessén, E.; Söderström, M.; Stenberg, M.; Bru, D.; Hellman, M.; Welsh, A.; Thomsen, F.; Klemedtson, L.; Philippot, L.; Hallin, S. Spatial distribution of ammonia-oxidizing bacteria and archaea across a 44-hectare farm related to ecosystem functioning. ISME J. 2011, 5, 1213–1225. [Google Scholar] [CrossRef] [Green Version]
  57. Yao, H.; Gao, Y.; Nicol, G.W.; Campbell, C.D.; Prosser, J.I.; Zhang, L.; Han, W.; Singh, B.K. Links between ammonia oxidizer community structure, abundance, and nitrification potential in acidic soils. Appl. Environ. Microbiol. 2011, 77, 4618–4625. [Google Scholar] [CrossRef] [Green Version]
  58. Gubry-Rangin, C.; Nicol, G.W.; Prosser, J.I. Archaea rather than bacteria control nitrification in two agricultural acidic soils. FEMS Microbiol. Ecol. 2010, 74, 566–574. [Google Scholar] [CrossRef] [Green Version]
  59. Zhang, L.-M.; Hu, H.-W.; Shen, J.-P.; He, J.-Z. Ammonia-oxidizing archaea have more important role than ammonia-oxidizing bacteria in ammonia oxidation of strongly acidic soils. ISME J. 2012, 6, 1032–1045. [Google Scholar] [CrossRef] [Green Version]
  60. Guo, J.; Peng, Y.; Wang, S.; Ma, B.; Ge, S.; Wang, Z.; Huang, H.; Zhang, J.; Zhang, L. Pathways and organisms involved in ammonia oxidation and nitrous oxide emission. Crit. Rev. Environ. Sci. Technol. 2013, 43, 2213–2296. [Google Scholar] [CrossRef]
  61. Borken, W.; Matzner, E. Reappraisal of drying and wetting effects on C and N mineralization and fluxes in soils. Glob. Change Biol. 2009, 15, 808–824. [Google Scholar] [CrossRef]
  62. Olfs, H.W.; Neu, A.; Werner, W. Soil N transformations after applicationof 15N-labeled biomass in incubation experiments with repeated soil drying and rewetting. J. Plant Nutr. Soil Sci. 2004, 167, 147–152. [Google Scholar] [CrossRef]
  63. Canarini, A.; Dijkstra, F.A. Dry-rewetting cycles regulate wheat carbon rhizodeposition, stabilization and nitrogen cycling. Soil Biol. Biochem. 2015, 81, 195–203. [Google Scholar] [CrossRef]
  64. Fierer, N.; Schimel, J.P. Effects of drying-rewetting frequency on soil carbon and nitrogen transformations. Soil Biol. Biochem. 2002, 34, 777–787. [Google Scholar] [CrossRef]
  65. Hentschel, K.; Borken, W.; Matzner, E. Leaching losses of inorganic N and DOC following repeated drying and wetting of a spruce forest soil. Plant Soil. 2007, 300, 21–34. [Google Scholar] [CrossRef]
  66. Harrison-Kirk, T.; Beare, M.; Meenken, E.; Condron, L. Soil organic matter and texture affect responses to dry/wet cycles: Changes in soil organic matter fractions and relationships with C and N mineralisation. Soil Biol. Biochem. 2014, 74, 50–60. [Google Scholar] [CrossRef]
  67. Miller, A.E.; Schimel, J.P.; Meixner, T.; Sickman, J.O.; Melack, J.M. Episodic rewetting enhances carbon and nitrogen release from chaparral soils. Soil Biol. Biochem. 2005, 37, 2195–2204. [Google Scholar] [CrossRef]
  68. Fuchslueger, L.; Kastl, E.-M.; Bauer, F.; Kienzl, S.; Hasibeder, R.; Ladreiter-Knauss, T.; Schmitt, M.; Bahn, M.; Schloter, M.; Richter, A. Effects of drought on nitrogen turnover and abundances of ammonia-oxidizers in mountain grassland. Biogeosciences 2014, 11, 6003–6015. [Google Scholar] [CrossRef] [Green Version]
  69. Rudaz, A.O.; Davidson, E.A.; Firestone, M.K. Sources of nitrous-oxide production following wetting of dry soil. FEMS Microbiol. Ecol. 1991, 8, 117–124. [Google Scholar] [CrossRef] [Green Version]
  70. Rey, A.; Petsikos, C.; Jarvis, P.; Grace, J. Effect of temperature and moisture on rates of carbon mineralization ina Mediterranean oak forest soil under controlled and field conditions. Eur. J. Soil Sci. 2005, 56, 589–599. [Google Scholar] [CrossRef]
  71. Franzluebbers, A.; Haney, R.; Honeycutt, C.; Schomberg, H.-H.; Hons, F. Flush of carbon dioxide following rewetting of dried soil relates to active organic pools. Soil Sci. Soc. Am. J. 2000, 64, 613–623. [Google Scholar] [CrossRef]
  72. Fierer, N.; Schimel, J.P. A proposed mechanism for the pulse in carbon dioxide production commonly observed following the rapid rewetting of a dry soil. Soil Sci. Soc. Am. J. 2003, 67, 798–805. [Google Scholar] [CrossRef]
  73. Pesaro, M.; Nicollier, G.; Zeyer, J.; Widmer, F. Impact of drying-rewetting stress on microbial communities and activities and on degradation of two crop protection products. Appl. Environ. Microbiol. 2004, 70, 2577–2587. [Google Scholar] [CrossRef] [PubMed] [Green Version]
  74. Beare, M.H.; Hendrix, P.; Cabrera, M.; Coleman, D. Aggregate protected and unprotected organic-matter pools in conventional-tillage and no-tillage soils. Soil Sci. Soc. Am. J. 1994, 58, 787–795. [Google Scholar] [CrossRef]
  75. Hassink, J.; Whitmore, A.P. A model of the physical protection of organic matter in soils. Soil Sci. Soc. Am. J. 1997, 61, 131–139. [Google Scholar] [CrossRef]
  76. Malamoud, K.; McBratney, A.B.; Minasny, B.; Field, D.J. Modeling how carbon affects soil structure. Geoderma 2009, 149, 19–26. [Google Scholar] [CrossRef]
  77. Six, J.; Conant, R.T.; Paul, E.A.; Paustian, K. Stabilization mechanisms of soil organic matter: Implications for C-saturation of soils. Plant Soil. 2002, 241, 155–176. [Google Scholar]
  78. Six, J.; Feller, C.; Denef, K.; Ogle, S.; de Moraes Sa, J.C.; Albrecht, A. Soil organic matter, biota and aggregation in temperate and tropical soils—Effects of no-tillage. Agronomie 2002, 22, 755–775. [Google Scholar] [CrossRef] [Green Version]
  79. Helfrich, M.; Ludwig, B.; Potthoff, M.; Flessa, H. Effect of litter quality and soil fungi on macroaggregate dynamics and associated partitioning of litter carbon and nitrogen. Soil Biol. Biochem. 2008, 40, 1823–1835. [Google Scholar] [CrossRef]
  80. Nikolaidis, N.P.; Bidoglio, G. Soil organic matter dynamics and structure. Sustain. Agric. Rev. 2013, 12, 175–199. [Google Scholar]
  81. Lundquist, E.; Jackson, L.; Scow, K. Wet dry cycles affect DOC in two California agricultural soils. Soil Biol. Biochem. 1999, 31, 1031–1038. [Google Scholar] [CrossRef]
  82. Smith, A.P.; Bond-Lamberty, B.; Benscoter, B.W.; Tfaily, M.M.; Hinkle, C.R.; Liu, C.; Bailey, V.L. Shifts in pore connectivity from precipitation versus groundwater rewetting increases soil carbon loss after drought. Nat. Commun. 2017, 8, 1–11. [Google Scholar] [CrossRef] [Green Version]
  83. Cosentino, D.; Chenu, C.; Le Bissonnais, Y. Aggregate stability and microbial community dynamics under drying–wetting cycles in a silt loam soil. Soil Biol. Biochem. 2006, 38, 2053–2062. [Google Scholar] [CrossRef]
  84. Park, E.-J.; Sul, W.J.; Smucker, A.J. Glucose additions to aggregates subjected to drying/wetting cycles promote carbon sequestration and aggregate stability. Soil Biol. Biochem. 2007, 39, 2758–2768. [Google Scholar] [CrossRef]
  85. Sun, D.; Li, K.; Bi, Q.; Zhu, J.; Zhang, Q.; Jin, C.; Lu, L.; Lin, X. Effects of organic amendment on soil aggregation and microbial community composition during drying-rewetting alternation. Sci. Total Environ. 2017, 574, 735–743. [Google Scholar] [CrossRef]
  86. Kalbitz, K.; Meyer, A.; Yang, R.; Gerstberger, P. Response of dissolved organic matter in the forest floor to long-term manipulation of litter and throughfall inputs. Biogeochemistry 2007, 86, 301–318. [Google Scholar] [CrossRef]
  87. Müller, R. Osmoadaptation in bacteria and archaea: Common principles and differences. Environ. Microbiol. 2001, 12, 743–754. [Google Scholar]
  88. Placella, S.A.; Firestone, M.K. Transcriptional response of nitrifying communities to wetting of dry soil. Appl. Environ. Microbiol. 2013, 79, 3294–3302. [Google Scholar] [CrossRef] [Green Version]
  89. Thion, C.; Prosser, J.I. Differential response of nonadapted ammonia-oxidising archaea and bacteria to drying-rewetting stress. FEMS Microbiol. Ecol. 2014, 90, 380–389. [Google Scholar] [CrossRef] [PubMed]
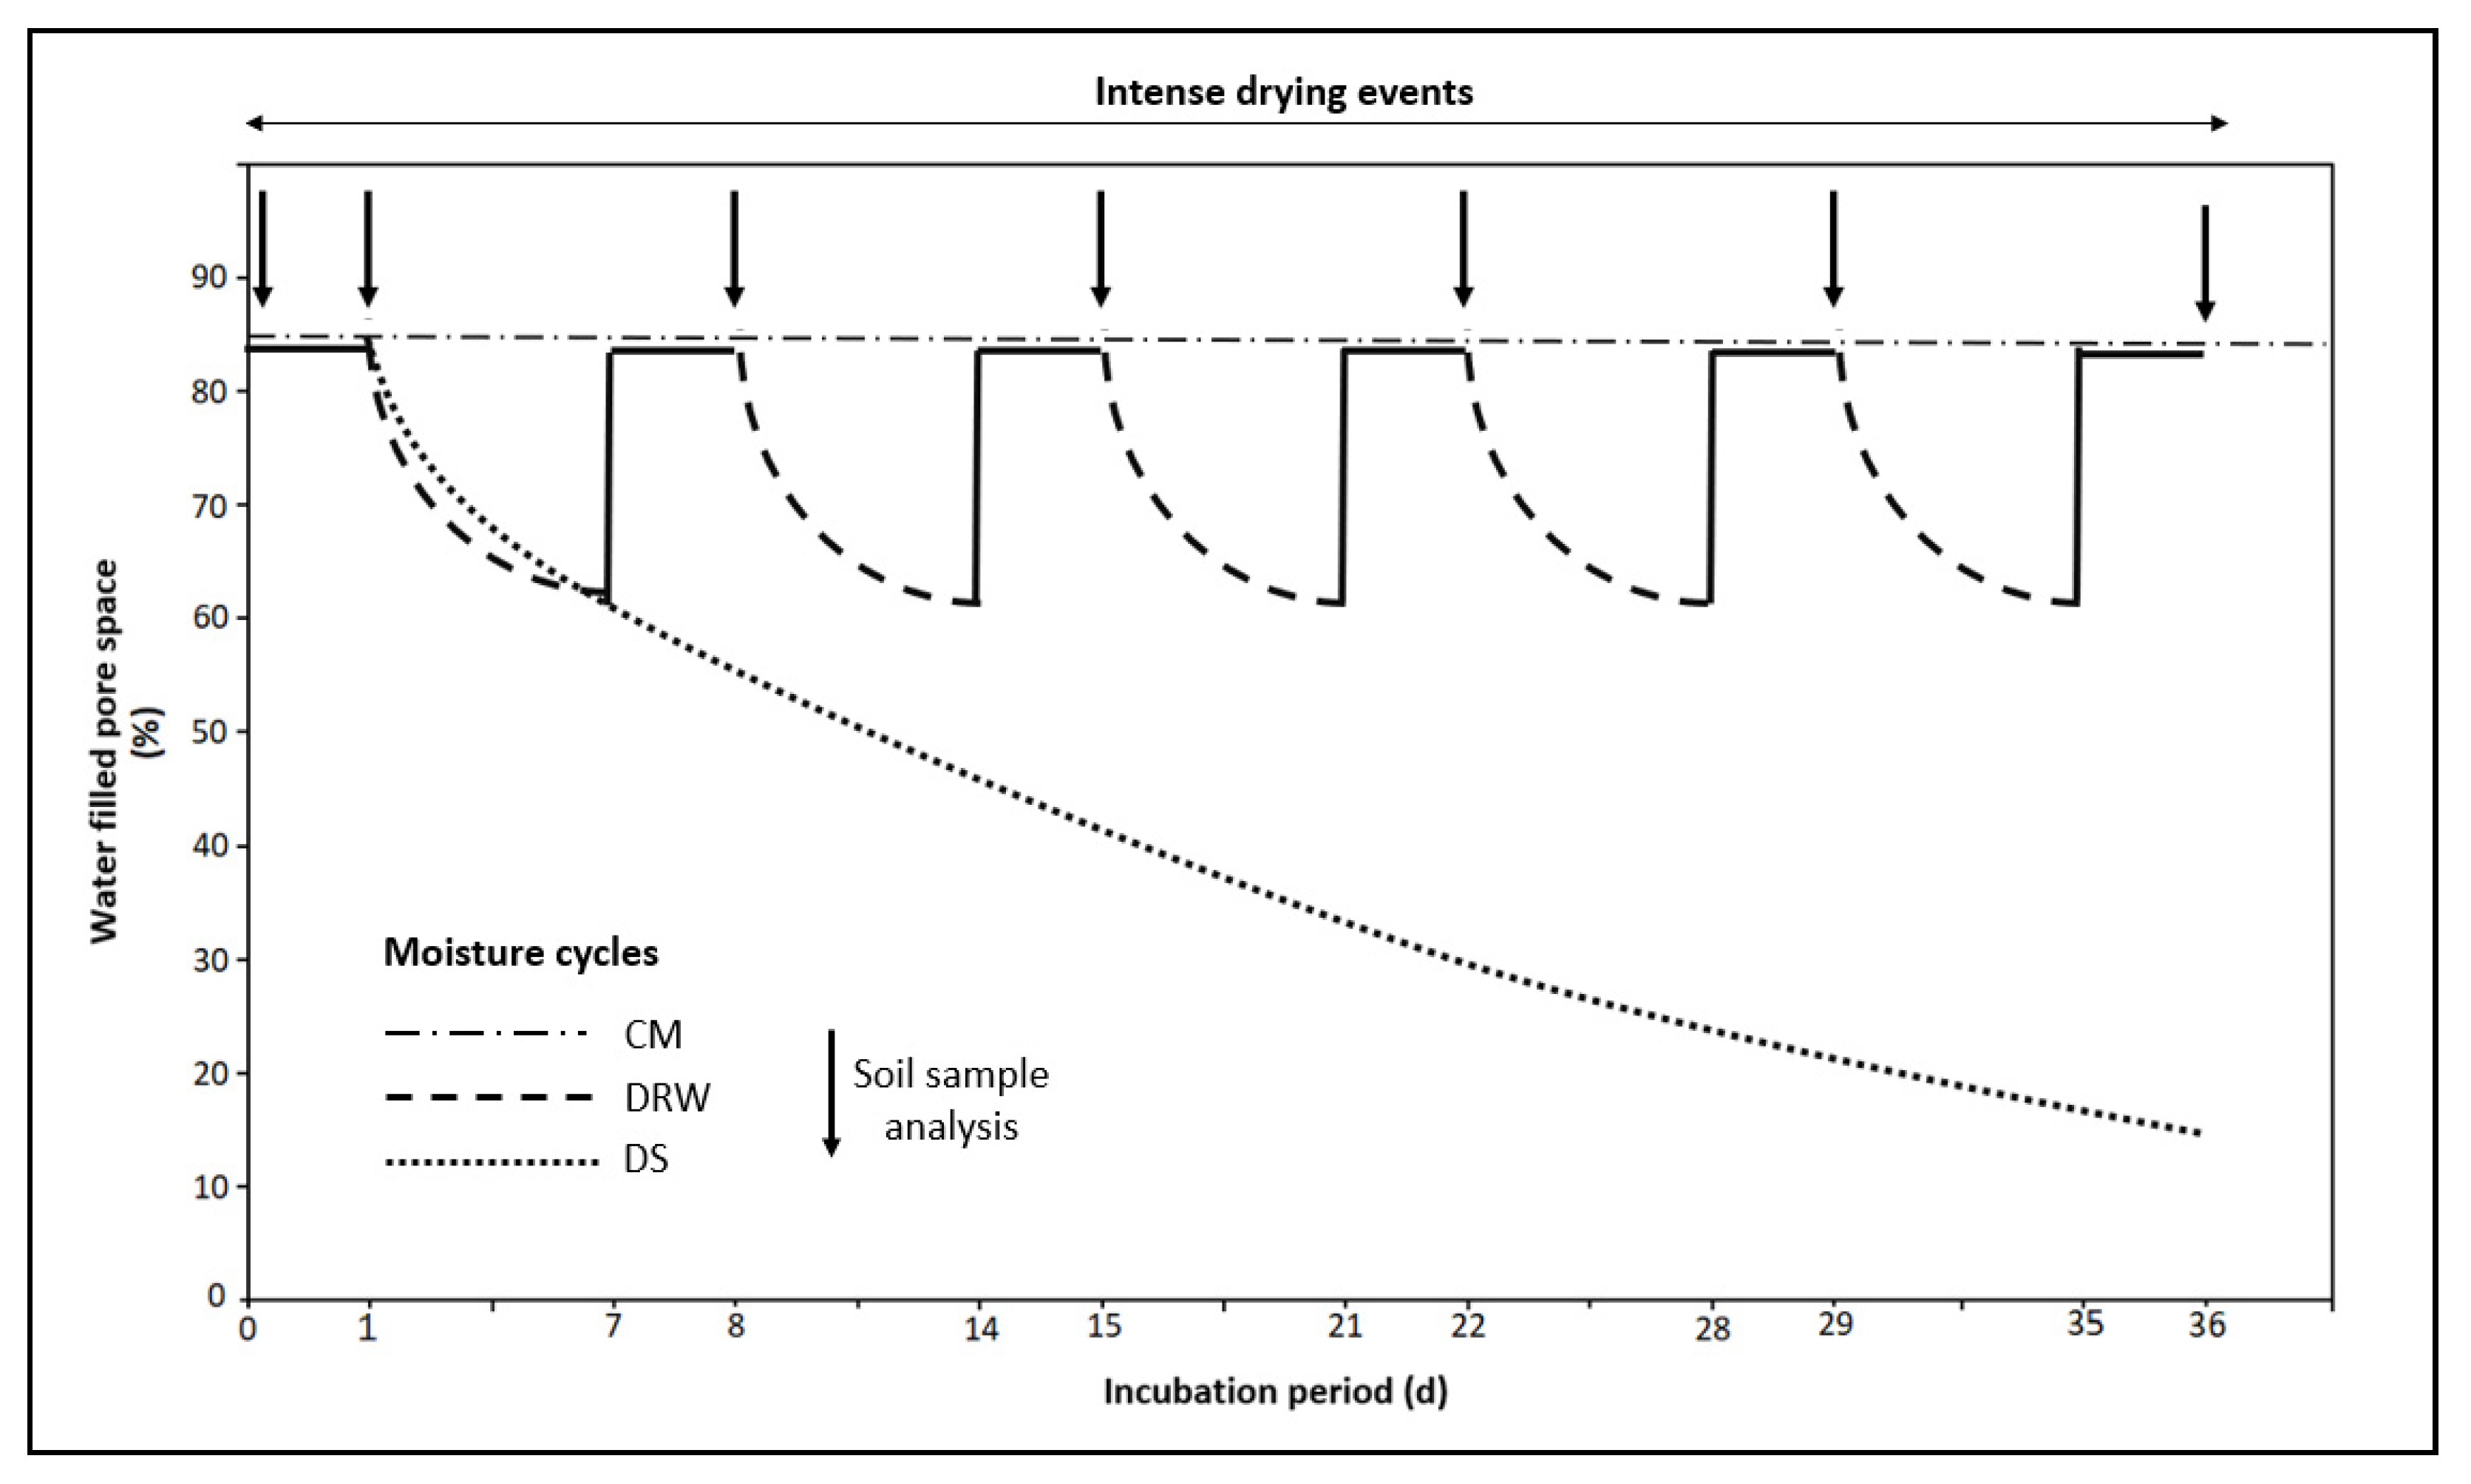
Figure 1. Soil moisture cycle regimes and sampling times: constant moisture at 85% WFPS (CM), drying–rewetting (DRW), and drying soil (DS) treatments. Adapted from Pezzolla et al. [29].
Agronomy 13 00010 g001
Figure 2. Variation during the incubation period for the control treatment (deionized water applied). (a,b) Ammonium (NH4+), (c,d) total oxidized nitrogen (TON) concentrations, and (e,f) CaCl2 pH for top and bottom soil samples at constant moisture at 85% WFPS (CM), drying–rewetting (DRW), and drying soil (DS) treatments. Day 0 was sampled 1 h after urine application. Error bars represent the standard error of the mean (n = 3).
Agronomy 13 00010 g002
Figure 3. Variation during the incubation period of urine addition at low rate of nitrogen (low N) to the soil. (a,b) Ammonium (NH4+), (c,d) total oxidized nitrogen (TON) concentrations, and (e,f) CaCl2 pH for top and bottom soil samples at constant moisture at 85% WFPS (CM), drying–rewetting (DRW), and drying soil (DS) treatments. Day 0 was sampled 1 h after urine application. Error bars represent the standard error of the mean (n = 3).
Agronomy 13 00010 g003
Figure 4. Variation during the incubation period of urine addition at medium rate of nitrogen (medium N) to the soil. (a,b) Ammonium (NH4+), (c,d) total oxidized nitrogen (TON) concentrations, and (e,f) CaCl2 pH for top and bottom soil samples at constant moisture at 85% WFPS (CM), drying–rewetting (DRW), and drying soil (DS) treatments. Day 0 was sampled 1 h after urine application. Error bars represent the standard error of the mean (n = 3).
Agronomy 13 00010 g004
Figure 5. Variation during the incubation period of urine addition at high rate of nitrogen (high N) to the soil. (a,b) Ammonium (NH4+), (c,d) total oxidized nitrogen (TON) concentrations, and (e,f) CaCl2 pH for top and bottom soil samples at constant moisture at 85% WFPS (CM), drying–rewetting (DRW), and drying soil (DS) treatments. Day 0 was sampled 1 h after urine application. Error bars represent the standard error of the mean (n = 3).
Agronomy 13 00010 g005
Figure 6. Mean of total mineral nitrogen per core for control (a), low nitrogen (b), medium nitrogen (c), and high nitrogen (d) with constant moisture at 85% WFPS (CM), drying–rewetting (DRW), and drying soil (DS) treatments. Error bars represent the standard error of the mean (n = 3). Different letters indicate significant differences between treatments for each sampling day (p < 0.05).
Agronomy 13 00010 g006
Figure 7. Total mineral nitrogen variation in the incubation period as a percentage of the nitrogen applied: low nitrogen (a), medium nitrogen (b), and high nitrogen rate (c) with constant moisture at 85% WFPS (CM), drying–rewetting cycles (DRW), and drying soil (DS) treatments during incubation time. Error bars represent the standard error of the mean (n = 3). Different letters indicate significant differences between treatments for each sampling day (p < 0.05).
Agronomy 13 00010 g007
Table 1. Physical and chemical characteristics of the soil.
PropertyUnitValue
Soil type-Silandic Andosol; Eutric, Siltic [24]
Texture-Silty clay loam—silt loam [24]
NH4+mg kg−1 dry soil14.14 ± 1.43
TONmg kg−1 dry soil11.21 ± 0.23
pH 5.55 ± 0.50
Pmg kg−1 dry soil26.11 ± 7.14
Kcmol kg−1 dry soil0.33 ± 0.16
Mgcmol kg−1 dry soil0.56 ± 0.24
Cacmol kg−1 dry soil4.27 ± 2.24
Nacmol kg−1 dry soil0.16 ± 0.04
Al+3cmol kg−1 dry soil0.54 ± 0.35
Al+3 sat.%12.86 ± 13.57
Organic matterg g−1 dry soil0.168 ± 0.015
Particle densityg cm−32.24
Bulk densityg cm−30.65
Water content for packingg g−1 dry soil0.42
Table 2. Results of the two-way ANOVAs for the variables analyzed in the top and bottom halves of the soil cores; n.s.: non-significant.
Incubation Day
1815222936
VariableEffectTopBottomTopBottomTopBottomTopBottomTopBottomTopBottom
NH4+
N rate<0.0001n.s.<0.0001n.s.<0.0001n.s.<0.0001n.s.<0.0001n.s.<0.0001n.s.
Moisture cyclen.s.n.s.0.0147n.s.n.s.n.s.<0.0001n.s.<0.0001n.s.<0.0001n.s.
N rate × moisture cyclen.s.n.s.0.0229n.s.0.0031n.s.0.0001n.s.0.00240.0302<0.0001n.s.
Total oxidized nitrogen (TON)
N raten.s.n.s.n.s.n.s.0.00030.0001<0.0001<0.00010.0048<0.0001<0.0001<0.0001
Moisture cyclen.s.n.s.<0.0001n.s.n.s.n.s.n.s.<0.0001<0.0001<0.0001<0.0001<0.0001
N rate × moisture cyclen.s.n.s.n.s.n.s.n.s.n.s.n.s.n.s.n.s.0.0021n.s.0.0008
Total mineral NN rate<0.0001<0.0001<0.0001<0.0001<0.0001<0.0001
moisture cyclen.s.0.041n.s.0.02280.01070.0209
N rate × moisture cyclen.s.0.01840.00860.0010.00020.0106
% of N appliedN raten.s.0.0007<0.0001<0.0001<0.0001<0.0001
Moisture cyclen.s.n.s.n.s.0.00020.0002n.s.
N rate × moisture cyclen.s.n.s.0.0286<0.0001<0.00010.0071
NH3N rate<0.0001<0.0001<0.0001<0.0001<0.0001<0.0001
Moisture cyclen.s.n.s.<0.0001<0.0001<0.0001<0.0001
N rate × moisture cycle<0.0001<0.0001<0.0001<0.0001<0.0001<0.0001
pH CaCl2N rate<0.00010.006<0.0001n.s.<0.00010.0007<0.0001<0.0001<0.00010.00040.0004<0.0001
Moisture cycle0.0127<0.00010.01010.02160.0007< 0.00010.0057<0.0001<0.0001<0.0001<0.0001<0.0001
N rate × moisture cycle<0.0001n.s.0.001n.s.<0.00010.0019<0.00010.0011<0.0001<0.0001<0.0001<0.0001
Disclaimer/Publisher’s Note: The statements, opinions and data contained in all publications are solely those of the individual author(s) and contributor(s) and not of MDPI and/or the editor(s). MDPI and/or the editor(s) disclaim responsibility for any injury to people or property resulting from any ideas, methods, instructions or products referred to in the content.