Article

Relationship between the Dynamic Characteristics of Tomato Plant Height and Leaf Area Index with Yield, under Aerated Drip Irrigation and Nitrogen Application in Greenhouses

School of Water Conservancy, North China University of Water Resources and Electric Power, Zhengzhou 450046, China
*
Author to whom correspondence should be addressed.
Agronomy 2023, 13(1), 116; https://doi.org/10.3390/agronomy13010116
Submission received: 30 November 2022 / Revised: 17 December 2022 / Accepted: 27 December 2022 / Published: 29 December 2022

Abstract

:
The current study was undertaken to investigate the dynamic characteristics of the tomato crop, such as its plant height and leaf area index (LAI), based on the effective cumulative temperature. This was assessed under aerated drip irrigation (ADI) conditions and the application of a specific nitrogen (N) dose, and their relationship with the yield of the crop was formulated. The study was conducted in a greenhouse located in Zhengzhou, Henan province, China. The assessment conditions were the two irrigation methods, ADI and conventional drip irrigation (CK), and the three N application rates, i.e., 0, 140, and 210 kg ha−1. The logistic and Richards models were used to fit dynamic equations for plant height and LAI under the different treatments to quantify the characteristic parameters and understand their relationship with yield. The results revealed that the growth of the tomato plant fitted well with the logistic and Richards model at R2 > 0.98 (p < 0.01), regardless of the treatments. ADI and N application were found to significantly increase the maximum growth rate and average growth rate over the rapid growth period based on the tomato plant height and LAI. They were also noted to reduce the effective cumulative temperature at which plant height entered the rapid growth period (p < 0.05), thereby increasing the time spent in the nutritional growth phase. This is an essential precursor for the better development of subsequent reproductive organs. Tomato yields also confirm it: the highest yield of 85.87 t ha−1 was obtained with 210 kg N ha−1 for the ADI treatment, with an increase of 13.8%, 12.2%, and 39.6% compared to the CK–210 kg N ha−1, ADI–140 kg N ha−1, and ADI–0 kg N ha−1 treatments, respectively (p < 0.05). Grey correlation analysis showed that the characteristic parameters closely related to yield were all from the ADI and N application treatments. Furthermore, it was observed that the effective cumulative temperature and the maximum growth rate of the LAI at which the LAI entered the slow growth phase were the key growth characteristic parameters affecting tomato yield. This study provides a scientific basis for regulating the growth dynamics and yield of vegetables in greenhouse facilities under ADI and N application.

1. Introduction

In recent years, facility agriculture has been a major pillar of the agriculture sector, and its rapid development has provided new vitality for agricultural production [1]. However, long-term cultivation, high-intensive management, and the water–heat–gas imbalance have led to significant changes in the soil microenvironment of the cultivated area. Groundwater pollution, fertility imbalance, and soil quality degradation have seriously affected soil productivity and are the bottlenecks that limit the sustainable development of facility agriculture [2]. Tomatoes are a widely grown cash crop in all regions of the world, and are usually produced in greenhouses. However, conventional irrigation methods often cause soil saturation in the root zone of the crop, which greatly reduces the permeability and oxygen content of the soil [3]. This results in soil hypoxia, which causes stunted root growth and development, delayed uptake of nutrients from the soil, and increased leaching of fertilizers [4]. Intensive tillage practices and short crop rotations have degraded the soil quality, thereby decreasing crop productivity in many parts of the world [5,6]. As an extension of traditional irrigation, aerated drip irrigation (ADI) produces microbubbles that have a large surface area, longer retention time in the liquid, and the ability to deliver oxygen continuously to water [7,8]. Nitrogen (N) is a vital nutrient that influences plant growth, as well as the quality and quantity of the produce [9]. By delivering oxygenated water and nitrogen fertilizer to the root zone of the crop, soil hypoxia can be alleviated, resulting in improved soil fertility [10,11] and providing a better microenvironment for the growth and development of the crop. Therefore, the effective combination of ADI and N fertilizer application is critical to ensure good crop growth for a high and stable yield.
The plant stalk is a channel for transporting water, nutrients, and organic matter. The apical dominance effect causes the stalk to grow upward while also promoting the uniform distribution of the leaves, thereby facilitating the absorption and utilization of light energy. Plant height is one of the major agronomic traits that are used to characterize the stalks of the crops. An excessive increase or decrease in plant height is not a conducive characteristic for the accumulation of photosynthetic products and significantly affects the yield [12]. The leaf area index (LAI) is a vital indicator that is needed to characterize the variation in leaf area in crop populations and for crop growth simulation. Its magnitude is closely related to the yield level [13]. Effective cumulative temperature (ECT) is a vital meteorological factor that affects crop growth and development. It is usually used to quantify the combined effect of air temperature and the representative temperature on crop growth, thereby eliminating the ineffective cumulative temperature, which does not affect crop growth and development. The effective cumulative temperature more objectively and accurately describes the thermal requirements of crop growth, which is more scientifically meaningful than crop growth simulation with fertility days as a step unit [14,15,16,17]. The current quantitative description of crop growth dynamics is mainly performed using non-linear functions. The sigmoid curve, a typical non-linear model class, is often used to quantitatively model the plant height, leaf area index, dry matter mass, and nitrogen fertilizer application [7,18,19,20]. The logistic [21] and Richards models [22] are sigmoid non-linear models commonly used in growth analysis and have been used for the growth modeling of many crops, such as tomato [23,24], pepper [25], pumpkin [26], winter wheat, and summer maize [15]. Fang et al. reported that logistic models are closer to predicting tomato growth and adjusting field work schedules to improve the efficiency of the greenhouse production of tomatoes compared to Gompertz models [17]. However, no study has been reported on the relationship between the dynamic characteristics of plant height and LAI, which are important growth indicators affecting tomato yield, and the effective cumulative temperature under the synergistic effect of ADI and N application. In the current investigation, we simulated the relationship between plant height, LAI, and yield under ADI and N application conditions, using effective cumulative temperature as the independent variable.
The objectives of the current study were to: (a) apply the logistic and Richards models in tomato, for modeling the dynamics of plant height and LAI under ADI and N application, (b) work out the regression equations of the characteristic parameters of plant height and LAI with the yield, to clarify the key characteristic parameters affecting tomato yield, and (c) utilize the effective cumulative temperature to predict the growth dynamics of the plant height and LAI in tomato, to provide a scientific basis for quantitative analysis of the crop growth dynamics.

2. Materials and Methods

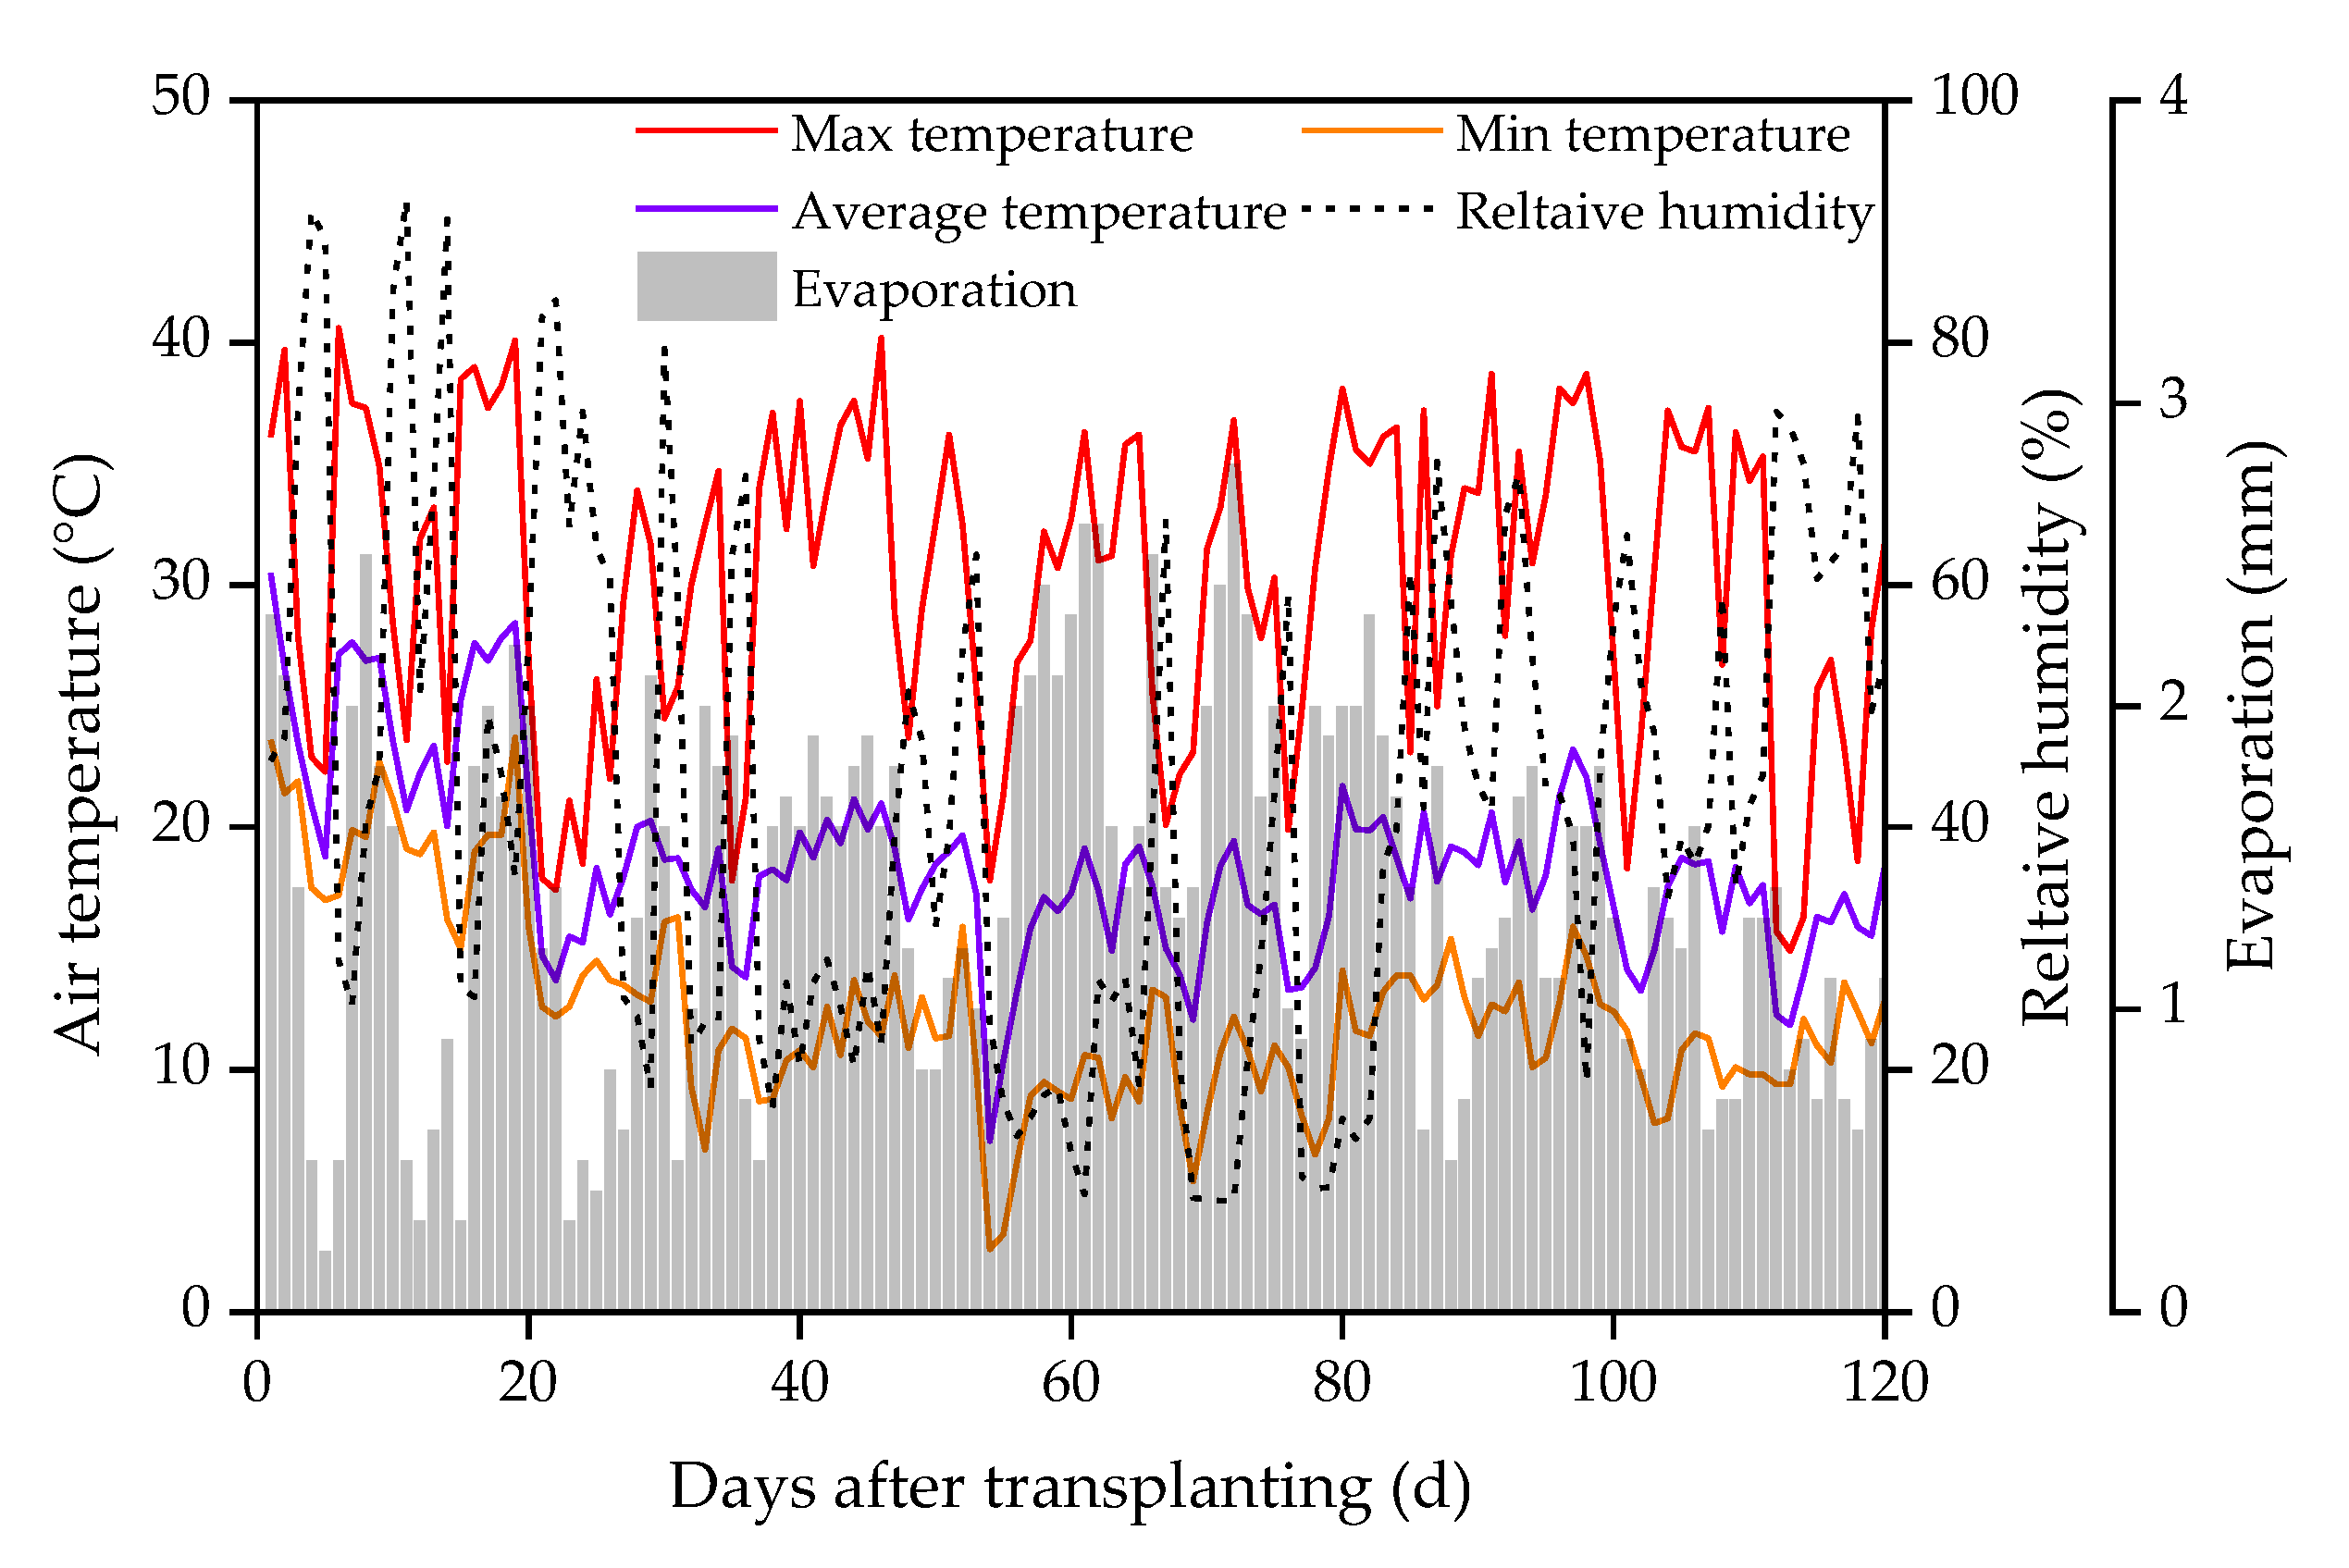
2.1. Experimental Site

Field experiments were conducted on tomato in a solar greenhouse from 15 September 2021 to 12 January 2022 at the Agricultural High-Efficiency Water Use Test Site of the North China University of Water Resources and Electric Power at Zhengzhou, located in Henan Province (China, 34°47′ N, 113°46′ E, altitude 110.4 m). The study area belongs to a temperate continental climate with a long-term annual mean air temperature of 17.1 °C. The annual mean precipitation is 630 mm, 2400 annual sunshine hours, and 220 d frost-free period. The solar greenhouse is a ridge-type structure that spans 9.6 m and has a bay of 4 m, for a total area of 537.6 m2. As is common for the area, the greenhouse is configured east–west to trap maximize solar radiation. It is equipped with a meteorological observation station inside the greenhouse, which eliminates any interference from natural rainfall. The temperature and humidity during the tomato growing period inside the greenhouse are presented in Figure 1.
The soil type is clay soil. At the 0–20 cm soil depths, the organic matter content was 20.14 g kg−1, with a total N of 1.04 g kg−1, total P of 0.93 g kg−1, and a total K of 28.69 g kg−1. The average dry bulk density of soil in the 0–40 cm soil layer was 1.46 g cm−3, pH value was 7.79, and the field capacity was 28.00%. The soil particle composition was as follows: gravel mass fraction, 32.99%; powder particle mass fraction, 34.03%; and clay particle mass fraction, 32.98%.

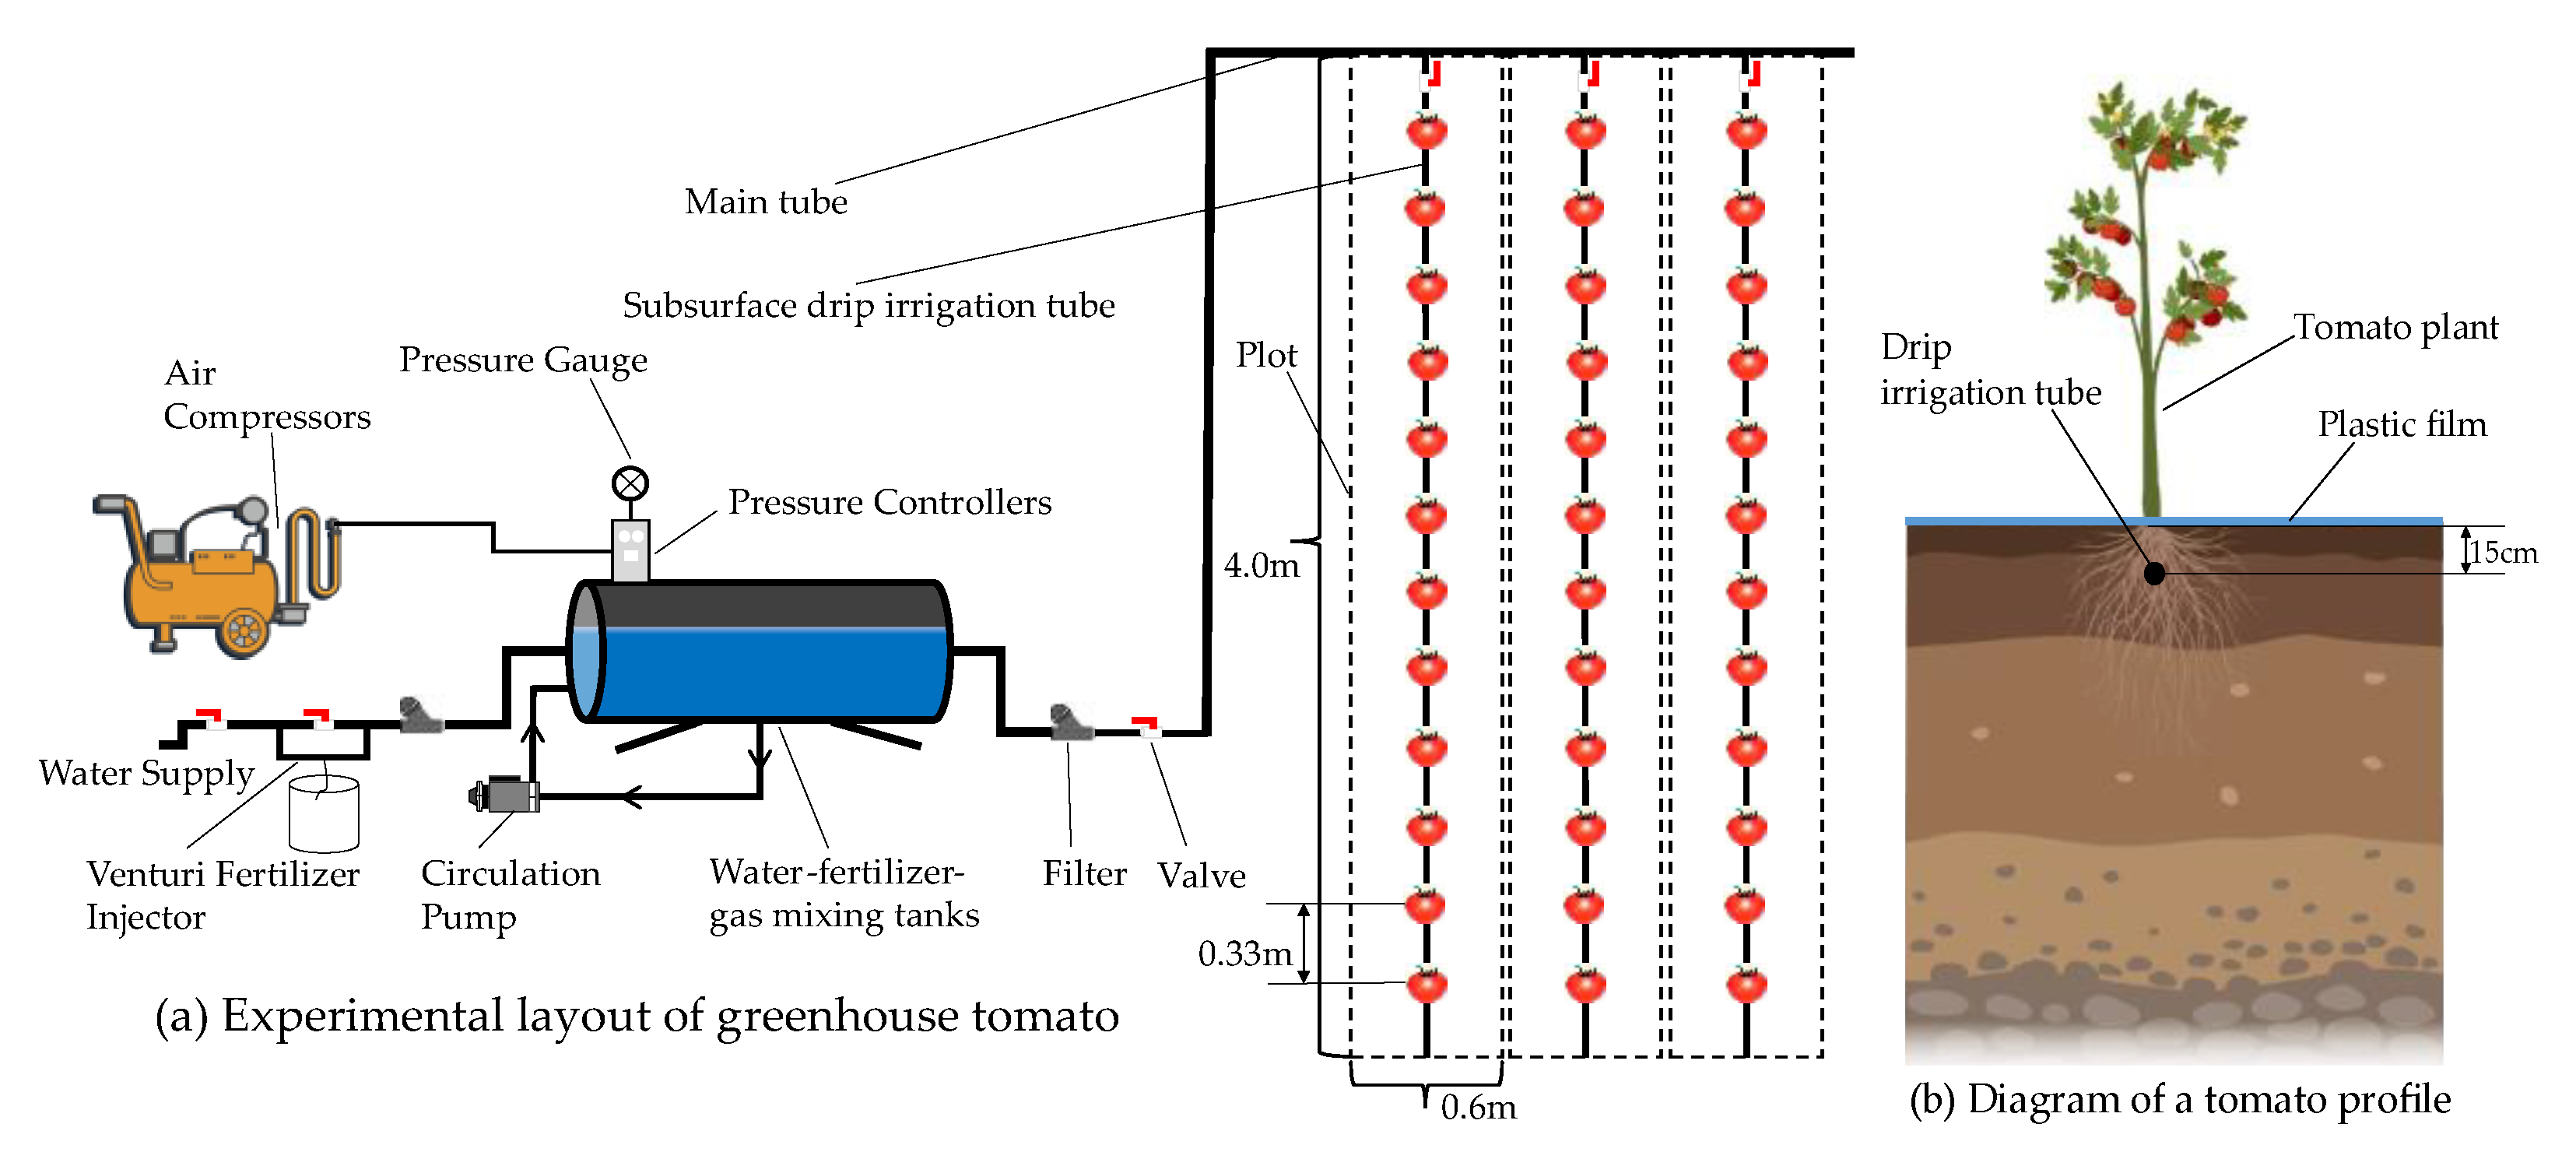
2.2. Experimental Design

The experiment was laid in a randomized split-plot design; aerated drip irrigation (ADI) and conventional drip irrigation (CK) were randomly assigned to the main plots. Three rates of N application (0, 140, and 210 kg ha−1) were randomly assigned to the subplots within each main plot, including conventional N fertilization (N2, 210 kg ha−1), 2/3 of conventional N fertilizer (N1, 140 kg ha−1), and non-N fertilization (N0, 0 kg ha−1). All the experiments had six treatments and each treatment had three replicate plots. Sources of N, P, and K fertilizers applied in the present study were urea (N ≥ 46% by weight), calcium superphosphate (P2O5 ≥ 12%), and potassium sulfate (K2O ≥ 51%), respectively. Calcium superphosphate and potassium sulfate were broadcast at 150 kg P2O5 ha−1 and 200 kg K2O ha−1 as the basal fertilizers one day before transplanting for the tomato experiments; 40% of the total nitrogen was supplied as the basal fertilizer in each nitrogen treatment plot; the remaining N fertilizer was supplied in 3 equal amounts at 38, 63, and 81 days after transplanting through a drip irrigation.
The tomato variety used for the experiment was ‘Dongsheng 6876’. A ridge was an experimental plot, measuring 4.0 m long and 0.6 m wide, with 33 cm between plants within rows, and accommodating 12 tomato plants (Figure 2a). Just after transplanting, 20 mm water was applied to keep tomato seedlings alive. The soil surface was covered by a polyethylene film. An underground drip irrigation tube (16 mm in diameter, 33 cm between drips) was laid in the center of each cultivation plot, and the buried depth was 15 cm (Figure 2b). The water flow of the drips was 1.2 L h−1, the water supply pressure at the inlet of the pipeline was 0.1 MPa.
ADI used aerated water by ADI system (Figure 2a), including storage lines, circulation pumps, Mazzei air injector 684, (Mazzei Injector Company, Bakersfield, CA, USA), and other equipment to circulate aeration for 20 min to produce irrigation water with an air void fraction of 15%, while CK used groundwater for irrigation with an independent water supply device. Irrigation occurred once every 7–10 days based on cumulative evaporation between two irrigation intervals in evaporation pan (20 cm in diameter and 9 cm in depth). Each plot was equipped with a flow meter and control valve to control the water volume. The total irrigation amount and irrigation time for the crop growing season were 155.8 mm and 13 time, respectively.

2.3. Plant Height and Leaf Area Index (LAI)

Six plants of uniform growth were randomly marked in each experimental plot, and plant height and leaf area were measured every 10 days from the 15th day after transplanting by a straightedge. Then leaf area was derived by summing the rectangular area of each leaf multiplied by a reduction coefficient [27]. Leaf area index (LAI) refers to the leaf area of tomato plants per unit area. The equation is as follows:
L A I = 0.64 ( L · W m ) / ( S l · S r )
where L and Wm are the leaf length (cm) and leaf maximum width (cm), Sl and Sr are the row spacing (cm) and plant spacing (cm), and 0.64 is the reduction coefficient.

2.4. Shoot Biomass and Yield of Tomato

At the fruit harvesting stage, three uniform plant samples were randomly selected from each plot. Plant samples were cut on the ground to obtain the aboveground dry matter (i.e., stems, leaves, and fruits) and underground dry matter (i.e., root). Samples were then placed in an oven at 105 °C for 30 min to deactivate enzymes, followed by 75 °C until a constant dry weight was reached. Aboveground dry matter accumulation is the sum of stem, leaf, and fruit weights [28].
At the fruit maturity stage, we generally select tomato plants that are uniform in growth and free from pests and diseases throughout the whole plot. Eight plants were marked to determine yield in each plot; the single fruit weight and the number of fruits per plant were also recorded for yield calculation.

2.5. Model Description and Application

The logistic model and Richards model were used to quantify the relationship between effective cumulative temperature and greenhouse tomato plant height and LAI under ADI.

2.5.1. Effective Cumulative Temperature

The meteorological data for this experiment were obtained from an automatic weather station located in the greenhouse. The following formula was used to calculate the effective cumulative temperature:
E C T i = k = 1 i T min + T max 2 T b
where ECTi is the effective cumulative temperature from 1 day to i day after transplanting (°C d), Tmax and Tmin are the daily maximum and minimum temperature values (°C), respectively, and Tb is the base temperature of 10 °C for greenhouse tomato [29].

2.5.2. Logistic Model

Non-linear regression fitting of tomato plant height and LAI using a logistic model, respectively. The expressions are as follows [15]:
Y = a ( 1 + b · exp ( k · x ) )
where Y is the plant height or LAI of tomato, a is the maximum plant height or LAI in tomato, t is the effective cumulative temperature (°C d), and b and k are constants.
Characteristic parameters of the logistic model are calculated as follows:
v 1 = k a 4
v 2 = a 3 ( t 3 t 2 )
t 1 = ln b k
t 2 = 1 k ln b 2 + 3
t 3 = 1 k ln b 2 3
where v1 and v2 are the maximum growth rate and average growth rate during the rapid growth stage (cm °C −1 d−1 for plant height, and cm2 cm−2 °C −1 d−1 for LAI), respectively, t1 (°C d) is the effective cumulative temperature when growth rate reaches the maximum value, and t2 and t3 (°C d) are the start and end time nodes of the rapid growth period, respectively. In terms of growth stages, 0~t2 is the gradual growth stage, t2~t3 is the rapid growth stage, t3~∞ is the slow growth stage.

2.5.3. Richards Model

The Richards model is a four-parameter non-linear equation; the equation is as follows:
Y = A / ( 1 + exp ( B C x ) ) 1 / D
where Y is the plant height or LAI of tomato, A is the maximum plant height or LAI in tomato, x is the effective cumulative temperature (°C d), and B, C, and D are parameters.
The characteristic parameters of the Richards model are calculated as follows:
R max = A C ( D + 1 ) ( 1 + 1 / D )
R a v g = A C / ( 2 D + 4 )
x 1 = ( B ln D ) / C
x 2 = ln ( 3 exp ( B ) exp ( B ) D 2 + 6 D + 5 + D exp ( B ) 2 D ) / C
x 3 = ln ( 3 exp ( B ) + exp ( B ) D 2 + 6 D + 5 + D exp ( B ) 2 D ) / C
where Rmax and Ravg are the maximum growth rate and average growth rate during the rapid growth stage (cm °C −1 d−1 for plant height, cm2 cm−2 °C −1 d−1 for LAI), respectively, x1 (°C d) is the effective cumulative temperature when growth rate reaches the maximum value, and x2 and x3 (°C d) are the start and end time nodes of the rapid growth period, respectively.

2.6. Grey Correlation Analysis

Grey correlation analysis is a quantitative description and comparison of the development of and change in a system. In this study, the yield of tomato was used as the reference series (X0) and growth characteristic parameters as the comparison series (Xi). The relative relationships between yield and growth characteristic parameters of tomato could be clarified through grey system correlation analysis. The correlation coefficient can be calculated using the following Formula [30]:
ξ i ( k ) = ( Δ X min + ρ Δ max ) Δ X i ( k ) + ρ Δ X max
where ∆Xmin and ∆Xmax are the minimum and maximum absolute differences of all comparison sequences at each time, respectively. ∆Xi(k) is the absolute difference between the two comparison sequences at time k, and ρ is resolution coefficient, taken as 0.5.
The degree of relevance is calculated as follows [30]:
r i = 1 n k = 1 n ξ i ( k )
where ri is the degree of association between subsequence i and parent sequence 0, and n is the length of the comparison sequence.

2.7. Statistical Analysis

All data were analyzed using Excel 2019 (Microsoft Corp., Redmond, WA, USA). The fitting of the logistic model and Richards model was performed with Curve Expert Professional. data analysis with SPSS 22.0 software (SPSS Inc., Chicago, IL, USA). The significance of differences among treatments were tested by two-way analyses of variance (ANOVAs), and the means were compared by Duncan’s multiple range tests at a significant level of p = 0.05. Correlation analysis and grey correlation analysis were completed using SPSS 22.0. The figures were generated using Origin 2022 and PowerPoint 2019 (Origin Lab Corp., Microsoft Corp., Redmond, WA, USA). R2, nRMSE, and EF were also used to evaluate the performance of the proposed model.
R 2 = i = 1 n ( S i S ¯ ) ( P i P ¯ ) i = 1 n ( S i S ¯ ) 2 i = 1 n ( P i P ¯ ) 2
n R M S E = R M S E S ¯ × 100 %
E F = 1.0 i = 1 n ( S i P i ) 2 i = 1 n ( S i S ¯ ) 2
where Si and Pi (i = 1, 2, …, n) are the observed and predicted data, respectively, and S ¯ and P ¯ are the respective mean values. n is the number of observations. A better performance of the fitted procedure will have R2EF ≈ 1 and nRMSE ≈ 0 [31,32,33].

3. Results

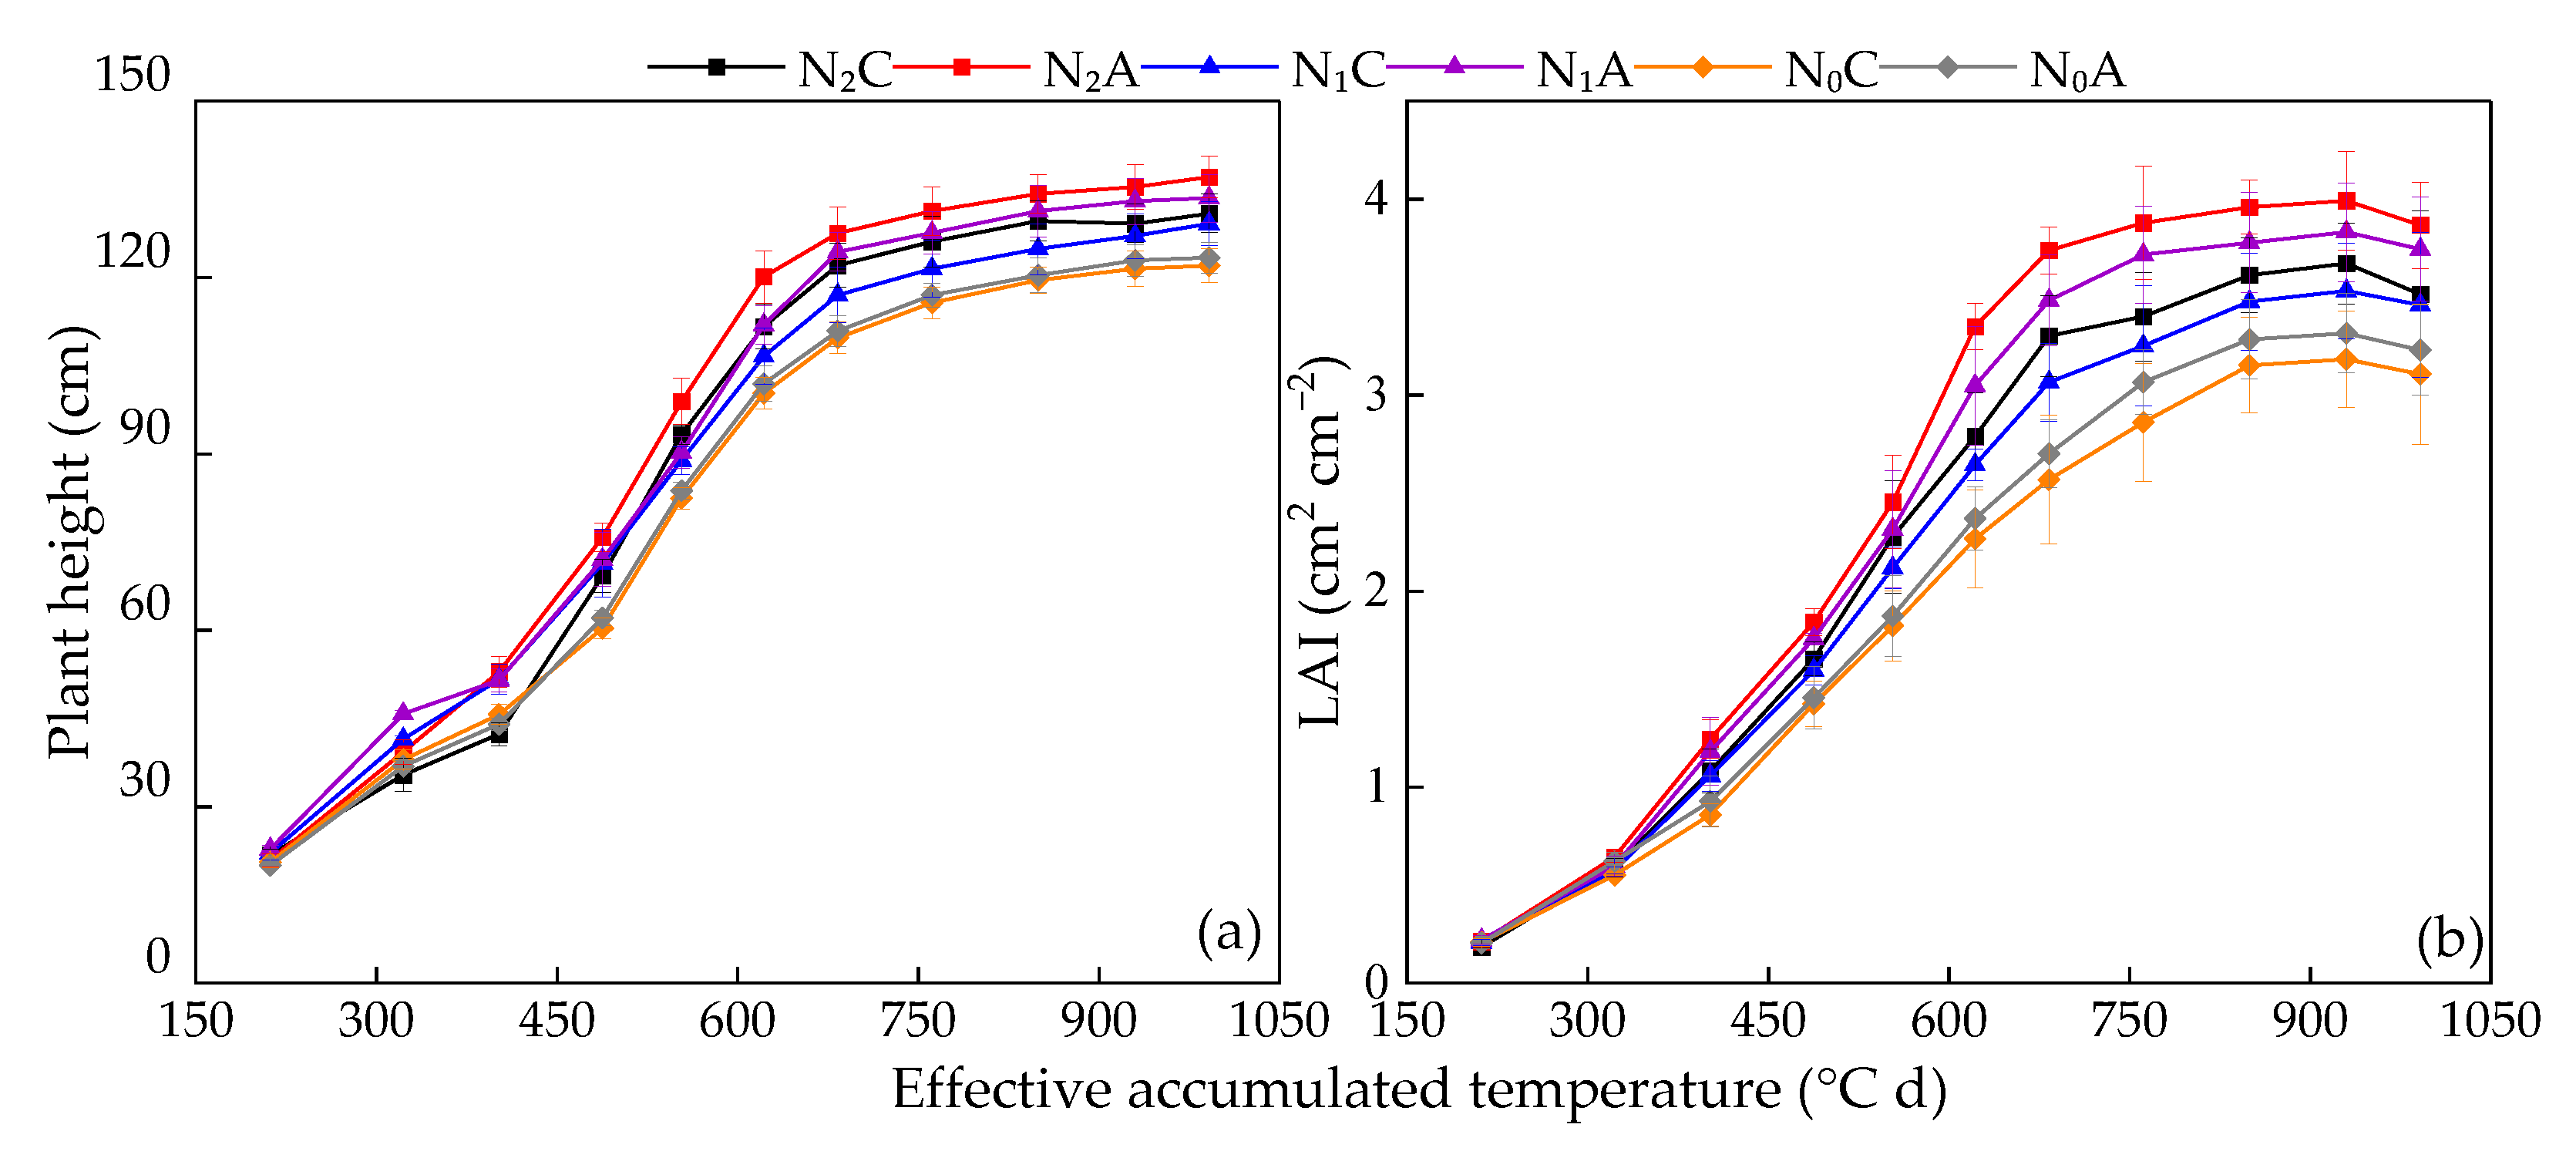
3.1. Plant Height and LAI

The ‘S’–shaped dynamic changes in the tomato plant height and leaf area index (LAI) with effective cumulative temperature under different treatments are shown in Figure 3. Under ADI, the maximum plant height of tomatoes was 1.1%, 3.4%, and 4.7% higher than that of the CK treatments for N0, N1, and N2, respectively. Moreover, the maximum LAI of the crop in the N0, N1 and N2 treatments with ADI was an average of 3.71 cm2 cm−2, which was 7.2% higher than that of the CK in the N0, N1, and N2 treatments.
The plant height and LAI of tomatoes were found to be increased by varying degrees in response to the different N fertilizer management practices. Under the two irrigation methods, the plant height and LAI of tomato were found to be generally increased with increasing nitrogen application rate, reaching a maximum under N2A and N2C treatments, respectively.

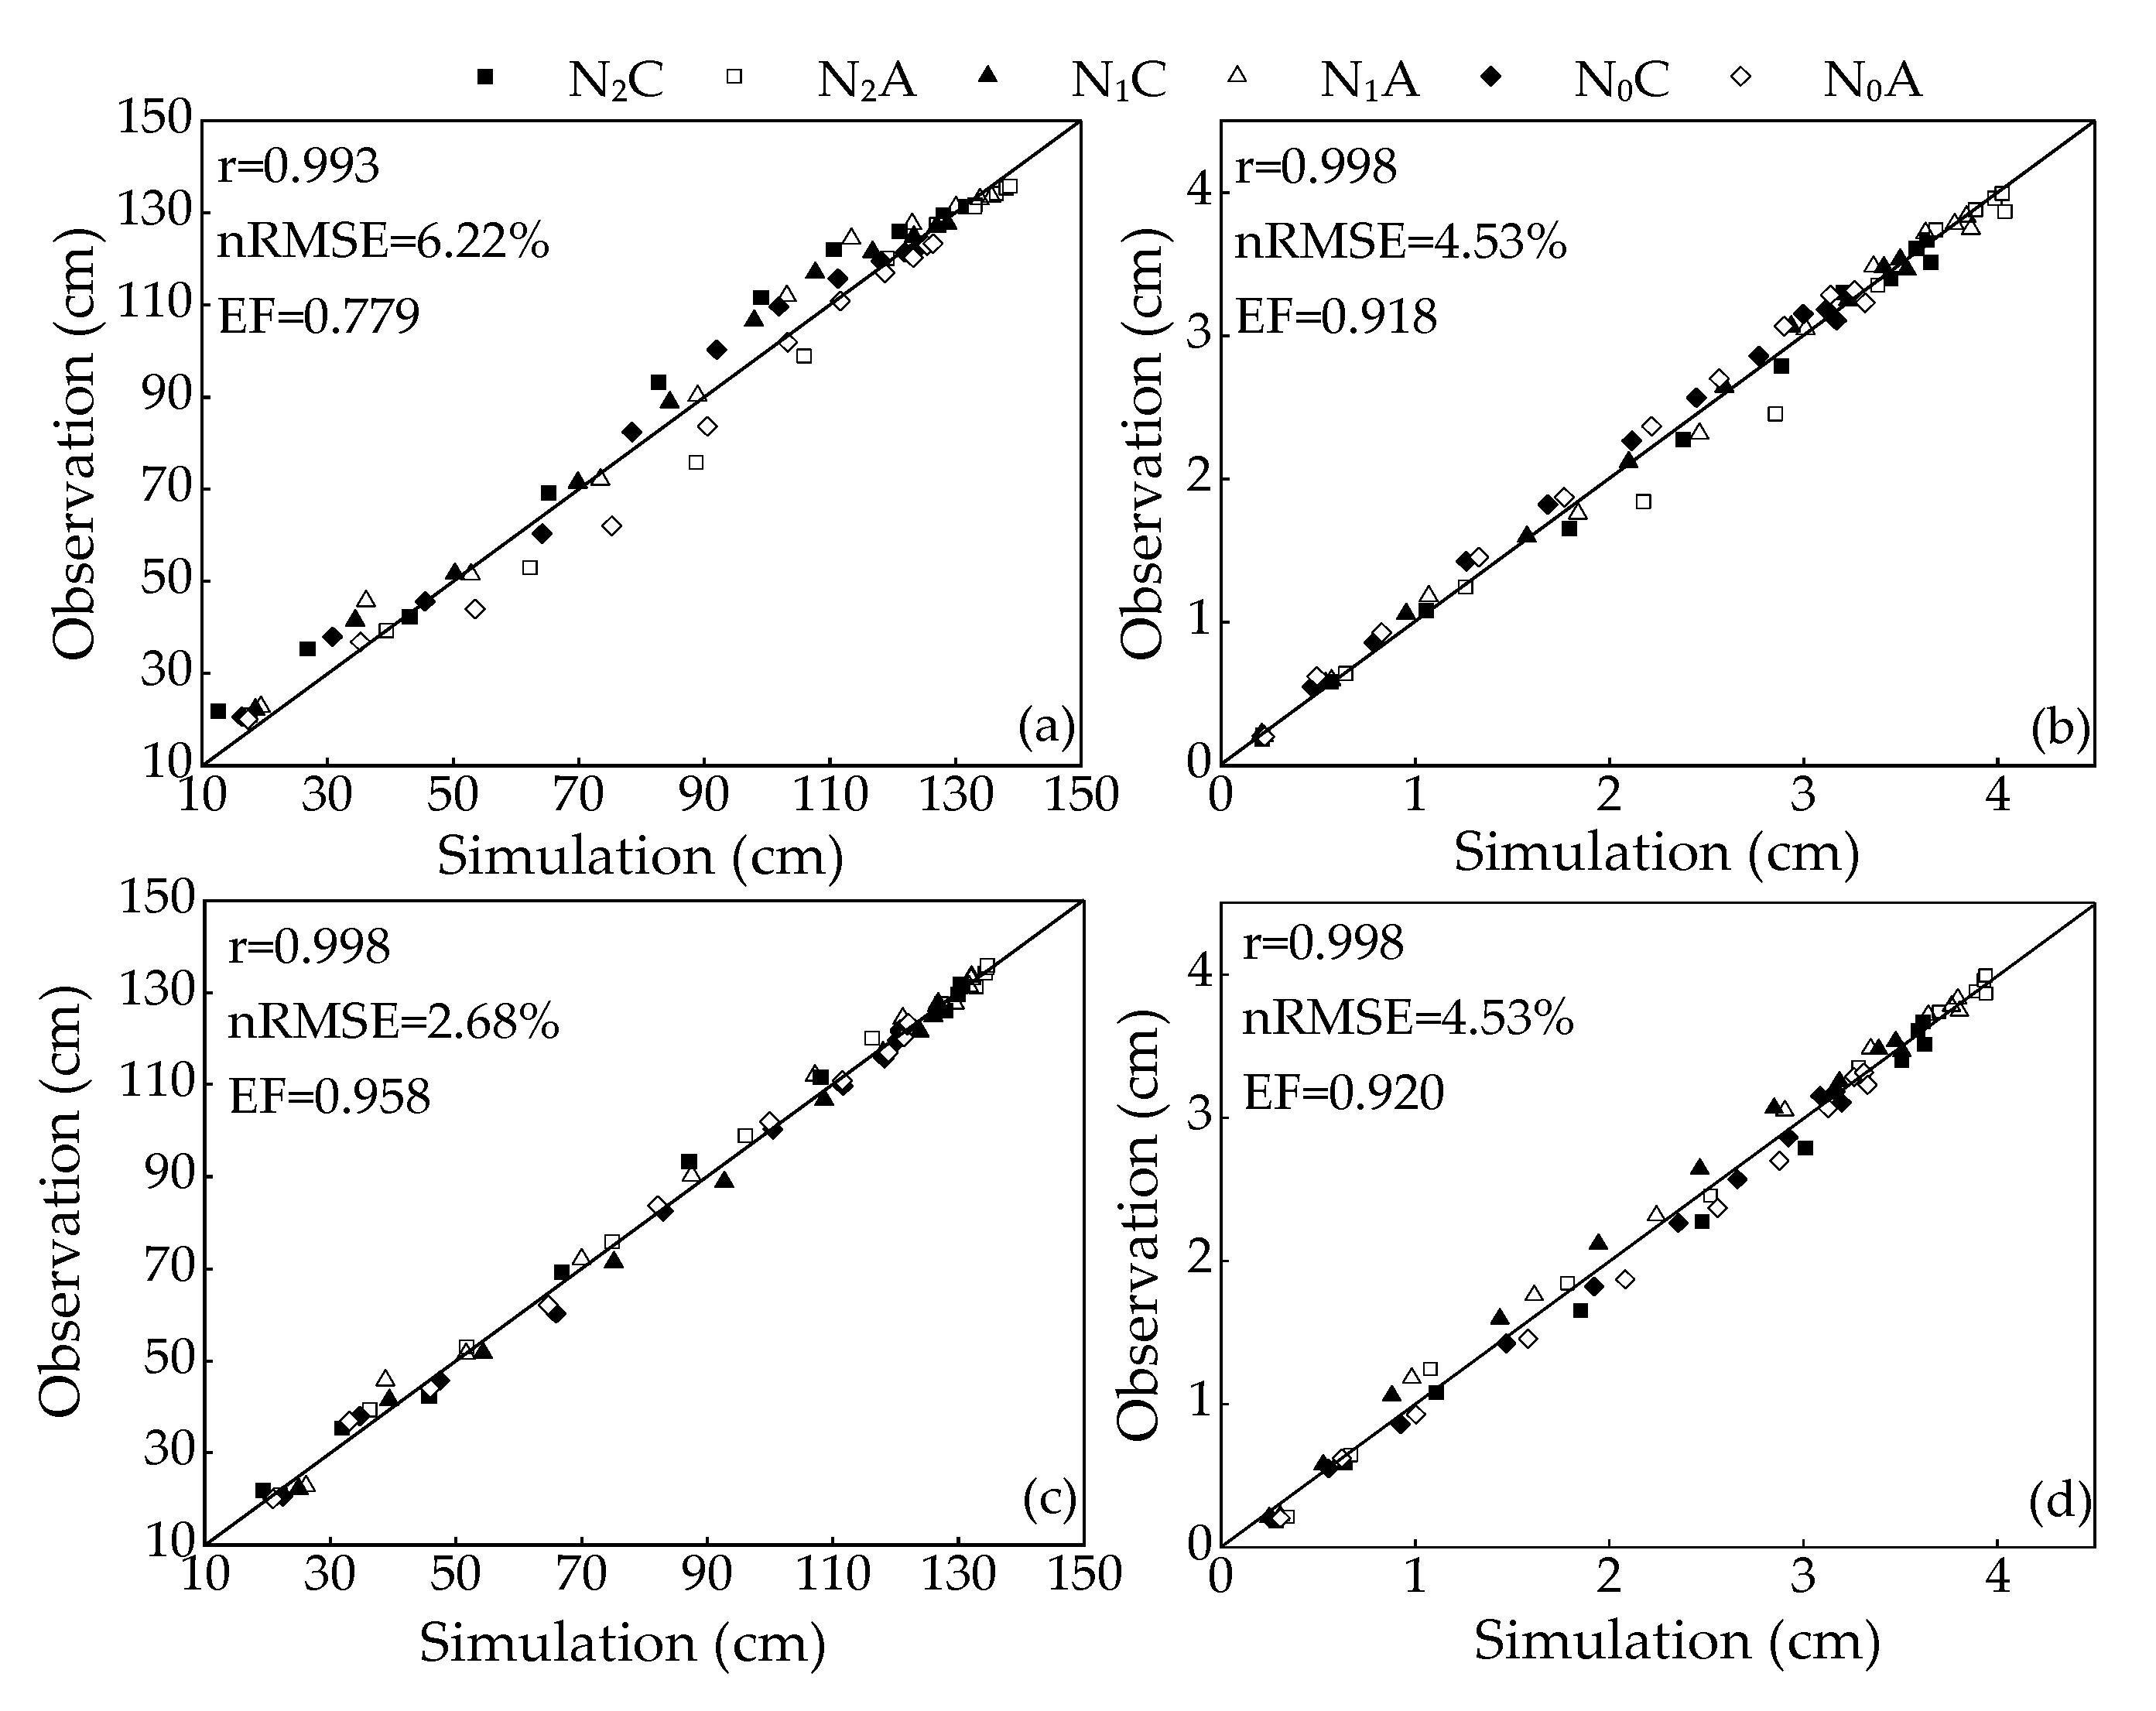
3.2. Fitting of Equation Based on Logistic and Richards Models

The fitting parameters of the logistic model and Richards model for tomato plant height and LAI dynamics under different treatments are shown in Table 1. Using the logistic model, with the effective cumulative temperature as the independent variable, the fitted R2 values of the plant height and LAI under the different treatment conditions were 0.987–0.994 and 0.993–0.998, respectively, at extremely significant levels (p < 0.01). The logistic model for the plant height and LAI exhibited the largest range of variation for parameter ‘b’ with a CV of 0.30 and 0.35, respectively, and the smallest range of variation was observed for parameter ‘a’ with a CV of 0.04 and 0.08, respectively.
Using the Richards model, the fitted R2 values for plant height and LAI under the different treatment conditions were greater than 0.996 and 0.997 (p < 0.01). The Richards model for the plant height and LAI varied the most for parameter ‘D’ with a CV of 0.17 and 0.44, respectively, while parameter ‘A’ varied the least with a CV of 0.04 and 0.07, respectively.
The r, nRMSE, and EF for the observed and the simulated plant height by the logistic model were 0.993, 6.22%, and 0.779, while the r, nRMSE, and EF for the observed and the simulated LAI were 0.998, 4.53%, and 0.918. The r, nRMSE, and EF for the observed and the simulated plant height by the Richards model were 0.998, 2.68%, and 0.958, while the r, nRMSE, and EF for the observed and the simulated LAI were 0.998, 4.53% and 0.920 (Figure 4). The results show that the logistic and Richards models can accurately simulate the variation in plant height and LAI with effective cumulative temperature and can be relied on to further analyze the effect of different treatments on the growth process of the plant height and LAI in tomato.

3.3. Characteristic Parameters Plant Height of Tomato

The characteristic parameters under different treatments in the logistic model are shown in Table 2. At 0, 140, and 210 kg N ha−1, the Hv1 and Hv2 of tomato under ADI were higher than in CK treatments. In particular, the Hv1 and Hv2 of N0A treatment were increased by 14.8% and 15.4%, respectively, over the N0C treatments, and the Ht1 of N0A treatment was reduced by 42.3 °C d compared to the N0C treatments, both at a significant level (p < 0.05). Under CK, the Hv1 and Hv2 of tomato were significantly increased by 36.8% and 37.4%, respectively, at N2 treatment compared to that of N0 treatment, whereas under ADI, the Hv1 and Hv2 of tomato were significantly (p < 0.05) increased by 22.7% and 22.2%, respectively, at N2 treatment over that of N0 treatment.
The analysis of the characteristic parameters of the Richards model (Table 2) shows that the HRmax, Hx2, and Hx3 of tomato under ADI was significantly higher (p < 0.05) than that of the respective treatments under CK at 140 kg N ha−1. Under CK, at N2 treatment, the HRmax of tomato was significantly (p < 0.05) increased by 20.0% and 20.5% compared to that of N1 and N0 treatments, respectively. Under ADI, the HRmax of tomato at N2 and N1 treatments were significantly (p < 0.05) increased by 20.8% and 6.6%, respectively, over the N0 treatment.
The HRmax and HRavg of tomato were found to be increased with the improvement in the N application level under both the irrigation methods, reaching a maximum of 0.331 and 0.205 cm (°C d)−1, respectively, at N2A. Under CK treatments, the difference between Hx2 and Hx3 of tomato was not significant. However, the Hx2 and Hx3 of tomato were initially increased and later decreased, with the improvement in N application level under ADI treatments reaching a minimum of 434.7 and 640.9 °C d, respectively, at 210 kg N ha−1. Conventional N application (210 kg N ha−1) required a lower cumulative temperature to reach the critical period of tomato growth under ADI.

3.4. Characteristic Parameters of LAI

The characteristic parameters of the logistic model under different treatments are shown in Table 3. At 140 and 210 kg N ha−1, the Lv1 and Lv2 of tomato under ADI were significantly higher than those of the corresponding treatments under CK, while the Lt3 of tomato reduced at a significant level (p < 0.05). Under ADI, the Lv2 of tomato at 140 and 210 kg N ha−1 was significantly increased by 50.0% and 66.7%, respectively, over the 0 kg N ha−1. The Lv1 of tomato was increased with the improvement in the N application level, while the Lt1, Lt2, and Lt3 of tomato decreased with the improvement in the N application level.
The analysis of the characteristic parameters of the Richards model (Table 3) shows that under ADI treatments, the LRmax, and LRavg of tomato at 140 and 210 kg N ha−1 levels were significantly higher (p < 0.05) than those of CK, while significantly (p < 0.05) increasing the Hx1 of tomato from 505.7 °C d at N2C treatment to 556.3 °C d at N2A treatment. Notably, the Ht3 of tomato was initially increased but later decreased with the improvement in the N application level under both of the irrigation methods.

3.5. Dry Matter Accumulation and Yield of Tomato

The accumulation of dry weight in tomato under different treatments increased gradually but consistently (Figure 5). The dry weight accumulation increased to varying degrees in response to the ADI and N fertilizer application treatments. The aboveground dry weight at the fruit mature stage with ADI was 4.2%, 9.3%, and 6.0% higher than that of the CK treatments at the 0, 140, and 210 kg N ha−1 levels, respectively (p < 0.05). Compared with the CK treatments, the aboveground dry weight at the fruit expanding stage with ADI was significantly (p < 0.05) increased by 10.9% and 13.8% in the 140 and 210 kg N ha−1 treatments, respectively. The underground dry weight of N2A at the fruit expanding stage and mature stage was, significantly (p < 0.05), 1.07–fold higher than in the corresponding N2C treatments.
The yield of tomato was significantly increased by ADI treatments in the 140 and 210 kg N ha−1 levels (Figure 5b). Under 140 and 210 kg N ha−1 treatments, the yield of tomato under ADI was increased by 11.7% and 13.8% (p < 0.05), respectively, compared with the CK treatment. Under the two irrigation methods, the accumulation of dry weight and the yield of tomato were increased with the improvement in the N application level at the three growth stages. The maximum yield was recorded in the N2A treatment at 85.87 t ha−1.

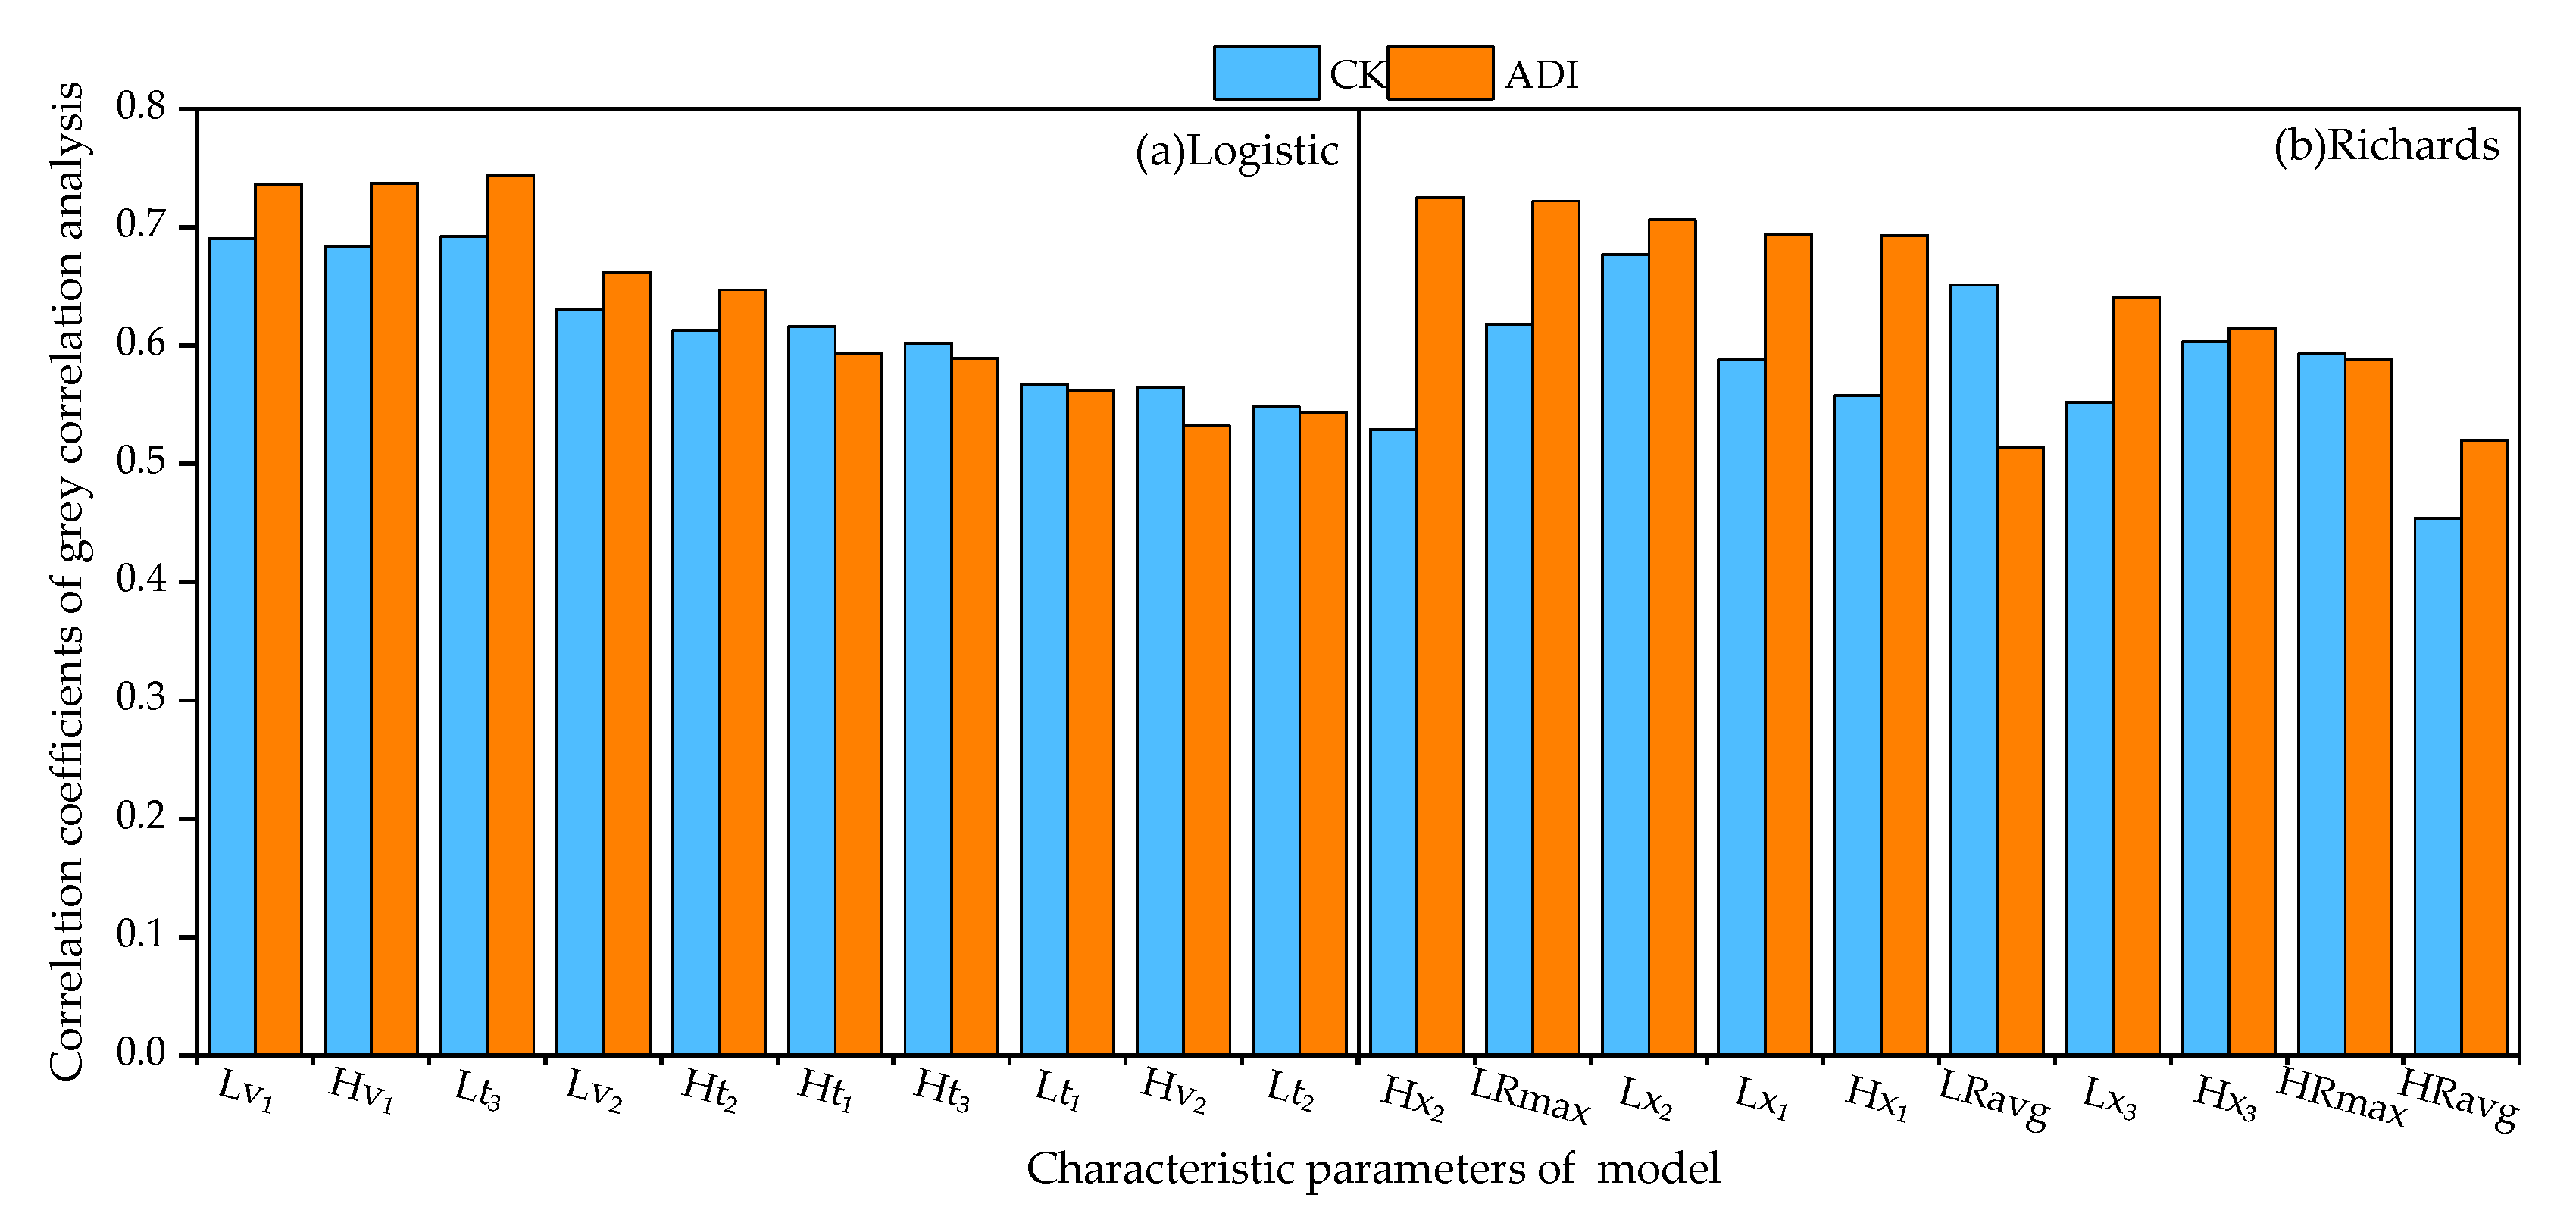
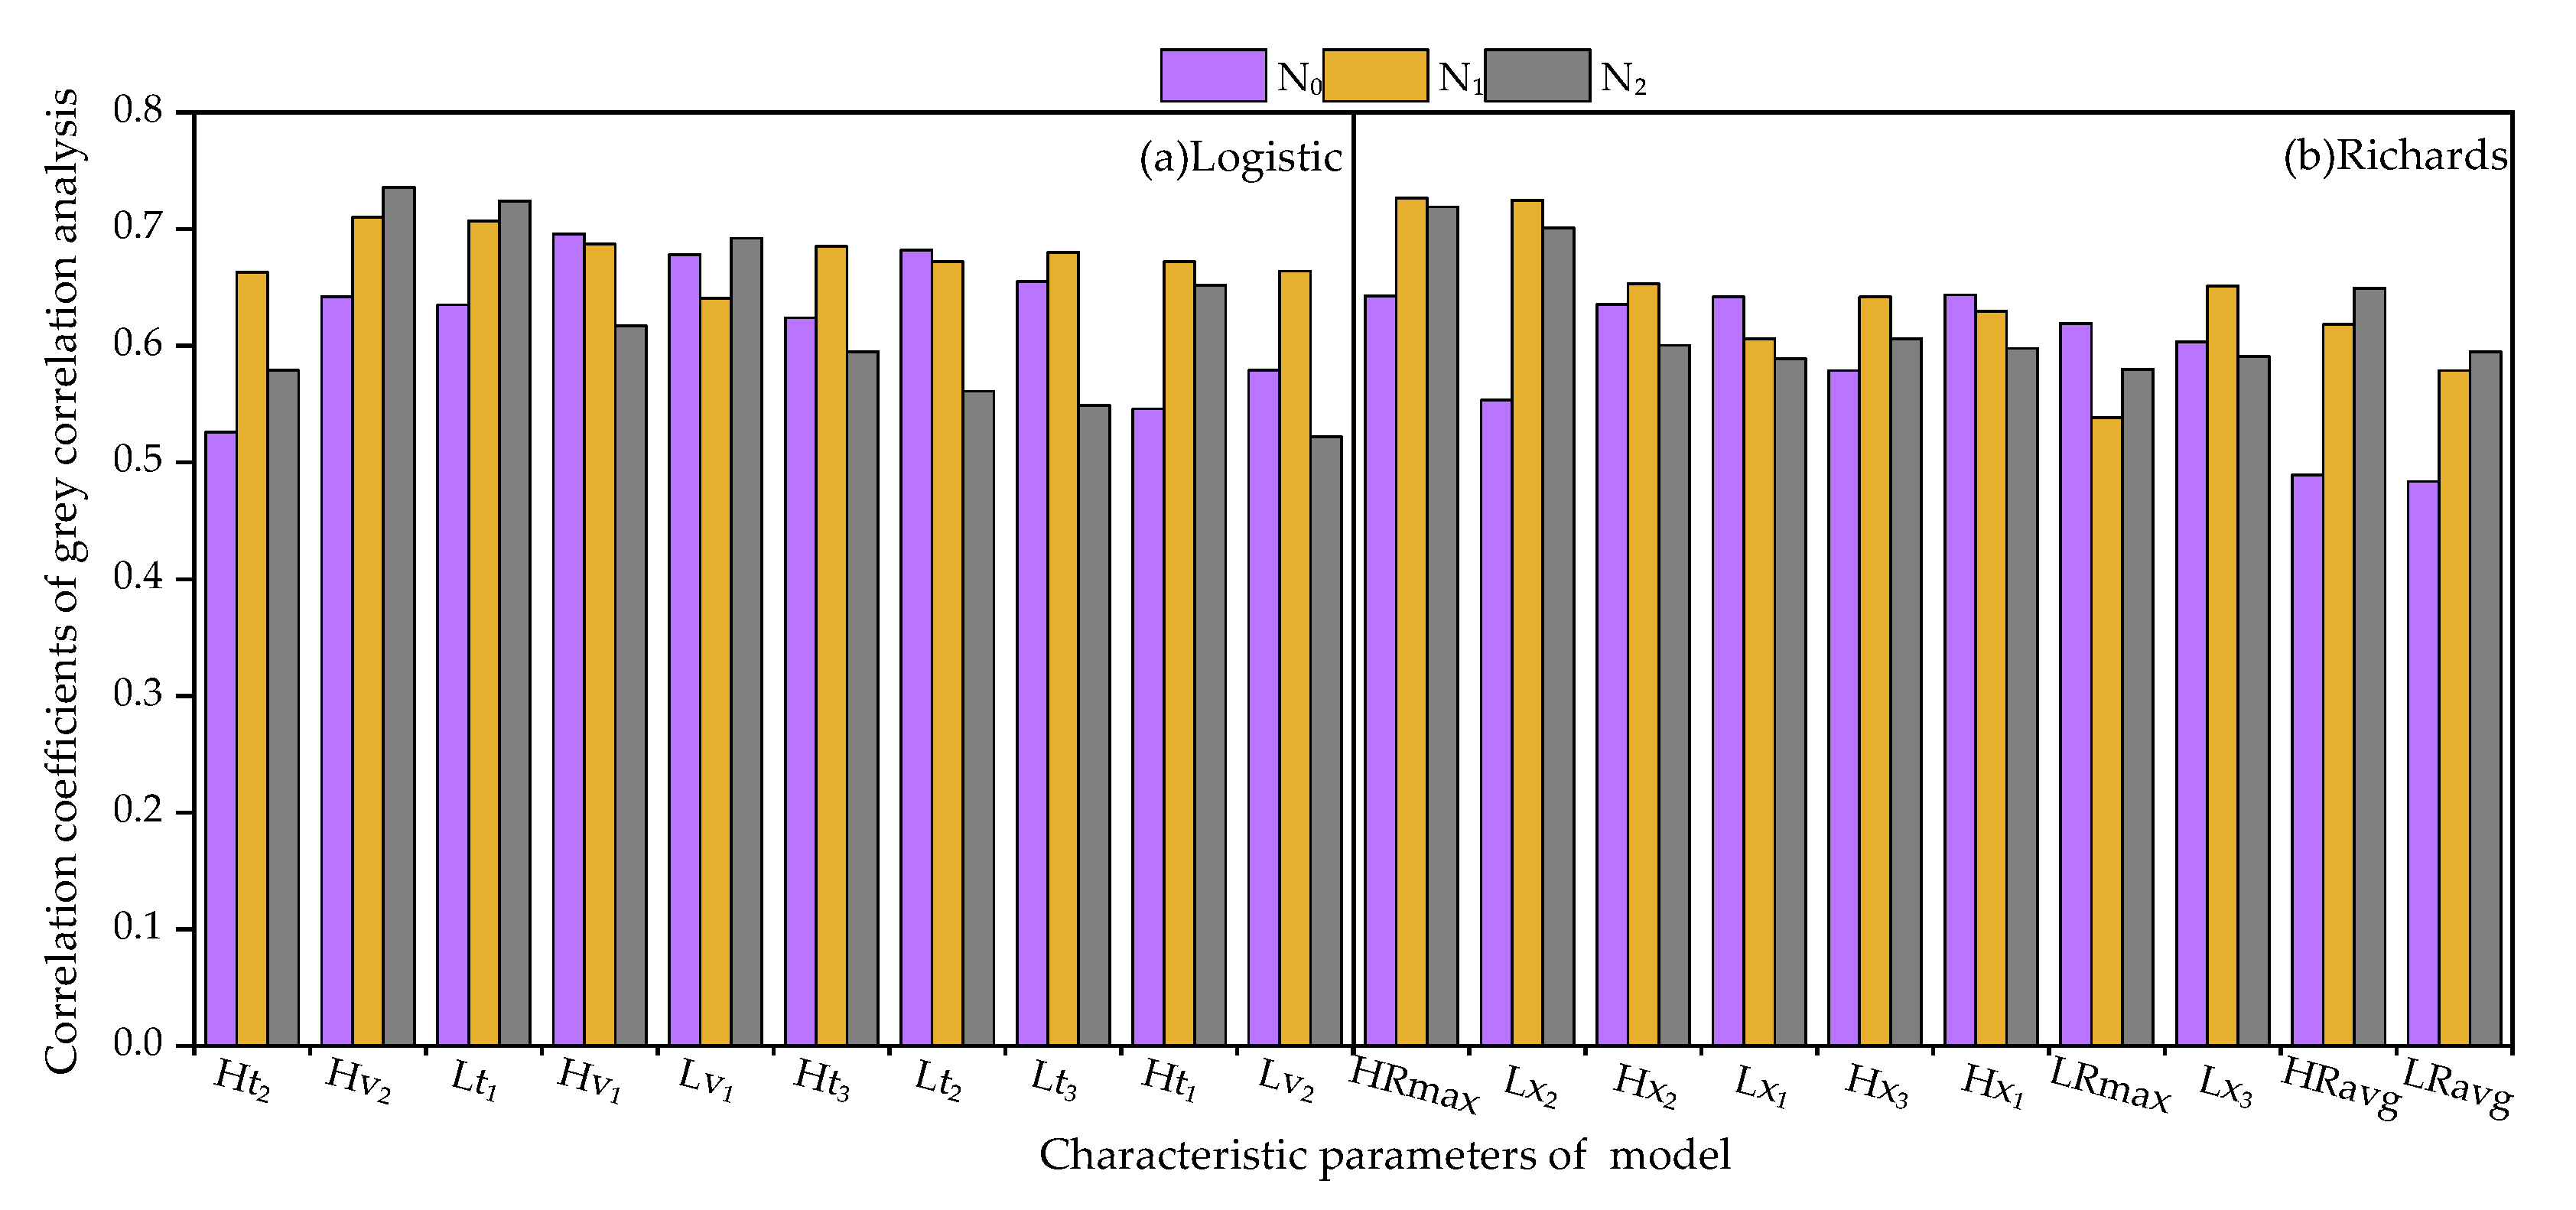
3.6. Grey Correlation Analysis

To evaluate the most suitable growth characteristic parameters under the different treatments, a grey system was established from the logistic and Richards models (Figure 6 and Figure 7). The response index data of the growth characteristic parameters of the model under different treatments were used as the comparison sequence, while the yield of tomato under the different treatments was used as the reference frame. The comparison of the correlation coefficients reveals that under the different irrigation methods (Figure 6a,b), the top three highest-ranked correlations between the growth characteristic parameters of the logistic model and yield were Lv1, Hv1, and Lt3. In comparison, the top three highest-ranked correlations between the characteristic growth parameters and yield for the Richards model were Hx2, LRmax, and Lx2.
The top three parameters with the highest correlation between the two models were from the ADI treatment alone. Under the different N application rates (Figure 7a,b), the growth characteristic parameters of the logistic and Richards models with a correlation above 0.7 with the yield were Hv2 and Lt1, and HRmax and Lx2, respectively, and both were obtained from the N1 and N2 treatments.

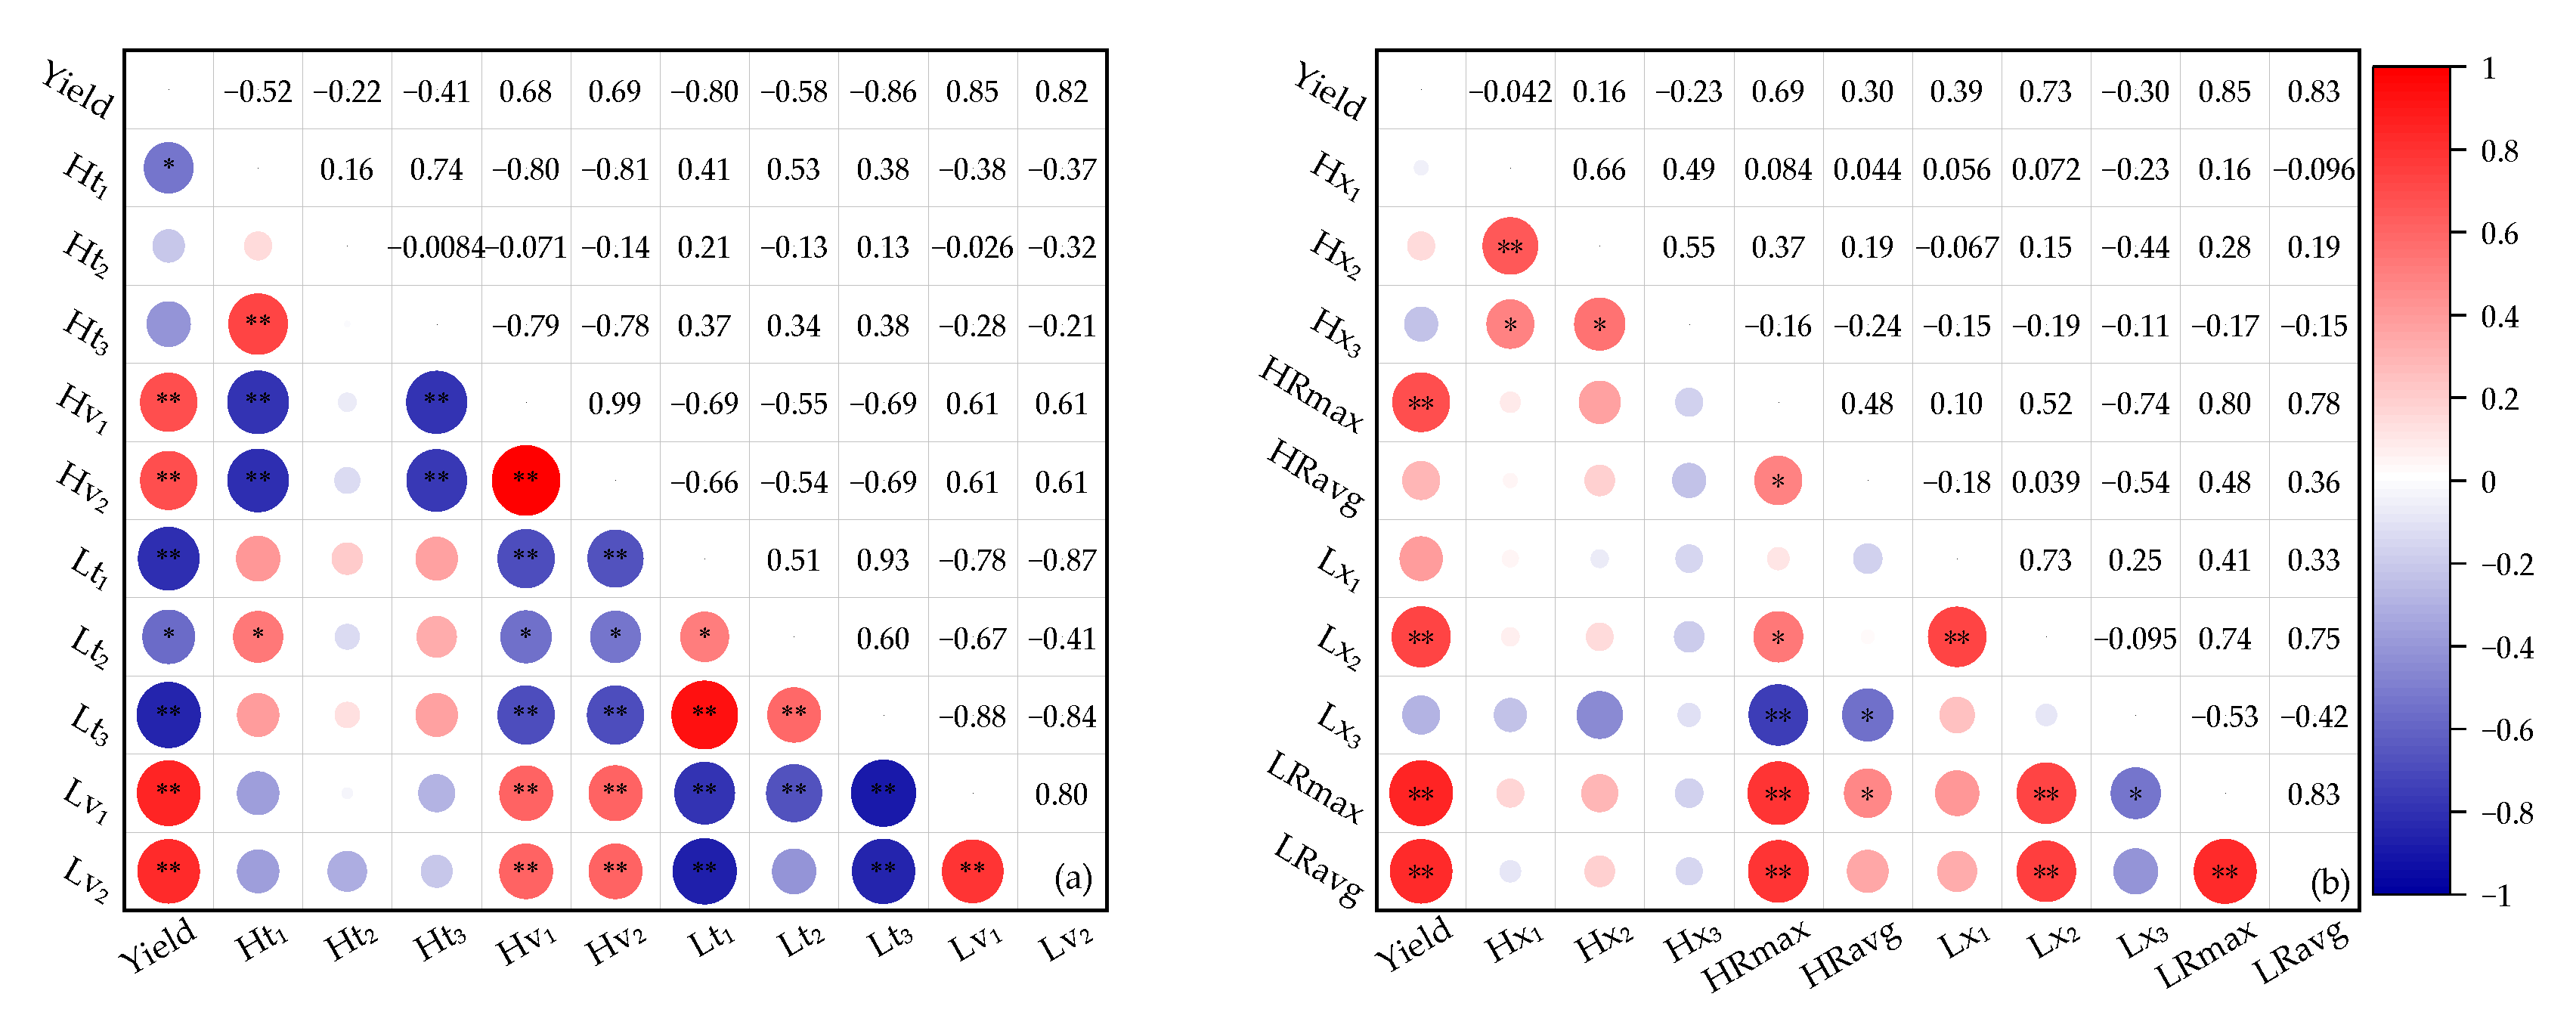
3.7. Relationship between Growth Characteristic Parameters and Yield of Tomato

The correlation analysis between the growth characteristic parameters and the yield is shown in Figure 8. The parameters Hv1, Hv2, Lv1, and Lv2 were highly significant and positively correlated with the yield (Y), while the parameters Ht1, Lt1, Lt2, and Lt3 were negatively correlated with the yield (p < 0.05, 0.01). The parameters HRmax, Lx2, LRmax, and LRavg were highly significant and positively correlated with the yield (p < 0.01).
The stepwise regression method was used to establish the optimal regression equation. The growth characteristic parameters were used as independent variables, while the yield of tomato was considered as the dependent variable. According to the corresponding results of the test of significance for the independent variables, Lt3 was noted to have a significant effect on yield in the logistic model (Table 4). The regression relationship explained 70.2% of the variation in the yield, where the linear equation obtained was Y = −0.195 Lt3 + 198.77. In the Richards model, the regression relationship explained 70.2% of the variation in the yield, where the linear equation obtained was Y = 4610.64 LRmax + 29.02.

4. Discussion

4.1. Model Construction and Analysis of Tomato Plant Height and LAI

Plant height and leaf area are important dynamic indicators of crop growth and development, which are closely related to crop biomass and yield [34]. Soil fertility refers to the ability of the soil to meet the water, nutrient, air, and heat requirements for crop growth and development, which is greatly influenced by soil fertility. Earlier studies have reported that aerated irrigation could improve soil fertility, thereby significantly increasing crop yields [10,35,36]. In the present study, ADI and N application were found to increase the tomato plant height and LAI (Figure 3), as was also observed in several other studies [23,37,38].
Cumulative temperature is one of the most important environmental factors that affects crop growth, and has been widely used in crop phenology modeling, agro-meteorological forecasting, and also in the prediction of yield [39]. The study of the quantitative relationship between effective cumulative temperature and crop growth indicators provides a basis for quantitative studies on crop growth dynamics and regulation, and provides essential support for predicting changes in crop yield. Using tomato and aubergine as subjects, and effective cumulative temperature as the independent variable, Hsieh et al. conducted a study in Taiwan to establish the relationship with plant stem thickness using Gompertz, Richards, and logistic models, and reported that the R2 was greater than 0.70 [24]. Jiao et al. reported that the Gompertz model and logistic model could be used to fit the growth of A. thaliana rosette leaves, with R2 > 0.86 [40]. In the present investigation, the logistic and Richards models were used to fit the variety of tomato plant height and LAI values with effective cumulative temperature under different treatments, where the R2 of the fitted equation was above 0.98 for all of the treatments at extremely significant levels (Table 1). In both the models, between the treatments, the measured and simulated values were observed as: r being greater than 0.99, nRMSE within 10.0%, and EF above 0.70 (Figure 4). The logistic and Richards models, based on the effective cumulative temperature, can effectively simulate and predict the dynamic changes in the tomato plant height and leaf area index under the different treatments. The models that are based on effective cumulative temperature are currently applied to a wide range of crops [15,24,41]. However, the response of crop growth indicators to different field management practices, crop varieties, soil quality, and other factors needs further investigation, and the resulting model should be validated using multi-year and multi-location growth data.

4.2. Relationship of Model Characteristic Parameters of Plant Height and LAI of Tomato with Yield

Several biologically significant parameters can be derived from the multi-order derivation of the growth equation, which can be further used to analyze the changes in the crop growth dynamics [34]. In the present study, the logistic and Richards models were used to derive multiple orders for the equations fitted to tomato plant height and LAI. The resulting growth process of tomato was divided into three stages, namely, the gradual growth stage, the rapid growth stage, and the slow growth stage. During the process of production, the early transition of the crop leaf area to the fast growth period results in an accelerated rate of the establishment of photosynthetic organs, leading to a greater accumulation of photosynthetic products. Concurrently, the prolonged duration of the slow growth period is beneficial, as the growth of the nutrient organs is curtailed during this period, whereby most of the photosynthetic products can be utilized for fruit formation. The longer the duration, the better it is for yield improvement [42]. Li et al. used the logistic and Richards models to quantify the dynamic characteristics of the LAI and plant height of winter wheat under coupled water and nitrogen conditions, showing that the application of 210 kg N ha−1 significantly increased the maximum growth rate of the plant height and LAI compared to the treatment without N fertilizer, with a significant reduction in the cumulative temperature required for the maximum growth rate [43]. Xiao et al. found that ADI increased both the maximum growth rate and the average growth rate over the rapid growth period in Pepper by 13.0% and 11.8%, respectively, compared to the CK treatments, which accelerated the formation of the nutrient organs in pepper [44]. The aforementioned results were similar to the findings in the current study.
In our study, we found that N2 could significantly increase the Hv1, Lv1, Hv2, and Lv2 compared to N0 treatment under both irrigation methods (Table 2 and Table 3). Under the CK treatments, using the logistic model, the cumulative temperature required for the Ht1 and Lt1 decreased with an increasing N application rate. In contrast, the cumulative temperatures required for Hx1 and Lx1 in the Richards model did not change significantly (Table 2 and Table 3). Different irrigation methods also significantly affected the variation in growth parameters of both models. The Hv1, Lv1, Hv2, Lv2, and HRmax, LRmax, HRavgHRavg, and LRavg were significantly higher under the ADI compared to the CK treatments. However, under the nitrogen application rates (N2, N1), the Ht1, Ht2, and Ht3 did not change significantly in the ADI (Table 2 and Table 3). Surprisingly, the relevant parameters of the Richards model present a different result. Under ADI, the Ht2, Ht3, Lt2, and Lt3 tended to initially increase but later decrease with increasing N application, reaching a minimum at the N2 level. This shows that the N2 treatment combined with ADI required less cumulative temperature to reach the critical period of growth compared to the N0 or N1 treatments. This ensures that the crop continues to grow in the exuberant stage, accumulating more dry matter, thereby contributing to the yield at a later stage, provided that all other external conditions remain the same. This may be due to the fact that ADI increases the oxygen content in the root zone of tomatoes, providing nutrients for root respiration and aerobic soil microorganisms and enzymes, and improves the absorption and use of nutrients by the root system. It also promotes the establishment of the plant canopy structure at an early growing stage, providing sufficient N for crop reproductive growth, thereby improving the N accumulation and its transport to the fruit.
There is an inextricable relationship between crop growth traits and the development of final yield and quality, with crop yield showing an increase with increasing leaf area index within a specific range [45]. Li et al. indicated that the number of grains per square meter in winter wheat was significantly and positively correlated with the mean LAI, while the thousand grain quality was significantly and positively correlated with the maximum plant height, where the mean LAI played a greater role in determining yield [43]. Song et al. reported that the yield of winter wheat was significantly and positively correlated with the mean and maximum growth rates of the dry matter accumulation process [46]. The present study used correlation and stepwise regression analysis (Figure 8 and Table 4) to find that the model characteristics Lt3 and LRmax, which were significantly correlated with yield, had the most significant effect on yield formation. The grey correlation analysis showed (Figure 6) that the correlation between the parameters Lt3 and LRmax, and yield under aerated drip irrigation was above 0.7. In addition, it was observed (Table 3) that ADI, and N1 and N2 applications significantly reduced Lt3 while significantly increasing LRmax compared to the CK and N0 application treatments. This promoted favorable growth in leaf area, resulting in a positive impact on yield formation. Jo et al. also confirmed that the fruit number increased with the higher LAI [13]. In the current scenario, the study of crop dry matter quality and nutrient accumulation using sigmoid curves and their characteristic parameters has become one of the main focuses of crop growth simulation studies [7,24,47,48]. In this study, only two growth dynamic indicators, i.e., plant height and LAI, were simulated and analyzed. In the future, multi-year experiments must be carried out to simulate the dry matter accumulation and nitrogen accumulation of different vegetables at different fertility stages under aerated drip irrigation, using the effective cumulative temperature as the independent variable. This would improve the precise regulation of nitrogen fertilization in vegetables and provide a scientific basis for reasonable prediction of biomass and yield to ultimately achieve increased yield and efficiency.

5. Conclusions

Through this study, it was found that a scientific basis was provided for the dynamic simulation and accurate prediction of greenhouse tomato growth under ADI and N application.
Compared to the CK and 0 kg N ha−1 treatment, ADI and N application were found to significantly increase the maximum growth rate and average growth rate over the rapid growth period of the tomato plant height and LAI; this also reduced the effective cumulative temperature at which plant height entered the rapid growth period (p < 0.05), thereby increasing the time spent in the nutritional growth phase, and this laid the foundation for better development of the subsequent reproductive organs. Tomato yields also confirm it: the highest yield of 85.87 t ha−1 was noted in the N2A treatment, which was increased by 13.8%, 12.2%, and 39.6% (p < 0.05), respectively, compared to N2C, N1A, and N0A treatments. Grey correlation analysis showed that the characteristic parameters closely related to yield were all from the ADI and N application treatments. Furthermore, it was observed that the effective cumulative temperature (Lt3) and the maximum growth rate (LRmax) of the LAI at which the LAI entered the slow growth phase were the key growth characteristic parameters affecting tomato yield.

Author Contributions

Conceptualization, Z.X. and H.L.; software, Z.X.; validation, Z.X., H.L. and H.P.; formal analysis, C.J.; investigation, Z.X., C.J. and Y.L.; data curation, Z.X. and C.J.; writing—review and editing, Z.X., H.L. and H.P.; project administration, H.L. All authors have read and agreed to the published version of the manuscript.

Funding

This research was funded by the National Natural Science Foundation of China (No. 52079052), Key Science and Technology Project of Henan Province (No. 212102110032), the Key Research and Development Program Major Science and Technology Innovation Project in Shandong Province (No. 2019JZZY010710), and the Fund of Innovative Program for PhD Students at North China University of Water Resources and Electric Power, China (No. NCWUBC202202).

Data Availability Statement

Data are contained within the article.

Acknowledgments

We fully appreciate the editors and all anonymous reviewers for their constructive comments on this manuscript.

Conflicts of Interest

The authors declare no conflict of interest. The founding sponsors had no role in the design of the study; in the collection, analyses, or interpretation of data; in the writing of the manuscript; and in the decision to publish the results.

References

  1. Ma, Y.; Liu, Z.H.; Xi, B.D.; He, X.S.; Li, Q.L.; Qi, Y.J.; Jin, M.Y.; Guo, Y. Characteristics of groundwater pollution in a vegetable cultivation area of typical facility agriculture in a developed city. Ecol. Indic. 2019, 105, 709–716. [Google Scholar] [CrossRef]
  2. Zhang, Y.; Wang, P.J.; Wang, L.; Sun, G.Q.; Zhao, J.Y.; Zhang, H.; Du, N. The influence of facility agriculture production on phthalate esters distribution in black soils of northeast China. Sci. Total Environ. 2015, 506, 118–125. [Google Scholar] [CrossRef] [PubMed]
  3. Niu, W.Q.; Jia, Z.X.; Zhang, X.; Shao, H.B. Effects of soil rhizosphere aeration on the root growth and water absorption of tomato. Clean-Soil Air Water 2012, 40, 1364–1371. [Google Scholar] [CrossRef]
  4. Niu, W.Q.; Guo, Q.; Zhou, X.B.; Helmers, M.J. Effect of Aeration and Soil Water Redistribution on the Air Permeability under Subsurface Drip Irrigation. Soil Sci. Soc. Am. J. 2012, 76, 815–820. [Google Scholar] [CrossRef]
  5. Zhu, J.J.; Niu, W.Q.; Zhang, Z.H.; Siddique, K.H.; Sun, D.; Yang, R. Distinct roles for soil bacterial and fungal communities associated with the availability of carbon and phosphorus under aerated drip irrigation. Agr. Water Manag. 2022, 274, 107925. [Google Scholar] [CrossRef]
  6. Jiang, S.Q.; Yu, Y.N.; Gao, R.W.; Wang, H.; Zhang, J.; Li, R.; Long, X.H.; Shen, Q.R.; Chen, W.; Cai, F. High-throughput absolute quantification sequencing reveals the effect of different fertilizer applications on bacterial community in a tomato cultivated coastal saline soil. Sci. Total Environ. 2019, 687, 601–609. [Google Scholar] [CrossRef]
  7. Du, Y.D.; Zhang, Q.; Cui, B.J.; Sun, J.; Wang, Z.; Ma, L.H.; Niu, W.Q. Aerated irrigation improves tomato yield and nitrogen use efficiency while reducing nitrogen application rate. Agr. Water Manag. 2020, 235, 106152. [Google Scholar] [CrossRef]
  8. Niu, W.Q.; Zhang, E.X.; Lv, C.; Sun, J.; Dong, A.H.; Wu, M.L. Clogging characteristics of muddy drip irrigation dripper under different aeration and particle size conditions. Trans. Chin. Soc. Agric. Mach. 2021, 52, 144–152. (In Chinese) [Google Scholar]
  9. Gu, X.B.; Li, Y.N.; Du, Y.D.; Yin, M.H. Ridge-furrow rainwater harvesting with supplemental irrigation to improve seed yield and water use efficiency of winter oilseed rape (Brassica napus L.). J. Interg. Agr. 2017, 16, 1162–1172. [Google Scholar] [CrossRef] [Green Version]
  10. Zhou, Y.P.; Bastida, F.; Zhou, B.; Sun, Y.F.; Gu, T.; Li, S.Q.; Li, Y.K. Soil fertility and crop production are fostered by micro-nano bubble irrigation with associated changes in soil bacterial community. Soil Biol. Biochem. 2020, 141, 107663. [Google Scholar] [CrossRef]
  11. Lei, H.J.; Xiao, Z.Y.; Zhang, Z.H.; Jin, C.C.; Pan, H.W.; Sun, K.P.; Xi, H.P. Effects of oxygen and nitrogen coupled irrigation on soil fertility and bacterial community under greenhouse pepper cropping system. Trans. Chin. Soc. Agric. Eng. 2021, 37, 158–166. (In Chinese) [Google Scholar]
  12. Wang, R.; Sun, Z.; Yang, D.; Ma, L. Simulating cucumber plant heights using optimized growth functions driven by water and accumulated temperature in a solar greenhouse. Agr. Water Manag. 2022, 259, 107170. [Google Scholar] [CrossRef]
  13. Jo, W.J.; Shin, J.H. Effect of leaf-area management on tomato plant growth in greenhouses. Hortic. Environ. Biotechnol. 2020, 61, 981–988. [Google Scholar] [CrossRef]
  14. Shabani, A.; Sepaskhah, A.; Kamgar-Haghighi, A.A. Estimation of yield and dry matter of rapeseed using Logistic model under water, salinity and deficit irrigation. Arch. Agron. Soil Sci. 2014, 60, 951–969. [Google Scholar] [CrossRef]
  15. Ding, D.Y.; Feng, H.; Zhao, Y.; Robert, L.H.; Yan, H.M.; Chen, H.X.; Hou, H.J.; Chu, X.S.; Liu, J.C.; Wang, N.J.; et al. Effects of continuous plastic mulching on crop growth in a winter wheat-summer maize rotation system on the Loess Plateau of China. Agric. For. Meteorol. 2019, 271, 385–397. [Google Scholar] [CrossRef]
  16. Li, G.Q.; Tang, L.; Zhang, W.Y.; Cao, W.X.; Zhu, Y. Dynamic analysis on response of dry matter accumulation and partitioning to nitrogen fertilizer in wheat cultivars with different plant types. Acta Agron. Sin. 2009, 35, 2258–2265. (In Chinese) [Google Scholar] [CrossRef]
  17. Fang, S.L.; Kuo, Y.H.; Kang, L.; Chen, C.C.; Hsieh, C.Y.; Yao, M.H.; Kuo, B.J. Article using sigmoid growth models to simulate greenhouse tomato growth and development. Horticulturae 2022, 8, 1021. [Google Scholar] [CrossRef]
  18. Archontoulis, S.A.; Miguez, F.E. Nonlinear regression models and applications in agricultural research. Agron. J. 2015, 107, 786–798. [Google Scholar] [CrossRef] [Green Version]
  19. Miguez, F.E.; Zhu, X.; Humphries, S.; Bollero, G.A.; Long, S.P. A semimechanistic model predicting growth and production of the bioenergy crop Miscanthus × giganteus: Description, parameterization and validation. GCB Bioenergy 2009, 1, 282–296. [Google Scholar] [CrossRef]
  20. Mahbod, M.; Sepaskhah, A.R.; Zand-Parsa, S. Estimation of yield and dry matter of winter wheat using logistic model under different irrigation water regimes and nitrogen application rates. Arch. Agron. Soil Sci. 2014, 60, 1661–1676. [Google Scholar] [CrossRef]
  21. Royo, C.; Blanco, R. Growth analysis of five spring and five winter triticale genotypes. Agron. J. 1999, 91, 305–311. [Google Scholar] [CrossRef]
  22. Richards, F. A flexible growth function for empirical use. J. Exp. Bot. 1959, 10, 290–301. [Google Scholar] [CrossRef]
  23. Wu, Y.; Yan, S.; Fan, J.; Zhang, F.; Xiang, Y.; Zheng, J.; Guo, J. Responses of growth, fruit yield, quality and water productivity of greenhouse tomato to deficit drip irrigation. Sci. Hortic. 2021, 275, 109710. [Google Scholar] [CrossRef]
  24. Hsieh, C.Y.; Fang, S.L.; Wu, Y.F.; Chu, Y.C.; Kuo, B.J. Using Sigmoid Growth Curves to Establish Growth Models of Tomato and Eggplant Stems Suitable for Grafting in Subtropical Countries. Horticulturae 2021, 7, 537. [Google Scholar] [CrossRef]
  25. Diel, M.I.; Lúcio, A.D.C.; Valera, O.V.S.; Sari, B.G.; Olivoto, T.; Pinheiro, M.V.M.; Melo, P.J.d.; Tartaglia, F.d.L.; Schmidt, D. Production of biquinho pepper in different growing seasons characterized by the logistic model and its critical points. Cienc. Rural. 2020, 50. [Google Scholar] [CrossRef] [Green Version]
  26. Lucio, A.D.; Nunes, L.F.; Rego, F. Nonlinear models to describe production of fruit in Cucurbita pepo and Capiscum annuum. Sci. Hortic. 2015, 193, 286–293. [Google Scholar] [CrossRef]
  27. Gong, X.W.; Qiu, R.J.; Sun, J.S.; Ge, J.K.; Li, Y.B.; Wang, S.S. Evapotranspiration and crop coefficient of tomato grown in a solar greenhouse under full and deficit irrigation. Agric. Water Manag. 2020, 235, 106154. [Google Scholar] [CrossRef]
  28. Gu, X.B.; Li, Y.N.; Du, Y.D. Effects of ridge-furrow film mulching and nitrogen fertilization on growth, seed yield and water productivity of winter oilseed rape (Brassica napus L.) in Northwestern China. Agric. Water Manag. 2018, 200, 60–70. [Google Scholar] [CrossRef]
  29. Adams, S.; Cockshull, K.; Cave, C. Effect of temperature on the growth and development of tomato fruits. Ann. Bot. 2001, 88, 869–877. [Google Scholar] [CrossRef] [Green Version]
  30. Jia, H.; Wang, Z.; Zhang, J.; Li, W.; Ren, Z.; Jia, Z.; Wang, Q. Effects of biodegradable mulch on soil water and heat conditions, yield and quality of processing tomatoes by drip irrigation. J. Arid Land. 2020, 12, 819–836. [Google Scholar] [CrossRef]
  31. Rosa, R.D.; Paredes, P.; Rodrigues, G.C.; Alves, I.; Fernando, R.M.; Pereira, L.S.; Allen, R.G. Implementing the dual crop coefficient approach in interactive software. 1. Background and computational strategy. Agric. Water Manag. 2012, 103, 8–24. [Google Scholar] [CrossRef]
  32. Bannayan, M.; Hoogenboom, G. Using pattern recognition for estimating cultivar coefficients of a crop simulation model. Field Crop. Res. 2009, 111, 290–302. [Google Scholar] [CrossRef]
  33. Qiu, R.J.; Du, T.S.; Kang, S.Z.; Chen, R.Q.; Wu, L.S. Assessing the SIMDualKc model for estimating evapotranspiration of hot pepper grown in a solar greenhouse in Northwest China. Agr. Syst. 2015, 138, 1–9. [Google Scholar] [CrossRef]
  34. Chen, Y.; Wang, L.; Bai, Y.L.; Lu, Y.L.; Ni, L.; Wang, Y.H.; Xu, M.Z. Quantitative relationship between effective accumulated temperature and plant height & leaf area index of summer maize under different nitrogen, phosphorus and potassium levels. Sci. Agric. Sin. 2021, 54, 4761–4777. (In Chinese) [Google Scholar]
  35. Ben-Noah, I.; Nitsan, I.; Cohen, B.; Kaplan, G.; Friedman, S.P. Soil aeration using air injection in a citrus orchard with shallow groundwater. Agr. Water Manag. 2021, 245, 106664. [Google Scholar] [CrossRef]
  36. Ouyang, Z.; Tian, J.; Yan, X.; Shen, H. Effects of different concentrations of dissolved oxygen or temperatures on the growth, photosynthesis, yield and quality of lettuce. Agr. Water Manag. 2020, 228, 105896. [Google Scholar] [CrossRef]
  37. Wei, C.L.; Zhu, Y.; Zhang, J.Z.; Wang, Z.H. Evaluation of suitable mixture of water and air for processing tomato in drip irrigation in Xinjiang Oasis. Sustainability 2021, 13, 7845. [Google Scholar] [CrossRef]
  38. Li, Y.; Niu, W.Q.; Dyck, M.; Wang, J.W.; Zou, X.Y. Yields and nutritional of greenhouse tomato in response to different soil aeration volume at two depths of subsurface drip irrigation. Sci. Rep. 2016, 6, 39307. [Google Scholar] [CrossRef] [Green Version]
  39. Li, R.; Guo, J.P.; Song, Y.L. Optimizing parameters of a non-linear accumulated temperature model and method to calculate linear accumulated temperature for spring maize in Northeast China. Theor. Appl. Climatol. 2020, 141, 1629–1644. [Google Scholar] [CrossRef]
  40. Jiao, X.; Zhang, H.C.; Zheng, J.Q.; Yin, Y.; Wang, G.S.; Chen, Y.; Yu, J.; Ge, Y.F. Comparative analysis of nonlinear growth curve models for Arabidopsis thaliana rosette leaves. Acta Physiol. Plant. 2018, 40, 114. [Google Scholar] [CrossRef]
  41. Liu, Y.; Su, L.; Wang, Q.; Zhang, J.; Shan, Y.; Deng, M. Comprehensive and quantitative analysis of growth characteristics of winter wheat in China based on growing degree days. Adv. Agron. 2020, 159, 237–273. [Google Scholar]
  42. Hu, L.Y.; Ding, Y.F. Crop Cultivation; Higher Education Press: Beijing, China, 2008; pp. 23–26. (In Chinese) [Google Scholar]
  43. Li, Z.P.; Song, M.D.; Feng, H. Dynamic characteristics of leaf area index and plant height of winter wheat influenced by irrigation and nitrogen coupling and their relationships with yield. Trans. Chin. Soc. Agric. Eng. 2017, 33, 195–202. (In Chinese) [Google Scholar]
  44. Xiao, Z.Y.; Lei, H.J.; Zhang, Z.H.; Zhang, Q.; Jin, C.C.; Sun, K.P. Modelling Growth and Yield of Aerated Pepper by the Logistic Model. J. Irrig. Drain. 2022, 41, 16–23. (In Chinese) [Google Scholar]
  45. Huang, J.X.; Tian, L.Y.; Liang, S.L.; Ma, H.Y.; Becker-Reshef, I.; Huang, Y.B.; Su, W.; Zhang, X.D.; Zhu, D.H.; Wu, W.B. Improving winter wheat yield estimation by assimilation of the leaf area index from Landsat TM and MODIS data into the WOFOST model. Agric. For. Meteorol. 2015, 204, 106–121. [Google Scholar] [CrossRef]
  46. Song, M.D.; Li, Z.P.; Feng, H. Effects of irrigation and nitrogen regimes on dry matter dynamic accumulation and yield of winter wheat. Trans. Chin. Soc. Agric. Eng. 2016, 32, 119–126. (In Chinese) [Google Scholar]
  47. Wang, X.X.; Wang, Q.J.; Fan, J.; Su, L.J.; Shen, X.L. Logistic model analysis of winter wheat growth on China’s Loess Plateau. Can. J. Plant Sci. 2014, 94, 1471–1479. [Google Scholar]
  48. Chen, Y.; Xu, M.Z.; Wang, Y.H.; Bai, Y.L.; Lu, Y.L.; Wang, L. Quantitative Study on Effective Accumulated Temperature and Dry Matter and Nitrogen Accumulation of Summer Maize Under Different Nitrogen Supply Levels. Sci. Agric. Sin. 2022, 55, 2973–2987. (In Chinese) [Google Scholar]
Figure 1. Daily evaporation, daily air temperature (including daily maximum, minimum, and average), and daily relative humidity (RH) during the growing season of greenhouse tomato.
Agronomy 13 00116 g001
Figure 2. Diagram of experimental layout (a) and plant profile (b) of greenhouse tomato.
Agronomy 13 00116 g002
Figure 3. Dynamic changes in tomato plant height (a) and LAI (b) with effective accumulated temperature under different treatments.
Agronomy 13 00116 g003
Figure 4. Observed and simulated values of tomato plant height and LAI of logistic (a,b) and Richards models (c,d) under different treatments.
Agronomy 13 00116 g004
Figure 5. Plant dry matter and yield of tomato under different treatments at different growing stages. (a) is the underground dry weight of tomato, and (b) is the aboveground dry weight and yield of tomato. FBS, FES, and FMS represent the flowering and fruit bearing stage, the fruit expanding stage, and fruit mature stage, respectively. The different letters in the same column indicate significant differences at the level of 0.05.
Agronomy 13 00116 g005
Figure 6. Grey correlation analysis of growth characteristic parameters and yield of tomato under irrigation method treatments. (a) is the growth characteristic parameters of Logistic model, and (b) is the growth characteristic parameters of Richards model.
Agronomy 13 00116 g006
Figure 7. Grey correlation analysis of growth characteristic parameters and yield of tomato under N application rate treatments. N0, N1, and N2 represent 0, 140, and 210 kg ha−1 N application rates, respectively. (a) is the growth characteristic parameters of Logistic model, and (b) is the growth characteristic parameters of Richards model.
Agronomy 13 00116 g007
Figure 8. Correlation coefficients between the logistic (a) and Richards (b) characteristic parameters of model and yield. * and ** identify significant differences at p < 0.05 and p < 0.01, respectively.
Agronomy 13 00116 g008
Table 1. Fitting parameters of logistic and Richards models for plant height and LAI dynamics under different treatments.
IndexTreatmentsParameters of Logistic ModelR2Parameters of Richards Model R2
abkABCD
Plant heightN0C127.37 ± 2.7729.89 ± 2.280.007 ± 0.0010.989 **120.86 ± 2.7411.46 ± 1.700.018 ± 0.0014.54 ± 0.150.997 **
N0A128.00 ± 2.6234.62 ± 2.090.008 ± 0.0010.990 **122.08 ± 1.9810.80 ± 1.160.017 ± 0.0014.08 ± 0.140.997 **
N1C132.11 ± 3.5927.05 ± 2.200.007 ± 0.0010.994 **126.90 ± 1.689.04 ± 1.340.015 ± 0.0013.61 ± 0.120.998 **
N1A139.31 ± 3.2227.21 ± 2.790.007 ± 0.0010.987 **132.14 ± 2.1013.93 ± 1.480.021 ± 0.0015.85 ± 0.170.996 **
N2C135.67 ± 2.2553.49 ± 2.110.009 ± 0.0010.988 **130.35 ± 2.5111.98 ± 1.370.019 ± 0.0014.16 ± 0.160.997 **
N2A139.51 ± 2.4546.11 ± 2.880.009 ± 0.0010.992 **134.67 ± 2.0611.66 ± 1.250.019 ± 0.0014.23 ± 0.160.999 **
Coefficient of variation, CV0.040.300.13 0.040.140.110.17
LAIN0C3.26 ± 0.1878.26 ± 2.010.008 ± 0.0010.998 **3.24 ± 0.114.77 ± 0.150.009 ± 0.0011.14 ± 0.170.998 **
N0A3.41 ± 0.1277.73 ± 2.080.008 ± 0.0010.997 **3.35 ± 0.136.26 ± 0.170.011 ± 0.0011.65 ± 0.090.998 **
N1C3.58 ± 0.19102.44 ± 1.750.009 ± 0.0010.998 **3.55 ± 0.115.80 ± 0.140.010 ± 0.0011.39 ± 0.100.999 **
N1A3.89 ± 0.21146.26 ± 1.560.010 ± 0.0010.996 **3.81 ± 0.109.24 ± 0.150.015 ± 0.0012.40 ± 0.110.998 **
N2C3.68 ± 0.19138.11 ± 2.010.010 ± 0.0010.996 **3.63 ± 0.087.11 ± 0.150.013 ± 0.0011.71 ± 0.130.997 **
N2A4.05 ± 0.21183.77 ± 3.590.011 ± 0.0010.993 **3.94 ± 0.1412.93 ± 0.680.021 ± 0.0013.48 ± 0.120.997 **
Coefficient of variation, CV0.080.350.13 0.070.390.330.44
Note: N0, N1, and N2 indicates N fertilization rate of 0, 140, and 210 kg ha−1; A represents the aerated drip irrigation method, and C represents the conventional drip irrigation methods; ** identify significant differences at p < 0.01.
Table 2. Characteristic parameters describing plant height dynamic process of tomato under different treatments.
TreatmentsCharacteristic Parameters of Logistic ModelCharacteristic Parameters of Richards Model
Ht1Ht2Ht3Hv1Hv2Hx1Hx2Hx3HRmaxHRavg
(°C d)(cm (°C d)−1)(°C d)(cm (°C d)−1)
N0C485.4 ±
12.0 a
297.2 ±
21.2 a
637.5 ±
11.5 ab
0.223 ± 0.01 d0.195 ±
0.01 d
552.6 ±
12.6 ab
441.4 ±
11.7 b
663.9 ±
13.4 ab
0.269 ±
0.01 c
0.166 ±
0.02 c
N0A443.1 ±
14.5 bc
278.4 ±
11.7 a
607.7 ±
21.7 bc
0.256 ± 0.01 b0.225 ±
0.01 b
542.3 ±
10.6 ab
438.7 ±
7.4 b
666.5 ±
10.7 ab
0.274 ±
0.01 c
0.171 ±
0.02 bc
N1C471.1 ±
21.1 ab
283.0 ±
12.3 a
659.2 ±
14.9 a
0.231 ± 0.01 cd0.203 ±
0.01 cd
517.1 ±
10.9 c
392.8 ±
8.0 b
641.4 ±
17.1 b
0.270 ±
0.01 c
0.170 ±
0.02 bc
N1A471.9 ±
20.9 ab
283.8 ±
9.6 a
660.1 ±
18.2 a
0.244 ± 0.01 bc0.214 ±
0.01 bc
579.2 ±
14.5 a
476.0 ±
9.2 a
682.4 ±
14.3 a
0.292 ±
0.01 b
0.177 ±
0.02 abc
N2C442.2 ±
17.1 bc
295.8 ±
16.2 a
588.5 ±
17.2 cd
0.305 ± 0.02 a0.268 ±
0.01 a
555.5 ±
9.4 ab
453.0 ±
13.4 b
658.1 ±
14.5 ab
0.324 ±
0.01 a
0.201 ±
0.02 ab
N2A425.7 ±
16.4 c
279.3 ±
14.1 a
572.0 ±
17.0 d
0.314 ± 0.01 a0.275 ±
0.01 a
537.8 ±
12.1 bc
434.7 ±
12.0 b
640.9 ±
14.8 b
0.331 ±
0.01 a
0.205 ±
0.02 a
N*ns********nsnsns**
I*nsns***nsns**ns
N × Insnsnsnsnsns*****ns
Note: Ht1, the accumulated temperature required for the maximum growth rate; Ht2, the accumulated temperature required to enter the rapid increase period; Ht3, the accumulated temperature required to enter the slow increase period; Hv1, the maximum growth rate; Hv2, the average growth rate during the rapid growth period. Hx1, the accumulated temperature required for the maximum growth rate; Hx2, the accumulated temperature required to enter the rapid increase period; Hx3, the accumulated temperature required to enter the slow increase period; HRmax, the maximum growth rate; HRavg, the average growth rate during the rapid growth period. The different letters indicate significant differences at 0.05. N and I represent the N application rates and irrigation methods, respectively; N × I represents the effect of the interaction between the amount of N application and the irrigation method; N0, N1, and N2 indicate N fertilization rates of 0, 140, and 210 kg ha−1, respectively; A represents the aerated drip irrigation method, and C represents the conventional drip irrigation methods; * and ** identify significant differences at p < 0.05 and p < 0.01, respectively, and ns identifies no significant difference.
Table 3. Characteristic parameters describing LAI process of tomato under different treatments.
TreatmentsCharacteristic Parameters of Logistic ModelCharacteristic Parameters of Richards Model
Lt1Lt2Lt3Lv1Lv2Lx1Lx2Lx3LRmaxLRavg
(°C d)(cm2 cm−2 °C −1 d−1)(°C d)(cm2 cm−2 °C −1 d−1)
N0C545.0 ±
14.0 a
380.4 ±
8.4 a
709.6 ± 10.6 a0.007 ±
0.001 c
0.006 ±
0.001 d
515.4 ±
15.3 c
364.7 ±
13.8 c
666.2 ±
11.0 ab
0.007 ±
0.001 c
0.005 ±
0.001 c
N0A544.2 ±
14.6 a
379.5 ±
14.8 a
708.8 ± 15.3 a0.007 ±
0.001 c
0.006 ±
0.001 d
523.6 ±
13.9 bc
388.4 ±
11.8 bc
658.8 ±
13.0 b
0.008 ±
0.001 c
0.005 ±
0.001 c
N1C514.4 ±
14.9 b
368.0 ±
14.1 ab
660.7 ± 16.3 b0.008 ±
0.001 c
0.007 ±
0.001 cd
547.1 ±
13.4 ab
404.8 ±
12.2 b
689.4 ±
13.5 a
0.008 ±
0.001 c
0.005 ±
0.001 c
N1A498.5 ±
15.0 bc
366.8 ±
12.0 ab
630.2 ± 13.4 c0.010 ±
0.001 b
0.009 ±
0.001 ab
557.6 ±
13.7 a
447.6 ±
8.7 a
667.7 ±
11.7 ab
0.010 ±
0.001 b
0.006 ±
0.001 b
N2C492.8 ±
15.7 bc
361.1 ±
11.0 ab
624.5 ± 12.2 c0.009 ±
0.001 b
0.008 ±
0.001 bc
505.7 ±
15.0 c
390.2 ±
12.5 bc
621.1 ±
13.4 c
0.010 ±
0.001 b
0.006 ±
0.001 b
N2A474.0 ±
13.6 c
354.3 ±
10.8 b
593.7 ± 8.8 d0.011 ±
0.001 a
0.010 ±
0.001 a
556.3 ±
10.3 a
468.5 ±
12.8 a
644.1 ±
9.0 bc
0.012 ±
0.001 a
0.008 ±
0.001 a
N*******************
Insns**********ns****
N × Insnsnsnsns***ns**
Note: Lt1, the accumulated temperature required for the maximum growth rate; Lt2, the accumulated temperature required to enter the rapid increase period; Ht3, the accumulated temperature required to enter the slow increase period; Lv1, the maximum growth rate; Hv2, the average growth rate during the rapid growth period. Lx1, the accumulated temperature required for the maximum growth rate; Lx2, the accumulated temperature required to enter the rapid increase period; Lx3, the accumulated temperature required to enter the slow increase period; LRmax, the maximum growth rate; LRavg, the average growth rate during the rapid growth period. The different letters indicate significant differences at 0.05. N and I represent the N application rates and irrigation methods, respectively; N × I represents the effect of the interaction between the amount of N application and the irrigation method; N0, N1, and N2 indicate N fertilization rates of 0, 140, and 210 kg ha−1, respectively; A represents the aerated drip irrigation method, and C represents the conventional drip irrigation methods; * and ** identify significant differences at p < 0.05 and p < 0.01, respectively, and ns identifies no significant difference.
Table 4. Regression coefficient output.
ModelFactorsR2Unstandardized Coefficients, BStandardized Coefficients, BetaSig.
LogisticConstant0.722198.77 0.004
Lt3−0.195−0.8590.002
RichardsConstant0.70229.02 0.001
LRmax4610.640.8480.000
Disclaimer/Publisher’s Note: The statements, opinions and data contained in all publications are solely those of the individual author(s) and contributor(s) and not of MDPI and/or the editor(s). MDPI and/or the editor(s) disclaim responsibility for any injury to people or property resulting from any ideas, methods, instructions or products referred to in the content.

