Abstract
The appropriate management of crop residues in a rice rotation cropping system (RRCS) can promote carbon storage and contribute to soil health. The objective of this study was to determine and analyze the amount of organic carbon in the soil, the amount of labile carbon in a dissolved state in the soil, and the physicochemical properties of the soil and their relationship with soil organic carbon dynamics under the RRCS in northern Thailand. The RRCS can be divided into the following four categories by pattern: (1) Rice_F (rice (Oryza sativa) followed by a fallow period); (2) Rice_S (rice followed by shallots (Allium cepa L.); (3) Rice_Mixed crop (rice followed by tobacco (Nicotiana tabacum), vegetables, or maize (Zea mays)); and (4) Rice_P (rice followed by potatoes (Solanum tuberosum)). These patterns can be classified according to the dissolved organic carbon (DOC), the availability of nutrients from fertilization, and clay contents. In our study, the Rice-F and Rice-S patterns led to higher soil organic carbon (SOC) and dissolved organic carbon (DOC) in the soil, but when the Rice-P pattern was followed, the soil had a lower clay content, lower available phosphorus (Avail P), the lowest DOC, and high contents of calcium (Ca2+) and magnesium (Mg2+). This study also revealed that on the basis of relationships, clay content, Avail P, and DOC were the most important factors for the formation of SOC, while Ca2+ and Mg2+ were the subordinate factors for the decreased formation of SOC and carbon storage when the RRCS was followed. In addition, low SOC/clay when the Rice-P pattern was followed could reflect carbon saturation, while the percentages of DOC/SOC could indicate the decomposition and formation of SOC.
1. Introduction
A good knowledge of what helps improve soil health and increase carbon (C) storage in agricultural soil is important so as not to compromise soil quality and help mitigate climate change [1]. Soil represents the largest carbon pool, with the soil carbon pool being almost five times the atmospheric carbon pool [2]. Soil carbon is linked to soil health in terms of soil performance in an agronomic capacity and could help sustain and support the growth of crops and animals and also improve the environment [3] when sustainable soil management practices are followed that render multifaceted benefits [4,5].
Rice (Oryza sativa) is one of the primary food crops of the human population across the world, especially in the Asian continent. Rice planting has, for many years, been practiced in many places, such as India, China, and other South Asian and Southeast Asian countries. However, these countries have been blamed as the source of glasshouse gas emissions [6]. Paddy soil stores carbon and is considered to be one of the highest sources of carbon in an agro-eco pattern when compared with other resources because it leads to conditions suitable for the accumulation of soil organic matter, including the fact that the soil is submerged in water, leading to anaerobic conditions [7]. Carbon storage results from agronomic practices, soil management, and crop residue. The estimated rice straw production is over 20 million tons/year in Thailand [8]. Cheewaphongphan and Garivait [9] estimated that of the farmers using rice residue, around 27% use it as stubble and around 48% use it as straw, showing that almost all farmers in northern Thailand benefit from rice residue. Rice residue management data from northern Thailand showed that some rice residues are either used as livestock feed or burned and left in the field, depending on the residue type and region [9]. When rice residues are left on the field and incorporated into the soil, they can promote soil carbon sequestration because of their retention [10]. Straw management in the rice rotational cropping system may, therefore, increase SOC and carbon sequestration and enable interactive soil organic carbon dynamics involving SOC formation and decomposition. These processes have the potential to encourage SOC storage [11].
The rules of clay- and silt-size particles (<50 μm) for SOC adsorption and reduced decomposition of organic substances [12] express the protection capacity resulting from organo–mineral interactions. The physical protection associated with this fraction will identify the amount of carbon that will be stored for decades to centuries [13]. However, the organic matter attached to soil mineral surfaces is dynamic and sensitive to topology and soil wetting [13]. This fraction consists of single molecules and small fragments of organic material that have leached directly from the plant material and then been transformed by the soil biota into dissolved organic carbon (DOC). Mineral-associated organic matter (MAOM) is also a source of nutrients for plants and microbes [14]. The present size of the MAOC pool depends on the balance between the sorption and desorption of charged compounds [15,16], with the MAOC resistance perhaps affecting the cropland SOC storage.
As a positive priming effect (PE), the labile carbon in the soil enhances soil organic matter (SOM) mineralization [17]. Increased nutrient availability from chemical fertilizers is also found to affect the growth and metabolic activity of soil microorganisms and thus may alter SOC mineralization and the intensity and direction of the PE [18]. The straw, when returned to the soil, even at the minimum level, for example, when no tilling is performed, could increase labile carbon pools to microbial biomass carbon and extractable carbon [19] and influence the formation and decomposition of SOC. This is mainly due to the decreased decomposition of soil organic matter and increased proportion of the active soil organic substrate because of the crop residue [19]. Moreover, the high amount of nutrients might change the availability of labile carbon [20].
Dead organic matter refers to available organic matter, such as soluble organic matter, that is in the form of easily decomposable fractions produced from decomposed SOM [21]. Available organic matter refers to most of the easily available organic matter consumed by bacteria and the resulting metabolites that enter the soil [22]. DOC consists of fulvic acids and low-molecular-weight acids [23] and is composed of peptides, carbohydrates, unsaturated aliphatics, reduced polyphenolics, and polycyclic aromatic substances found in anoxic/flooding soils [24]. These constituents characterize DOC as soluble and easily decomposable fractions that occur in all the RRCS patterns in this study and could serve as the source of energy for soil microbes. DOM is defined as fractions that are water extractable and smaller than 0.45 μm in size containing less than 2% of the total SOM [25].
The labile carbon input of the crop residue might increase the microbial activity and the respired CO2 as a high-residue input [26]. The rate of crop residue application in the soil would be the main factor for SOM formation and decomposition because the soil microbial mechanism uses the labile and recalcitrant compounds from crop residue over time [26]. High-labile-carbon input might suppress SOM decomposition [17]. We need to consider supplying nutrients to the soil to increase microbial activities [17] and adding sufficient nutrients (as in fertilization) to the soil, along with the rate of loading crop residue, because of the consequences for yield production, soil fertility and quality, and soil carbon sequestration. Moreover, most of the labile carbon from the crop residue is another main factor in crop residue decomposition [26].
In this study, we hypothesized the RRCS with different fallowed crops, different residual effects from the input of crop straw coupled, and chemical fertilizers in different amounts, along with RRCS types, with different stoichiometries between the labile carbon and nutrients. Alternative labile carbon fractions in terms of clay content and nutrients occur under various soil physicochemical properties, which affect the formation and decomposition of SOC and then carbon sequestration of paddy soil under different fallowed crops. Therefore, in this study, we aimed to estimate SOC storage and content, the labile carbon fraction as DOC, and some crucial soil physicochemical properties and to investigate the priority factors that would relate to SOC alternation under the RRCS followed in northern Thailand.
2. Materials and Methods
2.1. Study Area
The study area was an intensive paddy site rotated with other crop soils in Mae Fak, San Sai District, Chiang Mai province (19°2′30″–19°5′30″ N, 98°57′30″–98°59′0″ E) (Figure 1), in northern Thailand. The area topography indicates that it is mostly flatland within 12 farmer plots, with soil classified as Typic Tropaquepts.
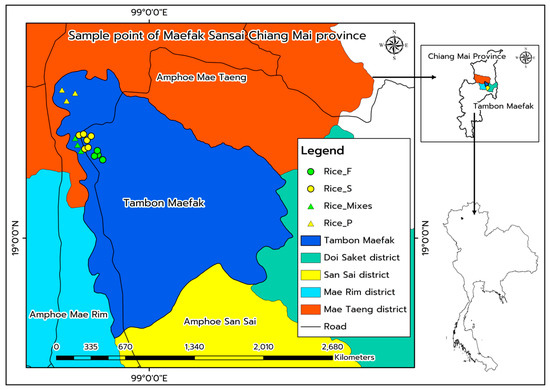
Figure 1.
Study sites of soils planted with rice in various rotational patterns: A case study of Mae Fak subdistrict, Sansai district, Chiang Mai province, northern Thailand.
2.2. Established Experimental Design
At the start of this study, we conducted a survey and held a community meeting with the villagers to collect through interviews information on villagers and identify farmers who practice the four types of rice rotation cropping system (RRCS) patterns (Table 1). In each pattern, rice of the same type is cultivated in a season but there are differences in the patterns during off-season (Table 1). In this study, similar rice plantation patterns were followed during on-season, while different patterns characterized the off-season (Table 1). These patterns were the most common practice at the study site and were practiced continuously over the long term. Interviewed residents confirmed the data on the RRCS, especially data on the identity of the owner and the actual management of the practices, including those related to soil sampling. Additional information, for example, about soil management and fertilization, was collected from interviews of the owners. This process also showed rice being rotated with other crops in northern Thailand, which means that the land being used for rice planting in the rainy season, named “paddy soil,” was the same plot that was used as aerobic soil to plant other crops in the off-season (dry season). The planting season for Thai rice starts in August, and harvesting takes place around November (wet-season rice, July–December). After that, there may be some planting, depending on the aim of the farmer. Crops, such as shallots, potatoes, and tobacco, are usually planted during the dry season (January to June). At other sites, there are no planting activities, and the areas are left idle, just waiting for the next rice-planting season. In this area, every year, rice is planted in a rotation system with other crops in four patterns (Table 1 and Figure 1): (1) only rice (Oryza sativa) is planted, and the field is left idle afterward; (2) rice planting is followed by the planting of shallots (Allium cepa L.); (3) rice planting is followed by the planting of potatoes (Solanum tuberosum); and (4) rice planting is followed by the planting of various other crops, such as tobacco (Nicotiana tabacum), vegetables, and maize (Zea mays). This study aims to compare the type of rotated crops (e.g., crop species and management) during the off-season (Table 1 and Table 2 and Figure 2) that would affect the dynamics of soil carbon. In the off-season (when other rotated crops were planted), the straw residues were retained on the surface of the soil but only for a brief period. Then, the soil was plowed for the newly rotated crop and the rice straw was incorporated into the soil.

Table 1.
Crop residue management, age of land use, and tillage intensity of the RRCS.
Table 2.
Summary intensity score of soil management under various rice rotation cropping systems.
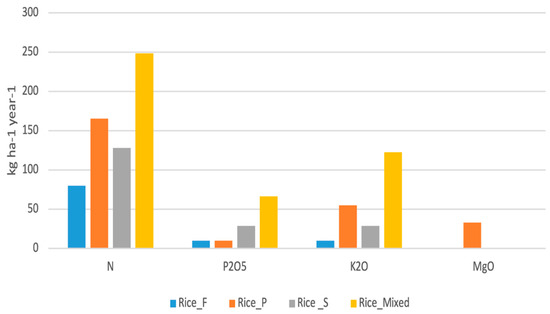
Figure 2.
Synthetic fertilizers applied annually for each RRCS. Note: The information is obtained from observations and surveys of each rice-growing area.
2.3. Soil Sample Collection
Soil samples of the RRCS were collected in November 2015, primarily from Mae Fak, Sansai district, Chiang Mai province. The soil samples were randomized and sampled from each RRCS and each identified farmer for a total of 12 farmers (plots). Each pattern contained three replicates (3 farmers), with nine subsamples (n = 9) of each replicate. Samples from the individual pseudo-replications were collected at depths of 0–30 cm. After collection, the soil samples were air-dried for seven days in the control room and then mixed and sieved through 0.5 mm and 2.0 mm sieves.
2.4. Soil Analysis
The SOC was subjected to additional heat after Cr2O7 solution was added for reacting with the carbon in the soil sample. Then, the sample was left for 24 h for titration with FeSO4 [27]. Next, water-soluble carbon (WSC), along with deionized water, was added to the soil. Then, the soil was placed in a shaker at 200 rounds per minute for half an hour. Afterward, centrifugation was carried out for 20 min, with all the supernatant samples suctioned through a 0.45 µm membrane filter with vacuum suction [28]. Hot-water-soluble carbon (HWSC) was extracted from the WSC, with the same soil sample being repeatedly added to another 30 mL of deionized water and left in hot water (80 °C) for 16 h. This individual soil suspension then underwent sedimentation (20 min) on a centrifuge and was filtered with a 0.45 µm membrane. Both clear solutions were reacted with Cr2O7 solution to determine total carbon. The dissolved organic carbon (DOC) was calculated using a combination of WSC and HWSC. With permanganate oxidized carbon (POXC), the air-dried soil was passed through a 0.5 mm sieve with 20 mL of 0.02 M KMnO4 [29]. The available P was analyzed by Bray II solution and Murphy reagent [30]. The cation exchange capacity (CEC) was determined; exchangeable K, Ca, and Mg were extracted using 1 N NH4OAc solution (pH 7) and identified by atomic adsorption [31], the pH was determined by the 1:1 water method, and the soil bulk density (Bd) was determined by the soil core method. Clay, silt, and sand were analyzed for soil particle distribution by 5% Calgon using the dispersion and hydrometer method [32].
2.5. Data Management and Statistical Analysis
2.5.1. Calculating Organic Carbon Storage
The carbon storage of all RRCS types were calculated by:
where the carbon concentration in the soil = the amount of concentration of carbon in the soil at the depth levels of 0–30 cm and the bulk density (g cm−3) = the bulk density of the soil. The results of each soil depth are summed up to obtain the amount of organic carbon stored at a soil depth of 0–30 cm. The DOC storage was calculated by Equation 1, but the difference was the concentration of DOC in mg kg−1.
C storage by soil (t h −1) = carbon conc. in soil (%) × Bulk density (g cm−3) × Soil depth (m) × 10
2.5.2. The SOC/Clay Ratio
Prout et al. [33] came up with the following equation to obtain the soil quality index:
SOC/Clay ratio = SOC (g kg−1) ÷ Clay (g kg−1)
2.5.3. Statical Analysis
One-way ANOVA using SPSS version 28.24 was used for the statistical analysis of rice rotation systems. The relationship between soil carbon content and carbon storage with labile carbon fractions, plant nutrient contents, and crucial soil properties was synthesized by principal component analysis (PCA) using R program version 4.2.1 (http://www.R-project.org (accessed on 30 September 2022) and supported with relation analysis between soil data by SPSS.
2.5.4. Intensity of Data Fertilization
The intensity value of soil management was considered using information from the interviews and observations related to soil management of the cropping system for each crop. The score intensity depends on the frequency, the intensity, the quantity, etc. For example, when the crop residue was not removed but burned, the score was high.
3. Results
3.1. Effects of the RRCS on Carbon and Various Organic Carbon Fraction Concentrations
The rice rotation patterns were found to affect the SOC and labile carbon levels as Rice_F (6.66 g kg−1), Rice_S (7.30 g kg−1), and Rice_Mixed (6.42 g kg−1) had higher levels of SOC than Rice_P (3.34 g kg−1) (p < 0.05) and showed consistent amounts of permanganate oxidizable carbon (POXC), as shown by Rice_F (1.36 g kg−1) and Rice_S (1.26 g kg−1), which were higher than that in Rice_Mixed (0.81 g kg−1) and Rice_P (0.85 g kg−1) (p < 0.05). The labile carbon fraction levels in terms of DOC (88.42 mg kg−1) and HWSC (72.08 mg kg−1) levels were the lowest in Rice_P (Figure 3a–c). The highest DOC, HWSC, and WSC levels were 143.33, 99.58, and 43.75 mg kg−1, respectively, and were found in Rice_F (p < 0.05; Figure 3c). SOC, POXC, and DOC levels also tended to be consistent and were higher in clay soil, with the RRCS having a lower intensity score.
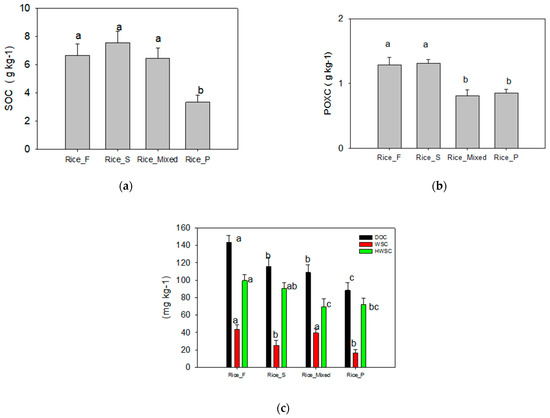
Figure 3.
The influence of the RRCSs on the contents of SOC (a); POXC (b); and labile carbon fraction in terms of DOC, HWSC, and WSC (c). Note: The bars with the standard error of the mean and labeled with different lowercase letters indicate a difference between rice rotation patterns (p < 0.05). In the rice cultivation system, different crops are used each year. Rice_ F = rice followed by a fallow period, i.e., no plantation; Rice_S = rice followed by shallots; Rice_Mixed = rice followed by tobacco, maize, and vegetables; Rice_P = rice followed by potatoes; SOC = soil organic carbon; POXC = permanganate oxidizable carbon; DOC = dissolved organic carbon; WSC = water-soluble carbon; and HWSC = hot-water-soluble carbon.
3.2. Effects of the RRCS on Chemical Properties
Soil properties may be related to the decomposition and stabilization of carbon in the soil. These results could also be attributed to the evaluated sensitivity of soil health indicators. This study showed that because of the RRCS, Avail P (Figure 4a) was the highest in Rice_F (27.50 mg kg−1), while Exch. Mg2+ (0.78 cmol kg−1) was the lowest in Rice_F but the highest (1.24 cmol kg−1) in Rice_P (Figure 4b). Rice_Mixed showed the highest levels of Exch. K+ (1.70 cmol kg−1) and Exch. Ca2+ (3.26 cmol kg−1), while Rice_P also showed a high amount of Exch. Ca2+ (3.03 cmol kg−1) (Figure 4b). The CEC was the highest in Rice_S and the lowest in Rice_P (Figure 4c). Soil pH was the lowest in Rice_F (5.55) (Figure 4d), but, interestingly, Rice_P showed the highest amount of exchangeable Mg2+, which was in contrast to Rice_F. These plant nutrients, especially Exch. Mg2+ (which was the highest in Rice_P), were a result of soil management via fertilization and liming, as garnered from farmer interviews.
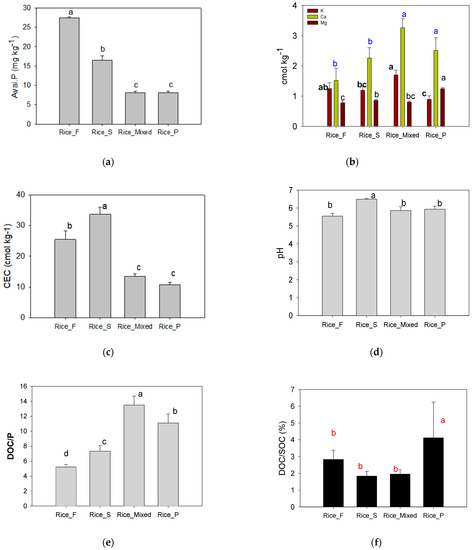
Figure 4.
Various chemical properties of the RRCSs: Avail P (a); exchangeable K+, Ca2+, and Mg2+ (b); CEC (c); pH (d); DOC/P ratio (e); and DOC/SOC (f). Note: The bars with the standard error of the mean and labeled with different lowercase letters indicate a difference between rice rotation patterns (p < 0.05). In the rice cultivation system, different crops are used each year. Rice_ F = rice followed by a fallow period, i.e., no plantation; Rice_S = rice followed by shallots; Rice_Mixed = rice followed by tobacco, maize, and vegetables; and Rice_P = rice followed by potatoes.
This study showed the highest DOC/Avail P ratio (13.67) in Rice_Mixed but the lowest in Rice_F (5.10) (p < 0.05), while the ratios in Rice_S and Rice_P were 7.32 and 11.09, respectively (p < 0.05; Figure 4e). The percentage of DOC from SOC was found to be the highest in Rice_P (4.12%) and the lowest in Rice_S (1.84%; Figure 4f).
3.3. Effect of the RRCS on Soil Physical Property: Clay + Silt Contents, Soil Bulk Density (Bd), and SOC/Clay Ratio
The percentages of silt + clay were 57.42% and 64.17% in Rice_S and Rice_F, respectively, and 37.58% and 42.58% in Rice_Mixed and Rice_ P, respectively (p < 0.05). The silt and clay contents absorbed the labile carbon (Figure 5a). The RRCS resulted in a Bd between 1.06 and 1.13 g cm−3 (p > 0.05), and Rice_P had the lowest Bd (1.06 g cm−3) (Figure 5b). Rice_Mixed showed the highest SOC/clay ratio (0.0336), and Rice_P showed the lowest SOC/clay ratio (0.0136) (p < 0.05). In Rice_S and Rice_F, the ratios were 0.0263 and 0.0192, respectively (Figure 6a). The estimated amounts of DOC stored in Rice_F, Rice_S, Rice_Mixed, and Rice_P were 480.04, 403.28, 414.08, and 309.72 kg h−1, respectively. The amount of DOC stored combined with WSC and HWSC was the highest in Rice_F (480.03 kg ha−1) and the lowest in Rice_P (309.72 kg ha−1) (Figure 6b).
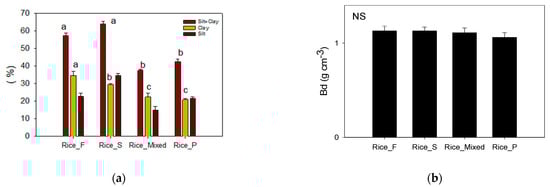
Figure 5.
Physical properties of the RRCSs: Particle distribution in terms of clay, silt, and sand (a); bulk density of soil (b). Note: The bars with the standard error of the mean and labeled with different lowercase letters indicate a difference between rice rotation patterns (p < 0.05). In the rice cultivation system, different crops are used each year. Rice_ F = rice followed by a fallow period, i.e., no plantation; Rice_S = rice followed by shallots; Rice_Mixed = rice followed by tobacco, maize, and vegetables; and Rice_P = rice followed by potato.
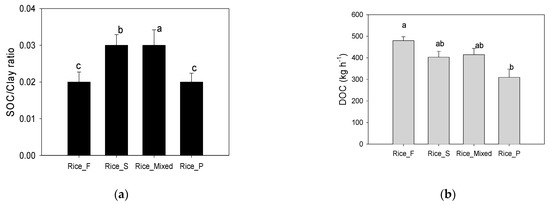
Figure 6.
SOC/clay ratio (a) and DOC stored (b) as a result of the RRCS. Note: The bars with the standard error of the mean and labeled with different lowercase letters indicate a difference between rice rotation patterns (p < 0.05). In the rice cultivation system, different crops are used each year. Rice_ F = rice followed by a fallow period, i.e., no plantation; Rice_S = rice followed by shallots; Rice_Mixed = rice followed by tobacco, maize, and vegetables; and Rice_P = rice followed by potato.
3.4. Effects of the RRCS on Organic Carbon Storage
Compared to other patterns, Rice_S (24.904 t ha−1) led to the highest carbon storage, confirming that the amount of SOC was the highest in Rice_S. Meanwhile, Rice_P showed the lowest carbon storage (9.067 t ha−1) and the carbon amounts stored in Rice_F and Rice_Mixed were 20.253 and 21.194 t ha−1, respectively (p < 0.05; Figure 7).
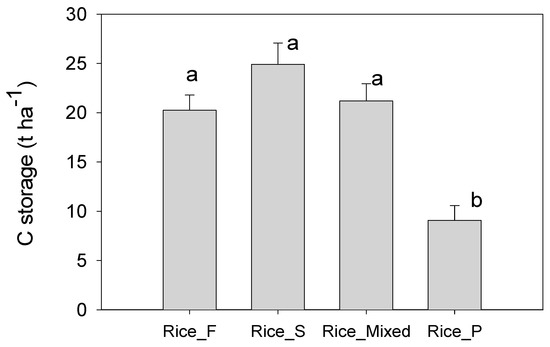
Figure 7.
Carbon storage under an individual RRCS at a depth of 0–30 cm. Note: The difference in lowercase letters means that the treatments differ significantly (p < 0.05) with the standard error above the bar.
3.5. Relations of SOC and Labile Carbon and Soil Carbon Storage under the RRCS
Pearson’s Correlation between SOC Storage and Physicochemical Properties
The SOC with labile carbon fractions was found to be highly positively correlated with carbon storage. In some physicochemical properties, clay and CEC showed good agreement with carbon storage. Meanwhile, a positive relationship existed between SOC and the labile carbon; between DOC and POXC; and between pH and P, K, clay, silt, and CEC. In contrast, Ca and Mg showed a strong negative relationship with carbon storage and labile carbon, clay, and silt but a positive relationship with CEC and pH. The amount of silt + clay served as a factor in SOC and labile carbon storage, and there was a linear relationship between the two factors in the Rice_F and Rice_S systems because the organic matter in the soil also led to an increase in clay and silt contents, leading to changes in the soil properties under the various rotated rice-planting systems (Figure 8).
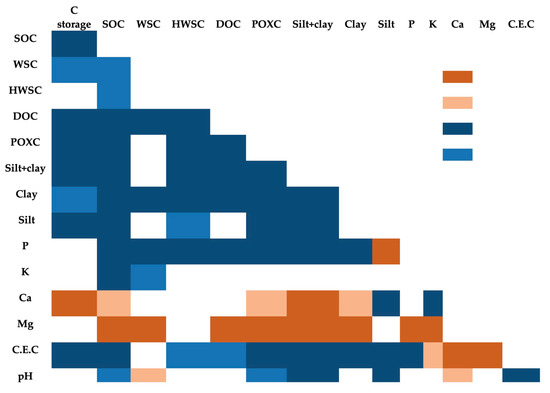
Figure 8.
The correlation coefficient between carbon storage and SOC and other soil parameters under the RRCS. Note: Dark blue means a highly positive relation (p ≤ 0.01–0.00), light blue means a low positive relationship (p ≤ 0.01–0.04), dark brown means a high negative relationship (p ≤ 0.01–0.00), light brown means a low negative relation (p ≤ 0.01–0.04), and blank means no significant relationship.
3.6. Principal Component Analysis for Relations within Individual RRCSs
The results of the PCA showed that in all the RRCSs, clay, clay + silt, CEC, Avail P, DOC, pH, Bd, affected soil carbon, and SOC were influenced by one another. A variance of 34.90% was the main driving factor behind carbon storage and SOC in the arable soil when paddy was rotated with another plant of the tropical humid zone. Meanwhile, Ca2+ and Mg2+ would be the minor driving factor, explained by a variance of 13.40% (Figure 9).
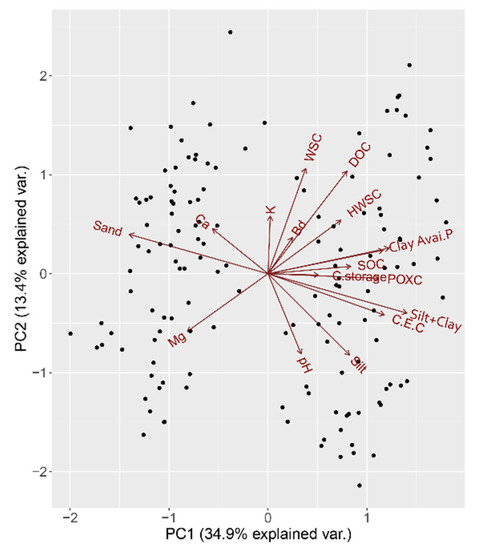
Figure 9.
Principal component analysis (PCA) explaining labile carbon and physicochemical soil properties that influence SOC content and carbon storage resulting from rice rotation with different cropping patterns in northern Thailand.
4. Discussion
4.1. SOC Adsorption by Soil as a Mineral-Associated Organic Carbon (MAOC) on the Formation and Decomposition of SOM
In this study, the RRCS was shown to alter DOC, SOC, and carbon storage depending on the soil properties and soil management. The SOC, POXC, and DOC trends indicated that the higher they were in clayey soil, the lower were the intensity scores of the RRCS. Extracellular enzymes from soil microbes attracted dead organic matter, where SOM was the insoluble and recalcitrant fraction, which was about 1.84–4.42 DOC percent of SOC. In this study, the mineral fraction in clay and silt was affected by the amount of DOC, via adsorption and desorption [34], and the oxides of aluminum (Al) and iron (Fe) since oxides and hydroxides are important DOM adsorbents [35], especially in tropical soils [36]. Mineral-associated organic carbon (MAOC) is the most stable long-term SOC stock, with turnover times ranging from years to millennia [37]. The sorption processes of organic carbon as DOC on mineral surfaces contribute to the accumulation and stabilization of SOC [38]. The sorption of DOC to mineral surfaces is strong and only partially reversible, with only a small portion extractable into fresh water, salt water, or organic solvents [39]. DOC is adsorbed to soil clay surfaces and thus controlled [40]. In the finer soil texture, there was a predominance of clays with a high specific surface area (SSA), and a higher cation exchange capacity (CEC) is efficient in inhibiting SOM decomposition [20]. The bonding between organic carbon and mineral surface as a CEC would be absorbed by ligand exchange [41], and this was the primary chemical protection against MAOC persistence. The adsorbed DOC was completely desorbed by kaolinite clay, while only 28% to 35% of the adsorbed DOC was desorbed by Fe oxide. The desorbed DOC came from the native (dead) SOM that was leached and then moved down to subsoils [42]. This study evidences (Figure 8 and Figure 9) positive correlations between carbon storage, SOC, clay content, CEC, and DOC within the RRCS. These interactions would be reflected in the adsorption of DOC and, consequently, reduced SOC decomposition and SOC restoration.
In terms of the two types of soil textures in this study, the first group (Rice_ F and Rice_S) had higher clay and silt content, which contributed to MAOM formation. In contrast, the second group (Rice_ Mixed and Rice_ P) showed a lower clay content. The DOC consists of soluble plant- and microbial-derived compounds and is an important precursor of MAOC through chemical bonding to the soil mineral matrix [15,42]. This study showed a positive relationship between the DOC and clay + silt as the adsorbent. The less clay and silt as the absorbent in Rice_P and Rice_Mixed and the more clay and silt in Rice_S and Rice_F led to differences in the formation of the MAOC further along, with the different inputs of DOC from the RRCS. However, the MAOC pool depends on abiotic factors, such as the loss of MAOC due to DOC leaching and MAOC destabilization by soil acidification. An abiotic decrease in the microbial growth rate and efficiency could reduce the formation of microbial-derived MAOC in Rice_P, where pH was low and the clay and silt contents were the lowest [42]. In this study, therefore, clay was a driving factor in the formation and persistence of the SOC and SOM by the MAOC through chemical bonding to the mineral soil matrix [42]. Moreover, the MAOC showed significant differences in cropland SOC storage and was regulated by long-term differences in carbon input [43].
4.2. Soil and Crop Residue Influence on the DOC in Soils
The original DOC leached from the crop residue/litter that would become the source is adsorbed by clay mineral [44]. Consequently, the soil organic matter (SOM) formation resulting from the new MAOC serves as the source due to the direct association of the added DOC with the mineral surface and with a lower extent of microbial decomposition [45,46]. Arable soils might increase the MAOC with the help of the labile carbon fraction released from the crop residue, especially from the lower soil SOC, which could behave more efficiently than saturated carbon soil in storing fresh organic substances [45,46]. Due to the incomplete decomposition of the returned crop straws within one season, the decomposition rate increases in the early stage [46], with approximately 40% of the returned rice straw remaining at the end of that season [46]. The quantitative rice residue in this study was affected by the SOC pools and SOC dynamics, especially under aerobic (inserted crop) and anaerobic soil (rice). Generally, soils have more fine fractions of silt and clay, which are more efficient in loading carbon to form MAOM [47]. The input of labile carbon and the quantity of newly formed MAOC control the rate of microbe growth and the stabilization of microbial necromass [48].
Effect of crop residue input: These crop residues, which become the source of soluble fractions such as DOC, are leached from residues during cover and mixing and then sorbed to silt- and clay-size minerals toward the formation of mineral-associated organic matter (MAOM) in bulk soils [49]. The 1% addition of litter to soil increases the DOC over an eight-day anaerobic incubation by about 3- and 15-folds, respectively, for straw and alfalfa [50]. The large increase in CO2 emission is the result of the degradation of added rice straw, and this straw, and not other soil organic matter, becomes a primary source of expired CO2 [51]. The retention and return of either too much or too little straw does not affect soil organic carbon accumulation [46]. However, a proper straw return rate could significantly improve the SOC and microbial biomass carbon, water-soluble organic carbon, and other labile organic carbon contents [52]. This study was able to summarize the intensity score of the retention and return of the residues (Table 1 and Table 2). The trend of residue input was the highest in Rice_S and the lowest in Rice_P. Evidence showed that compared to other straw return rates, a 50% straw return rate (about 4500 kg ha−1 rice straw and 3000 kg ha−1 wheat straw) led to significantly higher SOC, soluble organic carbon, POXC (as easily oxidizable organic carbon or EOC), and carbon from microbial biomass (MSB-C) in 0–21 cm deep soil [52].
In this study, we wanted to explain the differences in the input residues based on the RRCS; that is, the differences in terms of the physical nature (structural differences and the solubility of plant organs) and the effectiveness of SOM formation [49]. The rate of input and the quality of crop residue, such as rice straw, led to the highest SOC and DOC in Rice_F and Rice_S and the lowest SOC and DOC in Rice_P.
The results from the selected RRCS can explain the relation of crop residue management to fertilizer and soil properties for soil health and the mitigation of climate change. Even though the residue biomass was not directly measured on the basis of the RRCS in this study, crop residues are the main factor in driving the dynamics of SOC in the soil. Rice straw is the notable farm residue available in South and Southeast Asia, where rice is widely grown. When rice cultivation is rotated with other crop cultivation, SOC and carbon storage may be altered because of the labile carbons driving the SOC dynamics. The type of rotated crop inserted between annual rice plantations impacts soil property, SOC, and carbon storage. The total biomass input is the source of the carbon input. Moreover, the type of management (mulching and incorporation of crop residue such as rice and rotated crops) (Table 1 and Table 2) is a crucial factor that affects the SOC and carbon storage dynamics.
Effect of soil water content: The DOC content can increase due to desorption from the soil particles as the soil water content increases [53]. Moreover, as per [36], previously dry soils have lower decomposition rates and accumulated microbial products than soils after a rainfall after a dry period. In addition, rainfall after a dry spell may release a higher concentration of DOC into the soil solution than rainfall in a normal rainy period [54]. The higher-soil-water-content soil shows a small increase in the DOC and hot-water-extracted organic carbon contents, and an influence on soil microbial carbon (MBC) content, as compared to a lower-soil-water-content soil [55]. These findings support the findings of this study that dry–wet cycling of the RRCS alters the DOC content, explaining the increased DOC amount, an amount of potentially water-soluble organic matter that occurs in the adsorbed phase [56]. The variation in the DOC content with water content is caused by the balance between the adsorption and desorption of the DOC on the soil mineral surface [54], especially in the paddy soil under organic fertilization [57]. Tran et al. [51] showed that the decomposition of rice straw residues was rapid in the anoxic paddy soil condition compared to that in the aerobic crop rotation condition. The reason for these results was that the Rice_F and Rice_S systems showed the highest labile carbon fractions and SOC because of the high input of crop residue in the upper soil and Rice_P showed the lowest SOC and DOC compared to the other three patterns. In Rice_P, there is an increased positive PE, where the mulch would have a higher necromass and would form MAOC. However, the low pH may lower SMB activity. DOC in Rice_P was found to be the lowest and might have contributed to less MAOC and SOC in this soil. The long-term differences in carbon inputs with physical properties such as clay content [58] explain that cropland SOC storage might be affected by adding MAOC, which contributes to MAOM formation. In Rice_F, high clay mineral was a factor in MAOM formation and contributed to high SOC and carbon storage. In contrast, Rice_P and Rice_Mixed showed a low clay mineral content, along with low formation of MAOC, which would be the reason for the low SOC and carbon storage. This study, therefore, indicated that the content of DOC in the RRCS in northern Thailand was another driving factor in the formation of and increase in the SOC and SOM through the MAOC.
4.3. Ability of Nutrients from the Fertilization of Labile Carbon Fractions to Form and Decompose SOC
4.3.1. Fertilization Practice
Nitrogen Fertilization
Better crop residue management improves crop yield by increasing soil nutrient availability through fertilization [59]. Consequently, the impact of soil properties and nutrient cycling could occur after more than 10 years [60]. This might explain that in this study, in the RRCS Rice_Mixed, the highest amount of synthetic fertilizer, at 249 kg h−1 y−1 of chemical fertilization, was applied, which might have reduced the decomposition of the crop residues that had been applied after 10 years and reduced labile carbon and native SOC (Table 2) [44], affecting N addition on labile carbon fraction; microbial biomass carbon; total microbial, bacterial, and fungal abundance; the C:N ratio; soil moisture; soil texture; and soil pH [61]. N addition might suppress the decomposition of crop residue and thus lead to SOC accumulation. On the contrary, the mineralization of added labile carbon (as glucose) was lowered by N (P) fertilization, and it is suggested that increased nutrient availability, and not necessarily the amount of CO2 respired [62], could increase the incorporation of organic carbon into microorganism cells, with N (P) fertilization suppressing SOC decomposition. The amount of mineral nutrients was high, and this might have reduced enzyme activity, particularly of enzymes that work on recalcitrant soil organic carbon [63], and the carbon in the MAOC fraction may have declined when N was added [44]. The added fertilizer caused an increased amount of nitrogen, and this might have suppressed the enzyme activity in cellulase [64] and then increased labile carbon.
Phosphorus Fertilization
In this study, it was shown that the lowest amount of DOC in Rice_P soil corresponded with increased phosphorus fertilizer applications (Table 2). The increased availability of phosphorus (P) from fertilization affected the labile carbon fractions via the aromaticity and complexity of molecular DOC components [65]. The phosphate adsorbed to mineral surfaces could then contribute to the dissolved organic carbon being released [66]. The desorption of this labile organic carbon then stimulated the activity of soil microorganisms [67,68] because it is an energy source for soil microbes [69]. The DOC of this paddy soil was reduced because of leaching, which could have resulted from DOC competing with phosphate for adsorption sites [57]. Scott et al. [69] reported that high added P led to higher leached DOC, especially involving N inputs as urea. Therefore, SOC decreased when the P was high, consistent with the result of the P-rich fertilizer in Rice_ Mixed in this study.
Agricultural soil that has a high amount of P, together with microbial organisms (as the fast-growing group), still has a high requirement of P, thus increasing the decomposition of SOM. Meanwhile, the high amount of P reduces the activity of the microbial group, even though there is an increase in the use of labile carbon [63]. This is because P plays a role in modulating soil carbon decomposition since P is an enzyme belonging to an extracellular group (such as phosphatase). These reasons could explain why the addition of a high amount of P leads to reduced SOC and carbon storage in the soil, corresponding to the DOC/Avail P ratio of 13.67 in Rice_Mixed and 5.10 (the lowest) in Rice_F, and might be related to the formation and decomposition of SOC. The evidence from the PCA and the resulting relationship (Figure 8 and Figure 9) shows the amount of P in the soil (additional P) in response to a decreasing DOC level. Increased P adsorption and possible DOC expulsion into the soil solution could later be used by SMB, especially in Rice_Mixed and Rice_P. However, increased P availability coupled with organic carbon is incorporated into the cells of microorganisms but is not necessarily visible in the amount of CO2 respired [70]. In this study, a positive relationship was shown between P and DOC. Therefore, the Avail P modulated the formation and decomposition of SOC and carbon storage.
Cation Additions
This study showed that Mg2+ and Ca2+ are strongly negatively correlated with carbon storage, SOC, and DOC. Polyvalent cations induce DOM adsorption by precipitation [20] and polyvalent cation bonding [71]. Singh et al. [20] reported that DOM adsorption is higher with an increasing concentration of Ca2+ than Na+ and complexation of organic ligands by free Ca2+ and their mineral forms [35]. Meanwhile, the relationship of SOC storage with K is positive, as confirmed by [72], with high Mg2+ in Rice_P leading to the increased formation of MAOC.
4.3.2. Relationship between DOC, Availability of Nutrients, and the Priming Effect
High-labile-carbon input was found to suppress SOM decomposition [17], with the results showing the addition of high amounts of glucose, at more than 300% carbon of MBC, because MBC is deficient in N. In this study, Rice_S and Rice_F were higher in labile carbon fraction as DOC and responded to higher SOC and carbon storage. The reason could be related to the priming effect (PE), which results from the addition of a high amount of straw and the method of adding the straw and covering of the bed as part of soil preparation in shallot cultivation (Table 2). Consequently, the high amount of DOC released from rice straw and residue management may inhibit native SOM decomposition (Table 2). From this hypothesis, the high-labile-carbon input rate suggests a decrease in SOM decomposition [17,73]. Zhu et al. [18] explained how SOM decomposition by the relations between labile C:N:P stoichiometry had supplied the nutrients and how labile carbon likely satisfied the stoichiometric requirements of the microbial community. In this study, Rice_P showed that the low labile carbon with N and P additions could lead to a positive PE due to the high abundance of Gram-positive bacteria and N- and P-hydrolases and might have accelerated SOM decomposition for carbon and/or nutrient mining [18]. The low DOC conditions triggered microbial enzyme production and might induce SOC decomposition [18,73]. Soil microorganisms might preferentially use labile carbon as the DOC weight increases with added NP, especially under low DOC conditions, and could lead to the decomposition of SOC in Rice_P. The relationship between the amount of labile C:N:P stoichiometry could be the driving force for SOC decomposition, in agreement with the hypothesis of this study that pointed to the changes in the amount of DOC that would affect SOC decomposition in agricultural soil.
4.4. Considering the SOC/Clay Ratio and Soil Carbon Saturation
Prout et al. [33] proposed the SOC/clay ratio as a simple method to explain soil health, assessed changes in SOC over time, and found that the SOC/clay ratio declined with sampling times of the arable soil but improved in the case of many of the woodland soil samples. Soil carbon saturation could occur under a specific surface area of minerals (such as silt and clay) and then reach the maximum protected DOC with a similar maximum adsorption capacity within a finite specific surface area (SSA) [58]. This study was able to present the relationship between clay and silt, the percentage of DOC/SOC, and the ratio of DOC/P and found that the lower-clay-content soil of the RRCS showed the highest SOC/clay ratio in Rice_Mixed but the lowest in Rice_P. In Rice_Mixed, a lower DOC/SOC percentage was shown, together with a higher SOC/clay percentage (Figure 5a and Figure 6a), thus confirming high DOC storage and SOC and DOC content, which meant that the soil had not reached carbon saturation. In comparison, Rice_F had a lower SOC/clay ratio with high clay and silt contents (Figure 5 and Figure 6a), with low values being shown by the percentage of DOC/SOC and DOC/P, in response to high SOC and carbon storage, even though new labile carbon was further added and retained with clay and silt. The protection capacity of MAOC and soil could be better explained by long-term SOC sequestration in the MAOC and with effective management [74]. In contrast, in Rice_S, which had a lower SOC/clay ratio and a high content of clay + silt, the SOC/clay ratio was related to the MAOC because the soil mineral surface area could absorb the new SOM as labile carbon and recalcitrant organic carbon. Rice_F and Rice_ P had a lower SOC/clay ratio (Figure 5a and Figure 6a). Even though Rice_F had newly added labile carbon, which was retained with the help of clay and silt, MAOC might no longer be protected and the overall SOC stability would decrease [75]. After reaching such saturation and if more MAOC would be produced due to any reason (e.g., microbial debris replenishment), this additional MAOC would be subjected to rapid decomposition rather than accumulating [76].
Moreover, more newly added DOC and other labile carbon fractions, such as necromass, root deposits, plant residue, and newly formed SOC, could be found in Rice_Mixed and Rice_P and could be more susceptible to decomposition by soil microorganisms for energy. Wilhelm et al. [76] reported that the newly formed SOC was more susceptible to microbial degradation than being associated with pre-occupied OM because OM–OM bonds are weaker than OM–mineral bonds [76]. These findings are attributed to the importance of mineral surfaces for stabilizing SOM inputs [77] and carbon saturation of soil, with the SOC/clay ratio indicating soil health [33]. In Rice_F and Rice_S, higher SOC and DOC resulted because of added DOC and other labile carbon fractions, such as necromass, root deposits, plant residue, and newly formed SOC. These findings support the hypothesis that DOC was adsorbed by the higher amounts of clay and silt and more SOC was formed later. Therefore, added labile carbon as DOC related to the SOC/clay index could be explored further and could be consistent with [33], particularly in the tropical soil dominated by MAOC, as regulated by long-term differences in carbon input. This study showed the influence of only the amount of labile carbon and physicochemical properties of the soil on the SOC content and carbon storage of rice under different cropping patterns. The effects of other labile carbon fractions, such as particulate organic matter, drying and wetting, and soil anaerobic conditions, on carbon formation, decomposition, and saturation in rice crop rotation need further investigation (Figure 10).
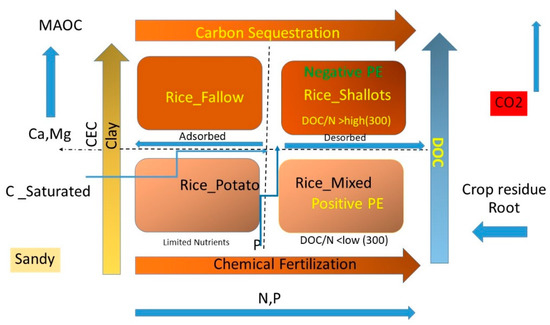
Figure 10.
The relationship between the driving factors and effects on SOC storage of the RRCS.
All RRCSs had land usage at ages of about 18–49 years under various rotated plants, which expressed the potential of Rice_ F and Rice_S patterns to store SOC content, labile carbon, and SOC. Both Rice_ F and Rice_S had received synthetic fertilizer applications and straw returns. In contrast, in Rice_P, the highest amounts of fertilizers had been applied, but with fewer straw returns, leading to the lowest amount of SOC and labile carbon and, consequently, the lowest carbon storage. Meanwhile, abiotic factors, such as clay content, were crucial for controlling the dynamics of SOC (Figure 10) . A strategy involving crop residue management combined with synthetic chemical fertilizer should be intensively considered in relation to crop yield and carbon sequestration, the goal being to meet the appropriate practices that could lead to carbon storage and improve and sustain soil health. This would be a worthy investment in improving practical knowledge, especially on soil health and the mitigation of climate change.
5. Conclusions
In this study, SOC and DOC were found to be higher in Rice_F and Rice_S, which had received low levels of fertilization, in contrast to higher SOC and carbon in Rice_Mixed and Rice_P. The main factors that controlled SOC and carbon storage were clay content, Avail P, and DOC. Meanwhile, Ca2+ and Mg2+ could be considered minor driving factors. The SOC/clay ratio might explain the carbon saturation and adsorption capacity of the DOC of cropland in tropical soil. The enhancement of carbon storage could be limited by a decreased clay content. The DOC/SOC ratio may also influence SOC formation and decomposition.
Author Contributions
Conceptualization, S.A., C.C. and T.G.; methodology, S.A.; software, C.C.; validation, S.A., C.C. and T.G.; formal analysis, C.C.; investigation, S.A.; resources, S.A.; data curation, S.A. and T.G.; writing—original draft preparation, S.A. and C.C.; writing—review and editing, S.A. and C.C.; visualization, C.C.; supervision, S.A.; project administration, S.A. All authors have read and agreed to the published version of the manuscript.
Funding
This research received no external funding.
Informed Consent Statement
Not applicable.
Data Availability Statement
Not applicable.
Conflicts of Interest
The authors declare no conflict of interest.
References
- Poulton, P.; Johnston, J.; Macdonald, A.; White, R.; Powlson, D. Major limitations to achieving “4 per 1000” increases in soil organic carbon stock in temperate regions: Evidence from long-term experiments at Rothamsted Research, United Kingdom. Glob. Chang. Biol. 2018, 24, 2563–2584. [Google Scholar] [CrossRef] [PubMed]
- Jansson, J.K.; Hofmockel, K. Soil microbiomes and climate change. Nat. Rev. Microbiol. 2020, 18, 35–46. [Google Scholar] [CrossRef]
- Lal, R.; Delgado, J.A.; Groffman, P.M.; Millar, N.; Dell, C.; Rotz, A. Management to mitigate and adapt to climate change. J. Soil Water Conserv. 2011, 66, 276–285. [Google Scholar] [CrossRef]
- FAO. The State of the World’s Land and Water Resources for Food and Agriculture: Systems at Breaking Point; FAO: Rome, Italy, 2018; Available online: http://www.FAO.org (accessed on 12 June 2022).
- Hu, X.; Gu, H.; Liu, J.; Wei, D.; Zhu, P.; Cui, X.A.; Zhou, B.; Chen, X.; Jin, J.; Liu, X.; et al. Metagenomics reveals divergent functional profiles of soil carbon and nitrogen cycling under long-term addition of chemical and organic fertilizers in the black soil region. Geoderma 2022, 418, 115846. [Google Scholar] [CrossRef]
- Meena, S.K.; Rakshit, A.; Singh, H.B.; Meena, V.S. Effect of nitrogen levels and seed bio-priming on root infection, growth and yield attributes of wheat in varied soil type. Biocatal. Agric. Biotechnol. 2017, 12, 172–178. [Google Scholar] [CrossRef]
- Rajkishore, S.K.; Natarajan, S.K.; Manikandan, A.; Vignesh, N.; Balusamy, A. Carbon sequestration in rice soils. A review. Ecoscan 2015, 9, 427–433. Available online: https://www.researchgate.net/publication/281935281 (accessed on 6 September 2022).
- Gadde, B.; Bonnet, S.; Menke, C.; Garivai, S. Air pollutant emissions from rice straw open field burning in India, Thailand and the Philippines. Environ. Pollut. 2009, 157, 1554–1558. [Google Scholar] [CrossRef]
- Cheewaphongphan, P.; Garivait, S. Bottom up approach to estimate air pollution of rice residue open burning in Thailand. Asia-Pac. J. Atmos. Sci. 2013, 49, 139–149. [Google Scholar] [CrossRef]
- Aumtong, S.; Magid, J.; Bruun, S.; Neergaard, A. Relating soil carbon fractions to land use in sloping uplands in northern Thailand. Agric. Ecosyst. Environ. 2009, 131, 229–239. [Google Scholar] [CrossRef]
- Fujisaki, K.; Chapuis-Lardy, L.; Albrecht, A.; Razafimbelo, T.; Chotte, J.-L.; Chevallier, T. Data synthesis of carbon distribution in particle size fractions of tropical soils: Implications for soil carbon storage potential in croplands. Geoderma 2018, 313, 41–51. [Google Scholar] [CrossRef]
- Poeplau, C.; Zopf, D.; Greiner, B.; Geerts, R.; Korvaar, H.; Thumm, U.; Don, A.; Heidkamp, A.; Flessa, H. Why does mineral fertilization increase soil carbon stocks in temperate grasslands? Agric. Ecosyst. Environ. 2018, 265, 144–155. [Google Scholar] [CrossRef]
- Kleber, M.; Bourg, I.C.; Coward, E.K.; Hansel, C.M.; Myneni, S.C.B.; Nunan, N. Dynamic interactions at the mineral–organic matter interface. Nat. Rev. Earth Environ. 2021, 2, 402–421. [Google Scholar] [CrossRef]
- Córdova, S.C.; Olk, D.C.; Dietzel, R.N.; Mueller, K.E.; Archontouilis, S.V.; Castellano, M.J. Plant litter quality affects the accumulation rate, composition, and stability of mineral-associated soil organic matter. Soil Biol. Biochem. 2018, 125, 115–124. [Google Scholar] [CrossRef]
- Sanderman, J.; Baldock, J.A.; Amundson, R. Dissolved organic carbon chemistry and dynamics in contrasting forest and grassland soils. Biogeochemistry 2008, 89, 181–198. [Google Scholar] [CrossRef]
- Wu, L.; Xiao, Q.; Wang, J.; Huang, Y.; Wu, D.; Liu, J.; Wang, B.; Zhang, H.; Xu, M.; Zhang, W. Liming decreases the emission and temperature sensitivity of N2O following labile carbon addition. Geoderma 2022, 425, 116032. [Google Scholar] [CrossRef]
- Cui, J.; Zhu, Z.; Xu, X.; Liu, S.; Jones, D.L.; Kuzyakov, Y.; Shibistova, O.; Wu, J.; Ge, T. Carbon and nitrogen recycling from microbial necromass to cope with C:N stoichiometric imbalance by priming. Soil Biol. Biochem. 2020, 142, 107720. [Google Scholar] [CrossRef]
- Zhu, D.; Cong, R.; Ren, T.; Lu, Z.; Lu, J.; Li, X. Straw incorporation improved the adsorption of potassium by increasing the soil humic acid in macroaggregates. J. Environ. Manag. 2022, 310, 114665. [Google Scholar] [CrossRef]
- Zhang, Z.; Wang, J.; Huang, W.; Chen, J.; Wu, F.; Jia, Y.; Han, Y.; Wang, G.; Feng, L.; Li, X.; et al. Cover crops and N fertilization affect soil ammonia volatilization and N2O emission by regulating the soil labile carbon and nitrogen fractions. Agric. Ecosyst. Environ. 2022, 340, 108188. [Google Scholar] [CrossRef]
- Singh, M.; Sarkar, B.; Biswas, B.; Churchman, J.; Bolan, N.S. Adsorption-desorption behavior of dissolved organic carbon by soil clay fractions of varying mineralogy. Geoderma 2016, 280, 47–56. [Google Scholar] [CrossRef]
- Kuzyakov, Y. Priming effects: Interactions between living and dead organic matter. Soil Biol. Biochem. 2010, 42, 1363–1371. [Google Scholar] [CrossRef]
- Moore-Kucera, J.; Dick, R.P. PLFA Profiling of Microbial Community Structure and Seasonal Shifts in Soils of a Douglas-fir Chronosequence. Microb. Ecol. 2008, 55, 500–511. [Google Scholar] [CrossRef]
- Aitkenhead-Peterson, J.A.; Alexander, J.E.; Clair, T.A. Dissolved organic carbon and dissolved organic nitrogen export from forested watersheds in Nova Scotia: Identifying controlling factors. Glob. Biogeochem. Cycles 2005, 19. [Google Scholar] [CrossRef]
- Li, Z.; Wang, D.; Sui, P.; Long, P.; Yan, L.; Wang, X.; Yan, P.; Shen, Y.; Dai, H.; Yang, X.; et al. Effects of different agricultural organic wastes on soil GHG emissions: During a 4-year field measurement in the North China Plain. Waste Manag. 2018, 81, 202–210. [Google Scholar] [CrossRef]
- von Lützow, M.; Kögel-Knabner, I.; Ekschmitt, K.; Flessa, H.; Guggenberger, G.; Matzner, E.; Marschner, B. SOM fractionation methods: Relevance to functional pools and to stabilization mechanisms. Soil Biol. Biochem. 2007, 39, 2183–2207. [Google Scholar] [CrossRef]
- Fang, Y.; Singh, B.P.; Collins, D.; Li, B.; Zhu, J.; Tavakkoli, E. Nutrient supply enhanced wheat residue-carbon mineralization, microbial growth, and microbial carbon-use efficiency when residues were supplied at high rate in contrasting soils. Soil Biol. Biochem. 2018, 126, 168–178. [Google Scholar] [CrossRef]
- Nelson, D.W.; Sommer, L.E. Total Carbon, Organic Carbon and Organic Matter. In ASA-SSSA, Madison, Volume Methods of Soil Analysis, Part 2. Chemical and Microbiological Properties, 2nd ed.; American Society of Agronomy: Madison, WI, USA, 1983; pp. 579–595. [Google Scholar]
- Ghani, A.; Dexter, M.; Perrott, K.W. Hot-water extractable carbon in soils: A sensitive measurement for determining impacts of fertilisation, grazing and cultivation. Soil Biol. Biochem. 2003, 35, 1231–1243. [Google Scholar] [CrossRef]
- Weil, R.; Islam, K.R.; Stine, M.A.; Gruver, J.; Samson-Liebig, S. Estimate active carbon for soil quality assessment: A simplified method for laboratory and field use. Am. J. Altern. Agric. 2003, 18, 2–17. [Google Scholar]
- Murphy, J.; Riley, J.P. A modified single solution method for determination of phosphate in Natural water. Anal. Chim. Acta 1962, 27, 31–36. [Google Scholar] [CrossRef]
- Peech, M. Determination of exchangeable cation and exchange capacity of soil: Rapid micro methods ultilizing centrifuge and spectrophotometer. Soil Sci. 1945, 59, 25–28. [Google Scholar] [CrossRef]
- Gee, G.W.; Or, D. Particle-Size Analysis in Methods of Soil Analysis Part 4 Physical Methods; Dane, J.H., Topp, G.C., Eds.; Number 5 in the Soil Science Society of America Book Series; Soil Science Society of America, Inc.: Madison, WI, USA, 2002; pp. 255–293. [Google Scholar]
- Prout, J.M.; Shepherd, K.D.; McGrath, S.P.; Kirk, G.J.D.; Haefele, S.M. What is a good level of soil organic matter? An index based on organic carbon to clay ratio. Eur. J. Soil Sci. 2021, 72, 2493–2503. [Google Scholar] [CrossRef]
- Saidy, A.; Smernik, R.J.; Baldock, J.A.; Kaiser, K.; Sanderman, J.; Macdonald, L.M.; Macdonald, L.M. Effects of clay mineralogy and hydrous iron oxides on labile organic carbon stabilisation. Geoderma 2012, 173–174, 10–104. [Google Scholar] [CrossRef]
- Kaiser, K.; Guggenberger, G.; Zech, W. Sorption of DOM and DOM fractions to forest soils. Geoderma 1996, 74, 281–303. [Google Scholar] [CrossRef]
- Gmach, M.R.; Kaiser, K.; Cherubin, M.R.; Cerri, C.E.P.; Lisboa, I.P.; Vasconcelos, A.L.S.; Siqueira-Neto, M. Soil dissolved organic carbon responses to sugarcane straw removal. Soil Use Manag. 2021, 37, 126–137. [Google Scholar] [CrossRef]
- Lavallee, J.M.; Soong, J.L.; Cotrufo, M.F. Conceptualizing soil organic matter into particulate and mineral-associated forms to address global change in the 21st century. Glob. Chang. Biol. 2020, 26, 261–273. [Google Scholar] [CrossRef]
- Feng, X.; Simpson, M.J. Temperature responses of individual soil organic matter components. J. Geophys. Res. Biogeosci. 2008, 113. [Google Scholar] [CrossRef]
- Kaiser, K.; Guggenberger, G. The role of DOM sorption to mineral surfaces in the preservation of organic matter in soils. Org. Geochem. 2000, 31, 711–725. [Google Scholar] [CrossRef]
- Ussiri, D.A.N.; Johnson, C.E. Sorption of Organic Carbon Fractions by Spodosol Mineral Horizons. Soil Sci. Soc. Am. J. 2004, 68, 253–262. [Google Scholar] [CrossRef]
- Schneider, M.P.W.; Scheel, T.; Mikutta, R.; van Hees, P.; Kaiser, K.; Kalbitz, K. Sorptive stabilization of organic matter 85 by amorphous Al hydroxide. Geochim. Et Cosmochim. Acta 2010, 74, 19–1606. [Google Scholar] [CrossRef]
- Cotrufo, M.F.; Wallenstein, M.D.; Boot, C.M.; Denef, K.; Paul, E. The Microbial Efficiency-Matrix Stabilization (MEMS) framework integrates plant litter decomposition with soil organic matter stabilization: Do labile plant inputs form stable soil organic matter? Glob. Chang. Biol. 2013, 19, 988–995. [Google Scholar] [CrossRef]
- Swails, E.; Hergoualc’h, K.; Deng, J.; Frolking, S.; Novita, N. How can process-based modeling improve peat CO2 and N2O emission factors for oil palm plantations? Sci. Total Environ. 2022, 839, 156153. [Google Scholar] [CrossRef]
- Chen, M.; Chang, L.; Zhang, J.; Guo, F.; Vymazal, J.; He, Q.; Chen, Y. Global nitrogen input on wetland ecosystem: The driving mechanism of soil labile carbon and nitrogen on greenhouse gas emissions. Environ. Sci. Ecotechnol. 2020, 4, 100063. [Google Scholar] [CrossRef] [PubMed]
- Liu, S.P.; Chen, W.L.; Nie, X.T.; Zhang, H.C.; Dai, Q.G.; Huo, Z.Y.; Xu, K. Effect of embedding depth on decomposi-tion course of crop residues in rice-wheat system. J. Plant Nutr. Fertil. 2007, 13, 1049–1053. [Google Scholar]
- Jin, Z.; Shah, T.; Zhang, L.; Liu, H.; Peng, S.; Nie, L. Effect of straw returning on soil organic carbon in rice–wheat rotation system: A review. Food Energy Secur. 2020, 9, e200. [Google Scholar] [CrossRef]
- Matus, F.J. Fine silt and clay content is the main factor defining maximal C and N accumulations in soils: A meta-analysis. Sci. Rep. 2021, 11, 6438. [Google Scholar] [CrossRef] [PubMed]
- Zhou, J.; Wen, Y.; Shi, L.; Marshall, M.R.; Kuzyakov, Y.; Blagodatskaya, E.; Zang, H. Strong priming of soil organic matter induced by frequent input of labile carbon. Soil Biol. Biochem. 2021, 152, 108069. [Google Scholar] [CrossRef]
- Cotrufo, M.F.; Haddix, M.L.; Kroeger, M.E.; Stewart, C.E. The role of plant input physical-chemical properties, and microbial and soil chemical diversity on the formation of particulate and mineral-associated organic matter. Soil Biol. Biochem. 2022, 168, 108648. [Google Scholar] [CrossRef]
- de Catanzaro, J.B.; Beauchamp, E.G. The effect of some carbon substrates on denitrification rates and carbon utilization in soil. Biol. Fertil. Soils 1985, 1, 183–187. [Google Scholar] [CrossRef]
- Dung, T.V.; Thu, T.A.; Long, V.V.; Da, C.T. Decomposition of rice straw residues and the emission of CO2, CH4 under paddy rice and crop rotation in the Vietnamese Mekong Delta region—A microcosm study. Plant Soil Environ. 2022, 68, 29–35. [Google Scholar]
- Zhu, L.; Hu, N.; Zhang, Z.; Xu, J.; Tao, B.; Meng, Y. Short-term responses of soil organic carbon and carbon pool management index to different annual straw return rates in a rice–wheat cropping system. Catena 2015, 135, 283–289. [Google Scholar] [CrossRef]
- Ponizovsky, A.A.; Metzler, D.M.; Allen, H.E.; Ackerman, A.J. The effect of moisture content on the release of organic matter and copper to soil solutions. Geoderma 2006, 135, 204–215. [Google Scholar] [CrossRef]
- Kalbitz, K.; Solinger, S.; Park, J.H.; Michalzik, B.; Matzner, E. Controls on the dynamics of dissolved organic matter in soils. Soil Sci. 2000, 165, 207–304. [Google Scholar] [CrossRef]
- Li, Z.; Zhao, B.; Zhang, J. Effects of Maize Residue Quality and Soil Water Content on Soil Labile Organic Carbon Fractions and Microbial Properties. Pedosphere 2016, 26, 829–838. [Google Scholar] [CrossRef]
- Christ, M.J.; David, M.B. Temperature and moisture effects on the production of dissolved organic carbon in a Spodosol. Soil Biol. Biochem. 1996, 28, 1191–1199. [Google Scholar] [CrossRef]
- Aumtong, S.; Chotamonsak, C.; Somchit, B. The increased carbon storage by changes in adsorption capacity with a decrease of phosphorus availability in the organic paddy soil Ilmu Pertanian. Agric. Sci. 2022, 7, 91–98. [Google Scholar] [CrossRef]
- Wu, T.; Ost, A.D.; Audinot, J.-N.; Wiesmeier, M.; Wirtz, T.; Buegger, F.; Häusler, W.; Höschen, C.; Mueller, C.W. Association of fresh low-molecular-weight organic compounds with clay-sized mineral fraction in soils of different organic carbon loading. Geoderma 2022, 409, 115657. [Google Scholar] [CrossRef]
- Haque, M.M.; Biswas, J.C.; Salahin, M.; Alam, K.; Akhter, S.; Akhtar, S.; Maniruzzaman, M.; Hossain, M.S. Tillage systems influence on greenhouse gas emission factor and global warming potential under rice-mustard-rice cropping system. Arch. Agron. Soil Sci. 2022, 68, 1–16. [Google Scholar] [CrossRef]
- Yadvinder, S.; Bijay, S.; Ladha, J.K.; Khind, C.S.; Khera, T.S.; Bueno, C.S. Effects of Residue Decomposition on Productivity and Soil Fertility in Rice–Wheat Rotation. Soil Sci. Soc. Am. J. 2004, 68, 854–864. [Google Scholar] [CrossRef]
- Chen, J.; Xiao, W.; Zheng, C.; Zhu, B. Nitrogen addition has contrasting effects on particulate and mineral-associated soil organic carbon in a subtropical forest. Soil Biol. Biochem. 2020, 142, 107708. [Google Scholar] [CrossRef]
- Fontaine, S.; Mariotti, A.; Abbadie, L. The priming effect of organic matter: A question of microbial competition. Soil Biol. Biochem. 2003, 35, 837–843. [Google Scholar] [CrossRef]
- Marklein, A.R.; Houlton, B.Z. Nitrogen inputs accelerate phosphorus cycling rates across a wide variety of terrestrial ecosystems. New Phytol. 2012, 193, 696–704. [Google Scholar] [CrossRef]
- Zhang, Z.; Wang, X.; Liang, L.; Huang, E.; Tao, X. Phosphorus fertilization alters complexity of paddy soil dissolved organic. J. Integr. Agric. 2020, 19, 2301–2312. [Google Scholar] [CrossRef]
- Spohn, M.; Schleuss, P.M. Addition of inorganic phosphorus to soil leads to desorption of organic compounds and thus to increased soil respiration. Soil Biol. Biochem. 2019, 130, 220–226. [Google Scholar] [CrossRef]
- Spohn, M. Phosphorus and carbon in soil particle size fractions: A synthesis. Biogeochemistry 2020, 147, 225–242. [Google Scholar] [CrossRef]
- Uchida, Y.; Nishimura, S.; Akiyama, H. The relationship of water-soluble carbon and hot-water-soluble carbon with soil respiration in agricultural fields. Agric. Ecosyst. Environ. 2012, 156, 22–116. [Google Scholar] [CrossRef]
- Fisk, M.; Santangelo, S.; Minick, K. Carbon mineralization is promoted by phosphorus and reduced by nitrogen addition in the organic horizon of northern hardwood forests. Soil Biol. Biochem. 2015, 81, 212–218. [Google Scholar] [CrossRef]
- Scott, J.T.; Lambie, S.M.; Stevenson, B.A.; Schipper, L.A.; Parfitt, R.L.; McGill, A.C. Carbon and nitrogen leaching under high and low phosphate fertility pasture with increasing nitrogen inputs. Agric. Ecosyst. Environ. 2015, 202, 139–147. [Google Scholar] [CrossRef]
- Mganga, K.Z.; Kuzyakov, Y. Land use and fertilisation affect priming in tropical andosols. Eur. J. Soil Biol. 2018, 87, 9–16. [Google Scholar] [CrossRef]
- Jilling, A.; Keiluweit, M.; Contosta, A.R.; Frey, S.; Schimel, J.; Schnecker, J.; Smith, R.G.; Tiemann, L.; Grandy, A.S. Minerals in the rhizosphere: Overlooked mediators of soil nitrogen availability to plants and microbes. Biogeochemistry 2018, 139, 103–122. [Google Scholar] [CrossRef]
- McDonald, S.; Reid, N.; Waters, C.; Smith, R.; Hunter, J. Improving ground cover and landscape function in a semi-arid rangeland through alternative grazing management. Agric. Ecosyst. Environ. 2018, 268, 8–14. [Google Scholar] [CrossRef]
- Blagodatskaya, E.; Kuzyakov, Y. Mechanisms of real and apparent priming effects and their dependence on soil microbial biomass and community structure: Critical review. Biol. Fertil. Soils 2008, 45, 115–131. [Google Scholar] [CrossRef]
- Guo, X.; Wang, H.; Yu, Q.; Ahmad, N.; Li, J.; Wang, R.; Wang, X. Subsoiling and plowing rotation increase soil C and N storage and crop yield on a semiarid Loess Plateau. Soil Tillage Res. 2022, 221, 105413. [Google Scholar] [CrossRef]
- Feng, W.; Xu, M.; Fan, M.; Malhi, S.S.; Schoenau, J.J.; Six, J.; Plante, A.F. Testing for soil carbon saturation behavior in agricultural soils receiving long-term manure amendments. Can. J. Soil Sci. 2014, 94, 94–281. [Google Scholar] [CrossRef]
- Wilhelm, R.C.; Lynch, L.; Webster, T.M.; Schweizer, S.; Inagaki, T.M.; Tfaily, M.M.; Kukkadapu, R.; Hoeschen, C.; Buckley, D.H.; Lehmann, J. Susceptibility of new soil organic carbon to mineralization during dry-wet cycling in soils from contrasting ends of a precipitation gradient. Soil Biol. Biochem. 2022, 169, 108681. [Google Scholar] [CrossRef]
- Kleber, M.; Sollins, P.; Sutton, R. A conceptual model of organo-mineral interactions in soils: Self-assembly of organic molecular fragments into zonal structures on mineral surfaces. Biogeochemistry 2007, 85, 9–24. [Google Scholar] [CrossRef]


Disclaimer/Publisher’s Note: The statements, opinions and data contained in all publications are solely those of the individual author(s) and contributor(s) and not of MDPI and/or the editor(s). MDPI and/or the editor(s) disclaim responsibility for any injury to people or property resulting from any ideas, methods, instructions or products referred to in the content. |
© 2023 by the authors. Licensee MDPI, Basel, Switzerland. This article is an open access article distributed under the terms and conditions of the Creative Commons Attribution (CC BY) license (https://creativecommons.org/licenses/by/4.0/).